Cities with the Fewest Births per 1,000 Women Over the Age of 35 in Louisiana
RELATED REPORTS & OPTIONS
Lowest Birth Rate | Women 35+
Louisiana
Compare Cities
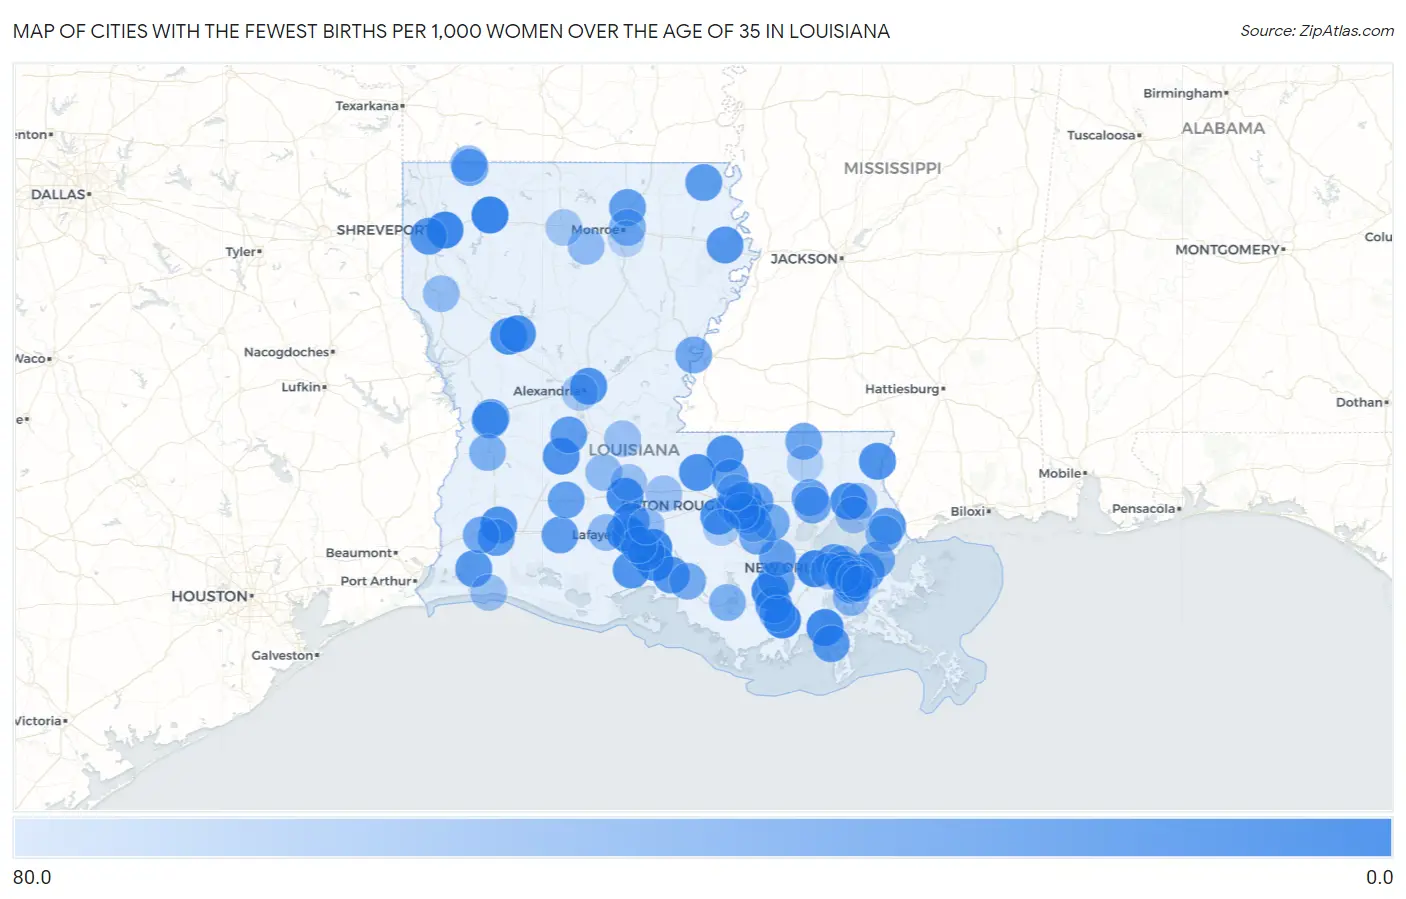
Map of Cities with the Fewest Births per 1,000 Women Over the Age of 35 in Louisiana
80.0
0.0
Cities with the Fewest Births per 1,000 Women Over the Age of 35 in Louisiana
| City | Births / 1,000 Women | vs State | vs National | |
| 1. | Houma | 1.0 | 27.0(-26.0)#1 | 32.0(-31.0)#2 |
| 2. | Minden | 1.0 | 27.0(-26.0)#2 | 32.0(-31.0)#7 |
| 3. | Hahnville | 2.0 | 27.0(-25.0)#3 | 32.0(-30.0)#28 |
| 4. | Bossier City | 3.0 | 27.0(-24.0)#4 | 32.0(-29.0)#29 |
| 5. | Thibodaux | 3.0 | 27.0(-24.0)#5 | 32.0(-29.0)#46 |
| 6. | Marrero | 4.0 | 27.0(-23.0)#6 | 32.0(-28.0)#82 |
| 7. | St Martinville | 4.0 | 27.0(-23.0)#7 | 32.0(-28.0)#109 |
| 8. | New Iberia | 5.0 | 27.0(-22.0)#8 | 32.0(-27.0)#124 |
| 9. | Cut Off | 6.0 | 27.0(-21.0)#9 | 32.0(-26.0)#229 |
| 10. | Opelousas | 9.0 | 27.0(-18.0)#10 | 32.0(-23.0)#453 |
| 11. | Covington | 10.0 | 27.0(-17.0)#11 | 32.0(-22.0)#582 |
| 12. | Shenandoah | 11.0 | 27.0(-16.0)#12 | 32.0(-21.0)#680 |
| 13. | Natchitoches | 11.0 | 27.0(-16.0)#13 | 32.0(-21.0)#682 |
| 14. | Addis | 11.0 | 27.0(-16.0)#14 | 32.0(-21.0)#740 |
| 15. | Estelle | 12.0 | 27.0(-15.0)#15 | 32.0(-20.0)#839 |
| 16. | Scott | 12.0 | 27.0(-15.0)#16 | 32.0(-20.0)#864 |
| 17. | Jackson | 12.0 | 27.0(-15.0)#17 | 32.0(-20.0)#883 |
| 18. | New Roads | 12.0 | 27.0(-15.0)#18 | 32.0(-20.0)#884 |
| 19. | Vienna Bend | 12.0 | 27.0(-15.0)#19 | 32.0(-20.0)#900 |
| 20. | Pineville | 13.0 | 27.0(-14.0)#20 | 32.0(-19.0)#966 |
| 21. | Bogalusa | 13.0 | 27.0(-14.0)#21 | 32.0(-19.0)#980 |
| 22. | Moss Bluff | 14.0 | 27.0(-13.0)#22 | 32.0(-18.0)#1,102 |
| 23. | Oakdale | 14.0 | 27.0(-13.0)#23 | 32.0(-18.0)#1,127 |
| 24. | Erath | 15.0 | 27.0(-12.0)#24 | 32.0(-17.0)#1,285 |
| 25. | Shreveport | 17.0 | 27.0(-10.00)#25 | 32.0(-15.0)#1,460 |
| 26. | Tallulah | 17.0 | 27.0(-10.00)#26 | 32.0(-15.0)#1,555 |
| 27. | Chalmette | 18.0 | 27.0(-9.00)#27 | 32.0(-14.0)#1,665 |
| 28. | Gray | 18.0 | 27.0(-9.00)#28 | 32.0(-14.0)#1,726 |
| 29. | Jeanerette | 18.0 | 27.0(-9.00)#29 | 32.0(-14.0)#1,729 |
| 30. | Hackberry | 18.0 | 27.0(-9.00)#30 | 32.0(-14.0)#1,786 |
| 31. | Golden Meadow | 19.0 | 27.0(-8.00)#31 | 32.0(-13.0)#1,934 |
| 32. | Slidell | 20.0 | 27.0(-7.00)#32 | 32.0(-12.0)#2,002 |
| 33. | Lake Charles | 21.0 | 27.0(-6.00)#33 | 32.0(-11.0)#2,141 |
| 34. | Oak Grove | 21.0 | 27.0(-6.00)#34 | 32.0(-11.0)#2,281 |
| 35. | Kenner | 22.0 | 27.0(-5.00)#35 | 32.0(-10.00)#2,323 |
| 36. | Jennings | 22.0 | 27.0(-5.00)#36 | 32.0(-10.00)#2,388 |
| 37. | Baton Rouge | 23.0 | 27.0(-4.00)#37 | 32.0(-9.00)#2,488 |
| 38. | Glenmora | 23.0 | 27.0(-4.00)#38 | 32.0(-9.00)#2,639 |
| 39. | Lafayette | 24.0 | 27.0(-3.00)#39 | 32.0(-8.00)#2,680 |
| 40. | Denham Springs | 24.0 | 27.0(-3.00)#40 | 32.0(-8.00)#2,770 |
| 41. | Harahan | 24.0 | 27.0(-3.00)#41 | 32.0(-8.00)#2,774 |
| 42. | Sterlington | 24.0 | 27.0(-3.00)#42 | 32.0(-8.00)#2,815 |
| 43. | Zachary | 25.0 | 27.0(-2.00)#43 | 32.0(-7.00)#2,912 |
| 44. | Elmwood | 25.0 | 27.0(-2.00)#44 | 32.0(-7.00)#2,954 |
| 45. | Carencro | 26.0 | 27.0(-1.000)#45 | 32.0(-6.00)#3,099 |
| 46. | Chackbay | 26.0 | 27.0(-1.000)#46 | 32.0(-6.00)#3,117 |
| 47. | Grand Point | 26.0 | 27.0(-1.000)#47 | 32.0(-6.00)#3,148 |
| 48. | Basile | 26.0 | 27.0(-1.000)#48 | 32.0(-6.00)#3,151 |
| 49. | Hammond | 28.0 | 27.0(+1.000)#49 | 32.0(-4.00)#3,437 |
| 50. | Leesville | 28.0 | 27.0(+1.000)#50 | 32.0(-4.00)#3,486 |
| 51. | New Llano | 28.0 | 27.0(+1.000)#51 | 32.0(-4.00)#3,510 |
| 52. | Cade | 28.0 | 27.0(+1.000)#52 | 32.0(-4.00)#3,515 |
| 53. | Cullen | 29.0 | 27.0(+2.00)#53 | 32.0(-3.00)#3,716 |
| 54. | Kentwood | 31.0 | 27.0(+4.00)#54 | 32.0(-1.000)#4,075 |
| 55. | Sulphur | 32.0 | 27.0(+5.00)#55 | 32.0(=0.000)#4,168 |
| 56. | Gonzales | 32.0 | 27.0(+5.00)#56 | 32.0(=0.000)#4,184 |
| 57. | Ponchatoula | 32.0 | 27.0(+5.00)#57 | 32.0(=0.000)#4,204 |
| 58. | Minorca | 32.0 | 27.0(+5.00)#58 | 32.0(=0.000)#4,256 |
| 59. | New Orleans | 33.0 | 27.0(+6.00)#59 | 32.0(+1.000)#4,274 |
| 60. | French Settlement | 33.0 | 27.0(+6.00)#60 | 32.0(+1.000)#4,442 |
| 61. | Jefferson | 35.0 | 27.0(+8.00)#61 | 32.0(+3.00)#4,693 |
| 62. | Charenton | 35.0 | 27.0(+8.00)#62 | 32.0(+3.00)#4,751 |
| 63. | Gretna | 36.0 | 27.0(+9.00)#63 | 32.0(+4.00)#4,823 |
| 64. | Broussard | 38.0 | 27.0(+11.0)#64 | 32.0(+6.00)#5,173 |
| 65. | Morgan City | 38.0 | 27.0(+11.0)#65 | 32.0(+6.00)#5,178 |
| 66. | Deridder | 38.0 | 27.0(+11.0)#66 | 32.0(+6.00)#5,187 |
| 67. | Old Jefferson | 38.0 | 27.0(+11.0)#67 | 32.0(+6.00)#5,195 |
| 68. | Monroe | 39.0 | 27.0(+12.0)#68 | 32.0(+7.00)#5,310 |
| 69. | New Orleans Station | 39.0 | 27.0(+12.0)#69 | 32.0(+7.00)#5,384 |
| 70. | Monticello | 43.0 | 27.0(+16.0)#70 | 32.0(+11.0)#5,872 |
| 71. | Jean Lafitte | 44.0 | 27.0(+17.0)#71 | 32.0(+12.0)#6,006 |
| 72. | Eden Isle | 45.0 | 27.0(+18.0)#72 | 32.0(+13.0)#6,090 |
| 73. | Metairie | 46.0 | 27.0(+19.0)#73 | 32.0(+14.0)#6,170 |
| 74. | Bayou Cane | 46.0 | 27.0(+19.0)#74 | 32.0(+14.0)#6,191 |
| 75. | Prairieville | 47.0 | 27.0(+20.0)#75 | 32.0(+15.0)#6,266 |
| 76. | Rayne | 47.0 | 27.0(+20.0)#76 | 32.0(+15.0)#6,304 |
| 77. | Abita Springs | 47.0 | 27.0(+20.0)#77 | 32.0(+15.0)#6,323 |
| 78. | Westwego | 48.0 | 27.0(+21.0)#78 | 32.0(+16.0)#6,407 |
| 79. | Breaux Bridge | 49.0 | 27.0(+22.0)#79 | 32.0(+17.0)#6,509 |
| 80. | Ville Platte | 49.0 | 27.0(+22.0)#80 | 32.0(+17.0)#6,513 |
| 81. | Inniswold | 49.0 | 27.0(+22.0)#81 | 32.0(+17.0)#6,514 |
| 82. | Springhill | 49.0 | 27.0(+22.0)#82 | 32.0(+17.0)#6,520 |
| 83. | Eros | 49.0 | 27.0(+22.0)#83 | 32.0(+17.0)#6,571 |
| 84. | Woodmere | 50.0 | 27.0(+23.0)#84 | 32.0(+18.0)#6,611 |
| 85. | Mansfield | 50.0 | 27.0(+23.0)#85 | 32.0(+18.0)#6,635 |
| 86. | Mandeville | 53.0 | 27.0(+26.0)#86 | 32.0(+21.0)#6,884 |
| 87. | Krotz Springs | 53.0 | 27.0(+26.0)#87 | 32.0(+21.0)#6,940 |
| 88. | Washington | 53.0 | 27.0(+26.0)#88 | 32.0(+21.0)#6,944 |
| 89. | Evergreen | 53.0 | 27.0(+26.0)#89 | 32.0(+21.0)#6,954 |
| 90. | Cameron | 53.0 | 27.0(+26.0)#90 | 32.0(+21.0)#6,961 |
| 91. | Brownfields | 54.0 | 27.0(+27.0)#91 | 32.0(+22.0)#7,009 |
| 92. | Ama | 54.0 | 27.0(+27.0)#92 | 32.0(+22.0)#7,037 |
| 93. | Alexandria | 58.0 | 27.0(+31.0)#93 | 32.0(+26.0)#7,301 |
| 94. | Bridge City | 58.0 | 27.0(+31.0)#94 | 32.0(+26.0)#7,318 |
| 95. | Ruston | 59.0 | 27.0(+32.0)#95 | 32.0(+27.0)#7,366 |
| 96. | Plaquemine | 60.0 | 27.0(+33.0)#96 | 32.0(+28.0)#7,461 |
| 97. | Harvey | 65.0 | 27.0(+38.0)#97 | 32.0(+33.0)#7,770 |
| 98. | Roseland | 66.0 | 27.0(+39.0)#98 | 32.0(+34.0)#7,864 |
| 99. | Belle Chasse | 67.0 | 27.0(+40.0)#99 | 32.0(+35.0)#7,882 |
| 100. | Richwood | 69.0 | 27.0(+42.0)#100 | 32.0(+37.0)#8,001 |
Common Questions
What are the Top 10 Cities with the Fewest Births per 1,000 Women Over the Age of 35 in Louisiana?
Top 10 Cities with the Fewest Births per 1,000 Women Over the Age of 35 in Louisiana are:
#1
1.0
#2
1.0
#3
2.0
#4
3.0
#5
3.0
#6
4.0
#7
4.0
#8
5.0
#9
6.0
#10
9.0
What city has the Fewest Births per 1,000 Women Over the Age of 35 in Louisiana?
Houma has the Fewest Births per 1,000 Women Over the Age of 35 in Louisiana with 1.0.
What is the Number of Births per 1,000 Women Over the Age of 35 in the State of Louisiana?
Number of Births per 1,000 Women Over the Age of 35 in Louisiana is 27.0.
What is the Number of Births per 1,000 Women Over the Age of 35 in the United States?
Number of Births per 1,000 Women Over the Age of 35 in the United States is 32.0.