Cities with the Fewest Births per 1,000 Women Over the Age of 35 in Massachusetts
RELATED REPORTS & OPTIONS
Lowest Birth Rate | Women 35+
Massachusetts
Compare Cities
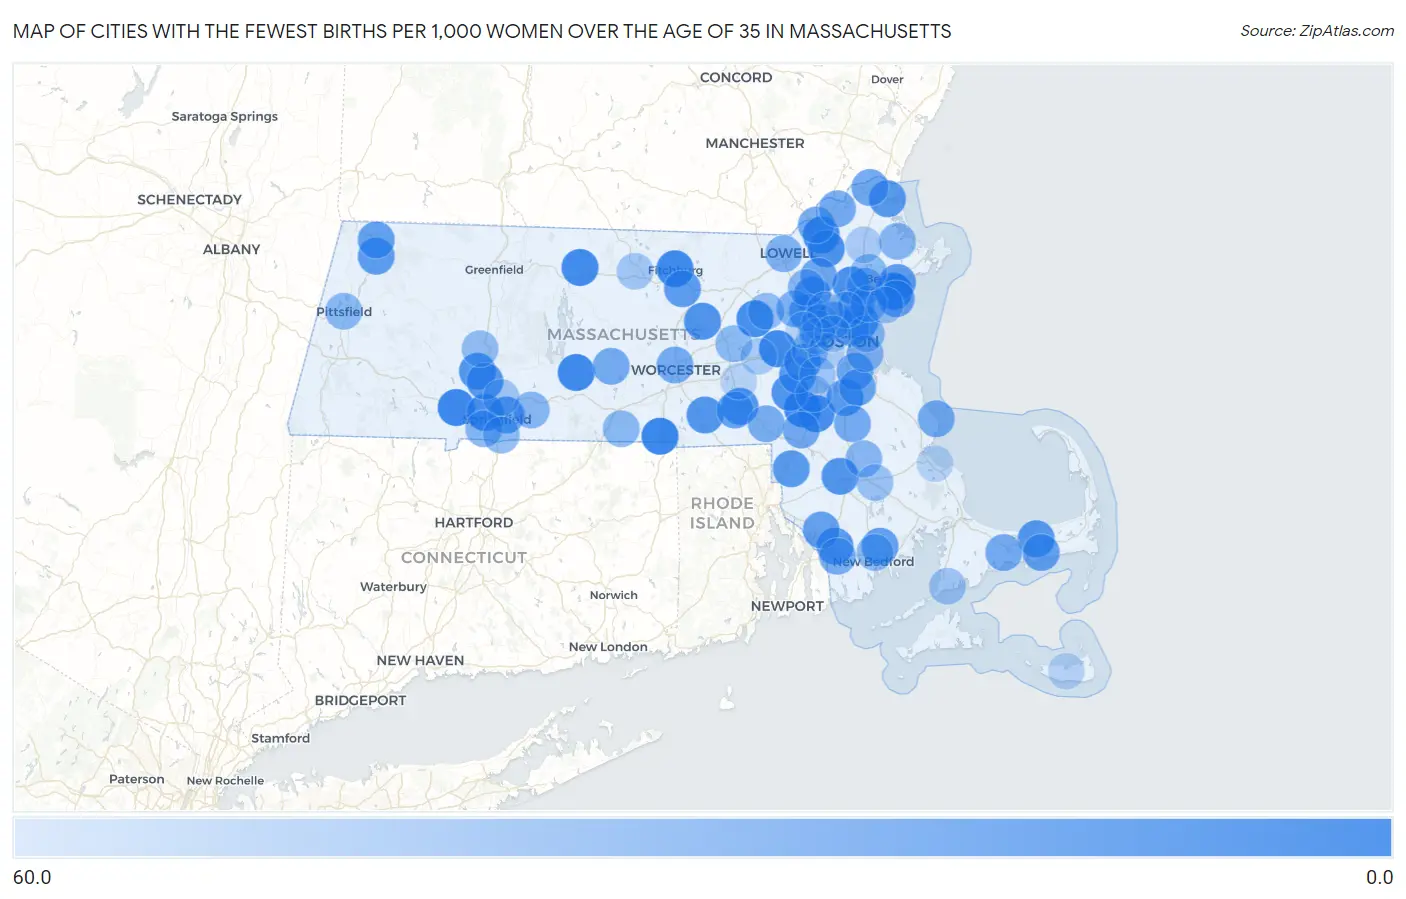
Map of Cities with the Fewest Births per 1,000 Women Over the Age of 35 in Massachusetts
60.0
0.0
Cities with the Fewest Births per 1,000 Women Over the Age of 35 in Massachusetts
| City | Births / 1,000 Women | vs State | vs National | |
| 1. | Salem | 7.0 | 36.0(-29.0)#1 | 32.0(-25.0)#246 |
| 2. | North Attleborough | 8.0 | 36.0(-28.0)#2 | 32.0(-24.0)#344 |
| 3. | Webster | 8.0 | 36.0(-28.0)#3 | 32.0(-24.0)#378 |
| 4. | Westfield | 9.0 | 36.0(-27.0)#4 | 32.0(-23.0)#427 |
| 5. | Fitchburg | 10.0 | 36.0(-26.0)#5 | 32.0(-22.0)#526 |
| 6. | Cochituate | 10.0 | 36.0(-26.0)#6 | 32.0(-22.0)#611 |
| 7. | Walpole | 10.0 | 36.0(-26.0)#7 | 32.0(-22.0)#616 |
| 8. | Ware | 10.0 | 36.0(-26.0)#8 | 32.0(-22.0)#619 |
| 9. | Athol | 11.0 | 36.0(-25.0)#9 | 32.0(-21.0)#721 |
| 10. | Lawrence | 12.0 | 36.0(-24.0)#10 | 32.0(-20.0)#792 |
| 11. | Maynard | 12.0 | 36.0(-24.0)#11 | 32.0(-20.0)#855 |
| 12. | West Springfield Town | 13.0 | 36.0(-23.0)#12 | 32.0(-19.0)#934 |
| 13. | Sharon | 13.0 | 36.0(-23.0)#13 | 32.0(-19.0)#1,002 |
| 14. | Lynnfield | 14.0 | 36.0(-22.0)#14 | 32.0(-18.0)#1,097 |
| 15. | Andover | 15.0 | 36.0(-21.0)#15 | 32.0(-17.0)#1,239 |
| 16. | Clinton | 16.0 | 36.0(-20.0)#16 | 32.0(-16.0)#1,389 |
| 17. | Medfield | 16.0 | 36.0(-20.0)#17 | 32.0(-16.0)#1,398 |
| 18. | Revere | 17.0 | 36.0(-19.0)#18 | 32.0(-15.0)#1,469 |
| 19. | Taunton | 17.0 | 36.0(-19.0)#19 | 32.0(-15.0)#1,470 |
| 20. | Milford | 18.0 | 36.0(-18.0)#20 | 32.0(-14.0)#1,657 |
| 21. | Burlington | 18.0 | 36.0(-18.0)#21 | 32.0(-14.0)#1,659 |
| 22. | Easthampton Town | 18.0 | 36.0(-18.0)#22 | 32.0(-14.0)#1,681 |
| 23. | Whitinsville | 18.0 | 36.0(-18.0)#23 | 32.0(-14.0)#1,723 |
| 24. | Holyoke | 19.0 | 36.0(-17.0)#24 | 32.0(-13.0)#1,822 |
| 25. | Yarmouth Port | 19.0 | 36.0(-17.0)#25 | 32.0(-13.0)#1,897 |
| 26. | Fall River | 20.0 | 36.0(-16.0)#26 | 32.0(-12.0)#1,978 |
| 27. | Attleboro | 20.0 | 36.0(-16.0)#27 | 32.0(-12.0)#1,990 |
| 28. | Randolph Town | 20.0 | 36.0(-16.0)#28 | 32.0(-12.0)#1,995 |
| 29. | Newburyport | 20.0 | 36.0(-16.0)#29 | 32.0(-12.0)#2,022 |
| 30. | Dover | 20.0 | 36.0(-16.0)#30 | 32.0(-12.0)#2,096 |
| 31. | Leominster | 21.0 | 36.0(-15.0)#31 | 32.0(-11.0)#2,161 |
| 32. | Adams | 21.0 | 36.0(-15.0)#32 | 32.0(-11.0)#2,242 |
| 33. | Springfield | 22.0 | 36.0(-14.0)#33 | 32.0(-10.00)#2,311 |
| 34. | Beverly | 22.0 | 36.0(-14.0)#34 | 32.0(-10.00)#2,337 |
| 35. | Needham | 22.0 | 36.0(-14.0)#35 | 32.0(-10.00)#2,342 |
| 36. | Lexington | 23.0 | 36.0(-13.0)#36 | 32.0(-9.00)#2,517 |
| 37. | North Adams | 23.0 | 36.0(-13.0)#37 | 32.0(-9.00)#2,558 |
| 38. | Acushnet Center | 23.0 | 36.0(-13.0)#38 | 32.0(-9.00)#2,601 |
| 39. | Chelsea | 24.0 | 36.0(-12.0)#39 | 32.0(-8.00)#2,700 |
| 40. | South Yarmouth | 24.0 | 36.0(-12.0)#40 | 32.0(-8.00)#2,756 |
| 41. | Marblehead | 25.0 | 36.0(-11.0)#41 | 32.0(-7.00)#2,911 |
| 42. | Somerset | 25.0 | 36.0(-11.0)#42 | 32.0(-7.00)#2,914 |
| 43. | Quincy | 26.0 | 36.0(-10.00)#43 | 32.0(-6.00)#3,043 |
| 44. | Hopedale | 26.0 | 36.0(-10.00)#44 | 32.0(-6.00)#3,132 |
| 45. | Braintree Town | 27.0 | 36.0(-9.00)#45 | 32.0(-5.00)#3,224 |
| 46. | Wilmington | 28.0 | 36.0(-8.00)#46 | 32.0(-4.00)#3,427 |
| 47. | Amesbury Town | 28.0 | 36.0(-8.00)#47 | 32.0(-4.00)#3,447 |
| 48. | Amherst | 29.0 | 36.0(-7.00)#48 | 32.0(-3.00)#3,592 |
| 49. | Foxborough | 29.0 | 36.0(-7.00)#49 | 32.0(-3.00)#3,648 |
| 50. | Medford | 30.0 | 36.0(-6.00)#50 | 32.0(-2.00)#3,768 |
| 51. | Methuen Town | 30.0 | 36.0(-6.00)#51 | 32.0(-2.00)#3,772 |
| 52. | Saugus | 30.0 | 36.0(-6.00)#52 | 32.0(-2.00)#3,791 |
| 53. | Ocean Bluff Brant Rock | 30.0 | 36.0(-6.00)#53 | 32.0(-2.00)#3,858 |
| 54. | North Brookfield | 30.0 | 36.0(-6.00)#54 | 32.0(-2.00)#3,886 |
| 55. | Worcester | 31.0 | 36.0(-5.00)#55 | 32.0(-1.000)#3,946 |
| 56. | Brockton | 31.0 | 36.0(-5.00)#56 | 32.0(-1.000)#3,959 |
| 57. | Haverhill | 31.0 | 36.0(-5.00)#57 | 32.0(-1.000)#3,965 |
| 58. | Barnstable Town | 31.0 | 36.0(-5.00)#58 | 32.0(-1.000)#3,973 |
| 59. | Franklin Town | 32.0 | 36.0(-4.00)#59 | 32.0(=0.000)#4,153 |
| 60. | North Westport | 32.0 | 36.0(-4.00)#60 | 32.0(=0.000)#4,222 |
| 61. | Belmont | 33.0 | 36.0(-3.00)#61 | 32.0(+1.000)#4,319 |
| 62. | Hanscom Afb | 33.0 | 36.0(-3.00)#62 | 32.0(+1.000)#4,424 |
| 63. | Lowell | 35.0 | 36.0(-1.000)#63 | 32.0(+3.00)#4,641 |
| 64. | Boston | 36.0 | 36.0(=0.000)#64 | 32.0(+4.00)#4,765 |
| 65. | Peabody | 36.0 | 36.0(=0.000)#65 | 32.0(+4.00)#4,789 |
| 66. | Agawam Town | 37.0 | 36.0(+1.000)#66 | 32.0(+5.00)#4,985 |
| 67. | Bridgewater Town | 38.0 | 36.0(+2.00)#67 | 32.0(+6.00)#5,144 |
| 68. | Pinehurst | 38.0 | 36.0(+2.00)#68 | 32.0(+6.00)#5,202 |
| 69. | Ipswich | 38.0 | 36.0(+2.00)#69 | 32.0(+6.00)#5,211 |
| 70. | Wilbraham | 38.0 | 36.0(+2.00)#70 | 32.0(+6.00)#5,217 |
| 71. | New Bedford | 39.0 | 36.0(+3.00)#71 | 32.0(+7.00)#5,295 |
| 72. | Pittsfield | 39.0 | 36.0(+3.00)#72 | 32.0(+7.00)#5,312 |
| 73. | Winthrop Town | 39.0 | 36.0(+3.00)#73 | 32.0(+7.00)#5,333 |
| 74. | Southbridge Town | 39.0 | 36.0(+3.00)#74 | 32.0(+7.00)#5,336 |
| 75. | Lynn | 40.0 | 36.0(+4.00)#75 | 32.0(+8.00)#5,427 |
| 76. | Newton | 40.0 | 36.0(+4.00)#76 | 32.0(+8.00)#5,430 |
| 77. | Marlborough | 40.0 | 36.0(+4.00)#77 | 32.0(+8.00)#5,442 |
| 78. | Danvers | 40.0 | 36.0(+4.00)#78 | 32.0(+8.00)#5,457 |
| 79. | Longmeadow | 40.0 | 36.0(+4.00)#79 | 32.0(+8.00)#5,478 |
| 80. | Arlington | 42.0 | 36.0(+6.00)#80 | 32.0(+10.00)#5,706 |
| 81. | Northampton | 42.0 | 36.0(+6.00)#81 | 32.0(+10.00)#5,713 |
| 82. | West Concord | 42.0 | 36.0(+6.00)#82 | 32.0(+10.00)#5,745 |
| 83. | Middleborough Center | 45.0 | 36.0(+9.00)#83 | 32.0(+13.0)#6,092 |
| 84. | Dedham | 46.0 | 36.0(+10.00)#84 | 32.0(+14.0)#6,188 |
| 85. | Swampscott | 46.0 | 36.0(+10.00)#85 | 32.0(+14.0)#6,194 |
| 86. | Chicopee | 47.0 | 36.0(+11.0)#86 | 32.0(+15.0)#6,258 |
| 87. | Falmouth | 47.0 | 36.0(+11.0)#87 | 32.0(+15.0)#6,315 |
| 88. | Gardner | 48.0 | 36.0(+12.0)#88 | 32.0(+16.0)#6,388 |
| 89. | Norwood | 50.0 | 36.0(+14.0)#89 | 32.0(+18.0)#6,588 |
| 90. | Watertown Town | 51.0 | 36.0(+15.0)#90 | 32.0(+19.0)#6,687 |
| 91. | Melrose | 51.0 | 36.0(+15.0)#91 | 32.0(+19.0)#6,692 |
| 92. | Boxford | 51.0 | 36.0(+15.0)#92 | 32.0(+19.0)#6,734 |
| 93. | Framingham | 52.0 | 36.0(+16.0)#93 | 32.0(+20.0)#6,772 |
| 94. | Winchester | 52.0 | 36.0(+16.0)#94 | 32.0(+20.0)#6,792 |
| 95. | Brookline | 53.0 | 36.0(+17.0)#95 | 32.0(+21.0)#6,856 |
| 96. | Cambridge | 55.0 | 36.0(+19.0)#96 | 32.0(+23.0)#7,061 |
| 97. | Waltham | 55.0 | 36.0(+19.0)#97 | 32.0(+23.0)#7,069 |
| 98. | Nantucket | 56.0 | 36.0(+20.0)#98 | 32.0(+24.0)#7,171 |
| 99. | Plymouth | 56.0 | 36.0(+20.0)#99 | 32.0(+24.0)#7,178 |
| 100. | Hopkinton | 56.0 | 36.0(+20.0)#100 | 32.0(+24.0)#7,192 |
1
2Common Questions
What are the Top 10 Cities with the Fewest Births per 1,000 Women Over the Age of 35 in Massachusetts?
Top 10 Cities with the Fewest Births per 1,000 Women Over the Age of 35 in Massachusetts are:
What city has the Fewest Births per 1,000 Women Over the Age of 35 in Massachusetts?
Salem has the Fewest Births per 1,000 Women Over the Age of 35 in Massachusetts with 7.0.
What is the Number of Births per 1,000 Women Over the Age of 35 in the State of Massachusetts?
Number of Births per 1,000 Women Over the Age of 35 in Massachusetts is 36.0.
What is the Number of Births per 1,000 Women Over the Age of 35 in the United States?
Number of Births per 1,000 Women Over the Age of 35 in the United States is 32.0.