Cities with the Fewest Births per 1,000 Women Over the Age of 35 in Illinois
RELATED REPORTS & OPTIONS
Lowest Birth Rate | Women 35+
Illinois
Compare Cities
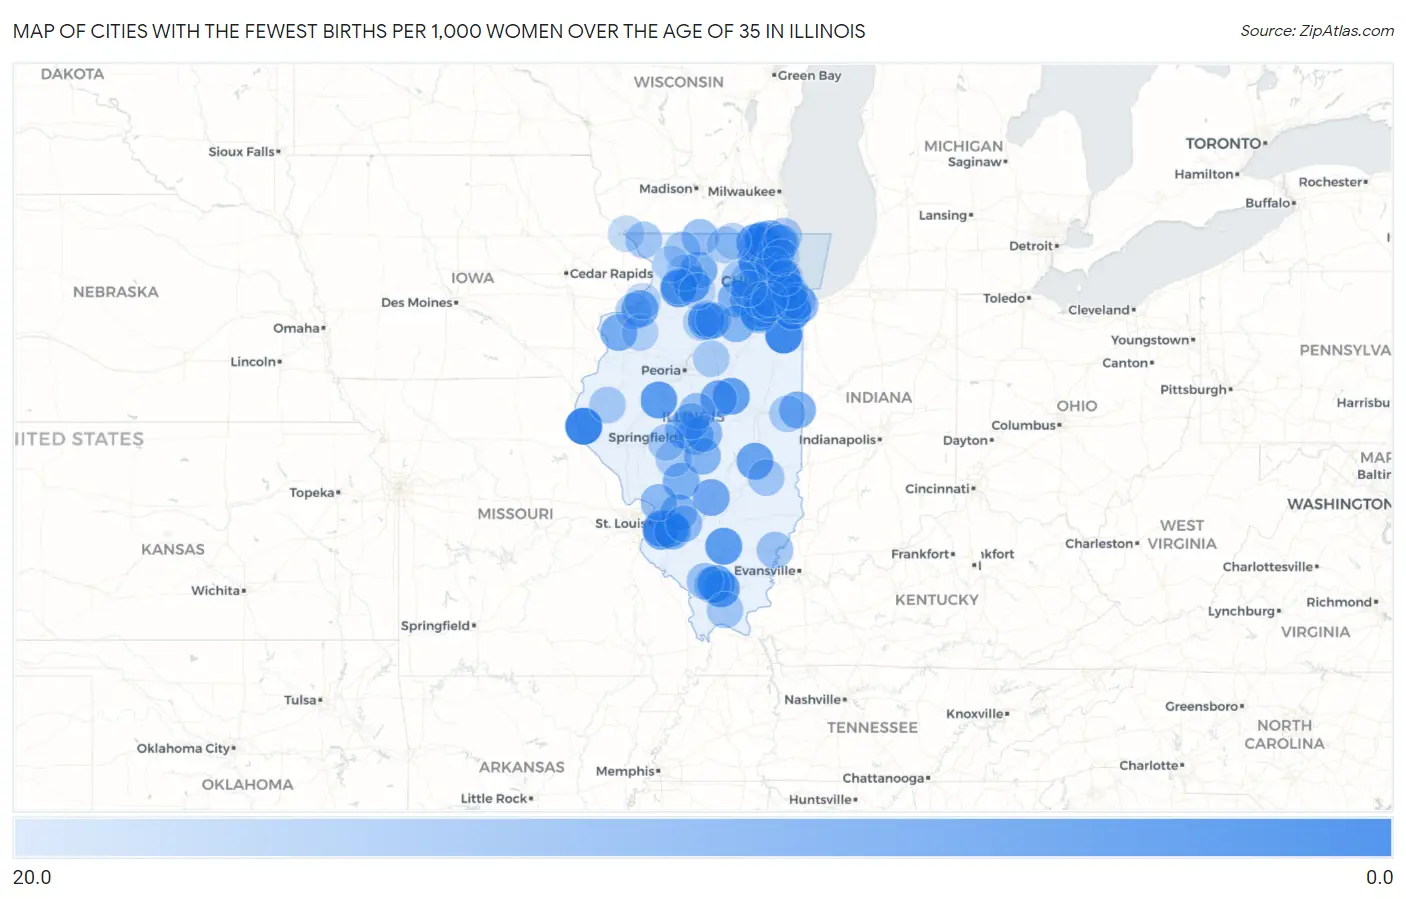
Map of Cities with the Fewest Births per 1,000 Women Over the Age of 35 in Illinois
20.0
0.0
Cities with the Fewest Births per 1,000 Women Over the Age of 35 in Illinois
| City | Births / 1,000 Women | vs State | vs National | |
| 1. | Quincy | 1.0 | 34.0(-33.0)#1 | 32.0(-31.0)#1 |
| 2. | Bradley | 2.0 | 34.0(-32.0)#2 | 32.0(-30.0)#20 |
| 3. | Park Forest | 4.0 | 34.0(-30.0)#3 | 32.0(-28.0)#87 |
| 4. | Rock Falls | 5.0 | 34.0(-29.0)#4 | 32.0(-27.0)#154 |
| 5. | Mount Vernon | 6.0 | 34.0(-28.0)#5 | 32.0(-26.0)#202 |
| 6. | Minooka | 6.0 | 34.0(-28.0)#6 | 32.0(-26.0)#210 |
| 7. | Herrin | 6.0 | 34.0(-28.0)#7 | 32.0(-26.0)#211 |
| 8. | Scott Afb | 6.0 | 34.0(-28.0)#8 | 32.0(-26.0)#233 |
| 9. | Havana | 6.0 | 34.0(-28.0)#9 | 32.0(-26.0)#236 |
| 10. | Marion | 7.0 | 34.0(-27.0)#10 | 32.0(-25.0)#265 |
| 11. | Dixon | 7.0 | 34.0(-27.0)#11 | 32.0(-25.0)#269 |
| 12. | Volo | 7.0 | 34.0(-27.0)#12 | 32.0(-25.0)#303 |
| 13. | Wonder Lake | 7.0 | 34.0(-27.0)#13 | 32.0(-25.0)#312 |
| 14. | Le Roy | 7.0 | 34.0(-27.0)#14 | 32.0(-25.0)#315 |
| 15. | Belleville | 8.0 | 34.0(-26.0)#15 | 32.0(-24.0)#336 |
| 16. | Algonquin | 8.0 | 34.0(-26.0)#16 | 32.0(-24.0)#345 |
| 17. | Mchenry | 8.0 | 34.0(-26.0)#17 | 32.0(-24.0)#346 |
| 18. | Yorkville | 8.0 | 34.0(-26.0)#18 | 32.0(-24.0)#354 |
| 19. | Mattoon | 8.0 | 34.0(-26.0)#19 | 32.0(-24.0)#370 |
| 20. | East Moline | 9.0 | 34.0(-25.0)#20 | 32.0(-23.0)#440 |
| 21. | Shorewood | 9.0 | 34.0(-25.0)#21 | 32.0(-23.0)#448 |
| 22. | Westchester | 9.0 | 34.0(-25.0)#22 | 32.0(-23.0)#451 |
| 23. | Swansea | 9.0 | 34.0(-25.0)#23 | 32.0(-23.0)#456 |
| 24. | West Dundee | 9.0 | 34.0(-25.0)#24 | 32.0(-23.0)#486 |
| 25. | Vandalia | 9.0 | 34.0(-25.0)#25 | 32.0(-23.0)#494 |
| 26. | Spring Valley | 9.0 | 34.0(-25.0)#26 | 32.0(-23.0)#498 |
| 27. | Heyworth | 9.0 | 34.0(-25.0)#27 | 32.0(-23.0)#510 |
| 28. | Franklin Park | 10.0 | 34.0(-24.0)#28 | 32.0(-22.0)#551 |
| 29. | Lake Villa | 10.0 | 34.0(-24.0)#29 | 32.0(-22.0)#601 |
| 30. | Aledo | 10.0 | 34.0(-24.0)#30 | 32.0(-22.0)#630 |
| 31. | Streamwood | 11.0 | 34.0(-23.0)#31 | 32.0(-21.0)#660 |
| 32. | Gurnee | 11.0 | 34.0(-23.0)#32 | 32.0(-21.0)#664 |
| 33. | Danville | 11.0 | 34.0(-23.0)#33 | 32.0(-21.0)#667 |
| 34. | Litchfield | 11.0 | 34.0(-23.0)#34 | 32.0(-21.0)#737 |
| 35. | Oregon | 11.0 | 34.0(-23.0)#35 | 32.0(-21.0)#754 |
| 36. | Somonauk | 11.0 | 34.0(-23.0)#36 | 32.0(-21.0)#769 |
| 37. | Mechanicsburg | 11.0 | 34.0(-23.0)#37 | 32.0(-21.0)#786 |
| 38. | Melrose Park | 12.0 | 34.0(-22.0)#38 | 32.0(-20.0)#818 |
| 39. | Roselle | 12.0 | 34.0(-22.0)#39 | 32.0(-20.0)#824 |
| 40. | Midlothian | 12.0 | 34.0(-22.0)#40 | 32.0(-20.0)#845 |
| 41. | Taylorville | 12.0 | 34.0(-22.0)#41 | 32.0(-20.0)#851 |
| 42. | Highland | 12.0 | 34.0(-22.0)#42 | 32.0(-20.0)#857 |
| 43. | Peru | 12.0 | 34.0(-22.0)#43 | 32.0(-20.0)#860 |
| 44. | Mascoutah | 12.0 | 34.0(-22.0)#44 | 32.0(-20.0)#863 |
| 45. | Marseilles | 12.0 | 34.0(-22.0)#45 | 32.0(-20.0)#886 |
| 46. | Burbank | 13.0 | 34.0(-21.0)#46 | 32.0(-19.0)#932 |
| 47. | Lansing | 13.0 | 34.0(-21.0)#47 | 32.0(-19.0)#935 |
| 48. | Oak Forest | 13.0 | 34.0(-21.0)#48 | 32.0(-19.0)#938 |
| 49. | Summit | 13.0 | 34.0(-21.0)#49 | 32.0(-19.0)#977 |
| 50. | Bethalto | 13.0 | 34.0(-21.0)#50 | 32.0(-19.0)#987 |
| 51. | Johnsburg | 13.0 | 34.0(-21.0)#51 | 32.0(-19.0)#998 |
| 52. | Sherman | 13.0 | 34.0(-21.0)#52 | 32.0(-19.0)#1,009 |
| 53. | Illiopolis | 13.0 | 34.0(-21.0)#53 | 32.0(-19.0)#1,036 |
| 54. | Indian Creek | 13.0 | 34.0(-21.0)#54 | 32.0(-19.0)#1,040 |
| 55. | Lincoln | 14.0 | 34.0(-20.0)#55 | 32.0(-18.0)#1,095 |
| 56. | Pistakee Highlands | 14.0 | 34.0(-20.0)#56 | 32.0(-18.0)#1,142 |
| 57. | Aviston | 14.0 | 34.0(-20.0)#57 | 32.0(-18.0)#1,154 |
| 58. | Durand | 14.0 | 34.0(-20.0)#58 | 32.0(-18.0)#1,167 |
| 59. | Elkhart | 14.0 | 34.0(-20.0)#59 | 32.0(-18.0)#1,182 |
| 60. | Channahon | 15.0 | 34.0(-19.0)#60 | 32.0(-17.0)#1,220 |
| 61. | Willow Springs | 15.0 | 34.0(-19.0)#61 | 32.0(-17.0)#1,257 |
| 62. | Carterville | 15.0 | 34.0(-19.0)#62 | 32.0(-17.0)#1,260 |
| 63. | De Soto | 15.0 | 34.0(-19.0)#63 | 32.0(-17.0)#1,289 |
| 64. | Grayville | 15.0 | 34.0(-19.0)#64 | 32.0(-17.0)#1,293 |
| 65. | Zion | 16.0 | 34.0(-18.0)#65 | 32.0(-16.0)#1,337 |
| 66. | South Holland | 16.0 | 34.0(-18.0)#66 | 32.0(-16.0)#1,342 |
| 67. | Vienna | 16.0 | 34.0(-18.0)#67 | 32.0(-16.0)#1,430 |
| 68. | Greenup | 16.0 | 34.0(-18.0)#68 | 32.0(-16.0)#1,437 |
| 69. | The Galena Territory | 16.0 | 34.0(-18.0)#69 | 32.0(-16.0)#1,442 |
| 70. | Moline | 17.0 | 34.0(-17.0)#70 | 32.0(-15.0)#1,477 |
| 71. | Freeport | 17.0 | 34.0(-17.0)#71 | 32.0(-15.0)#1,492 |
| 72. | Elburn | 17.0 | 34.0(-17.0)#72 | 32.0(-15.0)#1,557 |
| 73. | Virden | 17.0 | 34.0(-17.0)#73 | 32.0(-15.0)#1,573 |
| 74. | Maple Park | 17.0 | 34.0(-17.0)#74 | 32.0(-15.0)#1,600 |
| 75. | Oakwood | 17.0 | 34.0(-17.0)#75 | 32.0(-15.0)#1,606 |
| 76. | New Berlin | 17.0 | 34.0(-17.0)#76 | 32.0(-15.0)#1,609 |
| 77. | Augusta | 17.0 | 34.0(-17.0)#77 | 32.0(-15.0)#1,624 |
| 78. | Benson | 17.0 | 34.0(-17.0)#78 | 32.0(-15.0)#1,627 |
| 79. | Waukegan | 18.0 | 34.0(-16.0)#79 | 32.0(-14.0)#1,634 |
| 80. | Plainfield | 18.0 | 34.0(-16.0)#80 | 32.0(-14.0)#1,648 |
| 81. | Rolling Meadows | 18.0 | 34.0(-16.0)#81 | 32.0(-14.0)#1,662 |
| 82. | Crest Hill | 18.0 | 34.0(-16.0)#82 | 32.0(-14.0)#1,670 |
| 83. | Homewood | 18.0 | 34.0(-16.0)#83 | 32.0(-14.0)#1,671 |
| 84. | Hometown | 18.0 | 34.0(-16.0)#84 | 32.0(-14.0)#1,732 |
| 85. | Polo | 18.0 | 34.0(-16.0)#85 | 32.0(-14.0)#1,757 |
| 86. | De Pue | 18.0 | 34.0(-16.0)#86 | 32.0(-14.0)#1,772 |
| 87. | Lanark | 18.0 | 34.0(-16.0)#87 | 32.0(-14.0)#1,775 |
| 88. | Timberlane | 18.0 | 34.0(-16.0)#88 | 32.0(-14.0)#1,777 |
| 89. | Capron | 18.0 | 34.0(-16.0)#89 | 32.0(-14.0)#1,781 |
| 90. | Ladd | 18.0 | 34.0(-16.0)#90 | 32.0(-14.0)#1,782 |
| 91. | Alpha | 18.0 | 34.0(-16.0)#91 | 32.0(-14.0)#1,792 |
| 92. | Romeoville | 19.0 | 34.0(-15.0)#92 | 32.0(-13.0)#1,821 |
| 93. | Elmwood Park | 19.0 | 34.0(-15.0)#93 | 32.0(-13.0)#1,844 |
| 94. | Sterling | 19.0 | 34.0(-15.0)#94 | 32.0(-13.0)#1,861 |
| 95. | Lasalle | 19.0 | 34.0(-15.0)#95 | 32.0(-13.0)#1,879 |
| 96. | Sugar Grove | 19.0 | 34.0(-15.0)#96 | 32.0(-13.0)#1,882 |
| 97. | Riverwoods | 19.0 | 34.0(-15.0)#97 | 32.0(-13.0)#1,907 |
| 98. | Amboy | 19.0 | 34.0(-15.0)#98 | 32.0(-13.0)#1,926 |
| 99. | Port Byron | 19.0 | 34.0(-15.0)#99 | 32.0(-13.0)#1,939 |
| 100. | East Dubuque | 19.0 | 34.0(-15.0)#100 | 32.0(-13.0)#1,945 |
Common Questions
What are the Top 10 Cities with the Fewest Births per 1,000 Women Over the Age of 35 in Illinois?
Top 10 Cities with the Fewest Births per 1,000 Women Over the Age of 35 in Illinois are:
#1
1.0
#2
2.0
#3
4.0
#4
5.0
#5
6.0
#6
6.0
#7
6.0
#8
6.0
#9
6.0
#10
7.0
What city has the Fewest Births per 1,000 Women Over the Age of 35 in Illinois?
Quincy has the Fewest Births per 1,000 Women Over the Age of 35 in Illinois with 1.0.
What is the Number of Births per 1,000 Women Over the Age of 35 in the State of Illinois?
Number of Births per 1,000 Women Over the Age of 35 in Illinois is 34.0.
What is the Number of Births per 1,000 Women Over the Age of 35 in the United States?
Number of Births per 1,000 Women Over the Age of 35 in the United States is 32.0.