Cities with the Fewest Births per 1,000 Women Over the Age of 35 in Vermont
RELATED REPORTS & OPTIONS
Lowest Birth Rate | Women 35+
Vermont
Compare Cities
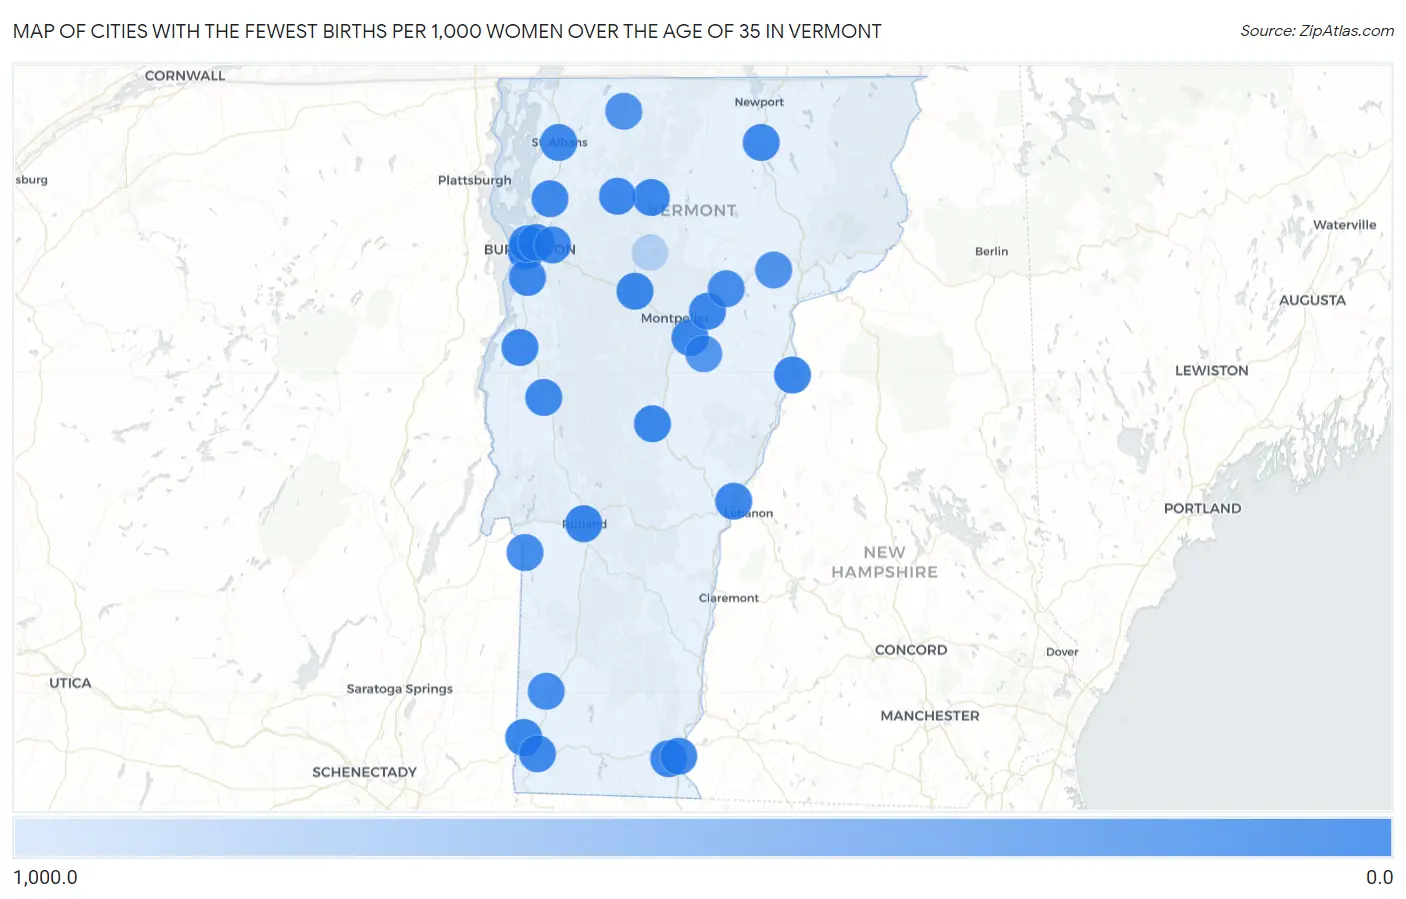
Map of Cities with the Fewest Births per 1,000 Women Over the Age of 35 in Vermont
1,000.0
0.0
Cities with the Fewest Births per 1,000 Women Over the Age of 35 in Vermont
| City | Births / 1,000 Women | vs State | vs National | |
| 1. | Rutland | 8.0 | 27.0(-19.0)#1 | 32.0(-24.0)#372 |
| 2. | South Burlington | 10.0 | 27.0(-17.0)#2 | 32.0(-22.0)#549 |
| 3. | Barre | 18.0 | 27.0(-9.00)#3 | 32.0(-14.0)#1,713 |
| 4. | Waterbury | 23.0 | 27.0(-4.00)#4 | 32.0(-9.00)#2,634 |
| 5. | Johnson | 25.0 | 27.0(-2.00)#5 | 32.0(-7.00)#3,006 |
| 6. | Newbury | 29.0 | 27.0(+2.00)#6 | 32.0(-3.00)#3,732 |
| 7. | Randolph | 30.0 | 27.0(+3.00)#7 | 32.0(-2.00)#3,895 |
| 8. | North Bennington | 32.0 | 27.0(+5.00)#8 | 32.0(=0.000)#4,255 |
| 9. | Jeffersonville | 34.0 | 27.0(+7.00)#9 | 32.0(+2.00)#4,618 |
| 10. | Proctor | 35.0 | 27.0(+8.00)#10 | 32.0(+3.00)#4,742 |
| 11. | Vergennes | 36.0 | 27.0(+9.00)#11 | 32.0(+4.00)#4,886 |
| 12. | Plainfield | 36.0 | 27.0(+9.00)#12 | 32.0(+4.00)#4,934 |
| 13. | Huntington | 38.0 | 27.0(+11.0)#13 | 32.0(+6.00)#5,267 |
| 14. | Shelburne | 39.0 | 27.0(+12.0)#14 | 32.0(+7.00)#5,368 |
| 15. | West Brattleboro | 40.0 | 27.0(+13.0)#15 | 32.0(+8.00)#5,518 |
| 16. | Wilder | 44.0 | 27.0(+17.0)#16 | 32.0(+12.0)#5,999 |
| 17. | Burlington | 47.0 | 27.0(+20.0)#17 | 32.0(+15.0)#6,264 |
| 18. | Pownal Center | 52.0 | 27.0(+25.0)#18 | 32.0(+20.0)#6,852 |
| 19. | Middlebury | 53.0 | 27.0(+26.0)#19 | 32.0(+21.0)#6,908 |
| 20. | St Albans | 62.0 | 27.0(+35.0)#20 | 32.0(+30.0)#7,596 |
| 21. | Brattleboro | 65.0 | 27.0(+38.0)#21 | 32.0(+33.0)#7,780 |
| 22. | Milton | 65.0 | 27.0(+38.0)#22 | 32.0(+33.0)#7,791 |
| 23. | Bennington | 69.0 | 27.0(+42.0)#23 | 32.0(+37.0)#7,992 |
| 24. | Orleans | 69.0 | 27.0(+42.0)#24 | 32.0(+37.0)#8,015 |
| 25. | Winooski | 70.0 | 27.0(+43.0)#25 | 32.0(+38.0)#8,039 |
| 26. | Essex Junction | 73.0 | 27.0(+46.0)#26 | 32.0(+41.0)#8,196 |
| 27. | Poultney | 104.0 | 27.0(+77.0)#27 | 32.0(+72.0)#9,225 |
| 28. | Arlington | 118.0 | 27.0(+91.0)#28 | 32.0(+86.0)#9,538 |
| 29. | Marshfield | 125.0 | 27.0(+98.0)#29 | 32.0(+93.0)#9,659 |
| 30. | Enosburg Falls | 189.0 | 27.0(+162)#30 | 32.0(+157)#10,309 |
| 31. | Danville | 196.0 | 27.0(+169)#31 | 32.0(+164)#10,343 |
| 32. | East Barre | 244.0 | 27.0(+217)#32 | 32.0(+212)#10,576 |
| 33. | Chittenden | 300.0 | 27.0(+273)#33 | 32.0(+268)#10,734 |
| 34. | Pawlet | 333.0 | 27.0(+306)#34 | 32.0(+301)#10,779 |
| 35. | Whitingham | 500.0 | 27.0(+473)#35 | 32.0(+468)#10,946 |
| 36. | Stowe | 1,000.0 | 27.0(+973)#36 | 32.0(+968)#11,023 |
1
Common Questions
What are the Top 10 Cities with the Fewest Births per 1,000 Women Over the Age of 35 in Vermont?
Top 10 Cities with the Fewest Births per 1,000 Women Over the Age of 35 in Vermont are:
#1
0.0
#2
0.0
#3
0.0
#4
0.0
#5
0.0
#6
0.0
#7
0.0
#8
0.0
#9
0.0
#10
0.0
What city has the Fewest Births per 1,000 Women Over the Age of 35 in Vermont?
Rutland has the Fewest Births per 1,000 Women Over the Age of 35 in Vermont with 8.0.
What is the Number of Births per 1,000 Women Over the Age of 35 in the State of Vermont?
Number of Births per 1,000 Women Over the Age of 35 in Vermont is 27.0.
What is the Number of Births per 1,000 Women Over the Age of 35 in the United States?
Number of Births per 1,000 Women Over the Age of 35 in the United States is 32.0.