Cities with the Fewest Births per 1,000 Women Over the Age of 35 in West Virginia
RELATED REPORTS & OPTIONS
Lowest Birth Rate | Women 35+
West Virginia
Compare Cities
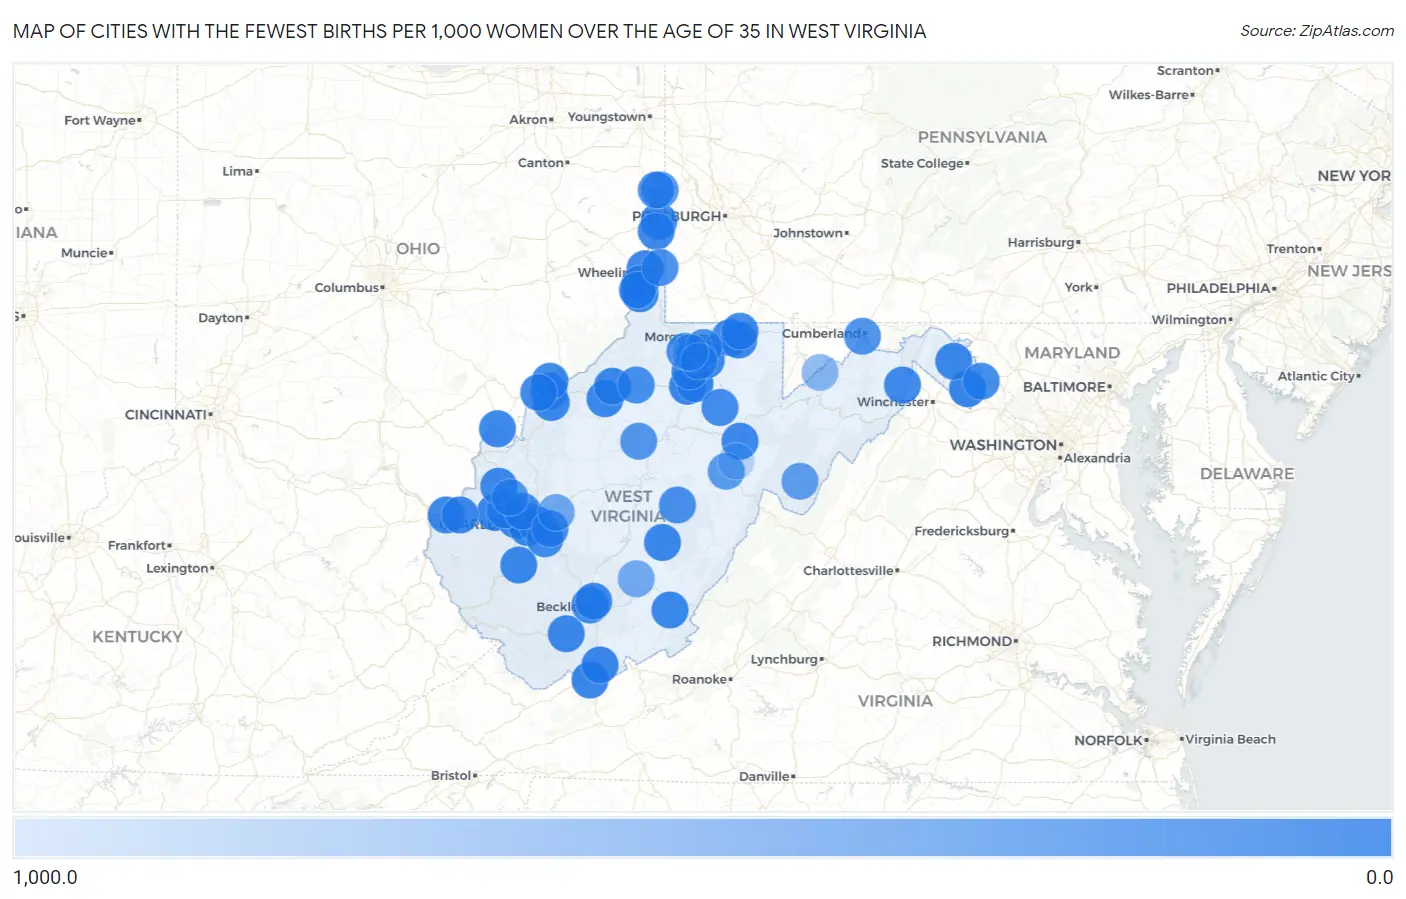
Map of Cities with the Fewest Births per 1,000 Women Over the Age of 35 in West Virginia
1,000.0
0.0
Cities with the Fewest Births per 1,000 Women Over the Age of 35 in West Virginia
| City | Births / 1,000 Women | vs State | vs National | |
| 1. | Bluefield | 5.0 | 19.0(-14.0)#1 | 32.0(-27.0)#151 |
| 2. | Clarksburg | 6.0 | 19.0(-13.0)#2 | 32.0(-26.0)#196 |
| 3. | Dunbar | 7.0 | 19.0(-12.0)#3 | 32.0(-25.0)#300 |
| 4. | Hurricane | 11.0 | 19.0(-8.00)#4 | 32.0(-21.0)#739 |
| 5. | Charles Town | 11.0 | 19.0(-8.00)#5 | 32.0(-21.0)#743 |
| 6. | St Albans | 12.0 | 19.0(-7.00)#6 | 32.0(-20.0)#853 |
| 7. | Princeton | 12.0 | 19.0(-7.00)#7 | 32.0(-20.0)#877 |
| 8. | Ranson Corporation | 13.0 | 19.0(-6.00)#8 | 32.0(-19.0)#1,003 |
| 9. | Mullens | 17.0 | 19.0(-2.00)#9 | 32.0(-15.0)#1,586 |
| 10. | South Charleston | 18.0 | 19.0(-1.000)#10 | 32.0(-14.0)#1,686 |
| 11. | Martinsburg | 20.0 | 19.0(+1.000)#11 | 32.0(-12.0)#2,021 |
| 12. | Charleston | 22.0 | 19.0(+3.00)#12 | 32.0(-10.00)#2,331 |
| 13. | Wheeling | 23.0 | 19.0(+4.00)#13 | 32.0(-9.00)#2,524 |
| 14. | Bridgeport | 23.0 | 19.0(+4.00)#14 | 32.0(-9.00)#2,570 |
| 15. | Harrisville | 23.0 | 19.0(+4.00)#15 | 32.0(-9.00)#2,637 |
| 16. | Huntington | 24.0 | 19.0(+5.00)#16 | 32.0(-8.00)#2,697 |
| 17. | Richwood | 24.0 | 19.0(+5.00)#17 | 32.0(-8.00)#2,804 |
| 18. | Shinnston | 26.0 | 19.0(+7.00)#18 | 32.0(-6.00)#3,153 |
| 19. | Weirton | 27.0 | 19.0(+8.00)#19 | 32.0(-5.00)#3,254 |
| 20. | Ronceverte | 27.0 | 19.0(+8.00)#20 | 32.0(-5.00)#3,347 |
| 21. | Fairmont | 29.0 | 19.0(+10.00)#21 | 32.0(-3.00)#3,612 |
| 22. | Moundsville | 29.0 | 19.0(+10.00)#22 | 32.0(-3.00)#3,640 |
| 23. | Madison | 29.0 | 19.0(+10.00)#23 | 32.0(-3.00)#3,673 |
| 24. | Pennsboro | 29.0 | 19.0(+10.00)#24 | 32.0(-3.00)#3,699 |
| 25. | Teays Valley | 30.0 | 19.0(+11.0)#25 | 32.0(-2.00)#3,818 |
| 26. | Parkersburg | 32.0 | 19.0(+13.0)#26 | 32.0(=0.000)#4,155 |
| 27. | Mcmechen | 32.0 | 19.0(+13.0)#27 | 32.0(=0.000)#4,248 |
| 28. | Morgantown | 33.0 | 19.0(+14.0)#28 | 32.0(+1.000)#4,313 |
| 29. | Elkins | 34.0 | 19.0(+15.0)#29 | 32.0(+2.00)#4,561 |
| 30. | Glen Dale | 36.0 | 19.0(+17.0)#30 | 32.0(+4.00)#4,908 |
| 31. | Pea Ridge | 37.0 | 19.0(+18.0)#31 | 32.0(+5.00)#5,035 |
| 32. | Brookhaven | 38.0 | 19.0(+19.0)#32 | 32.0(+6.00)#5,201 |
| 33. | Buffalo | 44.0 | 19.0(+25.0)#33 | 32.0(+12.0)#6,020 |
| 34. | Mineralwells | 45.0 | 19.0(+26.0)#34 | 32.0(+13.0)#6,124 |
| 35. | Hartford City | 45.0 | 19.0(+26.0)#35 | 32.0(+13.0)#6,154 |
| 36. | Vienna | 48.0 | 19.0(+29.0)#36 | 32.0(+16.0)#6,400 |
| 37. | Marmet | 48.0 | 19.0(+29.0)#37 | 32.0(+16.0)#6,437 |
| 38. | Capon Bridge | 48.0 | 19.0(+29.0)#38 | 32.0(+16.0)#6,458 |
| 39. | Follansbee | 49.0 | 19.0(+30.0)#39 | 32.0(+17.0)#6,534 |
| 40. | Blennerhassett | 58.0 | 19.0(+39.0)#40 | 32.0(+26.0)#7,325 |
| 41. | Beckley | 61.0 | 19.0(+42.0)#41 | 32.0(+29.0)#7,508 |
| 42. | Stanaford | 67.0 | 19.0(+48.0)#42 | 32.0(+35.0)#7,906 |
| 43. | Farmington | 68.0 | 19.0(+49.0)#43 | 32.0(+36.0)#7,980 |
| 44. | Cheat Lake | 71.0 | 19.0(+52.0)#44 | 32.0(+39.0)#8,079 |
| 45. | Mannington | 84.0 | 19.0(+65.0)#45 | 32.0(+52.0)#8,667 |
| 46. | Cross Lanes | 86.0 | 19.0(+67.0)#46 | 32.0(+54.0)#8,712 |
| 47. | Philippi | 86.0 | 19.0(+67.0)#47 | 32.0(+54.0)#8,725 |
| 48. | Harpers Ferry | 91.0 | 19.0(+72.0)#48 | 32.0(+59.0)#8,881 |
| 49. | West Union | 97.0 | 19.0(+78.0)#49 | 32.0(+65.0)#9,059 |
| 50. | Addison Webster Springs | 122.0 | 19.0(+103)#50 | 32.0(+90.0)#9,613 |
| 51. | Coal Fork | 125.0 | 19.0(+106)#51 | 32.0(+93.0)#9,650 |
| 52. | Valley Grove | 137.0 | 19.0(+118)#52 | 32.0(+105)#9,857 |
| 53. | Grant Town | 139.0 | 19.0(+120)#53 | 32.0(+107)#9,885 |
| 54. | Chester | 148.0 | 19.0(+129)#54 | 32.0(+116)#9,981 |
| 55. | Newell | 158.0 | 19.0(+139)#55 | 32.0(+126)#10,084 |
| 56. | Carpendale | 177.0 | 19.0(+158)#56 | 32.0(+145)#10,239 |
| 57. | Sand Fork | 200.0 | 19.0(+181)#57 | 32.0(+168)#10,386 |
| 58. | Winfield | 202.0 | 19.0(+183)#58 | 32.0(+170)#10,393 |
| 59. | Monongah | 226.0 | 19.0(+207)#59 | 32.0(+194)#10,516 |
| 60. | Institute | 259.0 | 19.0(+240)#60 | 32.0(+227)#10,634 |
| 61. | Huttonsville | 276.0 | 19.0(+257)#61 | 32.0(+244)#10,688 |
| 62. | Franklin | 296.0 | 19.0(+277)#62 | 32.0(+264)#10,729 |
| 63. | Elkview | 437.0 | 19.0(+418)#63 | 32.0(+405)#10,892 |
| 64. | Rainelle | 448.0 | 19.0(+429)#64 | 32.0(+416)#10,904 |
| 65. | Elk Garden | 643.0 | 19.0(+624)#65 | 32.0(+611)#10,991 |
| 66. | East Dailey | 1,000.0 | 19.0(+981)#66 | 32.0(+968)#11,026 |
| 67. | Rachel | 1,000.0 | 19.0(+981)#67 | 32.0(+968)#11,038 |
Common Questions
What are the Top 10 Cities with the Fewest Births per 1,000 Women Over the Age of 35 in West Virginia?
Top 10 Cities with the Fewest Births per 1,000 Women Over the Age of 35 in West Virginia are:
#1
0.0
#2
0.0
#3
0.0
#4
0.0
#5
0.0
#6
0.0
#7
0.0
#8
0.0
#9
0.0
#10
0.0
What city has the Fewest Births per 1,000 Women Over the Age of 35 in West Virginia?
Bluefield has the Fewest Births per 1,000 Women Over the Age of 35 in West Virginia with 5.0.
What is the Number of Births per 1,000 Women Over the Age of 35 in the State of West Virginia?
Number of Births per 1,000 Women Over the Age of 35 in West Virginia is 19.0.
What is the Number of Births per 1,000 Women Over the Age of 35 in the United States?
Number of Births per 1,000 Women Over the Age of 35 in the United States is 32.0.