Cities with the Fewest Births per 1,000 Women Over the Age of 35 in South Carolina
RELATED REPORTS & OPTIONS
Lowest Birth Rate | Women 35+
South Carolina
Compare Cities
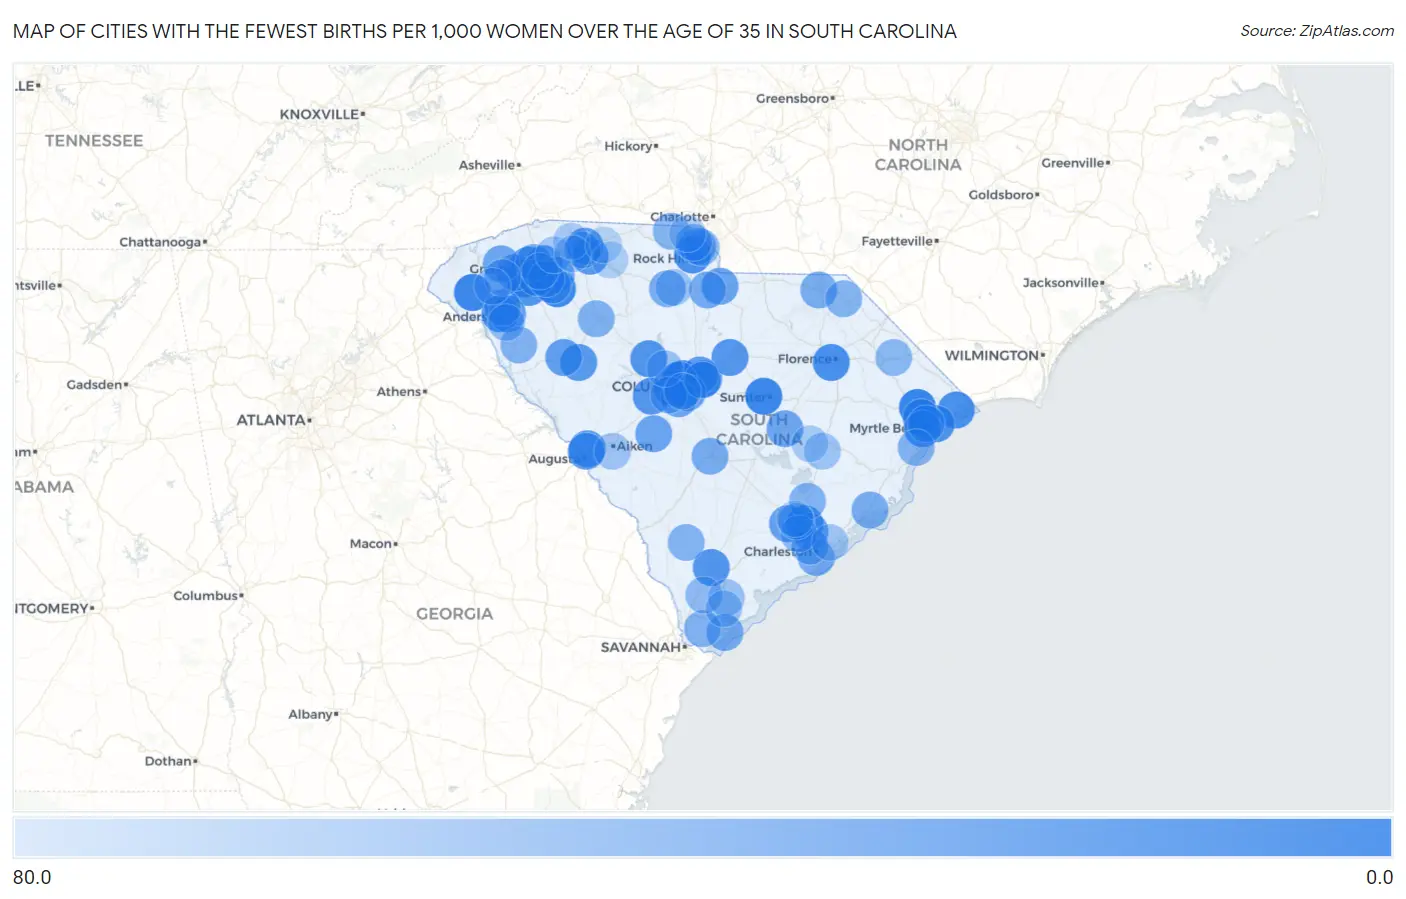
Map of Cities with the Fewest Births per 1,000 Women Over the Age of 35 in South Carolina
80.0
0.0
Cities with the Fewest Births per 1,000 Women Over the Age of 35 in South Carolina
| City | Births / 1,000 Women | vs State | vs National | |
| 1. | Conway | 3.0 | 27.0(-24.0)#1 | 32.0(-29.0)#37 |
| 2. | St Andrews | 4.0 | 27.0(-23.0)#2 | 32.0(-28.0)#86 |
| 3. | Sumter | 5.0 | 27.0(-22.0)#3 | 32.0(-27.0)#116 |
| 4. | Seneca | 5.0 | 27.0(-22.0)#4 | 32.0(-27.0)#156 |
| 5. | Powdersville | 7.0 | 27.0(-20.0)#5 | 32.0(-25.0)#291 |
| 6. | Fountain Inn | 7.0 | 27.0(-20.0)#6 | 32.0(-25.0)#292 |
| 7. | Rock Hill | 11.0 | 27.0(-16.0)#7 | 32.0(-21.0)#654 |
| 8. | Florence | 11.0 | 27.0(-16.0)#8 | 32.0(-21.0)#659 |
| 9. | Woodfield | 11.0 | 27.0(-16.0)#9 | 32.0(-21.0)#719 |
| 10. | Centerville | 11.0 | 27.0(-16.0)#10 | 32.0(-21.0)#734 |
| 11. | North Myrtle Beach | 12.0 | 27.0(-15.0)#11 | 32.0(-20.0)#836 |
| 12. | Berea | 12.0 | 27.0(-15.0)#12 | 32.0(-20.0)#841 |
| 13. | Myrtle Beach | 13.0 | 27.0(-14.0)#13 | 32.0(-19.0)#928 |
| 14. | Red Hill | 13.0 | 27.0(-14.0)#14 | 32.0(-19.0)#959 |
| 15. | Piedmont | 15.0 | 27.0(-12.0)#15 | 32.0(-17.0)#1,263 |
| 16. | Yemassee | 15.0 | 27.0(-12.0)#16 | 32.0(-17.0)#1,301 |
| 17. | Little Mountain | 15.0 | 27.0(-12.0)#17 | 32.0(-17.0)#1,308 |
| 18. | Goose Creek | 16.0 | 27.0(-11.0)#18 | 32.0(-16.0)#1,326 |
| 19. | Socastee | 16.0 | 27.0(-11.0)#19 | 32.0(-16.0)#1,338 |
| 20. | White Knoll | 16.0 | 27.0(-11.0)#20 | 32.0(-16.0)#1,391 |
| 21. | Hilltop | 16.0 | 27.0(-11.0)#21 | 32.0(-16.0)#1,417 |
| 22. | Spartanburg | 17.0 | 27.0(-10.00)#22 | 32.0(-15.0)#1,480 |
| 23. | Lugoff | 17.0 | 27.0(-10.00)#23 | 32.0(-15.0)#1,536 |
| 24. | Valley Falls | 17.0 | 27.0(-10.00)#24 | 32.0(-15.0)#1,551 |
| 25. | Gilbert | 17.0 | 27.0(-10.00)#25 | 32.0(-15.0)#1,626 |
| 26. | Wade Hampton | 18.0 | 27.0(-9.00)#26 | 32.0(-14.0)#1,666 |
| 27. | Ninety Six | 18.0 | 27.0(-9.00)#27 | 32.0(-14.0)#1,756 |
| 28. | West Columbia | 19.0 | 27.0(-8.00)#28 | 32.0(-13.0)#1,853 |
| 29. | Belvedere | 20.0 | 27.0(-7.00)#29 | 32.0(-12.0)#2,067 |
| 30. | Anderson | 21.0 | 27.0(-6.00)#30 | 32.0(-11.0)#2,173 |
| 31. | North Augusta | 21.0 | 27.0(-6.00)#31 | 32.0(-11.0)#2,178 |
| 32. | Lexington | 21.0 | 27.0(-6.00)#32 | 32.0(-11.0)#2,181 |
| 33. | Dentsville | 21.0 | 27.0(-6.00)#33 | 32.0(-11.0)#2,192 |
| 34. | Greenwood | 22.0 | 27.0(-5.00)#34 | 32.0(-10.00)#2,353 |
| 35. | Summerville | 23.0 | 27.0(-4.00)#35 | 32.0(-9.00)#2,507 |
| 36. | Seven Oaks | 24.0 | 27.0(-3.00)#36 | 32.0(-8.00)#2,739 |
| 37. | Cayce | 24.0 | 27.0(-3.00)#37 | 32.0(-8.00)#2,746 |
| 38. | Five Forks | 25.0 | 27.0(-2.00)#38 | 32.0(-7.00)#2,913 |
| 39. | Lancaster | 25.0 | 27.0(-2.00)#39 | 32.0(-7.00)#2,945 |
| 40. | Hanahan | 26.0 | 27.0(-1.000)#40 | 32.0(-6.00)#3,071 |
| 41. | Litchfield Beach | 26.0 | 27.0(-1.000)#41 | 32.0(-6.00)#3,103 |
| 42. | Wagener | 26.0 | 27.0(-1.000)#42 | 32.0(-6.00)#3,181 |
| 43. | Simpsonville | 27.0 | 27.0(=0.000)#43 | 32.0(-5.00)#3,244 |
| 44. | South Congaree | 27.0 | 27.0(=0.000)#44 | 32.0(-5.00)#3,330 |
| 45. | Easley | 28.0 | 27.0(+1.000)#45 | 32.0(-4.00)#3,429 |
| 46. | Manning | 28.0 | 27.0(+1.000)#46 | 32.0(-4.00)#3,499 |
| 47. | Pickens | 28.0 | 27.0(+1.000)#47 | 32.0(-4.00)#3,503 |
| 48. | Carolina Forest | 30.0 | 27.0(+3.00)#48 | 32.0(-2.00)#3,795 |
| 49. | Riverview | 31.0 | 27.0(+4.00)#49 | 32.0(-1.000)#4,070 |
| 50. | Fort Lawn | 31.0 | 27.0(+4.00)#50 | 32.0(-1.000)#4,092 |
| 51. | Hilton Head Island | 32.0 | 27.0(+5.00)#51 | 32.0(=0.000)#4,144 |
| 52. | Gantt | 32.0 | 27.0(+5.00)#52 | 32.0(=0.000)#4,179 |
| 53. | Orangeburg | 32.0 | 27.0(+5.00)#53 | 32.0(=0.000)#4,181 |
| 54. | Forestbrook | 32.0 | 27.0(+5.00)#54 | 32.0(=0.000)#4,208 |
| 55. | Northlake | 32.0 | 27.0(+5.00)#55 | 32.0(=0.000)#4,226 |
| 56. | Gayle Mill | 32.0 | 27.0(+5.00)#56 | 32.0(=0.000)#4,259 |
| 57. | James Island | 33.0 | 27.0(+6.00)#57 | 32.0(+1.000)#4,343 |
| 58. | Cheraw | 33.0 | 27.0(+6.00)#58 | 32.0(+1.000)#4,386 |
| 59. | Mcclellanville | 33.0 | 27.0(+6.00)#59 | 32.0(+1.000)#4,445 |
| 60. | Charleston | 36.0 | 27.0(+9.00)#60 | 32.0(+4.00)#4,772 |
| 61. | Sans Souci | 36.0 | 27.0(+9.00)#61 | 32.0(+4.00)#4,850 |
| 62. | Clinton | 36.0 | 27.0(+9.00)#62 | 32.0(+4.00)#4,853 |
| 63. | Liberty | 36.0 | 27.0(+9.00)#63 | 32.0(+4.00)#4,882 |
| 64. | Bluffton | 37.0 | 27.0(+10.00)#64 | 32.0(+5.00)#4,984 |
| 65. | Mauldin | 37.0 | 27.0(+10.00)#65 | 32.0(+5.00)#4,989 |
| 66. | Red Bank | 37.0 | 27.0(+10.00)#66 | 32.0(+5.00)#5,016 |
| 67. | Antreville | 37.0 | 27.0(+10.00)#67 | 32.0(+5.00)#5,102 |
| 68. | Moncks Corner | 38.0 | 27.0(+11.0)#68 | 32.0(+6.00)#5,172 |
| 69. | Murrells Inlet | 38.0 | 27.0(+11.0)#69 | 32.0(+6.00)#5,184 |
| 70. | Varnville | 38.0 | 27.0(+11.0)#70 | 32.0(+6.00)#5,229 |
| 71. | Bennettsville | 39.0 | 27.0(+12.0)#71 | 32.0(+7.00)#5,364 |
| 72. | Clover | 39.0 | 27.0(+12.0)#72 | 32.0(+7.00)#5,365 |
| 73. | Greenville | 40.0 | 27.0(+13.0)#73 | 32.0(+8.00)#5,432 |
| 74. | Mullins | 41.0 | 27.0(+14.0)#74 | 32.0(+9.00)#5,638 |
| 75. | North Charleston | 42.0 | 27.0(+15.0)#75 | 32.0(+10.00)#5,692 |
| 76. | Southern Shops | 42.0 | 27.0(+15.0)#76 | 32.0(+10.00)#5,756 |
| 77. | Fort Mill | 43.0 | 27.0(+16.0)#77 | 32.0(+11.0)#5,837 |
| 78. | Tega Cay | 43.0 | 27.0(+16.0)#78 | 32.0(+11.0)#5,852 |
| 79. | Ridgeland | 43.0 | 27.0(+16.0)#79 | 32.0(+11.0)#5,879 |
| 80. | Homeland Park | 44.0 | 27.0(+17.0)#80 | 32.0(+12.0)#5,986 |
| 81. | Columbia | 45.0 | 27.0(+18.0)#81 | 32.0(+13.0)#6,040 |
| 82. | Beaufort | 47.0 | 27.0(+20.0)#82 | 32.0(+15.0)#6,287 |
| 83. | Lake Murray Of Richland | 47.0 | 27.0(+20.0)#83 | 32.0(+15.0)#6,305 |
| 84. | Ladson | 48.0 | 27.0(+21.0)#84 | 32.0(+16.0)#6,395 |
| 85. | Port Royal | 48.0 | 27.0(+21.0)#85 | 32.0(+16.0)#6,397 |
| 86. | Eureka Mill | 49.0 | 27.0(+22.0)#86 | 32.0(+17.0)#6,542 |
| 87. | Lane | 49.0 | 27.0(+22.0)#87 | 32.0(+17.0)#6,567 |
| 88. | Aiken | 50.0 | 27.0(+23.0)#88 | 32.0(+18.0)#6,586 |
| 89. | Mount Pleasant | 51.0 | 27.0(+24.0)#89 | 32.0(+19.0)#6,677 |
| 90. | Greer | 51.0 | 27.0(+24.0)#90 | 32.0(+19.0)#6,686 |
| 91. | Central | 51.0 | 27.0(+24.0)#91 | 32.0(+19.0)#6,718 |
| 92. | Springdale | 52.0 | 27.0(+25.0)#92 | 32.0(+20.0)#6,832 |
| 93. | Greeleyville | 54.0 | 27.0(+27.0)#93 | 32.0(+22.0)#7,058 |
| 94. | Lake Wylie | 55.0 | 27.0(+28.0)#94 | 32.0(+23.0)#7,093 |
| 95. | Inman | 55.0 | 27.0(+28.0)#95 | 32.0(+23.0)#7,121 |
| 96. | Wellford | 57.0 | 27.0(+30.0)#96 | 32.0(+25.0)#7,269 |
| 97. | Central Pacolet | 57.0 | 27.0(+30.0)#97 | 32.0(+25.0)#7,293 |
| 98. | Beech Island | 58.0 | 27.0(+31.0)#98 | 32.0(+26.0)#7,343 |
| 99. | Sangaree | 60.0 | 27.0(+33.0)#99 | 32.0(+28.0)#7,452 |
| 100. | Cowpens | 61.0 | 27.0(+34.0)#100 | 32.0(+29.0)#7,539 |
Common Questions
What are the Top 10 Cities with the Fewest Births per 1,000 Women Over the Age of 35 in South Carolina?
Top 10 Cities with the Fewest Births per 1,000 Women Over the Age of 35 in South Carolina are:
#1
3.0
#2
4.0
#3
5.0
#4
5.0
#5
7.0
#6
7.0
#7
11.0
#8
11.0
#9
11.0
#10
11.0
What city has the Fewest Births per 1,000 Women Over the Age of 35 in South Carolina?
Conway has the Fewest Births per 1,000 Women Over the Age of 35 in South Carolina with 3.0.
What is the Number of Births per 1,000 Women Over the Age of 35 in the State of South Carolina?
Number of Births per 1,000 Women Over the Age of 35 in South Carolina is 27.0.
What is the Number of Births per 1,000 Women Over the Age of 35 in the United States?
Number of Births per 1,000 Women Over the Age of 35 in the United States is 32.0.