Cities with the Fewest Births per 1,000 Women Over the Age of 35 in Indiana
RELATED REPORTS & OPTIONS
Lowest Birth Rate | Women 35+
Indiana
Compare Cities
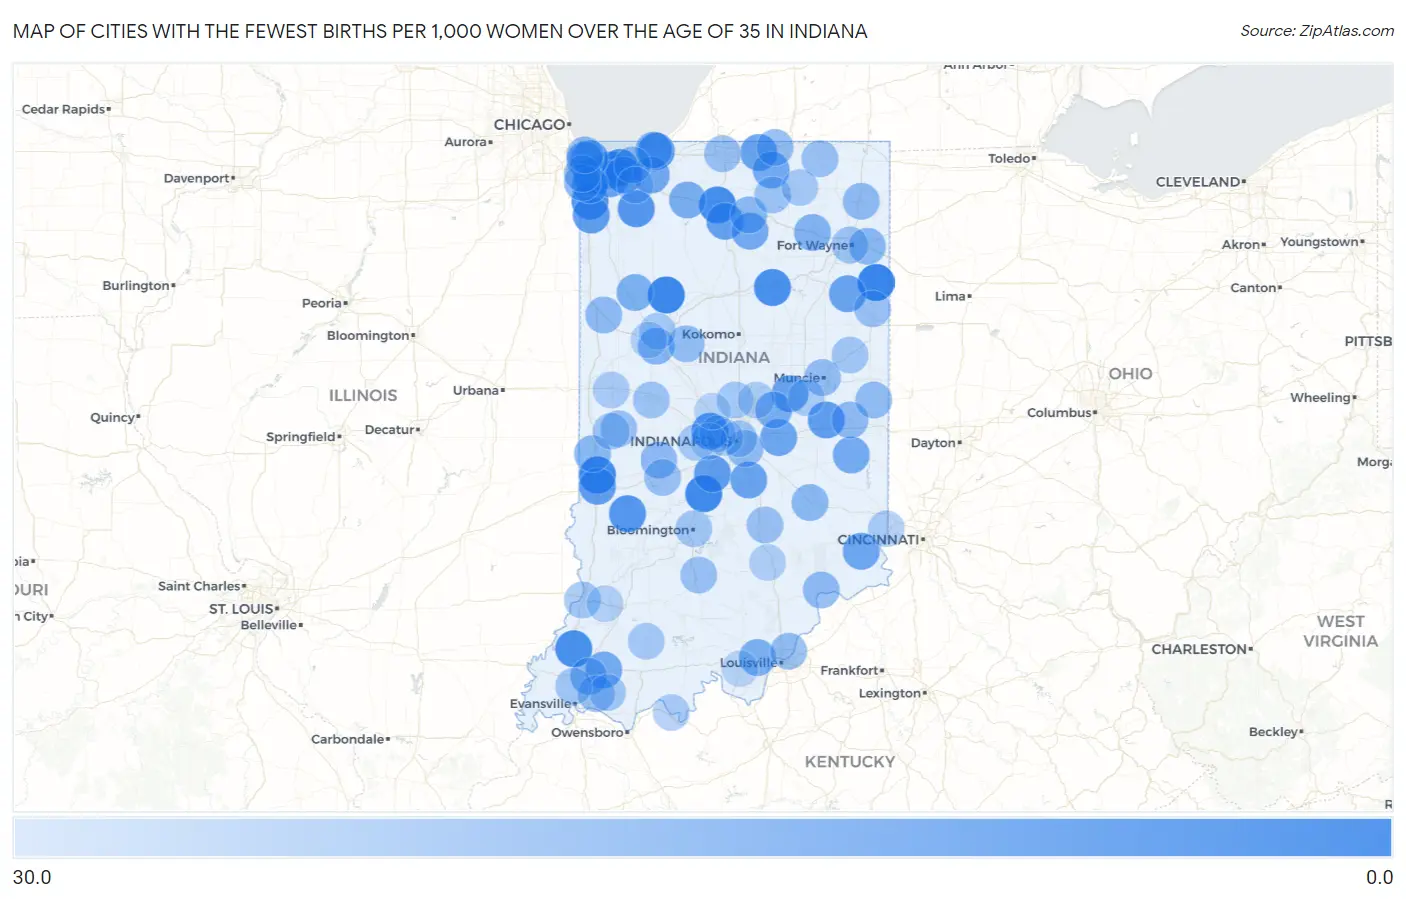
Map of Cities with the Fewest Births per 1,000 Women Over the Age of 35 in Indiana
30.0
0.0
Cities with the Fewest Births per 1,000 Women Over the Age of 35 in Indiana
| City | Births / 1,000 Women | vs State | vs National | |
| 1. | Decatur | 1.0 | 25.0(-24.0)#1 | 32.0(-31.0)#9 |
| 2. | Monticello | 2.0 | 25.0(-23.0)#2 | 32.0(-30.0)#24 |
| 3. | Lake Station | 3.0 | 25.0(-22.0)#3 | 32.0(-29.0)#52 |
| 4. | Martinsville | 3.0 | 25.0(-22.0)#4 | 32.0(-29.0)#55 |
| 5. | North Terre Haute | 3.0 | 25.0(-22.0)#5 | 32.0(-29.0)#73 |
| 6. | Griffith | 4.0 | 25.0(-21.0)#6 | 32.0(-28.0)#95 |
| 7. | Plymouth | 4.0 | 25.0(-21.0)#7 | 32.0(-28.0)#106 |
| 8. | Wabash | 5.0 | 25.0(-20.0)#8 | 32.0(-27.0)#149 |
| 9. | Princeton | 5.0 | 25.0(-20.0)#9 | 32.0(-27.0)#157 |
| 10. | Portage | 6.0 | 25.0(-19.0)#10 | 32.0(-26.0)#179 |
| 11. | Cedar Lake | 6.0 | 25.0(-19.0)#11 | 32.0(-26.0)#204 |
| 12. | Brownsburg | 7.0 | 25.0(-18.0)#12 | 32.0(-25.0)#251 |
| 13. | Kouts | 8.0 | 25.0(-17.0)#13 | 32.0(-24.0)#413 |
| 14. | Trail Creek | 8.0 | 25.0(-17.0)#14 | 32.0(-24.0)#416 |
| 15. | Clay City | 8.0 | 25.0(-17.0)#15 | 32.0(-24.0)#420 |
| 16. | Terre Haute | 10.0 | 25.0(-15.0)#16 | 32.0(-22.0)#522 |
| 17. | New Castle | 10.0 | 25.0(-15.0)#17 | 32.0(-22.0)#554 |
| 18. | Lowell | 10.0 | 25.0(-15.0)#18 | 32.0(-22.0)#589 |
| 19. | Brooklyn | 10.0 | 25.0(-15.0)#19 | 32.0(-22.0)#637 |
| 20. | Argos | 11.0 | 25.0(-14.0)#20 | 32.0(-21.0)#771 |
| 21. | Anderson | 12.0 | 25.0(-13.0)#21 | 32.0(-20.0)#794 |
| 22. | Elkhart | 12.0 | 25.0(-13.0)#22 | 32.0(-20.0)#795 |
| 23. | Hobart | 12.0 | 25.0(-13.0)#23 | 32.0(-20.0)#810 |
| 24. | East Chicago | 12.0 | 25.0(-13.0)#24 | 32.0(-20.0)#813 |
| 25. | Franklin | 12.0 | 25.0(-13.0)#25 | 32.0(-20.0)#814 |
| 26. | Bluffton | 12.0 | 25.0(-13.0)#26 | 32.0(-20.0)#856 |
| 27. | South Haven | 12.0 | 25.0(-13.0)#27 | 32.0(-20.0)#872 |
| 28. | Greenfield | 13.0 | 25.0(-12.0)#28 | 32.0(-19.0)#943 |
| 29. | Dillsboro | 13.0 | 25.0(-12.0)#29 | 32.0(-19.0)#1,026 |
| 30. | Westville | 14.0 | 25.0(-11.0)#30 | 32.0(-18.0)#1,134 |
| 31. | Goshen | 15.0 | 25.0(-10.00)#31 | 32.0(-17.0)#1,198 |
| 32. | Connersville | 15.0 | 25.0(-10.00)#32 | 32.0(-17.0)#1,224 |
| 33. | Lynnville | 15.0 | 25.0(-10.00)#33 | 32.0(-17.0)#1,300 |
| 34. | Mentone | 15.0 | 25.0(-10.00)#34 | 32.0(-17.0)#1,303 |
| 35. | Hammond | 16.0 | 25.0(-9.00)#35 | 32.0(-16.0)#1,317 |
| 36. | Ingalls | 16.0 | 25.0(-9.00)#36 | 32.0(-16.0)#1,427 |
| 37. | Hamlet | 16.0 | 25.0(-9.00)#37 | 32.0(-16.0)#1,453 |
| 38. | Schererville | 17.0 | 25.0(-8.00)#38 | 32.0(-15.0)#1,485 |
| 39. | Georgetown | 17.0 | 25.0(-8.00)#39 | 32.0(-15.0)#1,567 |
| 40. | Wolcott | 17.0 | 25.0(-8.00)#40 | 32.0(-15.0)#1,618 |
| 41. | Columbia City | 18.0 | 25.0(-7.00)#41 | 32.0(-14.0)#1,704 |
| 42. | Lafayette | 19.0 | 25.0(-6.00)#42 | 32.0(-13.0)#1,808 |
| 43. | Michigan City | 19.0 | 25.0(-6.00)#43 | 32.0(-13.0)#1,833 |
| 44. | Dyer | 19.0 | 25.0(-6.00)#44 | 32.0(-13.0)#1,856 |
| 45. | Elberfeld | 19.0 | 25.0(-6.00)#45 | 32.0(-13.0)#1,962 |
| 46. | New Haven | 20.0 | 25.0(-5.00)#46 | 32.0(-12.0)#2,025 |
| 47. | Greensburg | 20.0 | 25.0(-5.00)#47 | 32.0(-12.0)#2,038 |
| 48. | Fairview Park | 20.0 | 25.0(-5.00)#48 | 32.0(-12.0)#2,118 |
| 49. | Etna Green | 20.0 | 25.0(-5.00)#49 | 32.0(-12.0)#2,133 |
| 50. | Munster | 21.0 | 25.0(-4.00)#50 | 32.0(-11.0)#2,180 |
| 51. | Auburn | 21.0 | 25.0(-4.00)#51 | 32.0(-11.0)#2,205 |
| 52. | Madison | 21.0 | 25.0(-4.00)#52 | 32.0(-11.0)#2,209 |
| 53. | Greencastle | 21.0 | 25.0(-4.00)#53 | 32.0(-11.0)#2,221 |
| 54. | Whiting | 21.0 | 25.0(-4.00)#54 | 32.0(-11.0)#2,251 |
| 55. | Fowler | 21.0 | 25.0(-4.00)#55 | 32.0(-11.0)#2,268 |
| 56. | Hagerstown | 21.0 | 25.0(-4.00)#56 | 32.0(-11.0)#2,272 |
| 57. | Muncie | 22.0 | 25.0(-3.00)#57 | 32.0(-10.00)#2,324 |
| 58. | Jeffersonville | 22.0 | 25.0(-3.00)#58 | 32.0(-10.00)#2,330 |
| 59. | Beech Grove | 22.0 | 25.0(-3.00)#59 | 32.0(-10.00)#2,371 |
| 60. | Chesterton | 22.0 | 25.0(-3.00)#60 | 32.0(-10.00)#2,374 |
| 61. | Bristol | 22.0 | 25.0(-3.00)#61 | 32.0(-10.00)#2,444 |
| 62. | Rossville | 22.0 | 25.0(-3.00)#62 | 32.0(-10.00)#2,447 |
| 63. | Lynn | 22.0 | 25.0(-3.00)#63 | 32.0(-10.00)#2,461 |
| 64. | South Bend | 23.0 | 25.0(-2.00)#64 | 32.0(-9.00)#2,495 |
| 65. | Columbus | 23.0 | 25.0(-2.00)#65 | 32.0(-9.00)#2,506 |
| 66. | Bedford | 23.0 | 25.0(-2.00)#66 | 32.0(-9.00)#2,554 |
| 67. | Berne | 23.0 | 25.0(-2.00)#67 | 32.0(-9.00)#2,593 |
| 68. | Chandler | 23.0 | 25.0(-2.00)#68 | 32.0(-9.00)#2,594 |
| 69. | Lagrange | 23.0 | 25.0(-2.00)#69 | 32.0(-9.00)#2,607 |
| 70. | Cloverdale | 23.0 | 25.0(-2.00)#70 | 32.0(-9.00)#2,620 |
| 71. | Marshall | 23.0 | 25.0(-2.00)#71 | 32.0(-9.00)#2,669 |
| 72. | Indianapolis | 24.0 | 25.0(-1.000)#72 | 32.0(-8.00)#2,671 |
| 73. | Fort Wayne | 24.0 | 25.0(-1.000)#73 | 32.0(-8.00)#2,674 |
| 74. | Crawfordsville | 24.0 | 25.0(-1.000)#74 | 32.0(-8.00)#2,738 |
| 75. | Milford | 24.0 | 25.0(-1.000)#75 | 32.0(-8.00)#2,823 |
| 76. | Bloomington | 25.0 | 25.0(=0.000)#76 | 32.0(-7.00)#2,870 |
| 77. | Vincennes | 25.0 | 25.0(=0.000)#77 | 32.0(-7.00)#2,919 |
| 78. | Boonville | 25.0 | 25.0(=0.000)#78 | 32.0(-7.00)#2,953 |
| 79. | Redkey | 25.0 | 25.0(=0.000)#79 | 32.0(-7.00)#2,999 |
| 80. | Darmstadt | 25.0 | 25.0(=0.000)#80 | 32.0(-7.00)#3,009 |
| 81. | Bloomingdale | 25.0 | 25.0(=0.000)#81 | 32.0(-7.00)#3,026 |
| 82. | Westfield | 26.0 | 25.0(+1.000)#82 | 32.0(-6.00)#3,052 |
| 83. | Jasper | 26.0 | 25.0(+1.000)#83 | 32.0(-6.00)#3,080 |
| 84. | Danville | 26.0 | 25.0(+1.000)#84 | 32.0(-6.00)#3,096 |
| 85. | Ligonier | 26.0 | 25.0(+1.000)#85 | 32.0(-6.00)#3,129 |
| 86. | Battle Ground | 26.0 | 25.0(+1.000)#86 | 32.0(-6.00)#3,161 |
| 87. | Valparaiso | 27.0 | 25.0(+2.00)#87 | 32.0(-5.00)#3,230 |
| 88. | Hidden Valley | 27.0 | 25.0(+2.00)#88 | 32.0(-5.00)#3,311 |
| 89. | Middletown | 27.0 | 25.0(+2.00)#89 | 32.0(-5.00)#3,333 |
| 90. | Veedersburg | 27.0 | 25.0(+2.00)#90 | 32.0(-5.00)#3,334 |
| 91. | Cannelton | 27.0 | 25.0(+2.00)#91 | 32.0(-5.00)#3,345 |
| 92. | Noblesville | 28.0 | 25.0(+3.00)#92 | 32.0(-4.00)#3,395 |
| 93. | Seymour | 28.0 | 25.0(+3.00)#93 | 32.0(-4.00)#3,432 |
| 94. | Speedway | 28.0 | 25.0(+3.00)#94 | 32.0(-4.00)#3,455 |
| 95. | West Lafayette | 29.0 | 25.0(+4.00)#95 | 32.0(-3.00)#3,586 |
| 96. | Clermont | 29.0 | 25.0(+4.00)#96 | 32.0(-3.00)#3,694 |
| 97. | Wheatland | 29.0 | 25.0(+4.00)#97 | 32.0(-3.00)#3,737 |
| 98. | Avon | 30.0 | 25.0(+5.00)#98 | 32.0(-2.00)#3,799 |
| 99. | Whitestown | 30.0 | 25.0(+5.00)#99 | 32.0(-2.00)#3,831 |
| 100. | Corydon | 30.0 | 25.0(+5.00)#100 | 32.0(-2.00)#3,876 |
Common Questions
What are the Top 10 Cities with the Fewest Births per 1,000 Women Over the Age of 35 in Indiana?
Top 10 Cities with the Fewest Births per 1,000 Women Over the Age of 35 in Indiana are:
#1
1.0
#2
2.0
#3
3.0
#4
3.0
#5
3.0
#6
4.0
#7
4.0
#8
5.0
#9
5.0
#10
6.0
What city has the Fewest Births per 1,000 Women Over the Age of 35 in Indiana?
Decatur has the Fewest Births per 1,000 Women Over the Age of 35 in Indiana with 1.0.
What is the Number of Births per 1,000 Women Over the Age of 35 in the State of Indiana?
Number of Births per 1,000 Women Over the Age of 35 in Indiana is 25.0.
What is the Number of Births per 1,000 Women Over the Age of 35 in the United States?
Number of Births per 1,000 Women Over the Age of 35 in the United States is 32.0.