Cities with the Fewest Births per 1,000 Women Over the Age of 35 in Oregon
RELATED REPORTS & OPTIONS
Lowest Birth Rate | Women 35+
Oregon
Compare Cities
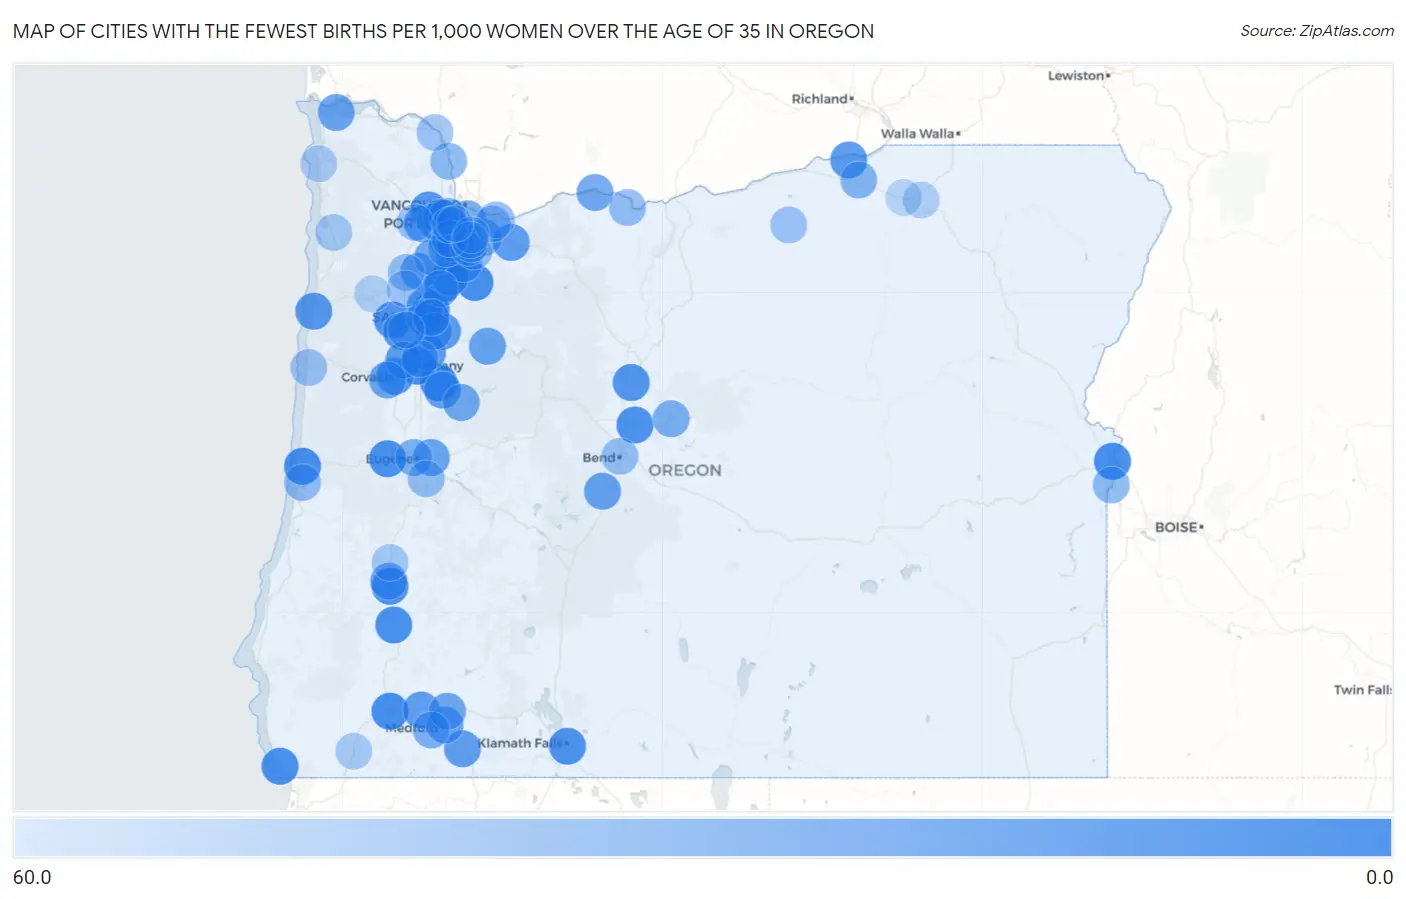
Map of Cities with the Fewest Births per 1,000 Women Over the Age of 35 in Oregon
60.0
0.0
Cities with the Fewest Births per 1,000 Women Over the Age of 35 in Oregon
| City | Births / 1,000 Women | vs State | vs National | |
| 1. | Hayesville | 3.0 | 32.0(-29.0)#1 | 32.0(-29.0)#39 |
| 2. | Lebanon | 6.0 | 32.0(-26.0)#2 | 32.0(-26.0)#192 |
| 3. | Albany | 8.0 | 32.0(-24.0)#3 | 32.0(-24.0)#334 |
| 4. | Grants Pass | 8.0 | 32.0(-24.0)#4 | 32.0(-24.0)#337 |
| 5. | Woodburn | 9.0 | 32.0(-23.0)#5 | 32.0(-23.0)#435 |
| 6. | Ontario | 9.0 | 32.0(-23.0)#6 | 32.0(-23.0)#467 |
| 7. | Molalla | 9.0 | 32.0(-23.0)#7 | 32.0(-23.0)#472 |
| 8. | Florence | 9.0 | 32.0(-23.0)#8 | 32.0(-23.0)#477 |
| 9. | Roseburg | 10.0 | 32.0(-22.0)#9 | 32.0(-22.0)#541 |
| 10. | Brookings | 11.0 | 32.0(-21.0)#10 | 32.0(-21.0)#741 |
| 11. | Veneta | 11.0 | 32.0(-21.0)#11 | 32.0(-21.0)#749 |
| 12. | Tri City | 11.0 | 32.0(-21.0)#12 | 32.0(-21.0)#758 |
| 13. | Redmond | 12.0 | 32.0(-20.0)#13 | 32.0(-20.0)#804 |
| 14. | Klamath Falls | 12.0 | 32.0(-20.0)#14 | 32.0(-20.0)#827 |
| 15. | Wilsonville | 13.0 | 32.0(-19.0)#15 | 32.0(-19.0)#940 |
| 16. | Dallas | 13.0 | 32.0(-19.0)#16 | 32.0(-19.0)#956 |
| 17. | Hubbard | 14.0 | 32.0(-18.0)#17 | 32.0(-18.0)#1,141 |
| 18. | Culver | 14.0 | 32.0(-18.0)#18 | 32.0(-18.0)#1,159 |
| 19. | Corvallis | 16.0 | 32.0(-16.0)#19 | 32.0(-16.0)#1,319 |
| 20. | Aloha | 16.0 | 32.0(-16.0)#20 | 32.0(-16.0)#1,323 |
| 21. | Monmouth | 16.0 | 32.0(-16.0)#21 | 32.0(-16.0)#1,363 |
| 22. | Lincoln City | 16.0 | 32.0(-16.0)#22 | 32.0(-16.0)#1,372 |
| 23. | North Plains | 16.0 | 32.0(-16.0)#23 | 32.0(-16.0)#1,414 |
| 24. | Umatilla | 17.0 | 32.0(-15.0)#24 | 32.0(-15.0)#1,547 |
| 25. | Aumsville | 17.0 | 32.0(-15.0)#25 | 32.0(-15.0)#1,563 |
| 26. | Jefferson | 17.0 | 32.0(-15.0)#26 | 32.0(-15.0)#1,570 |
| 27. | Adair Village | 17.0 | 32.0(-15.0)#27 | 32.0(-15.0)#1,613 |
| 28. | Sandy | 18.0 | 32.0(-14.0)#28 | 32.0(-14.0)#1,688 |
| 29. | Keizer | 20.0 | 32.0(-12.0)#29 | 32.0(-12.0)#1,993 |
| 30. | Ashland | 20.0 | 32.0(-12.0)#30 | 32.0(-12.0)#2,012 |
| 31. | Bull Mountain | 20.0 | 32.0(-12.0)#31 | 32.0(-12.0)#2,050 |
| 32. | Gold Hill | 20.0 | 32.0(-12.0)#32 | 32.0(-12.0)#2,121 |
| 33. | Salem | 22.0 | 32.0(-10.00)#33 | 32.0(-10.00)#2,310 |
| 34. | Cornelius | 22.0 | 32.0(-10.00)#34 | 32.0(-10.00)#2,376 |
| 35. | Three Rivers | 22.0 | 32.0(-10.00)#35 | 32.0(-10.00)#2,419 |
| 36. | Turner | 22.0 | 32.0(-10.00)#36 | 32.0(-10.00)#2,428 |
| 37. | Sodaville | 22.0 | 32.0(-10.00)#37 | 32.0(-10.00)#2,484 |
| 38. | Beaverton | 23.0 | 32.0(-9.00)#38 | 32.0(-9.00)#2,496 |
| 39. | Medford | 24.0 | 32.0(-8.00)#39 | 32.0(-8.00)#2,687 |
| 40. | Astoria | 24.0 | 32.0(-8.00)#40 | 32.0(-8.00)#2,765 |
| 41. | Metzger | 24.0 | 32.0(-8.00)#41 | 32.0(-8.00)#2,797 |
| 42. | Mill City | 24.0 | 32.0(-8.00)#42 | 32.0(-8.00)#2,824 |
| 43. | Springfield | 25.0 | 32.0(-7.00)#43 | 32.0(-7.00)#2,875 |
| 44. | Philomath | 25.0 | 32.0(-7.00)#44 | 32.0(-7.00)#2,956 |
| 45. | Dayton | 25.0 | 32.0(-7.00)#45 | 32.0(-7.00)#2,984 |
| 46. | Tualatin | 26.0 | 32.0(-6.00)#46 | 32.0(-6.00)#3,062 |
| 47. | Canby | 26.0 | 32.0(-6.00)#47 | 32.0(-6.00)#3,077 |
| 48. | White City | 26.0 | 32.0(-6.00)#48 | 32.0(-6.00)#3,094 |
| 49. | Sweet Home | 26.0 | 32.0(-6.00)#49 | 32.0(-6.00)#3,101 |
| 50. | Roseburg North | 26.0 | 32.0(-6.00)#50 | 32.0(-6.00)#3,128 |
| 51. | Oak Hills | 27.0 | 32.0(-5.00)#51 | 32.0(-5.00)#3,274 |
| 52. | Hood River | 27.0 | 32.0(-5.00)#52 | 32.0(-5.00)#3,291 |
| 53. | Garden Home Whitford | 27.0 | 32.0(-5.00)#53 | 32.0(-5.00)#3,299 |
| 54. | Newberg | 28.0 | 32.0(-4.00)#54 | 32.0(-4.00)#3,420 |
| 55. | Portland | 30.0 | 32.0(-2.00)#55 | 32.0(-2.00)#3,742 |
| 56. | Hillsboro | 30.0 | 32.0(-2.00)#56 | 32.0(-2.00)#3,754 |
| 57. | Happy Valley | 31.0 | 32.0(-1.000)#57 | 32.0(-1.000)#3,996 |
| 58. | Prineville | 31.0 | 32.0(-1.000)#58 | 32.0(-1.000)#4,019 |
| 59. | Eugene | 32.0 | 32.0(=0.000)#59 | 32.0(=0.000)#4,121 |
| 60. | Gervais | 32.0 | 32.0(=0.000)#60 | 32.0(=0.000)#4,237 |
| 61. | Durham | 33.0 | 32.0(+1.000)#61 | 32.0(+1.000)#4,423 |
| 62. | Four Corners | 34.0 | 32.0(+2.00)#62 | 32.0(+2.00)#4,529 |
| 63. | Jacksonville | 34.0 | 32.0(+2.00)#63 | 32.0(+2.00)#4,581 |
| 64. | Millersburg | 34.0 | 32.0(+2.00)#64 | 32.0(+2.00)#4,582 |
| 65. | Stanfield | 35.0 | 32.0(+3.00)#65 | 32.0(+3.00)#4,734 |
| 66. | Sherwood | 36.0 | 32.0(+4.00)#66 | 32.0(+4.00)#4,820 |
| 67. | Bethany | 38.0 | 32.0(+6.00)#67 | 32.0(+6.00)#5,141 |
| 68. | Rockcreek | 38.0 | 32.0(+6.00)#68 | 32.0(+6.00)#5,186 |
| 69. | Nyssa | 38.0 | 32.0(+6.00)#69 | 32.0(+6.00)#5,223 |
| 70. | Columbia City | 38.0 | 32.0(+6.00)#70 | 32.0(+6.00)#5,236 |
| 71. | Troutdale | 39.0 | 32.0(+7.00)#71 | 32.0(+7.00)#5,341 |
| 72. | Independence | 40.0 | 32.0(+8.00)#72 | 32.0(+8.00)#5,489 |
| 73. | Oregon City | 41.0 | 32.0(+9.00)#73 | 32.0(+9.00)#5,578 |
| 74. | Chenoweth | 41.0 | 32.0(+9.00)#74 | 32.0(+9.00)#5,659 |
| 75. | Dunes City | 41.0 | 32.0(+9.00)#75 | 32.0(+9.00)#5,666 |
| 76. | Creswell | 42.0 | 32.0(+10.00)#76 | 32.0(+10.00)#5,748 |
| 77. | Bend | 43.0 | 32.0(+11.0)#77 | 32.0(+11.0)#5,809 |
| 78. | Mcminnville | 43.0 | 32.0(+11.0)#78 | 32.0(+11.0)#5,827 |
| 79. | Marlene | 43.0 | 32.0(+11.0)#79 | 32.0(+11.0)#5,870 |
| 80. | Newport | 44.0 | 32.0(+12.0)#80 | 32.0(+12.0)#5,978 |
| 81. | West Linn | 45.0 | 32.0(+13.0)#81 | 32.0(+13.0)#6,057 |
| 82. | Forest Grove | 45.0 | 32.0(+13.0)#82 | 32.0(+13.0)#6,058 |
| 83. | Jennings Lodge | 45.0 | 32.0(+13.0)#83 | 32.0(+13.0)#6,093 |
| 84. | Rainier | 45.0 | 32.0(+13.0)#84 | 32.0(+13.0)#6,129 |
| 85. | Ione | 45.0 | 32.0(+13.0)#85 | 32.0(+13.0)#6,160 |
| 86. | Gresham | 46.0 | 32.0(+14.0)#86 | 32.0(+14.0)#6,172 |
| 87. | Amity | 46.0 | 32.0(+14.0)#87 | 32.0(+14.0)#6,240 |
| 88. | Tigard | 48.0 | 32.0(+16.0)#88 | 32.0(+16.0)#6,370 |
| 89. | Cedar Hills | 48.0 | 32.0(+16.0)#89 | 32.0(+16.0)#6,404 |
| 90. | Dunthorpe | 48.0 | 32.0(+16.0)#90 | 32.0(+16.0)#6,435 |
| 91. | Sutherlin | 49.0 | 32.0(+17.0)#91 | 32.0(+17.0)#6,506 |
| 92. | Tillamook | 49.0 | 32.0(+17.0)#92 | 32.0(+17.0)#6,517 |
| 93. | Milwaukie | 51.0 | 32.0(+19.0)#93 | 32.0(+19.0)#6,698 |
| 94. | Cave Junction | 51.0 | 32.0(+19.0)#94 | 32.0(+19.0)#6,739 |
| 95. | Cannon Beach | 52.0 | 32.0(+20.0)#95 | 32.0(+20.0)#6,845 |
| 96. | Mission | 53.0 | 32.0(+21.0)#96 | 32.0(+21.0)#6,937 |
| 97. | Willamina | 54.0 | 32.0(+22.0)#97 | 32.0(+22.0)#7,027 |
| 98. | Oak Grove | 55.0 | 32.0(+23.0)#98 | 32.0(+23.0)#7,090 |
| 99. | West Haven Sylvan | 55.0 | 32.0(+23.0)#99 | 32.0(+23.0)#7,101 |
| 100. | Pendleton | 57.0 | 32.0(+25.0)#100 | 32.0(+25.0)#7,245 |
Common Questions
What are the Top 10 Cities with the Fewest Births per 1,000 Women Over the Age of 35 in Oregon?
Top 10 Cities with the Fewest Births per 1,000 Women Over the Age of 35 in Oregon are:
#1
3.0
#2
6.0
#3
8.0
#4
8.0
#5
9.0
#6
9.0
#7
9.0
#8
9.0
#9
10.0
#10
11.0
What city has the Fewest Births per 1,000 Women Over the Age of 35 in Oregon?
Hayesville has the Fewest Births per 1,000 Women Over the Age of 35 in Oregon with 3.0.
What is the Number of Births per 1,000 Women Over the Age of 35 in the State of Oregon?
Number of Births per 1,000 Women Over the Age of 35 in Oregon is 32.0.
What is the Number of Births per 1,000 Women Over the Age of 35 in the United States?
Number of Births per 1,000 Women Over the Age of 35 in the United States is 32.0.