Cities with the Fewest Births per 1,000 Women Over the Age of 35 in Puerto Rico

RELATED REPORTS & OPTIONS

Lowest Birth Rate | Women 35+
Population
Families and Households
Female Fertility
Female Fertility (Unmarried)
Race (Community Size)
Race (Percentage)
Ancestry (Community Size)
AfghanAfricanAlaska NativeAlaskan AthabascanAlbanianAleutAlsatianAmericanApacheArabArapahoArgentineanArmenianAssyrian / Chaldean / SyriacAustralianAustrianBahamianBangladeshiBarbadianBasqueBelgianBelizeanBermudanBhutaneseBlackfeetBolivianBrazilianBritishBritish West IndianBulgarianBurmeseCajunCambodianCanadianCape VerdeanCarpatho RusynCelticCentral AmericanCentral American IndianCherokeeCheyenneChickasawChileanChineseChippewaChoctawColombianColvilleComancheCosta RicanCreeCreekCroatianCrowCubanCypriotCzechCzechoslovakianDanishDelawareDominicanDutchDutch West IndianEastern EuropeanEcuadorianEgyptianEnglishEstonianEthiopianEuropeanFijianFilipinoFinnishFrenchFrench American IndianFrench CanadianGermanGerman RussianGhanaianGreekGuamanian / ChamorroGuatemalanGuyaneseHaitianHmongHonduranHopiHoumaHungarianIcelanderIndian (Asian)IndonesianInupiatIranianIraqiIrishIroquoisIsraeliItalianJamaicanJapaneseJordanianKenyanKiowaKoreanLaotianLatvianLebaneseLiberianLithuanianLumbeeLuxembourgerMacedonianMalaysianMalteseMarshalleseMenomineeMexicanMexican American IndianMongolianMoroccanNative HawaiianNavajoNepaleseNew ZealanderNicaraguanNigerianNorthern EuropeanNorwegianOkinawanOsageOttawaPaiutePakistaniPalestinianPanamanianParaguayanPennsylvania GermanPeruvianPimaPolishPortuguesePotawatomiPuebloPuerto RicanPuget Sound SalishRomanianRussianSalvadoranSamoanScandinavianScotch-IrishScottishSeminoleSenegaleseSerbianShoshoneSierra LeoneanSiouxSlavicSlovakSloveneSomaliSouth AfricanSouth AmericanSouth American IndianSoviet UnionSpaniardSpanishSpanish AmericanSpanish American IndianSri LankanSubsaharan AfricanSudaneseSwedishSwissSyrianTaiwaneseThaiTlingit-HaidaTohono O'OdhamTonganTrinidadian and TobagonianTsimshianTurkishU.S. Virgin IslanderUgandanUkrainianUruguayanUteVenezuelanVietnameseWelshWest IndianYakamaYaquiYugoslavianYumanYup'ikZimbabwean
Ancestry (Percentage)
AfghanAfricanAlaska NativeAlaskan AthabascanAlbanianAleutAlsatianAmericanApacheArabArapahoArgentineanArmenianAssyrian / Chaldean / SyriacAustralianAustrianBahamianBangladeshiBarbadianBasqueBelgianBelizeanBermudanBhutaneseBlackfeetBolivianBrazilianBritishBritish West IndianBulgarianBurmeseCajunCambodianCanadianCape VerdeanCarpatho RusynCelticCentral AmericanCentral American IndianCherokeeCheyenneChickasawChileanChineseChippewaChoctawColombianColvilleComancheCosta RicanCreeCreekCroatianCrowCubanCypriotCzechCzechoslovakianDanishDelawareDominicanDutchDutch West IndianEastern EuropeanEcuadorianEgyptianEnglishEstonianEthiopianEuropeanFijianFilipinoFinnishFrenchFrench American IndianFrench CanadianGermanGerman RussianGhanaianGreekGuamanian / ChamorroGuatemalanGuyaneseHaitianHmongHonduranHopiHoumaHungarianIcelanderIndian (Asian)IndonesianInupiatIranianIraqiIrishIroquoisIsraeliItalianJamaicanJapaneseJordanianKenyanKiowaKoreanLaotianLatvianLebaneseLiberianLithuanianLumbeeLuxembourgerMacedonianMalaysianMalteseMarshalleseMenomineeMexicanMexican American IndianMongolianMoroccanNative HawaiianNavajoNepaleseNew ZealanderNicaraguanNigerianNorthern EuropeanNorwegianOkinawanOsageOttawaPaiutePakistaniPalestinianPanamanianParaguayanPennsylvania GermanPeruvianPimaPolishPortuguesePotawatomiPuebloPuerto RicanPuget Sound SalishRomanianRussianSalvadoranSamoanScandinavianScotch-IrishScottishSeminoleSenegaleseSerbianShoshoneSierra LeoneanSiouxSlavicSlovakSloveneSomaliSouth AfricanSouth AmericanSouth American IndianSoviet UnionSpaniardSpanishSpanish AmericanSpanish American IndianSri LankanSubsaharan AfricanSudaneseSwedishSwissSyrianTaiwaneseThaiTlingit-HaidaTohono O'OdhamTonganTrinidadian and TobagonianTsimshianTurkishU.S. Virgin IslanderUgandanUkrainianUruguayanUteVenezuelanVietnameseWelshWest IndianYakamaYaquiYugoslavianYumanYup'ikZimbabwean
Immigrant Origin (Total)
AfghanistanAfricaAlbaniaArgentinaArmeniaAsiaAustraliaAustriaAzoresBahamasBangladeshBarbadosBelarusBelgiumBelizeBoliviaBosnia and HerzegovinaBrazilBulgariaBurma / MyanmarCabo VerdeCambodiaCameroonCanadaCaribbeanCentral AmericaChileChinaColombiaCongoCosta RicaCroatiaCubaCzechoslovakiaDenmarkDominicaDominican RepublicEastern AfricaEastern AsiaEastern EuropeEcuadorEgyptEl SalvadorEnglandEritreaEthiopiaEuropeFijiFranceGermanyGhanaGreeceGrenadaGuatemalaGuyanaHaitiHondurasHong KongHungaryIndiaIndonesiaIranIraqIrelandIsraelItalyJamaicaJapanJordanKazakhstanKenyaKoreaKuwaitLaosLatin AmericaLatviaLebanonLiberiaLithuaniaMalaysiaMexicoMicronesiaMiddle AfricaMoldovaMoroccoNepalNetherlandsNicaraguaNigeriaNorth MacedoniaNorthern AfricaNorthern EuropeNorwayOceaniaPakistanPanamaPeruPhilippinesPolandPortugalRomaniaRussiaSaudi ArabiaScotlandSenegalSerbiaSierra LeoneSingaporeSomaliaSouth AfricaSouth AmericaSouth Central AsiaSouth Eastern AsiaSouthern EuropeSpainSri LankaSt. Vincent and the GrenadinesSudanSwedenSwitzerlandSyriaTaiwanThailandTrinidad and TobagoTurkeyUgandaUkraineUruguayUzbekistanVenezuelaVietnamWest IndiesWestern AfricaWestern AsiaWestern EuropeYemenZaireZimbabwe
Immigrant Origin (Percentage)
AfghanistanAfricaAlbaniaArgentinaArmeniaAsiaAustraliaAustriaAzoresBahamasBangladeshBarbadosBelarusBelgiumBelizeBoliviaBosnia and HerzegovinaBrazilBulgariaBurma / MyanmarCabo VerdeCambodiaCameroonCanadaCaribbeanCentral AmericaChileChinaColombiaCongoCosta RicaCroatiaCubaCzechoslovakiaDenmarkDominicaDominican RepublicEastern AfricaEastern AsiaEastern EuropeEcuadorEgyptEl SalvadorEnglandEritreaEthiopiaEuropeFijiFranceGermanyGhanaGreeceGrenadaGuatemalaGuyanaHaitiHondurasHong KongHungaryIndiaIndonesiaIranIraqIrelandIsraelItalyJamaicaJapanJordanKazakhstanKenyaKoreaKuwaitLaosLatin AmericaLatviaLebanonLiberiaLithuaniaMalaysiaMexicoMicronesiaMiddle AfricaMoldovaMoroccoNepalNetherlandsNicaraguaNigeriaNorth MacedoniaNorthern AfricaNorthern EuropeNorwayOceaniaPakistanPanamaPeruPhilippinesPolandPortugalRomaniaRussiaSaudi ArabiaScotlandSenegalSerbiaSierra LeoneSingaporeSomaliaSouth AfricaSouth AmericaSouth Central AsiaSouth Eastern AsiaSouthern EuropeSpainSri LankaSt. Vincent and the GrenadinesSudanSwedenSwitzerlandSyriaTaiwanThailandTrinidad and TobagoTurkeyUgandaUkraineUruguayUzbekistanVenezuelaVietnamWest IndiesWestern AfricaWestern AsiaWestern EuropeYemenZaireZimbabwe
Income
Income (Families)
Income (Households)
Poverty
Poverty (Families)
Unemployment
Employment Occupations
Employment Industries
Employer Class
Commute Time
Commute Means
School Enrollment
Education by Degree Field
Occupancy
Finances
Physical Characteristics
Puerto Rico
Compare Cities
Comparison Subject

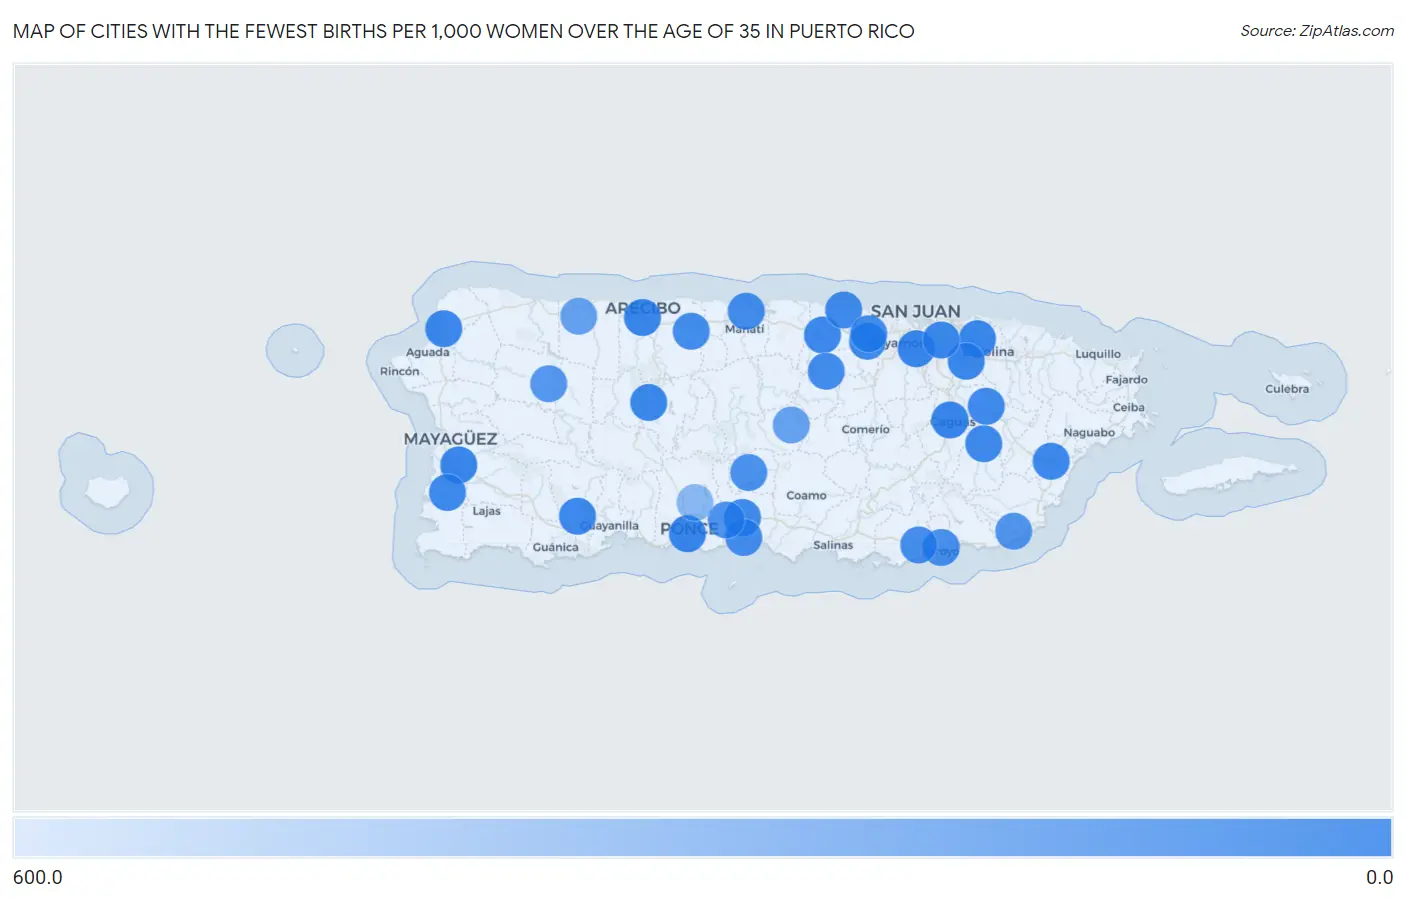
Map of Cities with the Fewest Births per 1,000 Women Over the Age of 35 in Puerto Rico

600.0
0.0
Cities with the Fewest Births per 1,000 Women Over the Age of 35 in Puerto Rico Map

Cities with the Fewest Births per 1,000 Women Over the Age of 35 in Puerto Rico

City Births / 1,000 Women vs State vs National
1.Carolina4.012.0(-8.00)#132.0(-28.0)#79
2.Ponce6.012.0(-6.00)#232.0(-26.0)#173
3.Caguas6.012.0(-6.00)#332.0(-26.0)#174
4.Hormigueros6.012.0(-6.00)#432.0(-26.0)#214
5.Guaynabo7.012.0(-5.00)#532.0(-25.0)#244
6.Arecibo7.012.0(-5.00)#632.0(-25.0)#247
7.Canovanas10.012.0(-2.00)#732.0(-22.0)#574
8.Guanica11.012.0(-1.000)#832.0(-21.0)#746
9.Trujillo Alto12.012.0(=0.000)#932.0(-20.0)#797
10.Utuado12.012.0(=0.000)#1032.0(-20.0)#871
11.San Juan13.012.0(+1.000)#1132.0(-19.0)#910
12.Bayamón13.012.0(+1.000)#1232.0(-19.0)#911
13.Mayaguez13.012.0(+1.000)#1332.0(-19.0)#920
14.Catano17.012.0(+5.00)#1432.0(-15.0)#1,493
15.Yauco19.012.0(+7.00)#1532.0(-13.0)#1,860
16.Rio Grande20.012.0(+8.00)#1632.0(-12.0)#2,034
17.Mansión Del Mar21.012.0(+9.00)#1732.0(-11.0)#2,174
18.Aguadilla23.012.0(+11.0)#1832.0(-9.00)#2,560
19.Vega Alta23.012.0(+11.0)#1932.0(-9.00)#2,571
20.Humacao25.012.0(+13.0)#2032.0(-7.00)#2,918
21.Candelaria27.012.0(+15.0)#2132.0(-5.00)#3,267
22.Cabo Rojo27.012.0(+15.0)#2232.0(-5.00)#3,280
23.San Lorenzo28.012.0(+16.0)#2332.0(-4.00)#3,473
24.Celada35.012.0(+23.0)#2432.0(+3.00)#4,724
25.Dorado36.012.0(+24.0)#2532.0(+4.00)#4,833
26.Piedra Aguza36.012.0(+24.0)#2632.0(+4.00)#4,885
27.San Antonio Comunidad Dorado Municipio37.012.0(+25.0)#2732.0(+5.00)#5,033
28.Candelaria Arenas43.012.0(+31.0)#2832.0(+11.0)#5,875
29.Corozal45.012.0(+33.0)#2932.0(+13.0)#6,086
30.Sabana Hoyos46.012.0(+34.0)#3032.0(+14.0)#6,228
31.Tierras Nuevas Poniente49.012.0(+37.0)#3132.0(+17.0)#6,529
32.Juana Diaz53.012.0(+41.0)#3232.0(+21.0)#6,896
33.Potala Pastillo55.012.0(+43.0)#3332.0(+23.0)#7,124
34.Arroyo61.012.0(+49.0)#3432.0(+29.0)#7,521
35.Guayama64.012.0(+52.0)#3532.0(+32.0)#7,719
36.Mariano Colon70.012.0(+58.0)#3632.0(+38.0)#8,056
37.Villalba71.012.0(+59.0)#3732.0(+39.0)#8,098
38.Aguilita92.012.0(+80.0)#3832.0(+60.0)#8,899
39.Maunabo108.012.0(+96.0)#3932.0(+76.0)#9,320
40.Juncal120.012.0(+108)#4032.0(+88.0)#9,580
41.Alianza188.012.0(+176)#4132.0(+156)#10,298
42.Orocovis193.012.0(+181)#4232.0(+161)#10,331
43.Parcelas Penuelas210.012.0(+198)#4332.0(+178)#10,432
44.El Paraiso338.012.0(+326)#4432.0(+306)#10,803
45.Buena Vista Comunidad Humacao Municipio358.012.0(+346)#4532.0(+326)#10,825
46.Villa De Sabana512.012.0(+500)#4632.0(+480)#10,956

Common Questions

What are the Top 10 Cities with the Fewest Births per 1,000 Women Over the Age of 35 in Puerto Rico?
Top 10 Cities with the Fewest Births per 1,000 Women Over the Age of 35 in Puerto Rico are:
What city has the Fewest Births per 1,000 Women Over the Age of 35 in Puerto Rico?
Carolina has the Fewest Births per 1,000 Women Over the Age of 35 in Puerto Rico with 4.0.
What is the Number of Births per 1,000 Women Over the Age of 35 in the State of Puerto Rico?
Number of Births per 1,000 Women Over the Age of 35 in Puerto Rico is 12.0.
What is the Number of Births per 1,000 Women Over the Age of 35 in the United States?
Number of Births per 1,000 Women Over the Age of 35 in the United States is 32.0.