Stanwood, WA Map & Demographics
Stanwood Map
Stanwood Overview
$39,247
PER CAPITA INCOME
$96,786
AVG FAMILY INCOME
$85,357
AVG HOUSEHOLD INCOME
47.4%
WAGE / INCOME GAP [ % ]
52.6¢/ $1
WAGE / INCOME GAP [ $ ]
0.46
INEQUALITY / GINI INDEX
8,051
TOTAL POPULATION
3,857
MALE POPULATION
4,194
FEMALE POPULATION
91.96
MALES / 100 FEMALES
108.74
FEMALES / 100 MALES
34.4
MEDIAN AGE
3.5
AVG FAMILY SIZE
2.7
AVG HOUSEHOLD SIZE
3,507
LABOR FORCE [ PEOPLE ]
58.1%
PERCENT IN LABOR FORCE
1.5%
UNEMPLOYMENT RATE
Stanwood Zip Codes
Stanwood Area Codes
Income in Stanwood
Income Overview in Stanwood
Per Capita Income in Stanwood is $39,247, while median incomes of families and households are $96,786 and $85,357 respectively.
| Characteristic | Number | Measure |
| Per Capita Income | 8,051 | $39,247 |
| Median Family Income | 1,842 | $96,786 |
| Mean Family Income | 1,842 | $127,049 |
| Median Household Income | 2,884 | $85,357 |
| Mean Household Income | 2,884 | $106,822 |
| Income Deficit | 1,842 | $0 |
| Wage / Income Gap (%) | 8,051 | 47.38% |
| Wage / Income Gap ($) | 8,051 | 52.62¢ per $1 |
| Gini / Inequality Index | 8,051 | 0.46 |
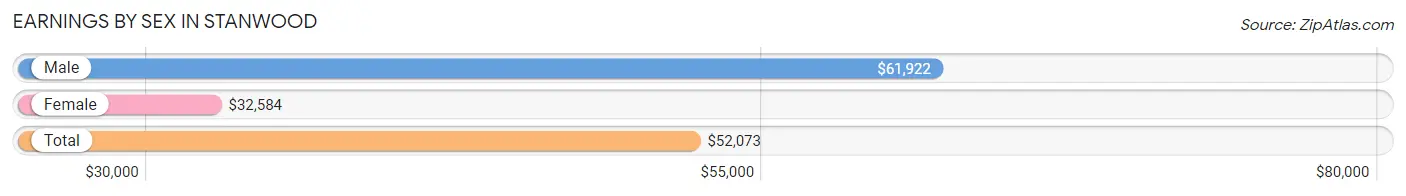
Earnings by Sex in Stanwood
Average Earnings in Stanwood are $52,073, $61,922 for men and $32,584 for women, a difference of 47.4%.
| Sex | Number | Average Earnings |
| Male | 2,255 (59.1%) | $61,922 |
| Female | 1,564 (40.9%) | $32,584 |
| Total | 3,819 (100.0%) | $52,073 |
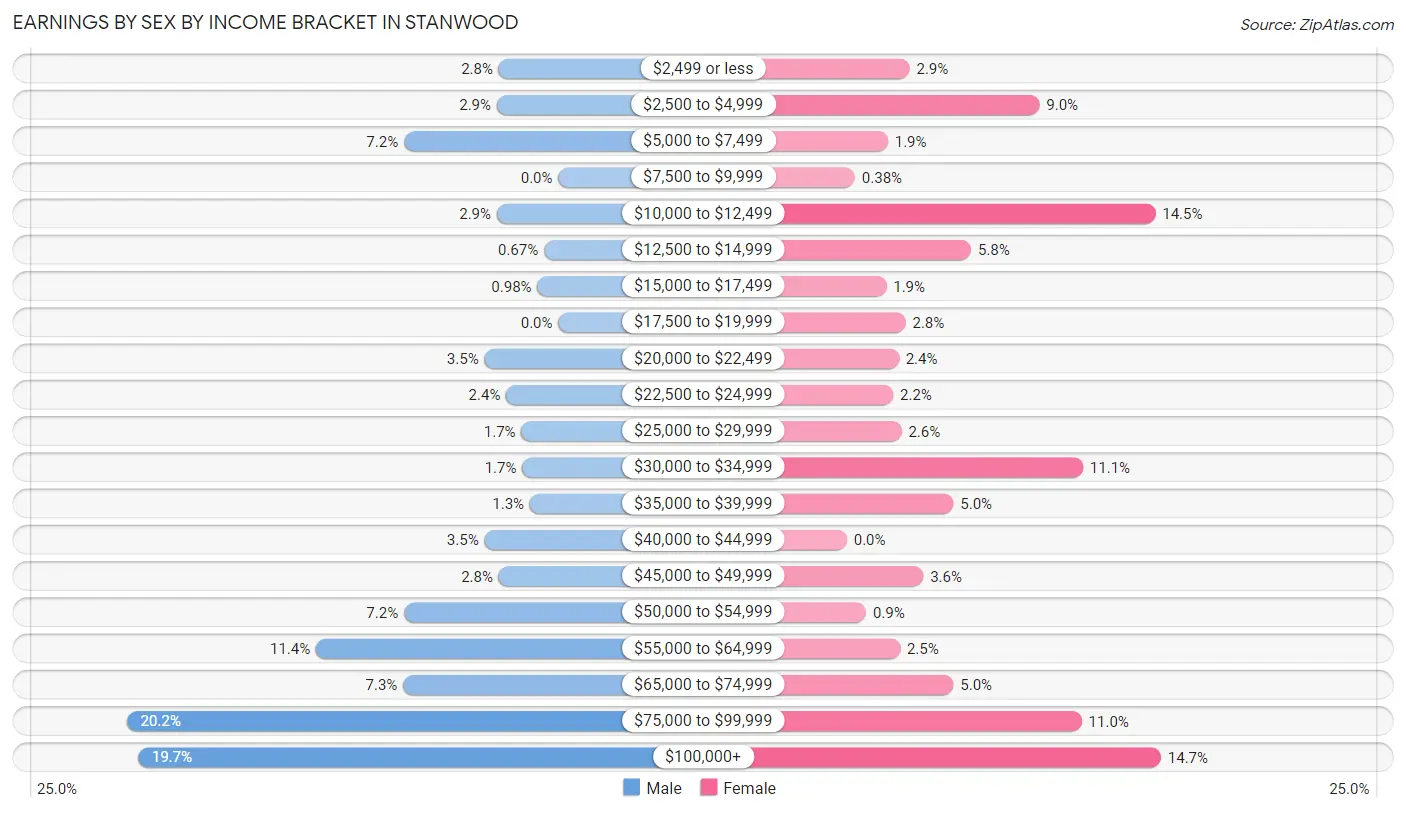
Earnings by Sex by Income Bracket in Stanwood
The most common earnings brackets in Stanwood are $75,000 to $99,999 for men (455 | 20.2%) and $100,000+ for women (230 | 14.7%).
| Income | Male | Female |
| $2,499 or less | 63 (2.8%) | 46 (2.9%) |
| $2,500 to $4,999 | 65 (2.9%) | 141 (9.0%) |
| $5,000 to $7,499 | 163 (7.2%) | 30 (1.9%) |
| $7,500 to $9,999 | 0 (0.0%) | 6 (0.4%) |
| $10,000 to $12,499 | 65 (2.9%) | 226 (14.4%) |
| $12,500 to $14,999 | 15 (0.7%) | 91 (5.8%) |
| $15,000 to $17,499 | 22 (1.0%) | 29 (1.8%) |
| $17,500 to $19,999 | 0 (0.0%) | 43 (2.8%) |
| $20,000 to $22,499 | 78 (3.5%) | 38 (2.4%) |
| $22,500 to $24,999 | 55 (2.4%) | 34 (2.2%) |
| $25,000 to $29,999 | 39 (1.7%) | 40 (2.6%) |
| $30,000 to $34,999 | 38 (1.7%) | 173 (11.1%) |
| $35,000 to $39,999 | 30 (1.3%) | 78 (5.0%) |
| $40,000 to $44,999 | 78 (3.5%) | 0 (0.0%) |
| $45,000 to $49,999 | 63 (2.8%) | 56 (3.6%) |
| $50,000 to $54,999 | 163 (7.2%) | 14 (0.9%) |
| $55,000 to $64,999 | 256 (11.4%) | 39 (2.5%) |
| $65,000 to $74,999 | 164 (7.3%) | 78 (5.0%) |
| $75,000 to $99,999 | 455 (20.2%) | 172 (11.0%) |
| $100,000+ | 443 (19.7%) | 230 (14.7%) |
| Total | 2,255 (100.0%) | 1,564 (100.0%) |
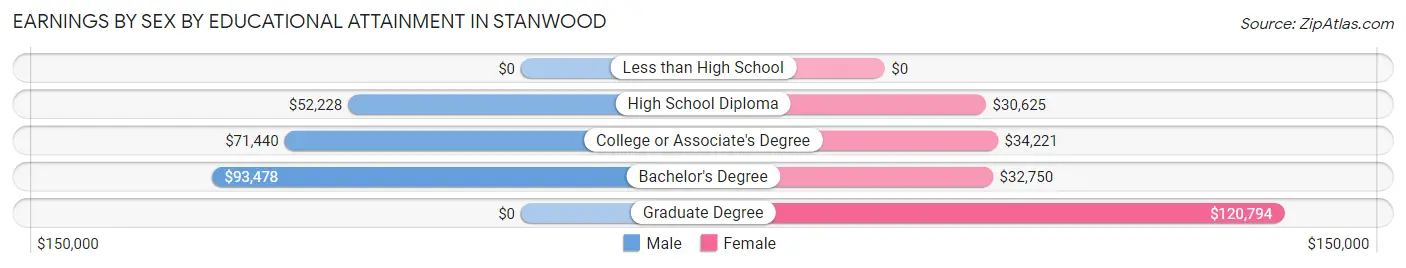
Earnings by Sex by Educational Attainment in Stanwood
Average earnings in Stanwood are $70,584 for men and $34,706 for women, a difference of 50.8%. Men with an educational attainment of bachelor's degree enjoy the highest average annual earnings of $93,478, while those with high school diploma education earn the least with $52,228. Women with an educational attainment of graduate degree earn the most with the average annual earnings of $120,794, while those with high school diploma education have the smallest earnings of $30,625.
| Educational Attainment | Male Income | Female Income |
| Less than High School | - | - |
| High School Diploma | $52,228 | $30,625 |
| College or Associate's Degree | $71,440 | $34,221 |
| Bachelor's Degree | $93,478 | $32,750 |
| Graduate Degree | - | - |
| Total | $70,584 | $34,706 |
Family Income in Stanwood
Family Income Brackets in Stanwood
According to the Stanwood family income data, there are 426 families falling into the $100,000 to $149,999 income range, which is the most common income bracket and makes up 23.1% of all families.
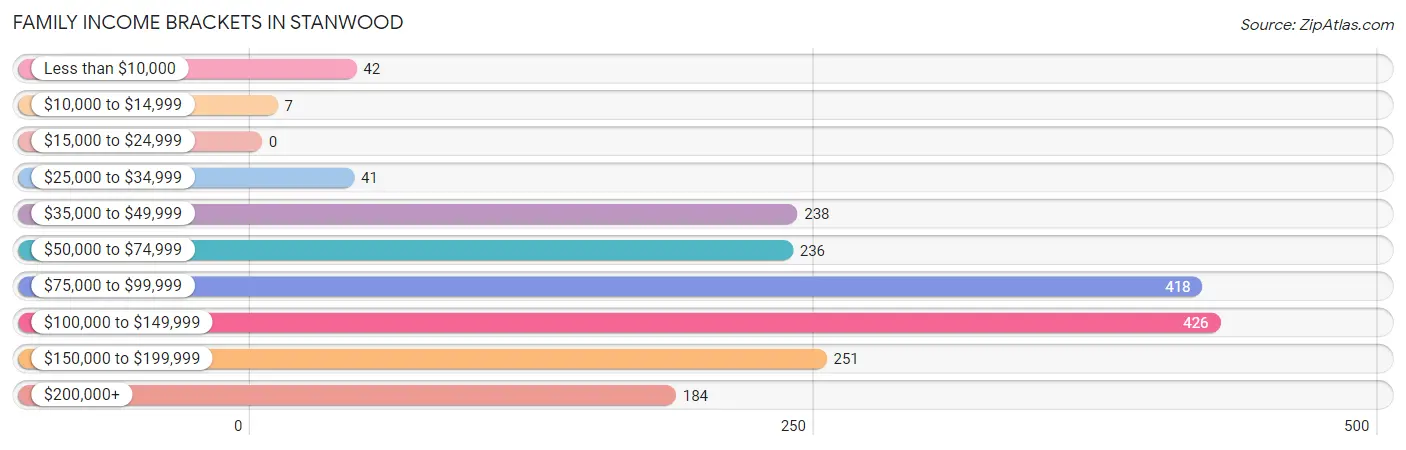
| Income Bracket | # Families | % Families |
| Less than $10,000 | 42 | 2.3% |
| $10,000 to $14,999 | 7 | 0.4% |
| $15,000 to $24,999 | 0 | 0.0% |
| $25,000 to $34,999 | 41 | 2.2% |
| $35,000 to $49,999 | 238 | 12.9% |
| $50,000 to $74,999 | 236 | 12.8% |
| $75,000 to $99,999 | 418 | 22.7% |
| $100,000 to $149,999 | 426 | 23.1% |
| $150,000 to $199,999 | 251 | 13.6% |
| $200,000+ | 184 | 10.0% |
Family Income by Famaliy Size in Stanwood
5-person families (363 | 19.7%) account for the highest median family income in Stanwood with $137,969 per family, while 2-person families (650 | 35.3%) have the highest median income of $48,992 per family member.
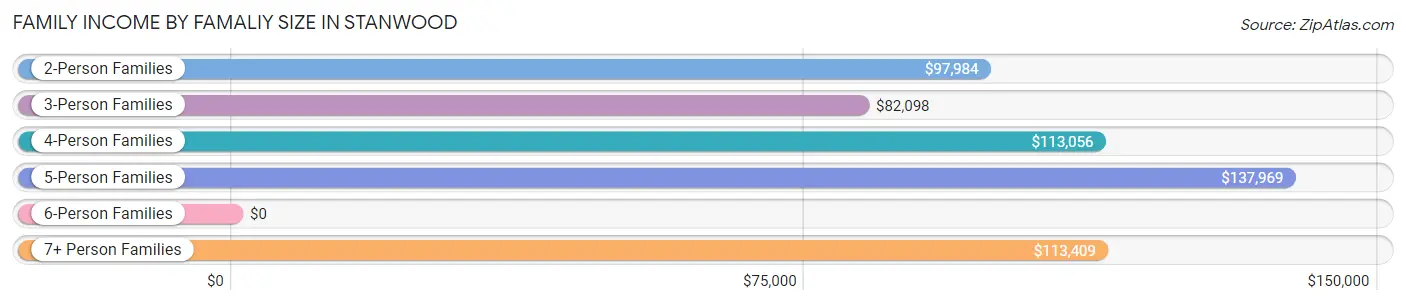
| Income Bracket | # Families | Median Income |
| 2-Person Families | 650 (35.3%) | $97,984 |
| 3-Person Families | 385 (20.9%) | $82,098 |
| 4-Person Families | 326 (17.7%) | $113,056 |
| 5-Person Families | 363 (19.7%) | $137,969 |
| 6-Person Families | 78 (4.2%) | $0 |
| 7+ Person Families | 40 (2.2%) | $113,409 |
| Total | 1,842 (100.0%) | $96,786 |
Family Income by Number of Earners in Stanwood
The median family income in Stanwood is $96,786, with families comprising 3+ earners (155) having the highest median family income of $250,001, while families with 1 earner (878) have the lowest median family income of $85,923, accounting for 8.4% and 47.7% of families, respectively.
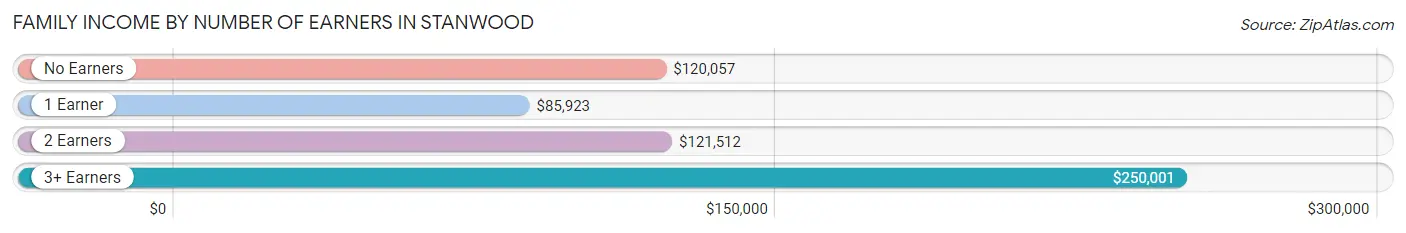
| Number of Earners | # Families | Median Income |
| No Earners | 125 (6.8%) | $120,057 |
| 1 Earner | 878 (47.7%) | $85,923 |
| 2 Earners | 684 (37.1%) | $121,512 |
| 3+ Earners | 155 (8.4%) | $250,001 |
| Total | 1,842 (100.0%) | $96,786 |
Household Income in Stanwood
Household Income Brackets in Stanwood
With 542 households falling in the category, the $75,000 to $99,999 income range is the most frequent in Stanwood, accounting for 18.8% of all households. In contrast, only 81 households (2.8%) fall into the $15,000 to $24,999 income bracket, making it the least populous group.
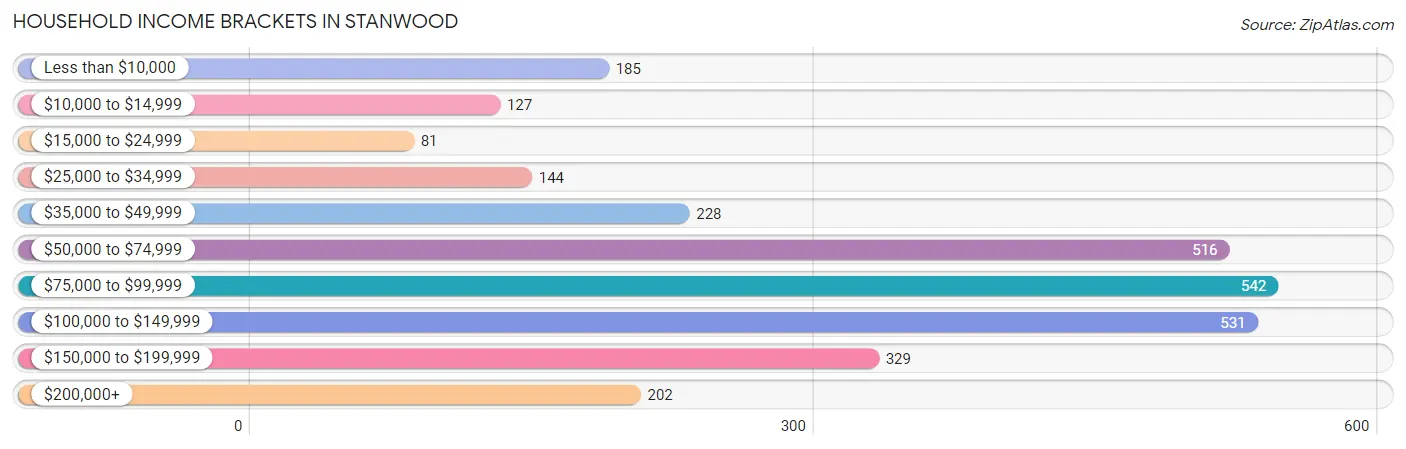
| Income Bracket | # Households | % Households |
| Less than $10,000 | 185 | 6.4% |
| $10,000 to $14,999 | 127 | 4.4% |
| $15,000 to $24,999 | 81 | 2.8% |
| $25,000 to $34,999 | 144 | 5.0% |
| $35,000 to $49,999 | 228 | 7.9% |
| $50,000 to $74,999 | 516 | 17.9% |
| $75,000 to $99,999 | 542 | 18.8% |
| $100,000 to $149,999 | 531 | 18.4% |
| $150,000 to $199,999 | 329 | 11.4% |
| $200,000+ | 202 | 7.0% |
Household Income by Householder Age in Stanwood
The median household income in Stanwood is $85,357, with the highest median household income of $96,034 found in the 45 to 64 years age bracket for the primary householder. A total of 1,082 households (37.5%) fall into this category. Meanwhile, the 65+ years age bracket for the primary householder has the lowest median household income of $44,375, with 734 households (25.5%) in this group.
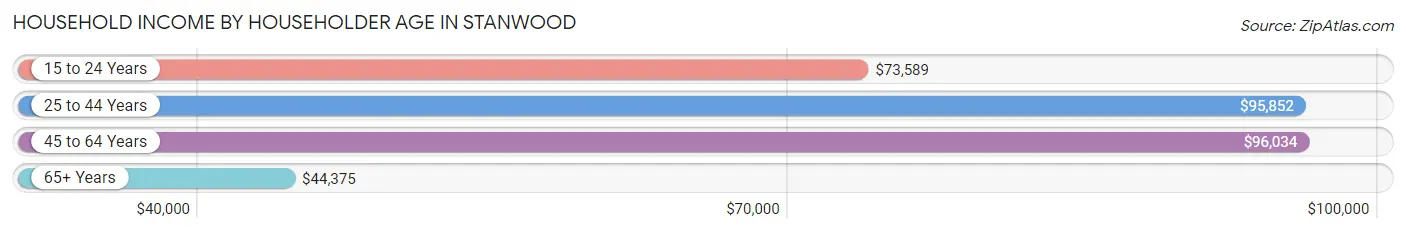
| Income Bracket | # Households | Median Income |
| 15 to 24 Years | 81 (2.8%) | $73,589 |
| 25 to 44 Years | 987 (34.2%) | $95,852 |
| 45 to 64 Years | 1,082 (37.5%) | $96,034 |
| 65+ Years | 734 (25.5%) | $44,375 |
| Total | 2,884 (100.0%) | $85,357 |
Poverty in Stanwood
Income Below Poverty by Sex and Age in Stanwood
With 2.2% poverty level for males and 11.0% for females among the residents of Stanwood, 65 to 74 year old males and 18 to 24 year old females are the most vulnerable to poverty, with 27 males (11.4%) and 93 females (29.4%) in their respective age groups living below the poverty level.
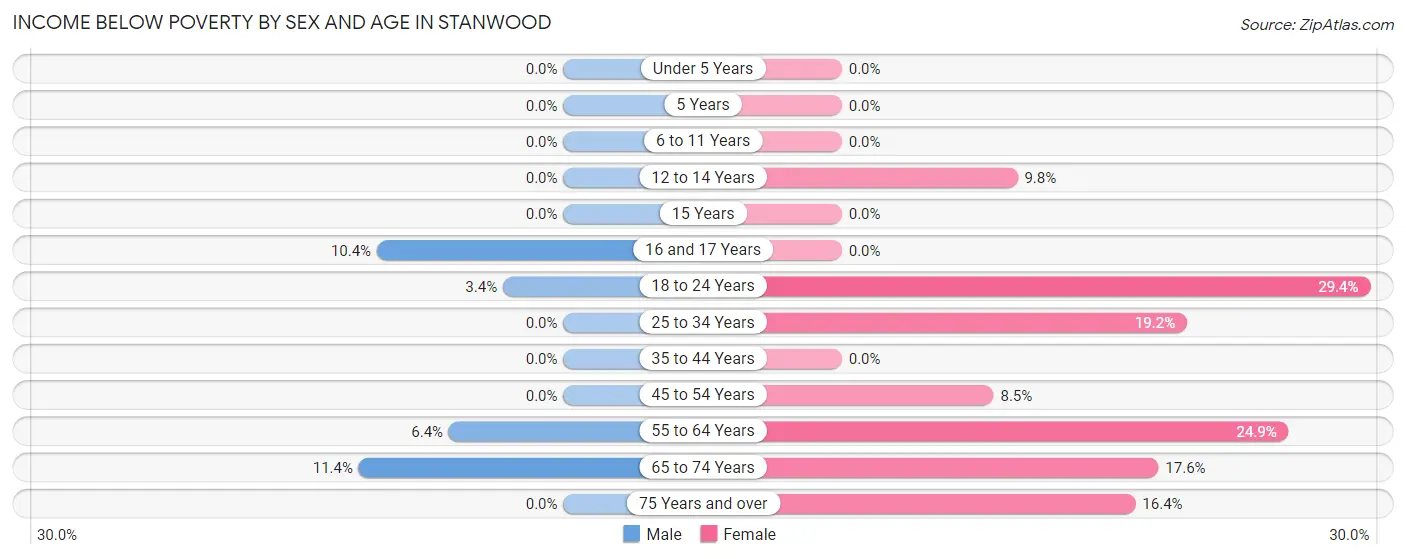
| Age Bracket | Male | Female |
| Under 5 Years | 0 (0.0%) | 0 (0.0%) |
| 5 Years | 0 (0.0%) | 0 (0.0%) |
| 6 to 11 Years | 0 (0.0%) | 0 (0.0%) |
| 12 to 14 Years | 0 (0.0%) | 22 (9.8%) |
| 15 Years | 0 (0.0%) | 0 (0.0%) |
| 16 and 17 Years | 22 (10.4%) | 0 (0.0%) |
| 18 to 24 Years | 11 (3.4%) | 93 (29.4%) |
| 25 to 34 Years | 0 (0.0%) | 84 (19.2%) |
| 35 to 44 Years | 0 (0.0%) | 0 (0.0%) |
| 45 to 54 Years | 0 (0.0%) | 37 (8.5%) |
| 55 to 64 Years | 23 (6.4%) | 101 (24.9%) |
| 65 to 74 Years | 27 (11.4%) | 70 (17.6%) |
| 75 Years and over | 0 (0.0%) | 43 (16.4%) |
| Total | 83 (2.2%) | 450 (11.0%) |
Income Above Poverty by Sex and Age in Stanwood
According to the poverty statistics in Stanwood, males aged under 5 years and females aged under 5 years are the age groups that are most secure financially, with 100.0% of males and 100.0% of females in these age groups living above the poverty line.
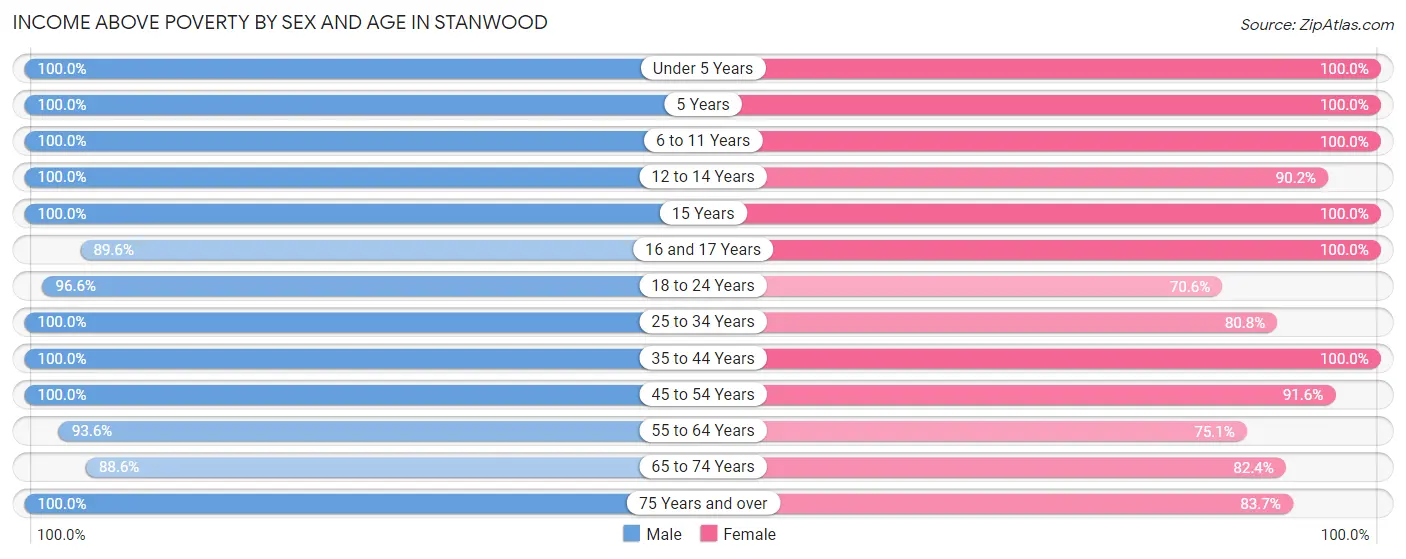
| Age Bracket | Male | Female |
| Under 5 Years | 177 (100.0%) | 297 (100.0%) |
| 5 Years | 43 (100.0%) | 59 (100.0%) |
| 6 to 11 Years | 383 (100.0%) | 402 (100.0%) |
| 12 to 14 Years | 316 (100.0%) | 203 (90.2%) |
| 15 Years | 36 (100.0%) | 57 (100.0%) |
| 16 and 17 Years | 190 (89.6%) | 169 (100.0%) |
| 18 to 24 Years | 316 (96.6%) | 223 (70.6%) |
| 25 to 34 Years | 611 (100.0%) | 353 (80.8%) |
| 35 to 44 Years | 512 (100.0%) | 636 (100.0%) |
| 45 to 54 Years | 422 (100.0%) | 401 (91.5%) |
| 55 to 64 Years | 338 (93.6%) | 305 (75.1%) |
| 65 to 74 Years | 210 (88.6%) | 327 (82.4%) |
| 75 Years and over | 139 (100.0%) | 220 (83.7%) |
| Total | 3,693 (97.8%) | 3,652 (89.0%) |
Income Below Poverty Among Married-Couple Families in Stanwood
The poverty statistics for married-couple families in Stanwood show that 2.0% or 27 of the total 1,347 families live below the poverty line. Families with no children have the highest poverty rate of 4.4%, comprising of 27 families. On the other hand, families with 1 or 2 children have the lowest poverty rate of 0.0%, which includes 0 families.
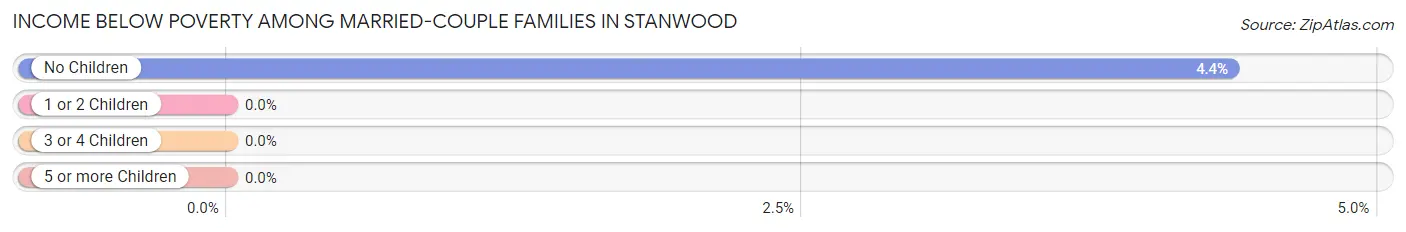
| Children | Above Poverty | Below Poverty |
| No Children | 592 (95.6%) | 27 (4.4%) |
| 1 or 2 Children | 376 (100.0%) | 0 (0.0%) |
| 3 or 4 Children | 328 (100.0%) | 0 (0.0%) |
| 5 or more Children | 24 (100.0%) | 0 (0.0%) |
| Total | 1,320 (98.0%) | 27 (2.0%) |
Income Below Poverty Among Single-Parent Households in Stanwood
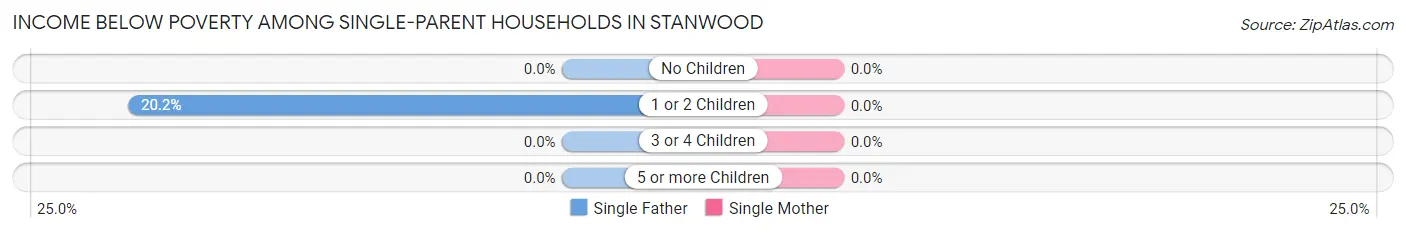
| Children | Single Father | Single Mother |
| No Children | 0 (0.0%) | 0 (0.0%) |
| 1 or 2 Children | 23 (20.2%) | 0 (0.0%) |
| 3 or 4 Children | 0 (0.0%) | 0 (0.0%) |
| 5 or more Children | 0 (0.0%) | 0 (0.0%) |
| Total | 23 (13.9%) | 0 (0.0%) |
Income Below Poverty Among Married-Couple vs Single-Parent Households in Stanwood
The poverty data for Stanwood shows that 27 of the married-couple family households (2.0%) and 23 of the single-parent households (4.6%) are living below the poverty level. Within the married-couple family households, those with no children have the highest poverty rate, with 27 households (4.4%) falling below the poverty line. Among the single-parent households, those with 1 or 2 children have the highest poverty rate, with 23 household (7.4%) living below poverty.
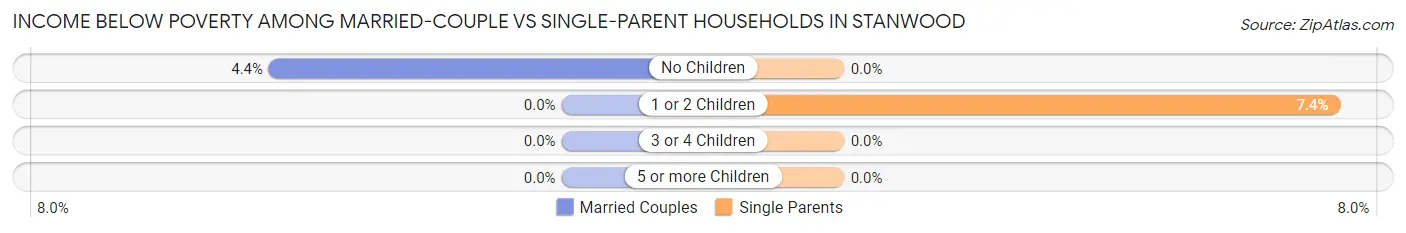
| Children | Married-Couple Families | Single-Parent Households |
| No Children | 27 (4.4%) | 0 (0.0%) |
| 1 or 2 Children | 0 (0.0%) | 23 (7.4%) |
| 3 or 4 Children | 0 (0.0%) | 0 (0.0%) |
| 5 or more Children | 0 (0.0%) | 0 (0.0%) |
| Total | 27 (2.0%) | 23 (4.6%) |
Race in Stanwood
The most populous races in Stanwood are White / Caucasian (7,007 | 87.0%), Two or more Races (534 | 6.6%), and Native / Alaskan (259 | 3.2%).
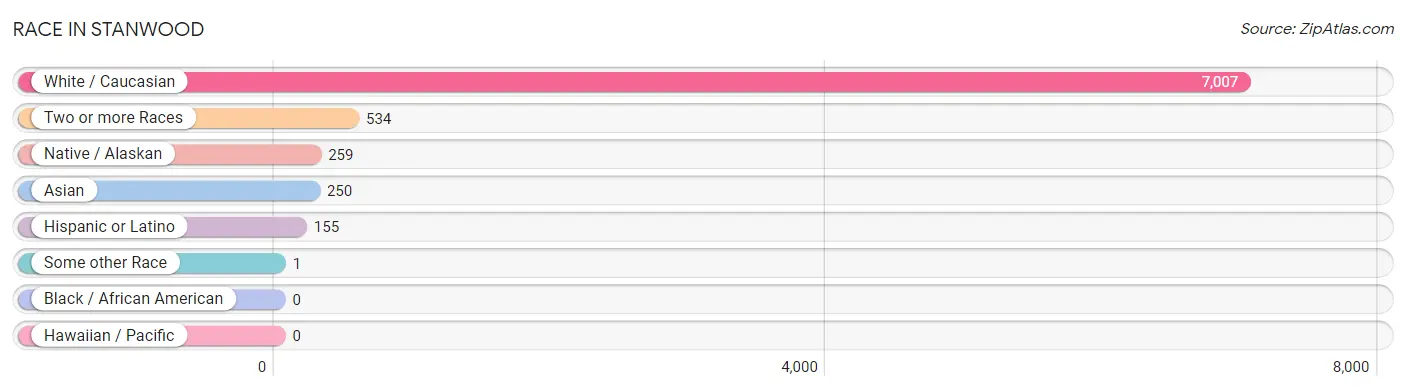
| Race | # Population | % Population |
| Asian | 250 | 3.1% |
| Black / African American | 0 | 0.0% |
| Hawaiian / Pacific | 0 | 0.0% |
| Hispanic or Latino | 155 | 1.9% |
| Native / Alaskan | 259 | 3.2% |
| White / Caucasian | 7,007 | 87.0% |
| Two or more Races | 534 | 6.6% |
| Some other Race | 1 | 0.0% |
| Total | 8,051 | 100.0% |
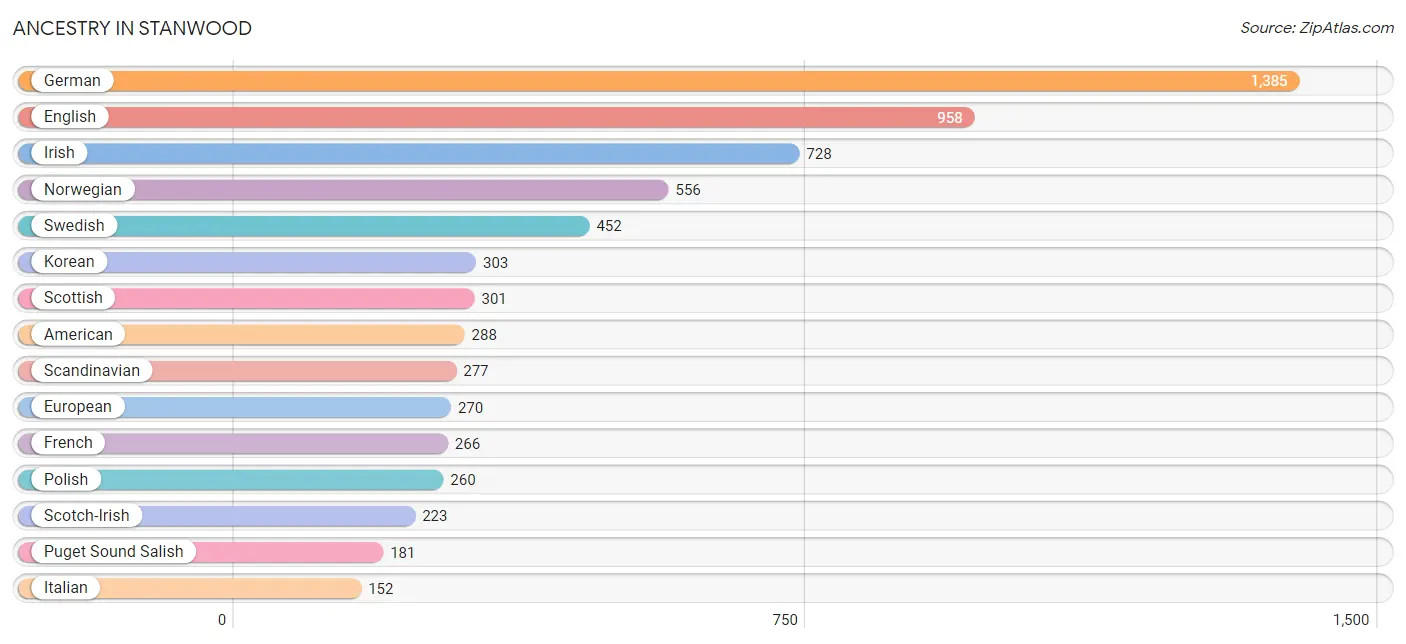
Ancestry in Stanwood
The most populous ancestries reported in Stanwood are German (1,385 | 17.2%), English (958 | 11.9%), Irish (728 | 9.0%), Norwegian (556 | 6.9%), and Swedish (452 | 5.6%), together accounting for 50.7% of all Stanwood residents.
| Ancestry | # Population | % Population |
| Alaskan Athabascan | 38 | 0.5% |
| American | 288 | 3.6% |
| Arab | 23 | 0.3% |
| Austrian | 19 | 0.2% |
| Bhutanese | 69 | 0.9% |
| British | 150 | 1.9% |
| Cherokee | 63 | 0.8% |
| Choctaw | 13 | 0.2% |
| Danish | 75 | 0.9% |
| Dutch | 112 | 1.4% |
| English | 958 | 11.9% |
| Estonian | 29 | 0.4% |
| European | 270 | 3.4% |
| Finnish | 40 | 0.5% |
| French | 266 | 3.3% |
| French American Indian | 47 | 0.6% |
| French Canadian | 59 | 0.7% |
| German | 1,385 | 17.2% |
| Greek | 108 | 1.3% |
| Hungarian | 19 | 0.2% |
| Inupiat | 78 | 1.0% |
| Irish | 728 | 9.0% |
| Italian | 152 | 1.9% |
| Korean | 303 | 3.8% |
| Latvian | 19 | 0.2% |
| Lebanese | 23 | 0.3% |
| Mexican | 51 | 0.6% |
| Mexican American Indian | 24 | 0.3% |
| Northern European | 33 | 0.4% |
| Norwegian | 556 | 6.9% |
| Polish | 260 | 3.2% |
| Portuguese | 82 | 1.0% |
| Puget Sound Salish | 181 | 2.2% |
| Russian | 17 | 0.2% |
| Scandinavian | 277 | 3.4% |
| Scotch-Irish | 223 | 2.8% |
| Scottish | 301 | 3.7% |
| Sioux | 7 | 0.1% |
| Slovak | 34 | 0.4% |
| Spaniard | 38 | 0.5% |
| Spanish | 66 | 0.8% |
| Sri Lankan | 24 | 0.3% |
| Swedish | 452 | 5.6% |
| Ukrainian | 79 | 1.0% |
| Welsh | 50 | 0.6% |
| Yup'ik | 78 | 1.0% | View All 46 Rows |
Immigrants in Stanwood
The most numerous immigrant groups reported in Stanwood came from Asia (211 | 2.6%), South Eastern Asia (130 | 1.6%), Philippines (118 | 1.5%), Europe (85 | 1.1%), and Pakistan (59 | 0.7%), together accounting for 7.5% of all Stanwood residents.
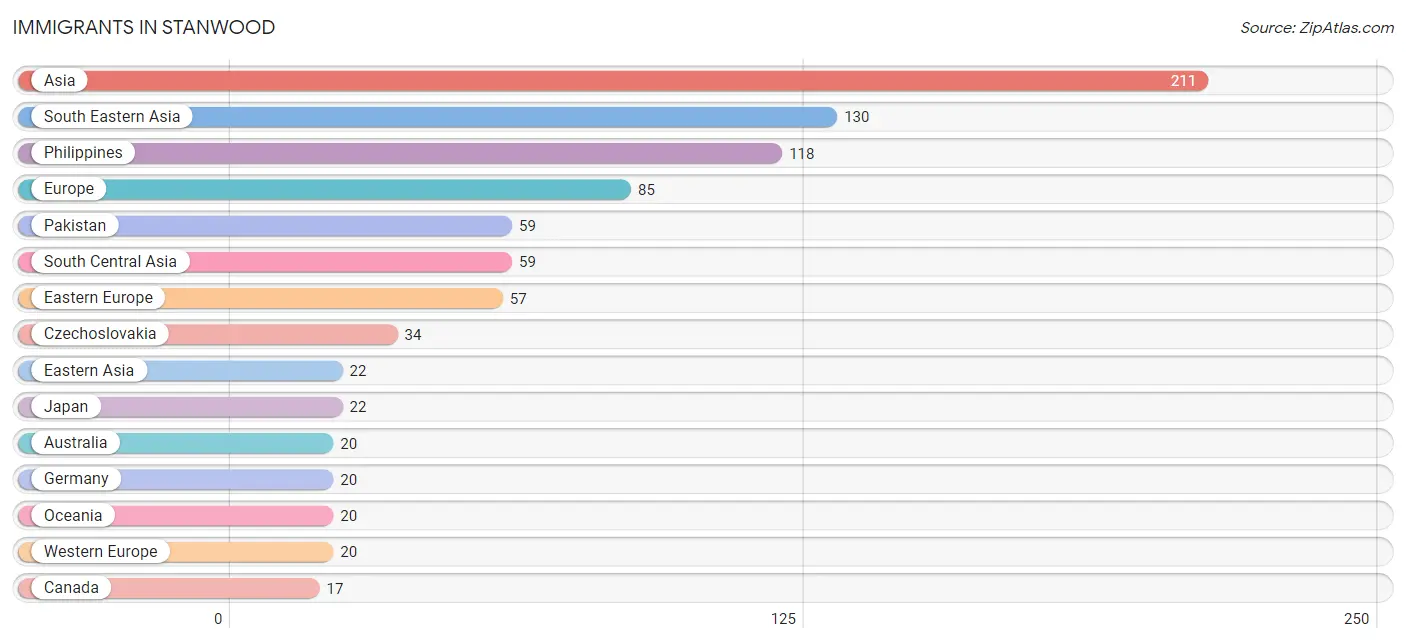
| Immigration Origin | # Population | % Population |
| Asia | 211 | 2.6% |
| Australia | 20 | 0.3% |
| Canada | 17 | 0.2% |
| Czechoslovakia | 34 | 0.4% |
| Eastern Asia | 22 | 0.3% |
| Eastern Europe | 57 | 0.7% |
| England | 8 | 0.1% |
| Europe | 85 | 1.1% |
| Germany | 20 | 0.3% |
| Japan | 22 | 0.3% |
| Northern Europe | 8 | 0.1% |
| Oceania | 20 | 0.3% |
| Pakistan | 59 | 0.7% |
| Philippines | 118 | 1.5% |
| South Central Asia | 59 | 0.7% |
| South Eastern Asia | 130 | 1.6% |
| Ukraine | 16 | 0.2% |
| Vietnam | 12 | 0.2% |
| Western Europe | 20 | 0.3% | View All 19 Rows |
Sex and Age in Stanwood
Sex and Age in Stanwood
The most populous age groups in Stanwood are 5 to 9 Years (397 | 10.3%) for men and 35 to 39 Years (404 | 9.6%) for women.
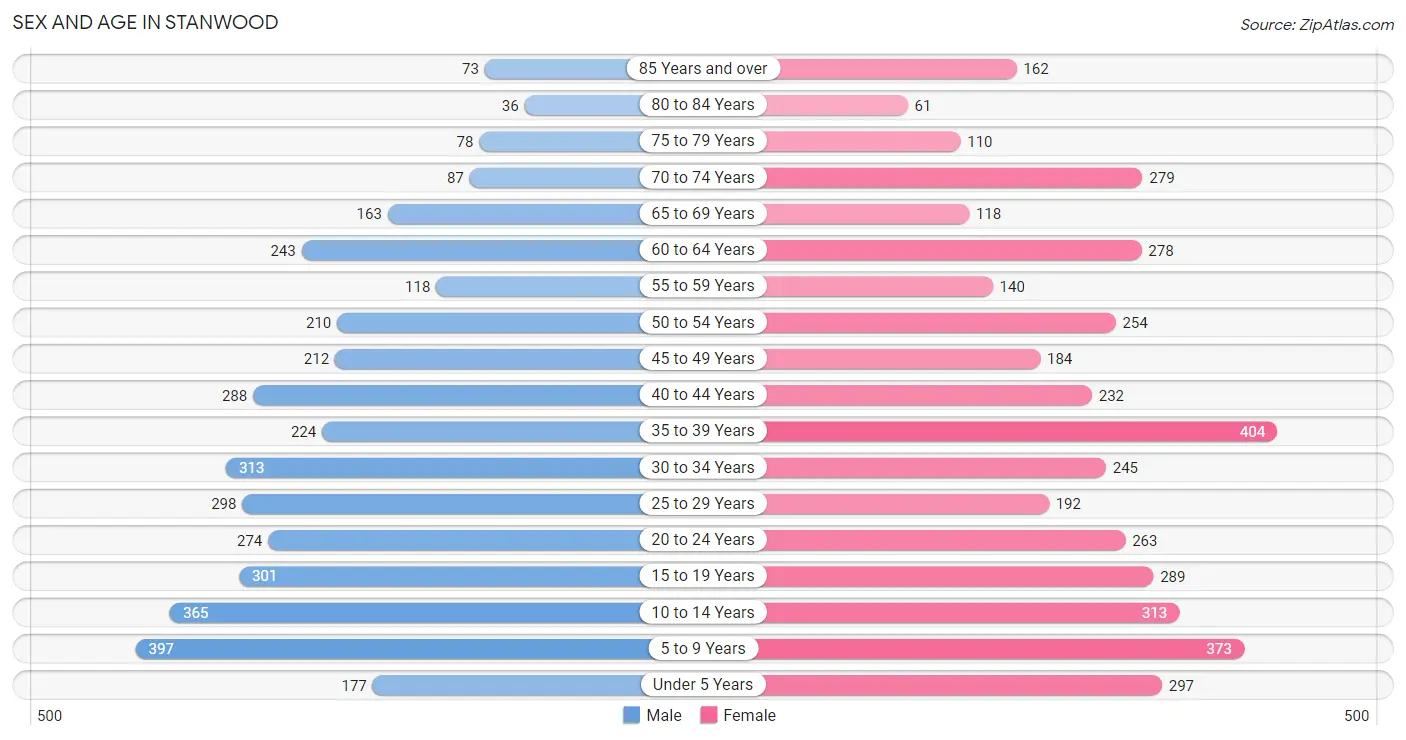
| Age Bracket | Male | Female |
| Under 5 Years | 177 (4.6%) | 297 (7.1%) |
| 5 to 9 Years | 397 (10.3%) | 373 (8.9%) |
| 10 to 14 Years | 365 (9.5%) | 313 (7.5%) |
| 15 to 19 Years | 301 (7.8%) | 289 (6.9%) |
| 20 to 24 Years | 274 (7.1%) | 263 (6.3%) |
| 25 to 29 Years | 298 (7.7%) | 192 (4.6%) |
| 30 to 34 Years | 313 (8.1%) | 245 (5.8%) |
| 35 to 39 Years | 224 (5.8%) | 404 (9.6%) |
| 40 to 44 Years | 288 (7.5%) | 232 (5.5%) |
| 45 to 49 Years | 212 (5.5%) | 184 (4.4%) |
| 50 to 54 Years | 210 (5.4%) | 254 (6.1%) |
| 55 to 59 Years | 118 (3.1%) | 140 (3.3%) |
| 60 to 64 Years | 243 (6.3%) | 278 (6.6%) |
| 65 to 69 Years | 163 (4.2%) | 118 (2.8%) |
| 70 to 74 Years | 87 (2.3%) | 279 (6.7%) |
| 75 to 79 Years | 78 (2.0%) | 110 (2.6%) |
| 80 to 84 Years | 36 (0.9%) | 61 (1.5%) |
| 85 Years and over | 73 (1.9%) | 162 (3.9%) |
| Total | 3,857 (100.0%) | 4,194 (100.0%) |
Families and Households in Stanwood
Median Family Size in Stanwood
The median family size in Stanwood is 3.48 persons per family, with married-couple families (1,347 | 73.1%) accounting for the largest median family size of 3.61 persons per family. On the other hand, single male/father families (166 | 9.0%) represent the smallest median family size with 3.12 persons per family.
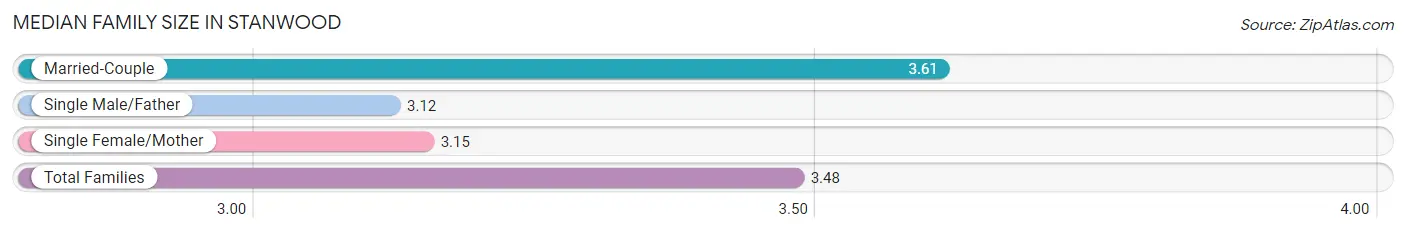
| Family Type | # Families | Family Size |
| Married-Couple | 1,347 (73.1%) | 3.61 |
| Single Male/Father | 166 (9.0%) | 3.12 |
| Single Female/Mother | 329 (17.9%) | 3.15 |
| Total Families | 1,842 (100.0%) | 3.48 |
Median Household Size in Stanwood
The median household size in Stanwood is 2.73 persons per household, with single male/father households (166 | 5.8%) accounting for the largest median household size of 3.67 persons per household. non-family households (1,042 | 36.1%) represent the smallest median household size with 1.19 persons per household.
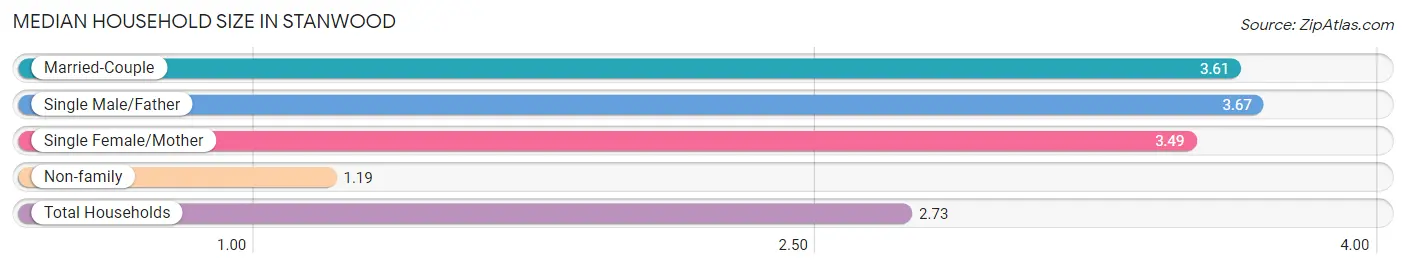
| Household Type | # Households | Household Size |
| Married-Couple | 1,347 (46.7%) | 3.61 |
| Single Male/Father | 166 (5.8%) | 3.67 |
| Single Female/Mother | 329 (11.4%) | 3.49 |
| Non-family | 1,042 (36.1%) | 1.19 |
| Total Households | 2,884 (100.0%) | 2.73 |
Household Size by Marriage Status in Stanwood
Out of a total of 2,884 households in Stanwood, 1,842 (63.9%) are family households, while 1,042 (36.1%) are nonfamily households. The most numerous type of family households are 2-person households, comprising 612, and the most common type of nonfamily households are 1-person households, comprising 859.
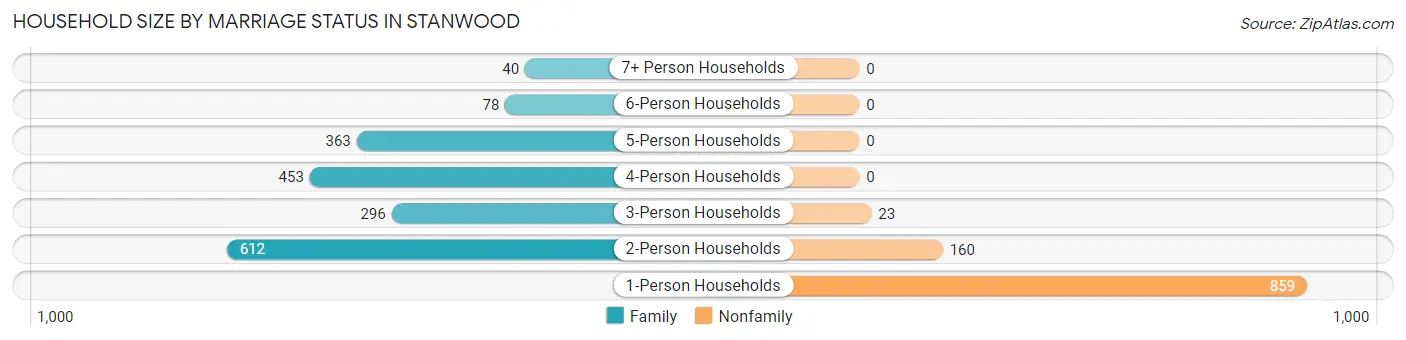
| Household Size | Family Households | Nonfamily Households |
| 1-Person Households | - | 859 (29.8%) |
| 2-Person Households | 612 (21.2%) | 160 (5.6%) |
| 3-Person Households | 296 (10.3%) | 23 (0.8%) |
| 4-Person Households | 453 (15.7%) | 0 (0.0%) |
| 5-Person Households | 363 (12.6%) | 0 (0.0%) |
| 6-Person Households | 78 (2.7%) | 0 (0.0%) |
| 7+ Person Households | 40 (1.4%) | 0 (0.0%) |
| Total | 1,842 (63.9%) | 1,042 (36.1%) |
Female Fertility in Stanwood
Fertility by Age in Stanwood
Average fertility rate in Stanwood is 48.0 births per 1,000 women. Women in the age bracket of 20 to 34 years have the highest fertility rate with 129.0 births per 1,000 women. Women in the age bracket of 20 to 34 years acount for 100.0% of all women with births.
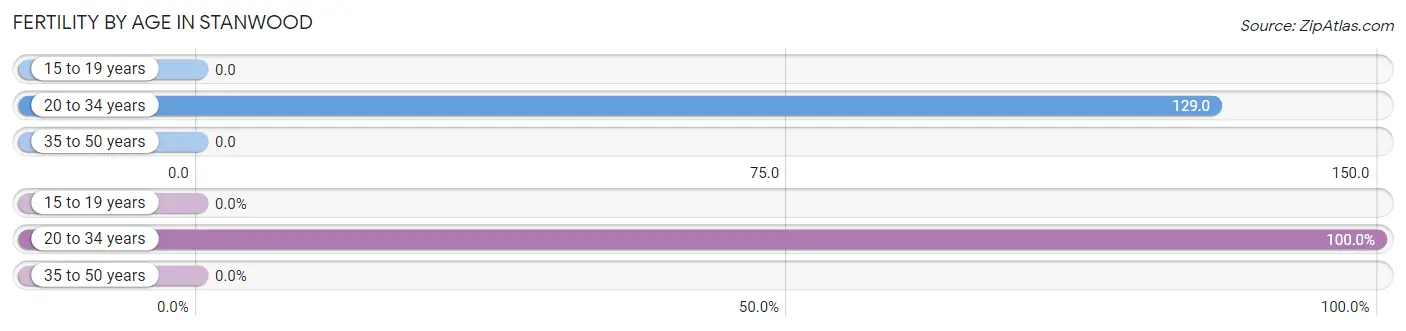
| Age Bracket | Women with Births | Births / 1,000 Women |
| 15 to 19 years | 0 (0.0%) | 0.0 |
| 20 to 34 years | 90 (100.0%) | 129.0 |
| 35 to 50 years | 0 (0.0%) | 0.0 |
| Total | 90 (100.0%) | 48.0 |
Fertility by Age by Marriage Status in Stanwood
82.2% of women with births (90) in Stanwood are married. The highest percentage of unmarried women with births falls into 20 to 34 years age bracket with 17.8% of them unmarried at the time of birth, while the lowest percentage of unmarried women with births belong to 20 to 34 years age bracket with 17.8% of them unmarried.
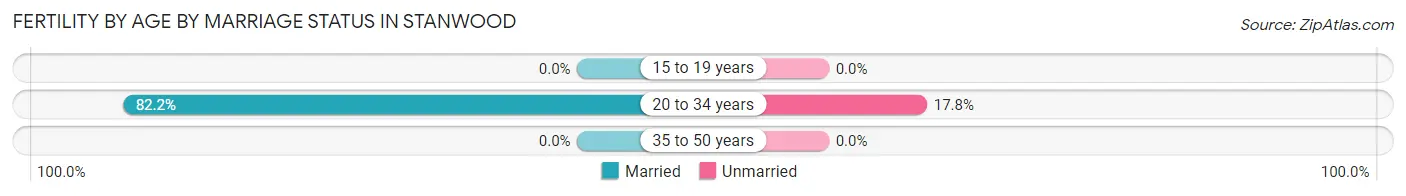
| Age Bracket | Married | Unmarried |
| 15 to 19 years | 0 (0.0%) | 0 (0.0%) |
| 20 to 34 years | 74 (82.2%) | 16 (17.8%) |
| 35 to 50 years | 0 (0.0%) | 0 (0.0%) |
| Total | 74 (82.2%) | 16 (17.8%) |
Fertility by Education in Stanwood
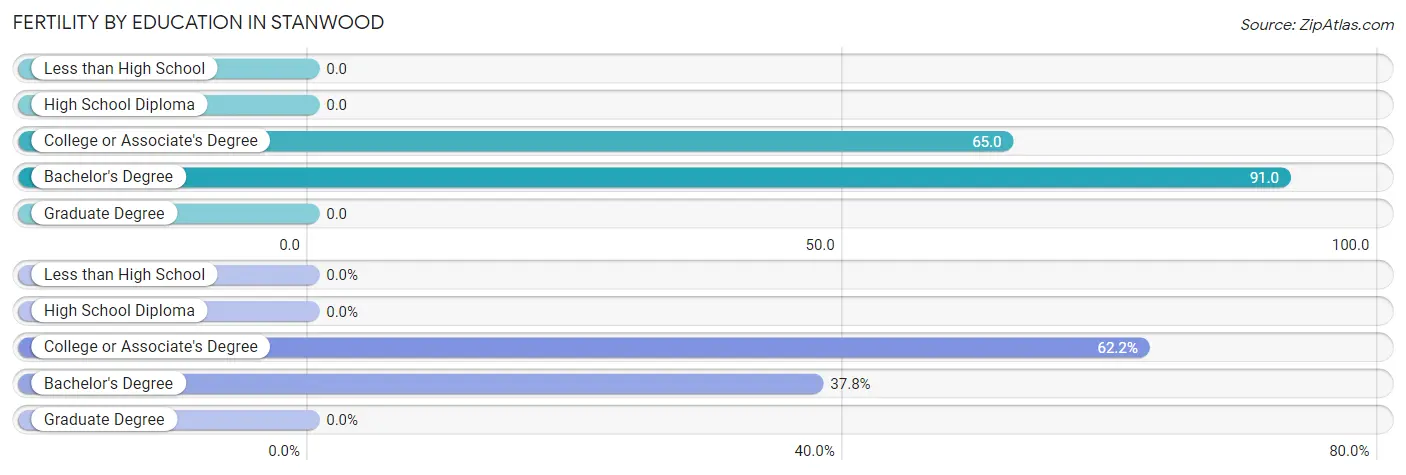
| Educational Attainment | Women with Births | Births / 1,000 Women |
| Less than High School | 0 (0.0%) | 0.0 |
| High School Diploma | 0 (0.0%) | 0.0 |
| College or Associate's Degree | 56 (62.2%) | 65.0 |
| Bachelor's Degree | 34 (37.8%) | 91.0 |
| Graduate Degree | 0 (0.0%) | 0.0 |
| Total | 90 (100.0%) | 48.0 |
Fertility by Education by Marriage Status in Stanwood
17.8% of women with births in Stanwood are unmarried. Women with the educational attainment of bachelor's degree are most likely to be married with 100.0% of them married at childbirth, while women with the educational attainment of college or associate's degree are least likely to be married with 28.6% of them unmarried at childbirth.
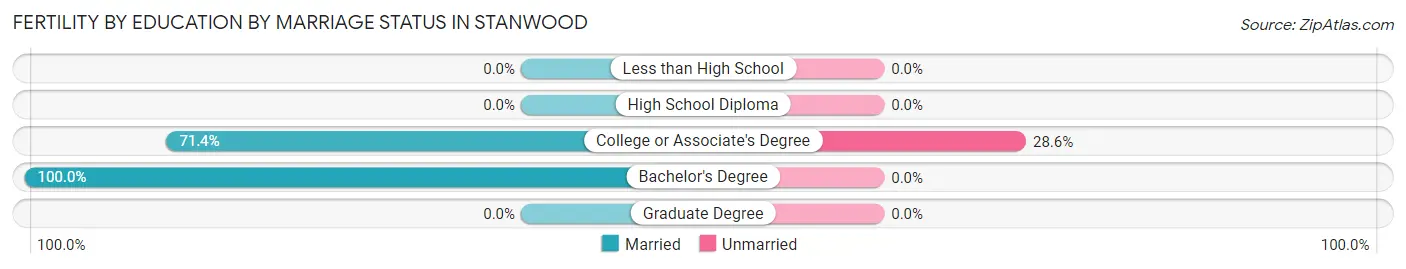
| Educational Attainment | Married | Unmarried |
| Less than High School | 0 (0.0%) | 0 (0.0%) |
| High School Diploma | 0 (0.0%) | 0 (0.0%) |
| College or Associate's Degree | 40 (71.4%) | 16 (28.6%) |
| Bachelor's Degree | 34 (100.0%) | 0 (0.0%) |
| Graduate Degree | 0 (0.0%) | 0 (0.0%) |
| Total | 74 (82.2%) | 16 (17.8%) |
Employment Characteristics in Stanwood
Employment by Class of Employer in Stanwood
Among the 3,316 employed individuals in Stanwood, private company employees (2,049 | 61.8%), local government employees (466 | 14.1%), and not-for-profit organizations (372 | 11.2%) make up the most common classes of employment.
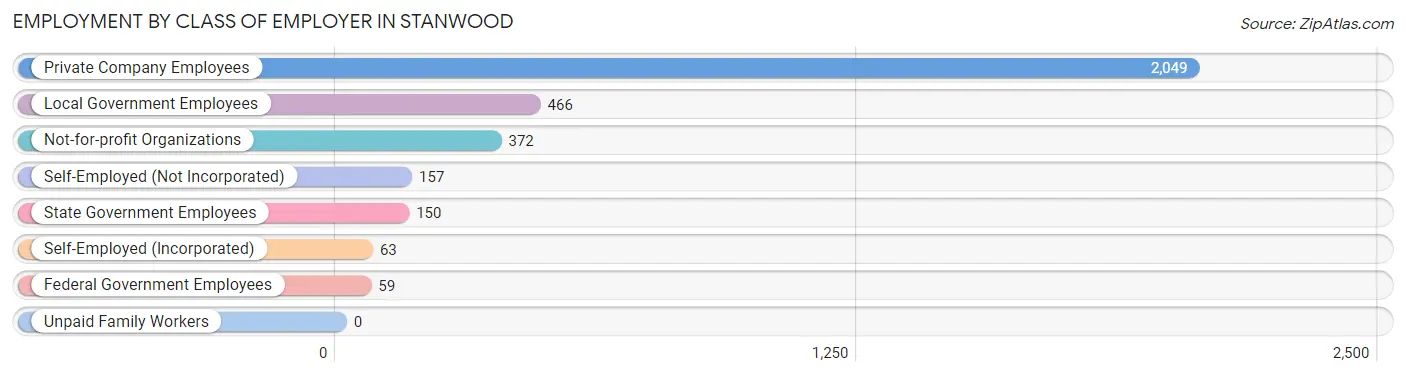
| Employer Class | # Employees | % Employees |
| Private Company Employees | 2,049 | 61.8% |
| Self-Employed (Incorporated) | 63 | 1.9% |
| Self-Employed (Not Incorporated) | 157 | 4.7% |
| Not-for-profit Organizations | 372 | 11.2% |
| Local Government Employees | 466 | 14.1% |
| State Government Employees | 150 | 4.5% |
| Federal Government Employees | 59 | 1.8% |
| Unpaid Family Workers | 0 | 0.0% |
| Total | 3,316 | 100.0% |
Employment Status by Age in Stanwood
According to the labor force statistics for Stanwood, out of the total population over 16 years of age (6,036), 58.1% or 3,507 individuals are in the labor force, with 1.5% or 53 of them unemployed. The age group with the highest labor force participation rate is 25 to 29 years, with 84.5% or 414 individuals in the labor force. Within the labor force, the 65 to 74 years age range has the highest percentage of unemployed individuals, with 13.7% or 22 of them being unemployed.
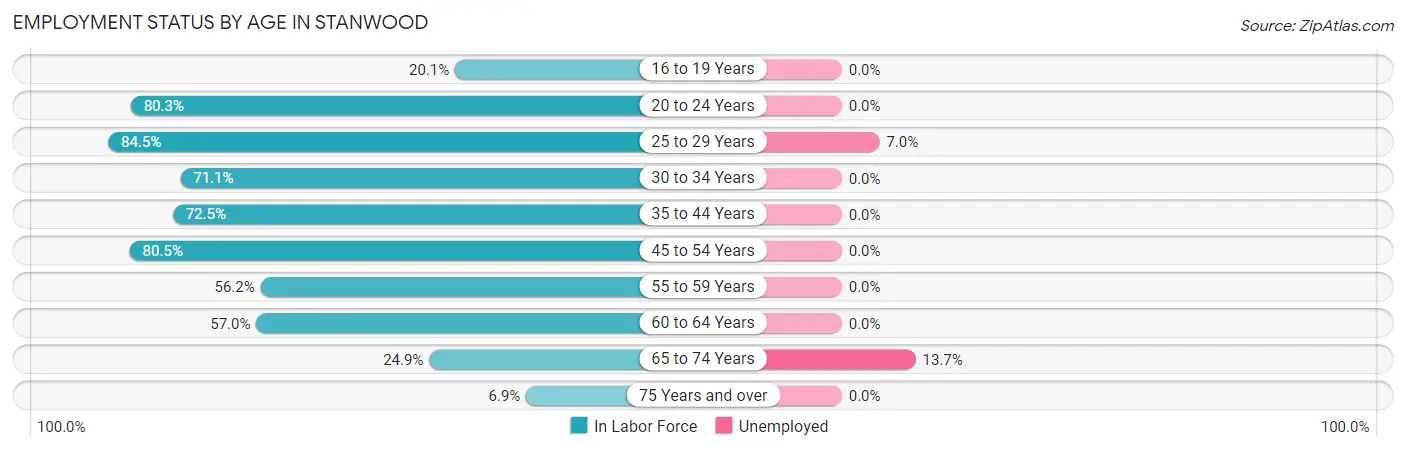
| Age Bracket | In Labor Force | Unemployed |
| 16 to 19 Years | 100 (20.1%) | 0 (0.0%) |
| 20 to 24 Years | 431 (80.3%) | 0 (0.0%) |
| 25 to 29 Years | 414 (84.5%) | 29 (7.0%) |
| 30 to 34 Years | 397 (71.1%) | 0 (0.0%) |
| 35 to 44 Years | 832 (72.5%) | 0 (0.0%) |
| 45 to 54 Years | 692 (80.5%) | 0 (0.0%) |
| 55 to 59 Years | 145 (56.2%) | 0 (0.0%) |
| 60 to 64 Years | 297 (57.0%) | 0 (0.0%) |
| 65 to 74 Years | 161 (24.9%) | 22 (13.7%) |
| 75 Years and over | 36 (6.9%) | 0 (0.0%) |
| Total | 3,507 (58.1%) | 53 (1.5%) |
Employment Status by Educational Attainment in Stanwood
According to labor force statistics for Stanwood, 72.4% of individuals (2,777) out of the total population between 25 and 64 years of age (3,835) are in the labor force, with 1.0% or 28 of them being unemployed. The group with the highest labor force participation rate are those with the educational attainment of less than high school, with 84.8% or 134 individuals in the labor force. Within the labor force, individuals with high school diploma education have the highest percentage of unemployment, with 5.6% or 30 of them being unemployed.
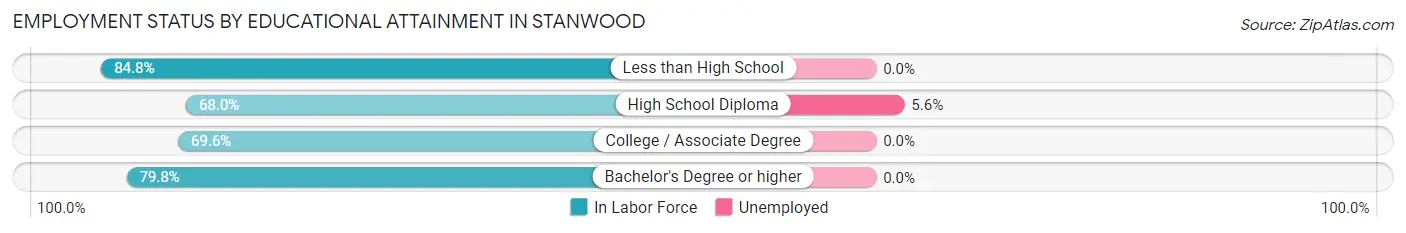
| Educational Attainment | In Labor Force | Unemployed |
| Less than High School | 134 (84.8%) | 0 (0.0%) |
| High School Diploma | 537 (68.0%) | 44 (5.6%) |
| College / Associate Degree | 1,348 (69.6%) | 0 (0.0%) |
| Bachelor's Degree or higher | 758 (79.8%) | 0 (0.0%) |
| Total | 2,777 (72.4%) | 38 (1.0%) |
Employment Occupations by Sex in Stanwood
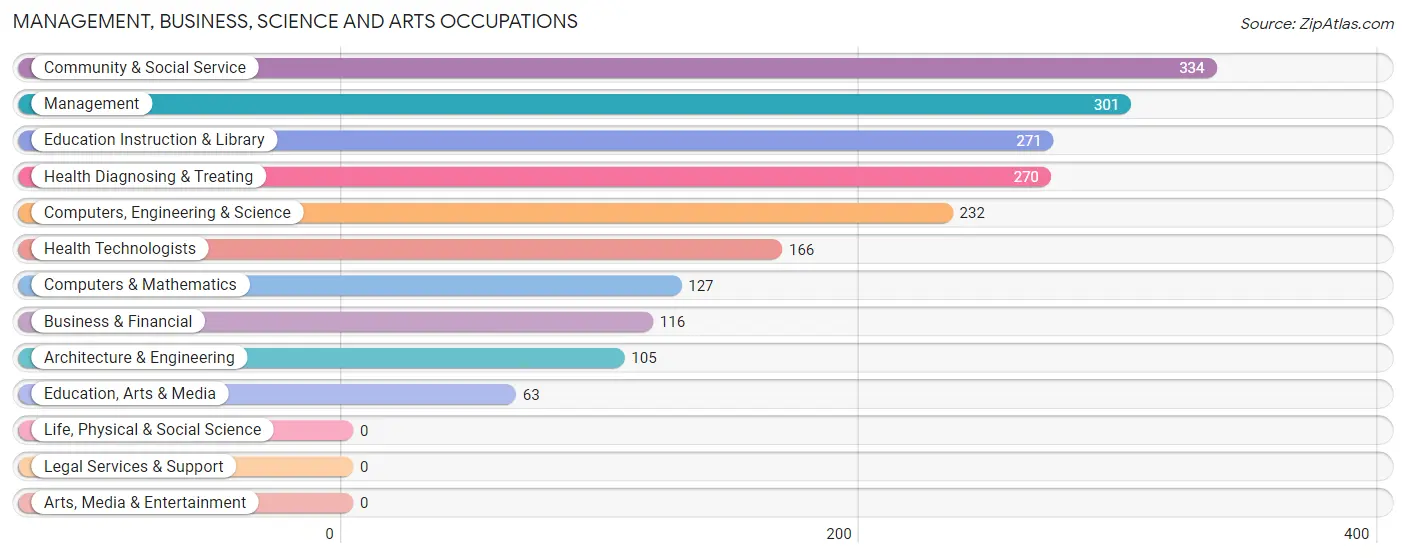
Management, Business, Science and Arts Occupations
The most common Management, Business, Science and Arts occupations in Stanwood are Community & Social Service (334 | 9.7%), Management (301 | 8.7%), Education Instruction & Library (271 | 7.9%), Health Diagnosing & Treating (270 | 7.9%), and Computers, Engineering & Science (232 | 6.8%).
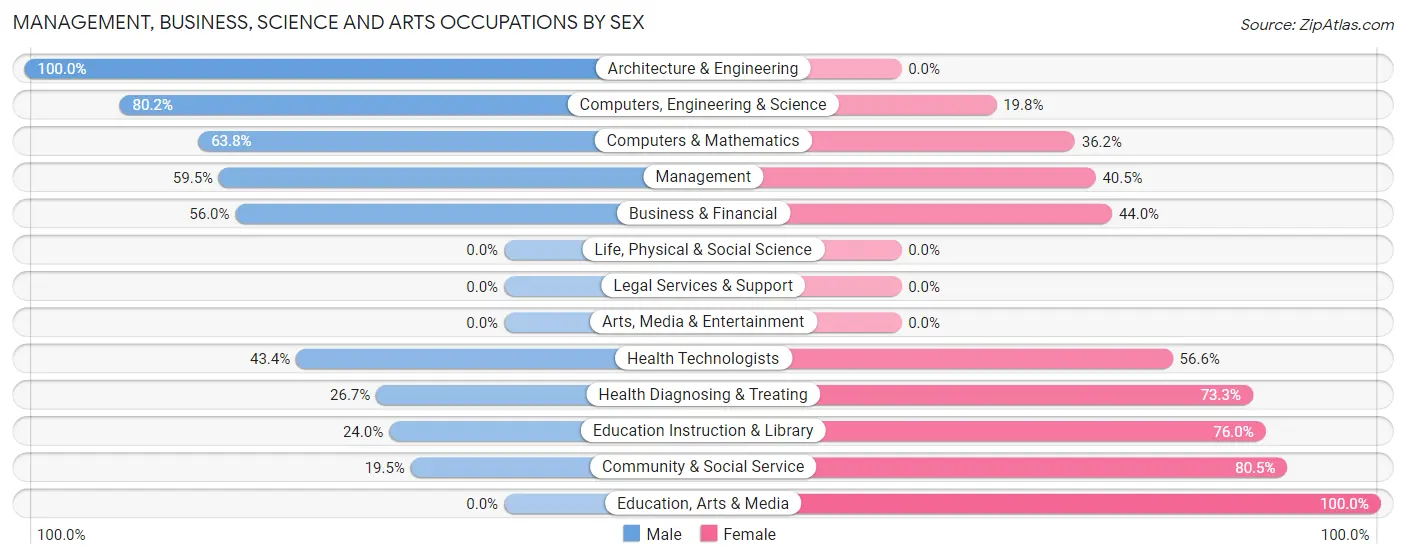
Management, Business, Science and Arts Occupations by Sex
Within the Management, Business, Science and Arts occupations in Stanwood, the most male-oriented occupations are Architecture & Engineering (100.0%), Computers, Engineering & Science (80.2%), and Computers & Mathematics (63.8%), while the most female-oriented occupations are Education, Arts & Media (100.0%), Community & Social Service (80.5%), and Education Instruction & Library (76.0%).
| Occupation | Male | Female |
| Management | 179 (59.5%) | 122 (40.5%) |
| Business & Financial | 65 (56.0%) | 51 (44.0%) |
| Computers, Engineering & Science | 186 (80.2%) | 46 (19.8%) |
| Computers & Mathematics | 81 (63.8%) | 46 (36.2%) |
| Architecture & Engineering | 105 (100.0%) | 0 (0.0%) |
| Life, Physical & Social Science | 0 (0.0%) | 0 (0.0%) |
| Community & Social Service | 65 (19.5%) | 269 (80.5%) |
| Education, Arts & Media | 0 (0.0%) | 63 (100.0%) |
| Legal Services & Support | 0 (0.0%) | 0 (0.0%) |
| Education Instruction & Library | 65 (24.0%) | 206 (76.0%) |
| Arts, Media & Entertainment | 0 (0.0%) | 0 (0.0%) |
| Health Diagnosing & Treating | 72 (26.7%) | 198 (73.3%) |
| Health Technologists | 72 (43.4%) | 94 (56.6%) |
| Total (Category) | 567 (45.3%) | 686 (54.7%) |
| Total (Overall) | 2,102 (61.1%) | 1,337 (38.9%) |
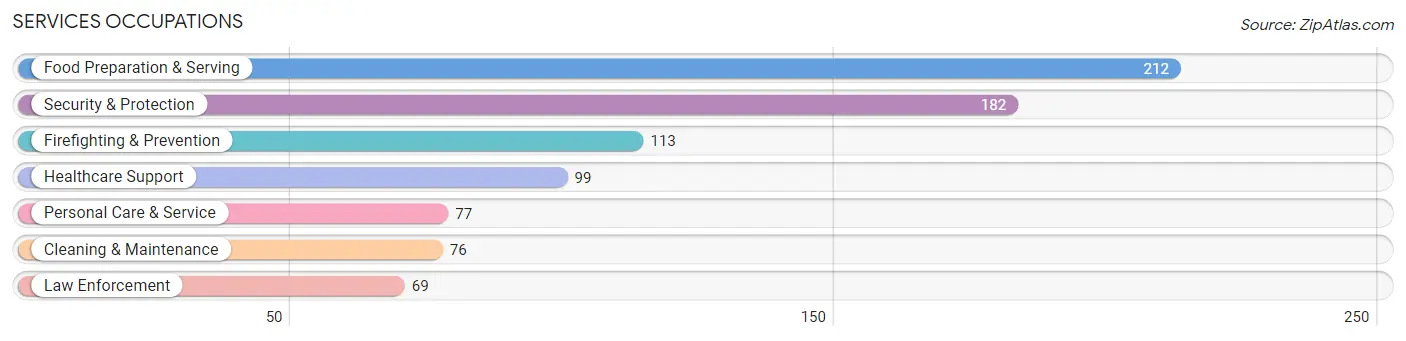
Services Occupations
The most common Services occupations in Stanwood are Food Preparation & Serving (212 | 6.2%), Security & Protection (182 | 5.3%), Firefighting & Prevention (113 | 3.3%), Healthcare Support (99 | 2.9%), and Personal Care & Service (77 | 2.2%).
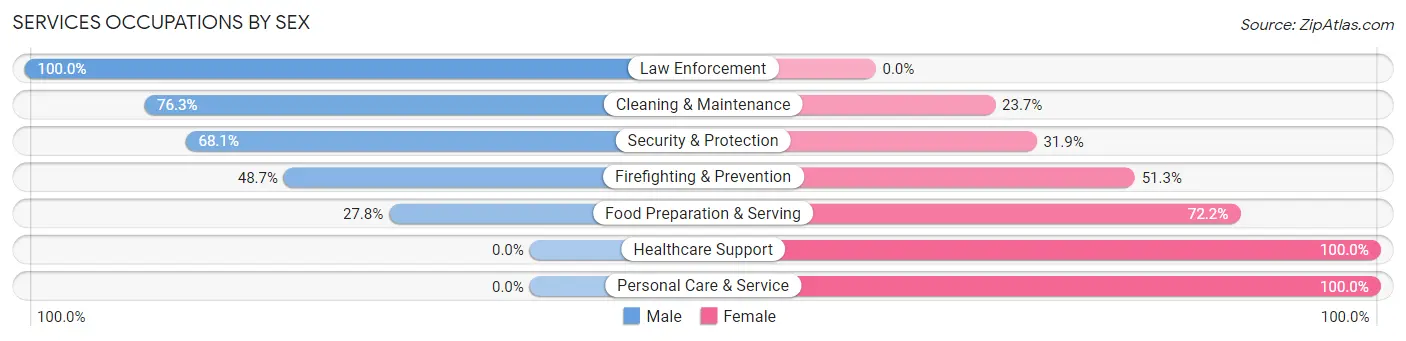
Services Occupations by Sex
Within the Services occupations in Stanwood, the most male-oriented occupations are Law Enforcement (100.0%), Cleaning & Maintenance (76.3%), and Security & Protection (68.1%), while the most female-oriented occupations are Healthcare Support (100.0%), Personal Care & Service (100.0%), and Food Preparation & Serving (72.2%).
| Occupation | Male | Female |
| Healthcare Support | 0 (0.0%) | 99 (100.0%) |
| Security & Protection | 124 (68.1%) | 58 (31.9%) |
| Firefighting & Prevention | 55 (48.7%) | 58 (51.3%) |
| Law Enforcement | 69 (100.0%) | 0 (0.0%) |
| Food Preparation & Serving | 59 (27.8%) | 153 (72.2%) |
| Cleaning & Maintenance | 58 (76.3%) | 18 (23.7%) |
| Personal Care & Service | 0 (0.0%) | 77 (100.0%) |
| Total (Category) | 241 (37.3%) | 405 (62.7%) |
| Total (Overall) | 2,102 (61.1%) | 1,337 (38.9%) |
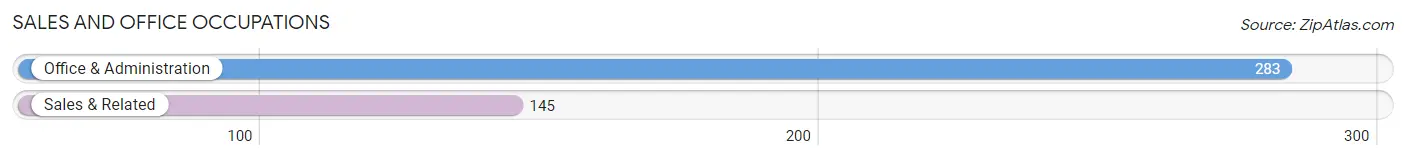
Sales and Office Occupations
The most common Sales and Office occupations in Stanwood are Office & Administration (283 | 8.2%), and Sales & Related (145 | 4.2%).
Sales and Office Occupations by Sex
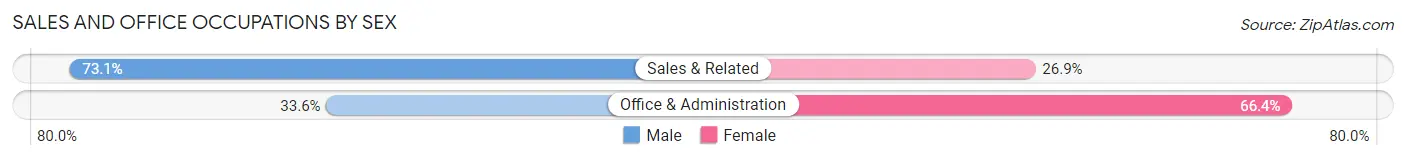
| Occupation | Male | Female |
| Sales & Related | 106 (73.1%) | 39 (26.9%) |
| Office & Administration | 95 (33.6%) | 188 (66.4%) |
| Total (Category) | 201 (47.0%) | 227 (53.0%) |
| Total (Overall) | 2,102 (61.1%) | 1,337 (38.9%) |
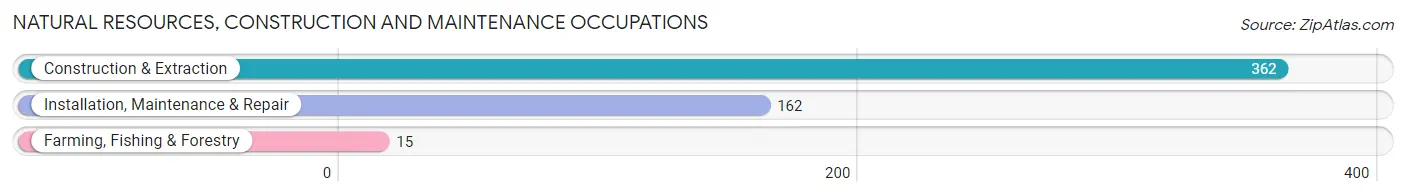
Natural Resources, Construction and Maintenance Occupations
The most common Natural Resources, Construction and Maintenance occupations in Stanwood are Construction & Extraction (362 | 10.5%), Installation, Maintenance & Repair (162 | 4.7%), and Farming, Fishing & Forestry (15 | 0.4%).
Natural Resources, Construction and Maintenance Occupations by Sex
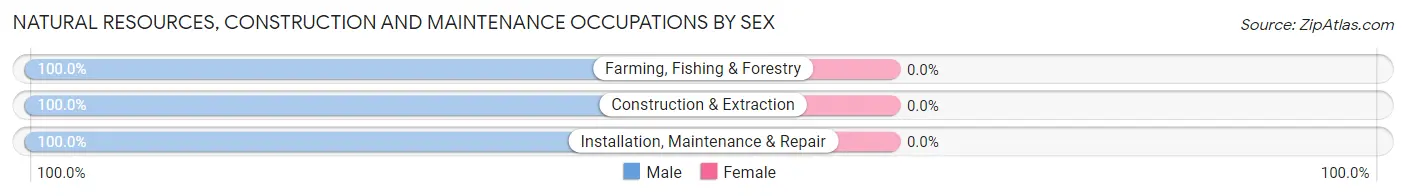
| Occupation | Male | Female |
| Farming, Fishing & Forestry | 15 (100.0%) | 0 (0.0%) |
| Construction & Extraction | 362 (100.0%) | 0 (0.0%) |
| Installation, Maintenance & Repair | 162 (100.0%) | 0 (0.0%) |
| Total (Category) | 539 (100.0%) | 0 (0.0%) |
| Total (Overall) | 2,102 (61.1%) | 1,337 (38.9%) |
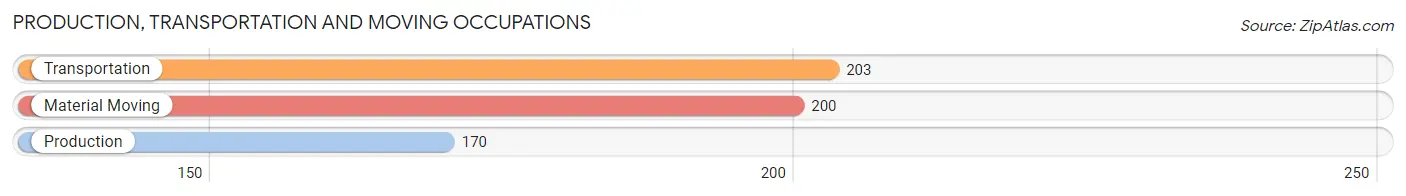
Production, Transportation and Moving Occupations
The most common Production, Transportation and Moving occupations in Stanwood are Transportation (203 | 5.9%), Material Moving (200 | 5.8%), and Production (170 | 4.9%).
Production, Transportation and Moving Occupations by Sex
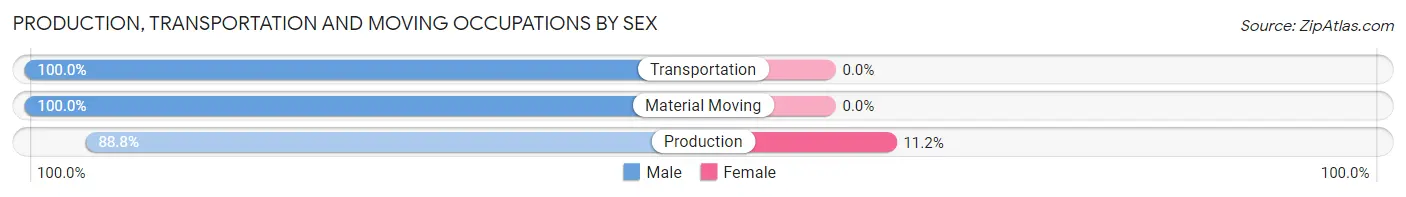
| Occupation | Male | Female |
| Production | 151 (88.8%) | 19 (11.2%) |
| Transportation | 203 (100.0%) | 0 (0.0%) |
| Material Moving | 200 (100.0%) | 0 (0.0%) |
| Total (Category) | 554 (96.7%) | 19 (3.3%) |
| Total (Overall) | 2,102 (61.1%) | 1,337 (38.9%) |
Employment Industries by Sex in Stanwood
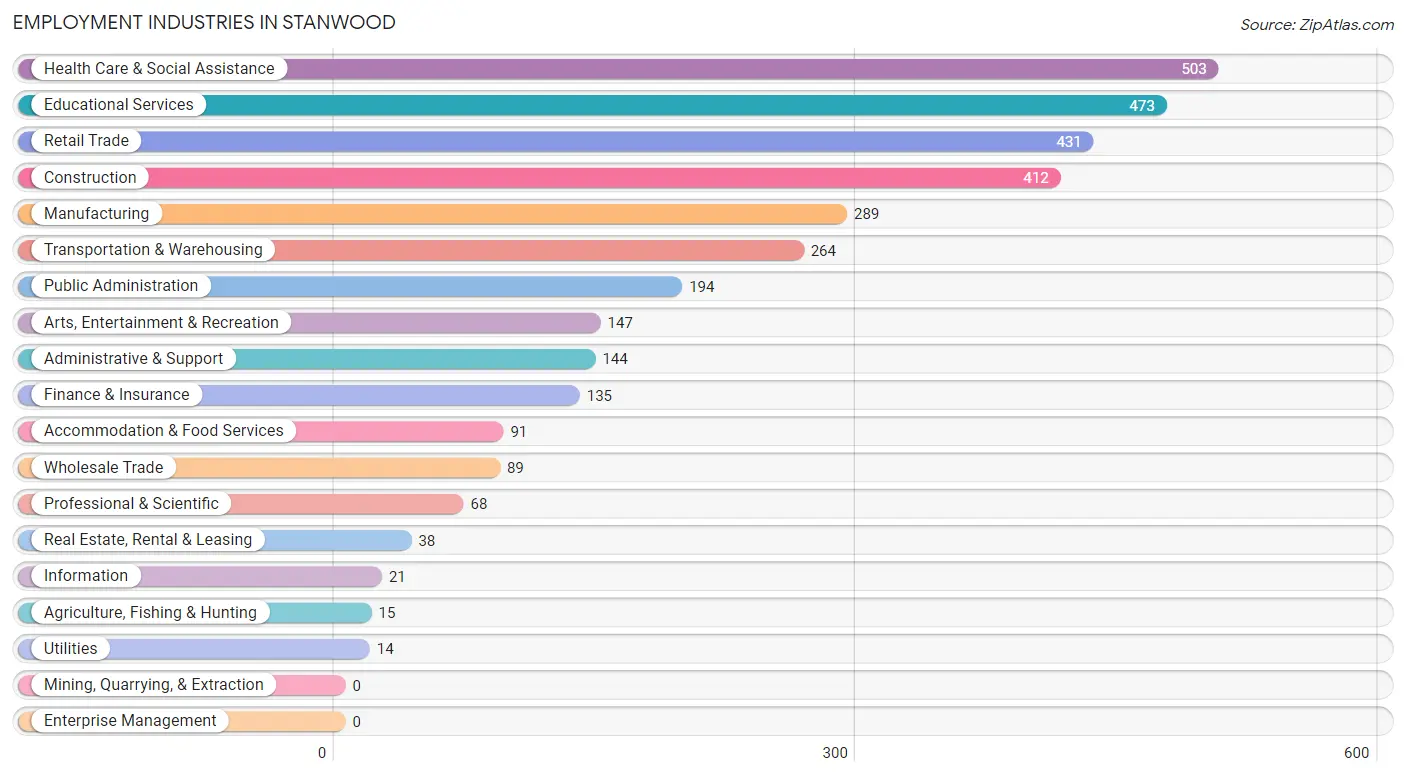
Employment Industries in Stanwood
The major employment industries in Stanwood include Health Care & Social Assistance (503 | 14.6%), Educational Services (473 | 13.8%), Retail Trade (431 | 12.5%), Construction (412 | 12.0%), and Manufacturing (289 | 8.4%).
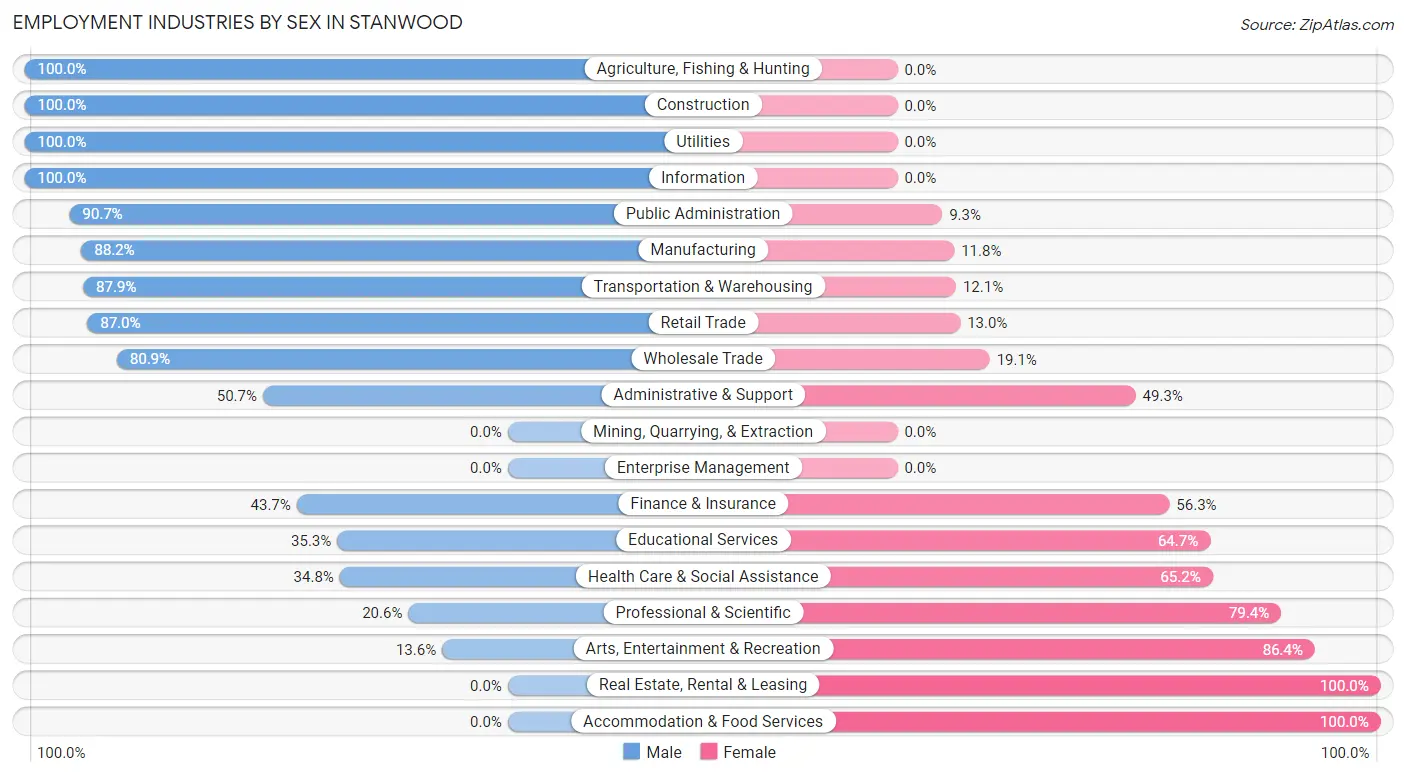
Employment Industries by Sex in Stanwood
The Stanwood industries that see more men than women are Agriculture, Fishing & Hunting (100.0%), Construction (100.0%), and Utilities (100.0%), whereas the industries that tend to have a higher number of women are Real Estate, Rental & Leasing (100.0%), Accommodation & Food Services (100.0%), and Arts, Entertainment & Recreation (86.4%).
| Industry | Male | Female |
| Agriculture, Fishing & Hunting | 15 (100.0%) | 0 (0.0%) |
| Mining, Quarrying, & Extraction | 0 (0.0%) | 0 (0.0%) |
| Construction | 412 (100.0%) | 0 (0.0%) |
| Manufacturing | 255 (88.2%) | 34 (11.8%) |
| Wholesale Trade | 72 (80.9%) | 17 (19.1%) |
| Retail Trade | 375 (87.0%) | 56 (13.0%) |
| Transportation & Warehousing | 232 (87.9%) | 32 (12.1%) |
| Utilities | 14 (100.0%) | 0 (0.0%) |
| Information | 21 (100.0%) | 0 (0.0%) |
| Finance & Insurance | 59 (43.7%) | 76 (56.3%) |
| Real Estate, Rental & Leasing | 0 (0.0%) | 38 (100.0%) |
| Professional & Scientific | 14 (20.6%) | 54 (79.4%) |
| Enterprise Management | 0 (0.0%) | 0 (0.0%) |
| Administrative & Support | 73 (50.7%) | 71 (49.3%) |
| Educational Services | 167 (35.3%) | 306 (64.7%) |
| Health Care & Social Assistance | 175 (34.8%) | 328 (65.2%) |
| Arts, Entertainment & Recreation | 20 (13.6%) | 127 (86.4%) |
| Accommodation & Food Services | 0 (0.0%) | 91 (100.0%) |
| Public Administration | 176 (90.7%) | 18 (9.3%) |
| Total | 2,102 (61.1%) | 1,337 (38.9%) |
Education in Stanwood
School Enrollment in Stanwood
The most common levels of schooling among the 2,409 students in Stanwood are high school (625 | 25.9%), elementary school (555 | 23.0%), and middle school (487 | 20.2%).
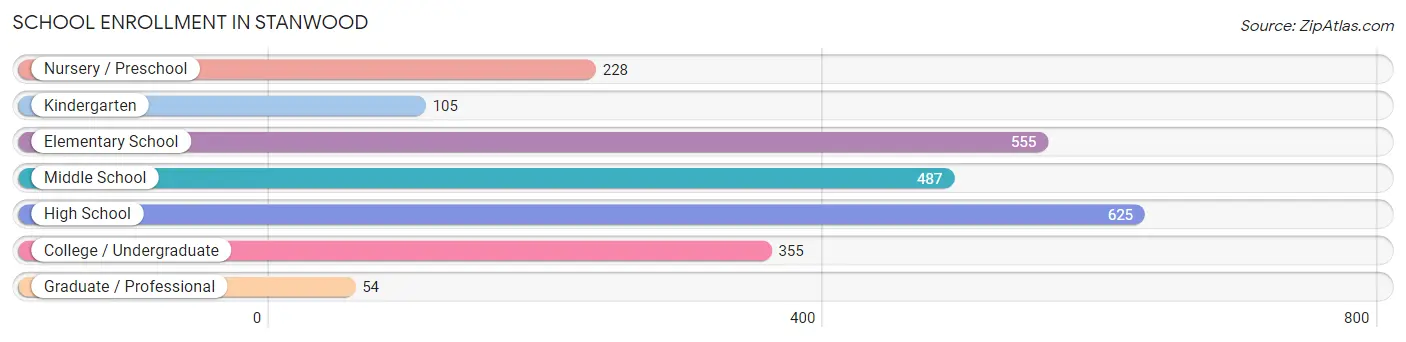
| School Level | # Students | % Students |
| Nursery / Preschool | 228 | 9.5% |
| Kindergarten | 105 | 4.4% |
| Elementary School | 555 | 23.0% |
| Middle School | 487 | 20.2% |
| High School | 625 | 25.9% |
| College / Undergraduate | 355 | 14.7% |
| Graduate / Professional | 54 | 2.2% |
| Total | 2,409 | 100.0% |
School Enrollment by Age by Funding Source in Stanwood
Out of a total of 2,409 students who are enrolled in schools in Stanwood, 460 (19.1%) attend a private institution, while the remaining 1,949 (80.9%) are enrolled in public schools. The age group of 3 to 4 year olds has the highest likelihood of being enrolled in private schools, with 119 (82.1% in the age bracket) enrolled. Conversely, the age group of 20 to 24 year olds has the lowest likelihood of being enrolled in a private school, with 227 (100.0% in the age bracket) attending a public institution.
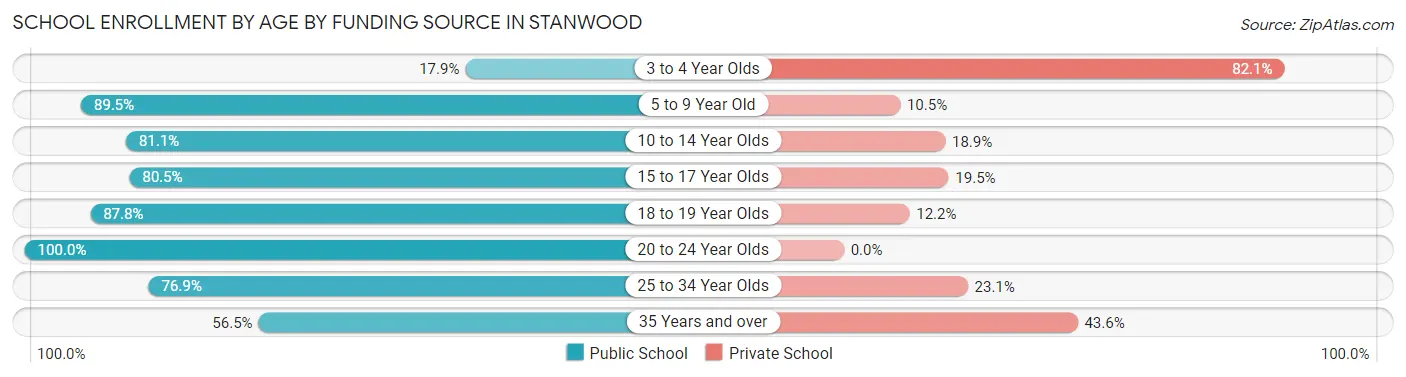
| Age Bracket | Public School | Private School |
| 3 to 4 Year Olds | 26 (17.9%) | 119 (82.1%) |
| 5 to 9 Year Old | 623 (89.5%) | 73 (10.5%) |
| 10 to 14 Year Olds | 550 (81.1%) | 128 (18.9%) |
| 15 to 17 Year Olds | 359 (80.5%) | 87 (19.5%) |
| 18 to 19 Year Olds | 79 (87.8%) | 11 (12.2%) |
| 20 to 24 Year Olds | 227 (100.0%) | 0 (0.0%) |
| 25 to 34 Year Olds | 50 (76.9%) | 15 (23.1%) |
| 35 Years and over | 35 (56.5%) | 27 (43.5%) |
| Total | 1,949 (80.9%) | 460 (19.1%) |
Educational Attainment by Field of Study in Stanwood
Science & technology (209 | 15.0%), business (158 | 11.3%), social sciences (156 | 11.2%), education (134 | 9.6%), and visual & performing arts (127 | 9.1%) are the most common fields of study among 1,394 individuals in Stanwood who have obtained a bachelor's degree or higher.

| Field of Study | # Graduates | % Graduates |
| Computers & Mathematics | 24 | 1.7% |
| Bio, Nature & Agricultural | 75 | 5.4% |
| Physical & Health Sciences | 0 | 0.0% |
| Psychology | 85 | 6.1% |
| Social Sciences | 156 | 11.2% |
| Engineering | 121 | 8.7% |
| Multidisciplinary Studies | 0 | 0.0% |
| Science & Technology | 209 | 15.0% |
| Business | 158 | 11.3% |
| Education | 134 | 9.6% |
| Literature & Languages | 23 | 1.7% |
| Liberal Arts & History | 96 | 6.9% |
| Visual & Performing Arts | 127 | 9.1% |
| Communications | 62 | 4.4% |
| Arts & Humanities | 124 | 8.9% |
| Total | 1,394 | 100.0% |
Transportation & Commute in Stanwood
Vehicle Availability by Sex in Stanwood
The most prevalent vehicle ownership categories in Stanwood are males with 2 vehicles (990, accounting for 47.1%) and females with 2 vehicles (434, making up 81.6%).
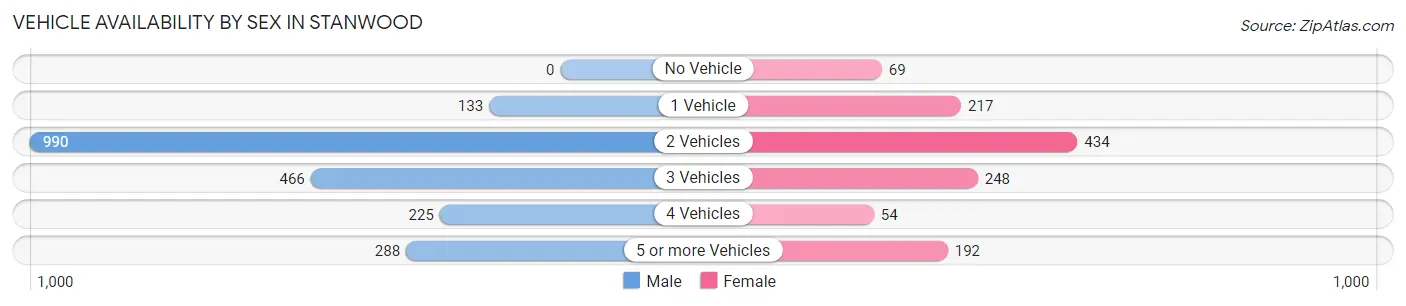
| Vehicles Available | Male | Female |
| No Vehicle | 0 (0.0%) | 69 (5.7%) |
| 1 Vehicle | 133 (6.3%) | 217 (17.9%) |
| 2 Vehicles | 990 (47.1%) | 434 (35.7%) |
| 3 Vehicles | 466 (22.2%) | 248 (20.4%) |
| 4 Vehicles | 225 (10.7%) | 54 (4.4%) |
| 5 or more Vehicles | 288 (13.7%) | 192 (15.8%) |
| Total | 2,102 (100.0%) | 1,214 (100.0%) |
Commute Time in Stanwood
The most frequently occuring commute durations in Stanwood are 5 to 9 minutes (553 commuters, 17.9%), 60 to 89 minutes (403 commuters, 13.0%), and 30 to 34 minutes (374 commuters, 12.1%).
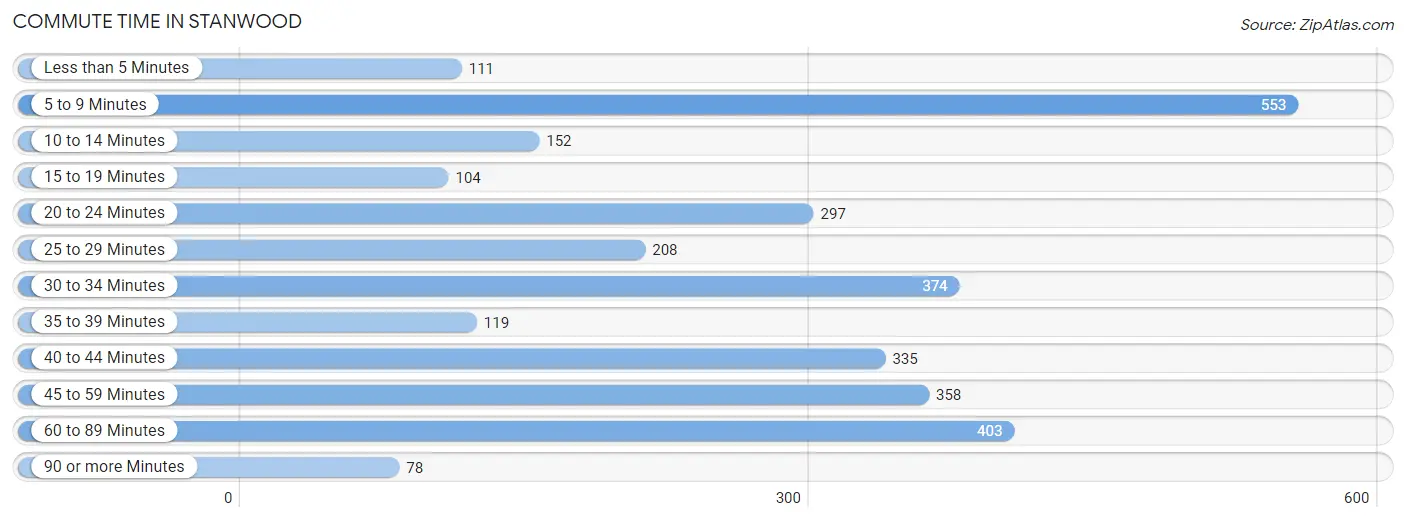
| Commute Time | # Commuters | % Commuters |
| Less than 5 Minutes | 111 | 3.6% |
| 5 to 9 Minutes | 553 | 17.9% |
| 10 to 14 Minutes | 152 | 4.9% |
| 15 to 19 Minutes | 104 | 3.4% |
| 20 to 24 Minutes | 297 | 9.6% |
| 25 to 29 Minutes | 208 | 6.7% |
| 30 to 34 Minutes | 374 | 12.1% |
| 35 to 39 Minutes | 119 | 3.8% |
| 40 to 44 Minutes | 335 | 10.8% |
| 45 to 59 Minutes | 358 | 11.6% |
| 60 to 89 Minutes | 403 | 13.0% |
| 90 or more Minutes | 78 | 2.5% |
Commute Time by Sex in Stanwood
The most common commute times in Stanwood are 45 to 59 minutes (338 commuters, 17.1%) for males and 5 to 9 minutes (333 commuters, 30.0%) for females.
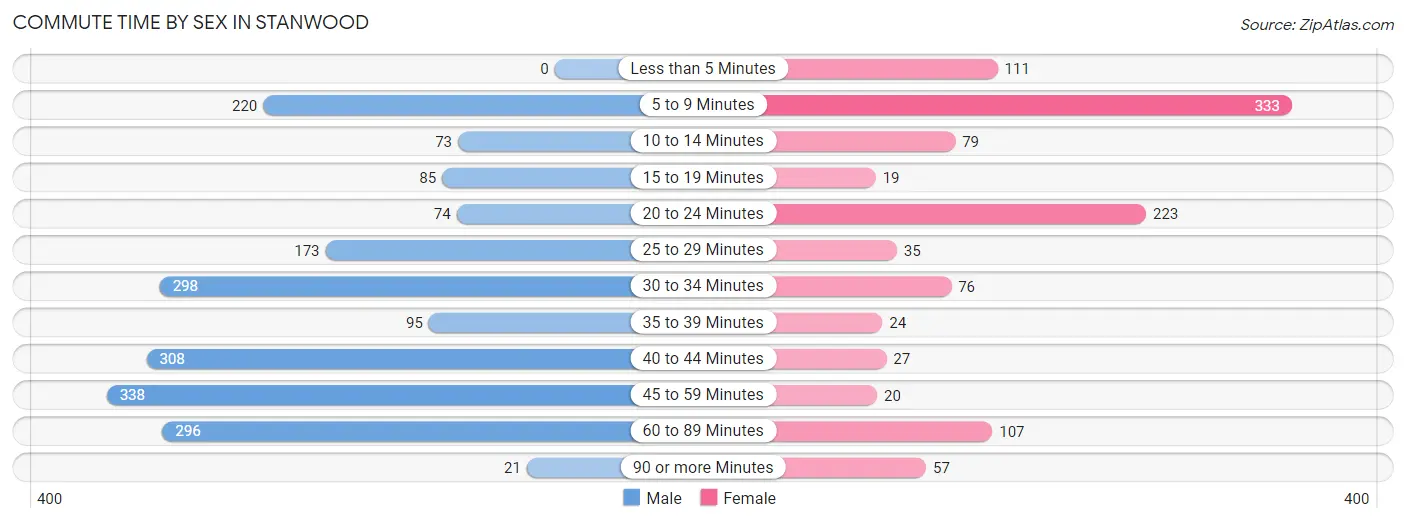
| Commute Time | Male | Female |
| Less than 5 Minutes | 0 (0.0%) | 111 (10.0%) |
| 5 to 9 Minutes | 220 (11.1%) | 333 (30.0%) |
| 10 to 14 Minutes | 73 (3.7%) | 79 (7.1%) |
| 15 to 19 Minutes | 85 (4.3%) | 19 (1.7%) |
| 20 to 24 Minutes | 74 (3.7%) | 223 (20.1%) |
| 25 to 29 Minutes | 173 (8.7%) | 35 (3.2%) |
| 30 to 34 Minutes | 298 (15.0%) | 76 (6.8%) |
| 35 to 39 Minutes | 95 (4.8%) | 24 (2.2%) |
| 40 to 44 Minutes | 308 (15.5%) | 27 (2.4%) |
| 45 to 59 Minutes | 338 (17.1%) | 20 (1.8%) |
| 60 to 89 Minutes | 296 (14.9%) | 107 (9.6%) |
| 90 or more Minutes | 21 (1.1%) | 57 (5.1%) |
Time of Departure to Work by Sex in Stanwood
The most frequent times of departure to work in Stanwood are 7:00 AM to 7:29 AM (401, 20.2%) for males and 7:00 AM to 7:29 AM (263, 23.7%) for females.
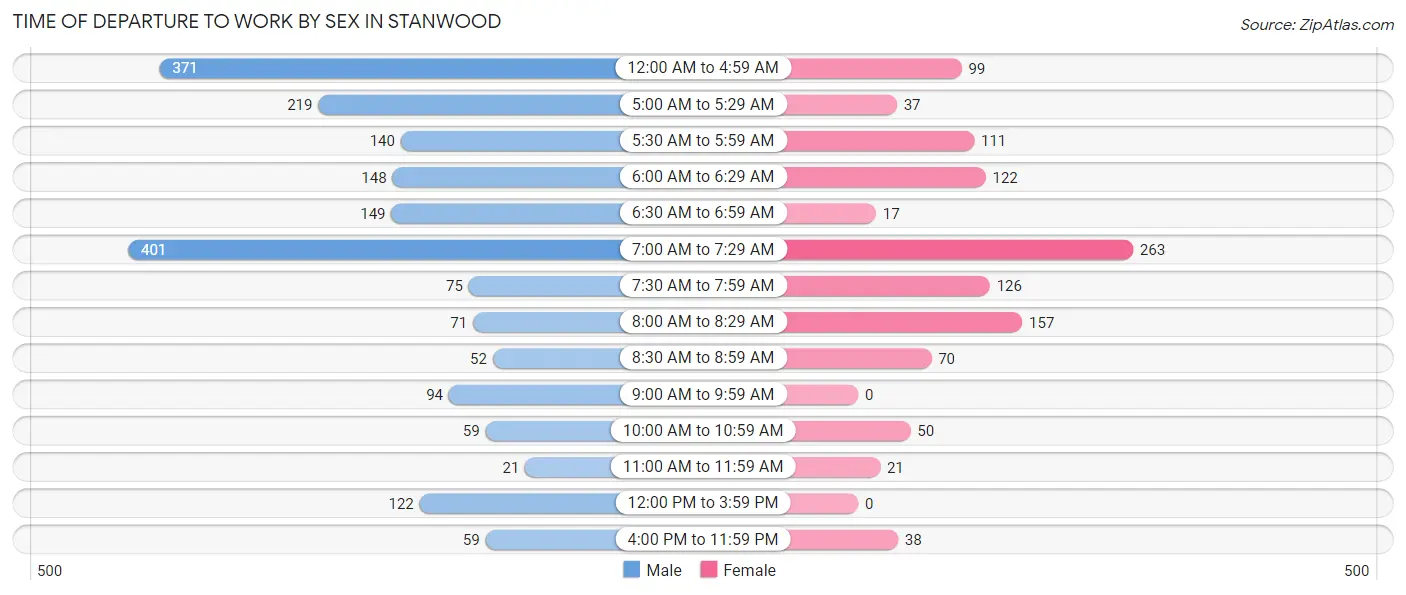
| Time of Departure | Male | Female |
| 12:00 AM to 4:59 AM | 371 (18.7%) | 99 (8.9%) |
| 5:00 AM to 5:29 AM | 219 (11.1%) | 37 (3.3%) |
| 5:30 AM to 5:59 AM | 140 (7.1%) | 111 (10.0%) |
| 6:00 AM to 6:29 AM | 148 (7.5%) | 122 (11.0%) |
| 6:30 AM to 6:59 AM | 149 (7.5%) | 17 (1.5%) |
| 7:00 AM to 7:29 AM | 401 (20.2%) | 263 (23.7%) |
| 7:30 AM to 7:59 AM | 75 (3.8%) | 126 (11.3%) |
| 8:00 AM to 8:29 AM | 71 (3.6%) | 157 (14.1%) |
| 8:30 AM to 8:59 AM | 52 (2.6%) | 70 (6.3%) |
| 9:00 AM to 9:59 AM | 94 (4.8%) | 0 (0.0%) |
| 10:00 AM to 10:59 AM | 59 (3.0%) | 50 (4.5%) |
| 11:00 AM to 11:59 AM | 21 (1.1%) | 21 (1.9%) |
| 12:00 PM to 3:59 PM | 122 (6.2%) | 0 (0.0%) |
| 4:00 PM to 11:59 PM | 59 (3.0%) | 38 (3.4%) |
| Total | 1,981 (100.0%) | 1,111 (100.0%) |
Housing Occupancy in Stanwood
Occupancy by Ownership in Stanwood
Of the total 2,884 dwellings in Stanwood, owner-occupied units account for 1,915 (66.4%), while renter-occupied units make up 969 (33.6%).
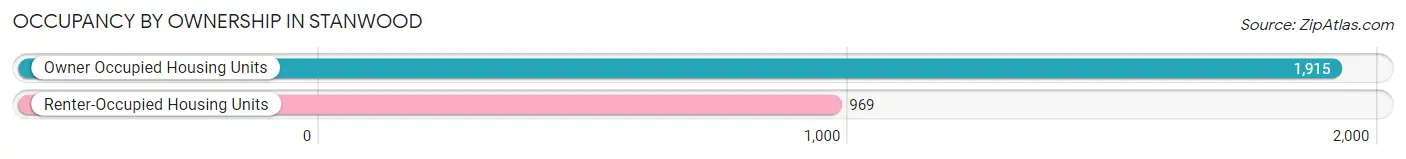
| Occupancy | # Housing Units | % Housing Units |
| Owner Occupied Housing Units | 1,915 | 66.4% |
| Renter-Occupied Housing Units | 969 | 33.6% |
| Total Occupied Housing Units | 2,884 | 100.0% |
Occupancy by Household Size in Stanwood
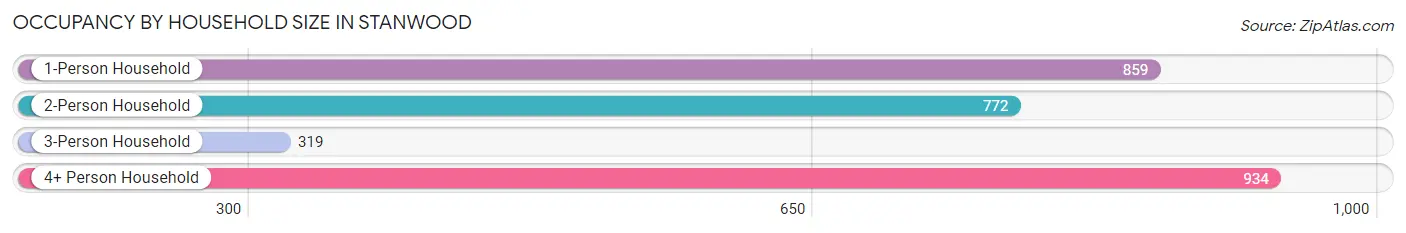
| Household Size | # Housing Units | % Housing Units |
| 1-Person Household | 859 | 29.8% |
| 2-Person Household | 772 | 26.8% |
| 3-Person Household | 319 | 11.1% |
| 4+ Person Household | 934 | 32.4% |
| Total Housing Units | 2,884 | 100.0% |
Occupancy by Ownership by Household Size in Stanwood
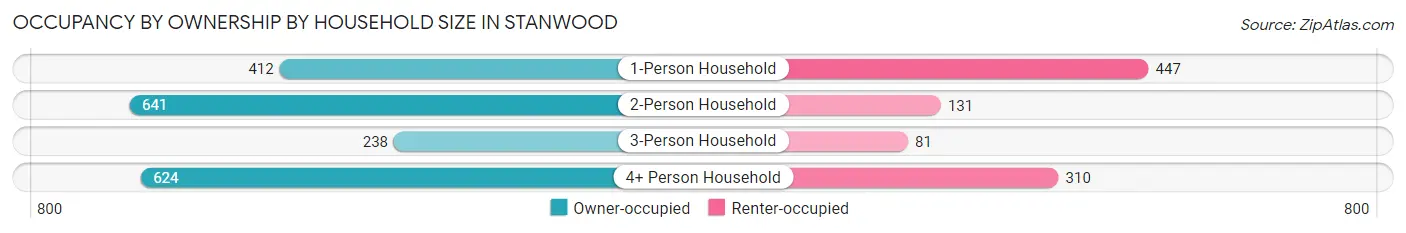
| Household Size | Owner-occupied | Renter-occupied |
| 1-Person Household | 412 (48.0%) | 447 (52.0%) |
| 2-Person Household | 641 (83.0%) | 131 (17.0%) |
| 3-Person Household | 238 (74.6%) | 81 (25.4%) |
| 4+ Person Household | 624 (66.8%) | 310 (33.2%) |
| Total Housing Units | 1,915 (66.4%) | 969 (33.6%) |
Occupancy by Educational Attainment in Stanwood
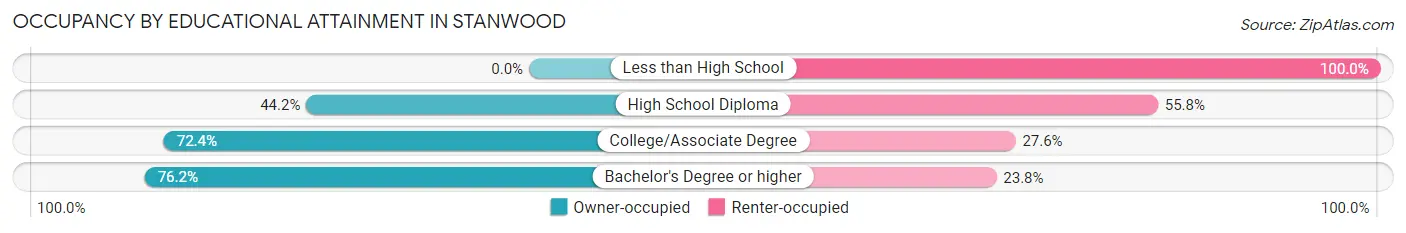
| Household Size | Owner-occupied | Renter-occupied |
| Less than High School | 0 (0.0%) | 53 (100.0%) |
| High School Diploma | 257 (44.2%) | 325 (55.8%) |
| College/Associate Degree | 1,054 (72.4%) | 402 (27.6%) |
| Bachelor's Degree or higher | 604 (76.2%) | 189 (23.8%) |
Occupancy by Age of Householder in Stanwood
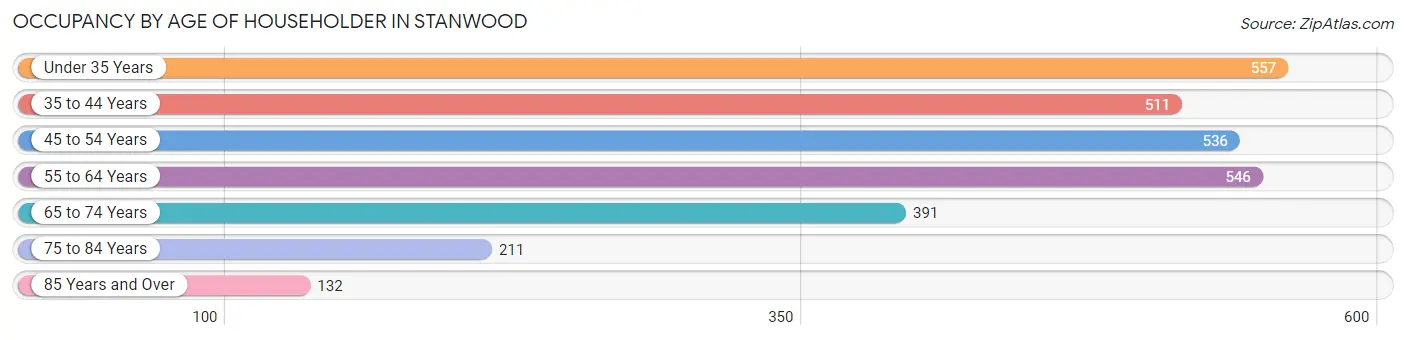
| Age Bracket | # Households | % Households |
| Under 35 Years | 557 | 19.3% |
| 35 to 44 Years | 511 | 17.7% |
| 45 to 54 Years | 536 | 18.6% |
| 55 to 64 Years | 546 | 18.9% |
| 65 to 74 Years | 391 | 13.6% |
| 75 to 84 Years | 211 | 7.3% |
| 85 Years and Over | 132 | 4.6% |
| Total | 2,884 | 100.0% |
Housing Finances in Stanwood
Median Income by Occupancy in Stanwood
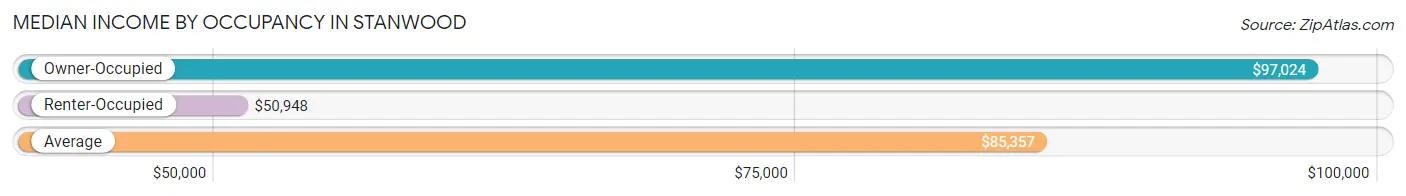
| Occupancy Type | # Households | Median Income |
| Owner-Occupied | 1,915 (66.4%) | $97,024 |
| Renter-Occupied | 969 (33.6%) | $50,948 |
| Average | 2,884 (100.0%) | $85,357 |
Occupancy by Householder Income Bracket in Stanwood
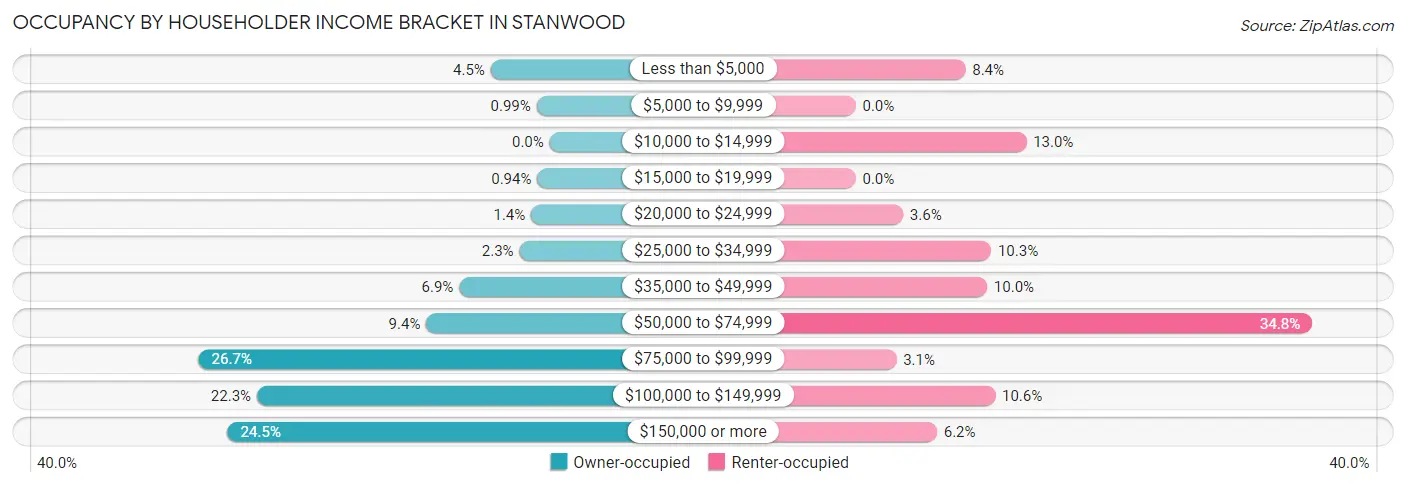
| Income Bracket | Owner-occupied | Renter-occupied |
| Less than $5,000 | 86 (4.5%) | 81 (8.4%) |
| $5,000 to $9,999 | 19 (1.0%) | 0 (0.0%) |
| $10,000 to $14,999 | 0 (0.0%) | 126 (13.0%) |
| $15,000 to $19,999 | 18 (0.9%) | 0 (0.0%) |
| $20,000 to $24,999 | 27 (1.4%) | 35 (3.6%) |
| $25,000 to $34,999 | 44 (2.3%) | 100 (10.3%) |
| $35,000 to $49,999 | 132 (6.9%) | 97 (10.0%) |
| $50,000 to $74,999 | 180 (9.4%) | 337 (34.8%) |
| $75,000 to $99,999 | 512 (26.7%) | 30 (3.1%) |
| $100,000 to $149,999 | 427 (22.3%) | 103 (10.6%) |
| $150,000 or more | 470 (24.5%) | 60 (6.2%) |
| Total | 1,915 (100.0%) | 969 (100.0%) |
Monthly Housing Cost Tiers in Stanwood
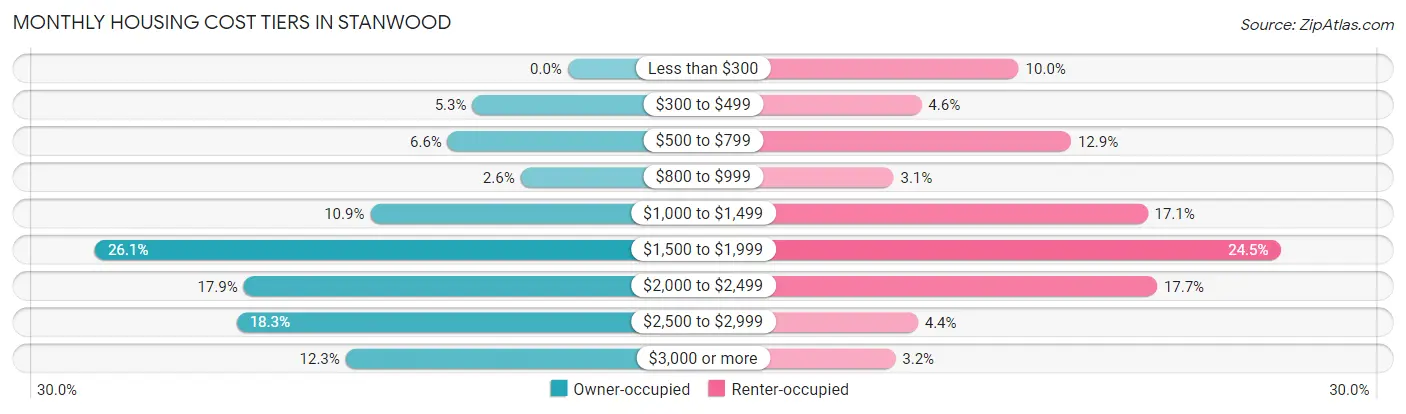
| Monthly Cost | Owner-occupied | Renter-occupied |
| Less than $300 | 0 (0.0%) | 97 (10.0%) |
| $300 to $499 | 101 (5.3%) | 45 (4.6%) |
| $500 to $799 | 127 (6.6%) | 125 (12.9%) |
| $800 to $999 | 50 (2.6%) | 30 (3.1%) |
| $1,000 to $1,499 | 209 (10.9%) | 166 (17.1%) |
| $1,500 to $1,999 | 500 (26.1%) | 237 (24.5%) |
| $2,000 to $2,499 | 343 (17.9%) | 171 (17.6%) |
| $2,500 to $2,999 | 350 (18.3%) | 43 (4.4%) |
| $3,000 or more | 235 (12.3%) | 31 (3.2%) |
| Total | 1,915 (100.0%) | 969 (100.0%) |
Physical Housing Characteristics in Stanwood
Housing Structures in Stanwood
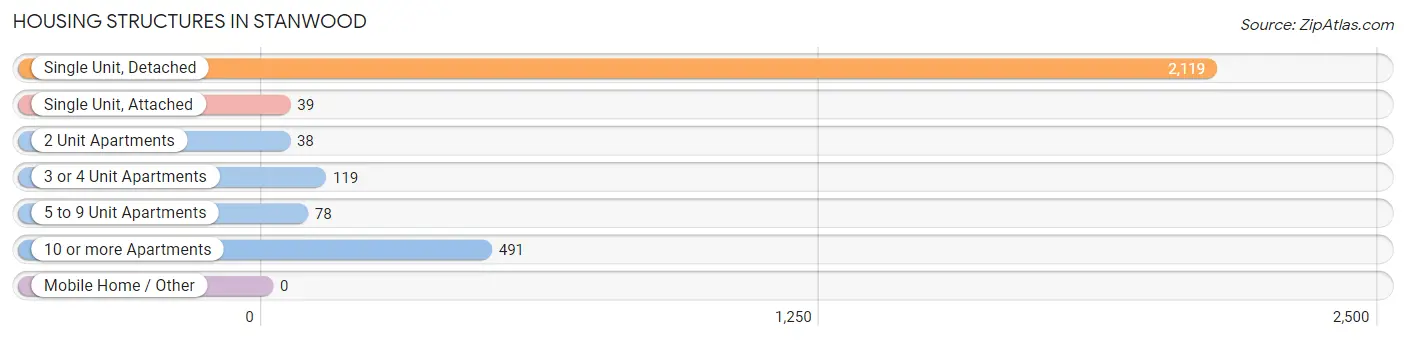
| Structure Type | # Housing Units | % Housing Units |
| Single Unit, Detached | 2,119 | 73.5% |
| Single Unit, Attached | 39 | 1.3% |
| 2 Unit Apartments | 38 | 1.3% |
| 3 or 4 Unit Apartments | 119 | 4.1% |
| 5 to 9 Unit Apartments | 78 | 2.7% |
| 10 or more Apartments | 491 | 17.0% |
| Mobile Home / Other | 0 | 0.0% |
| Total | 2,884 | 100.0% |
Housing Structures by Occupancy in Stanwood
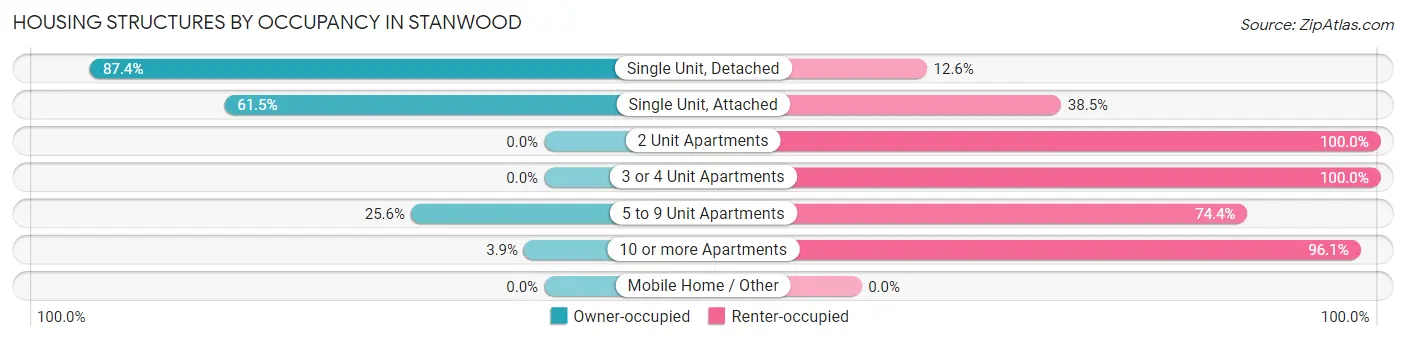
| Structure Type | Owner-occupied | Renter-occupied |
| Single Unit, Detached | 1,852 (87.4%) | 267 (12.6%) |
| Single Unit, Attached | 24 (61.5%) | 15 (38.5%) |
| 2 Unit Apartments | 0 (0.0%) | 38 (100.0%) |
| 3 or 4 Unit Apartments | 0 (0.0%) | 119 (100.0%) |
| 5 to 9 Unit Apartments | 20 (25.6%) | 58 (74.4%) |
| 10 or more Apartments | 19 (3.9%) | 472 (96.1%) |
| Mobile Home / Other | 0 (0.0%) | 0 (0.0%) |
| Total | 1,915 (66.4%) | 969 (33.6%) |
Housing Structures by Number of Rooms in Stanwood
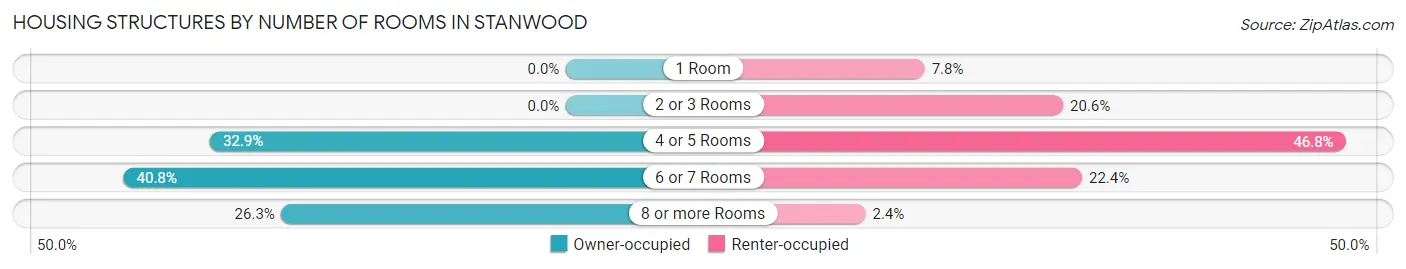
| Number of Rooms | Owner-occupied | Renter-occupied |
| 1 Room | 0 (0.0%) | 76 (7.8%) |
| 2 or 3 Rooms | 0 (0.0%) | 200 (20.6%) |
| 4 or 5 Rooms | 629 (32.9%) | 453 (46.8%) |
| 6 or 7 Rooms | 782 (40.8%) | 217 (22.4%) |
| 8 or more Rooms | 504 (26.3%) | 23 (2.4%) |
| Total | 1,915 (100.0%) | 969 (100.0%) |
Housing Structure by Heating Type in Stanwood
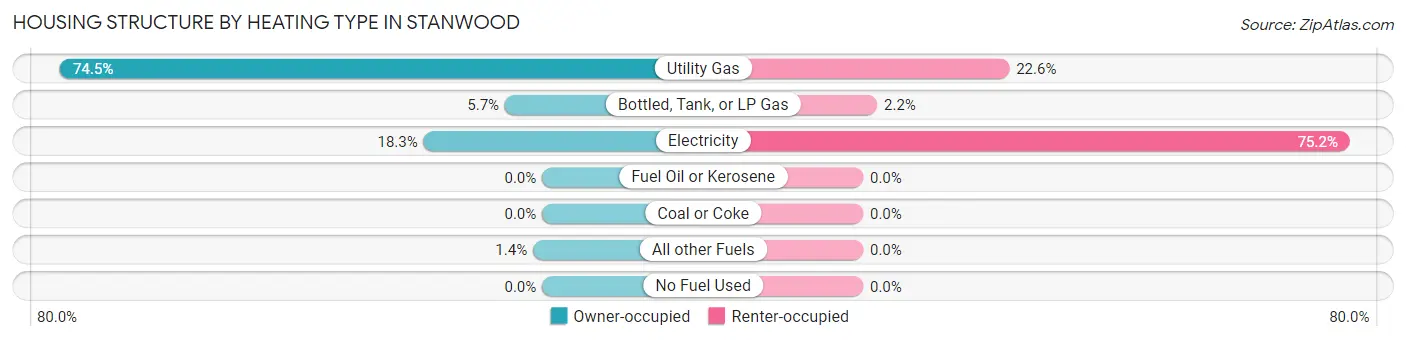
| Heating Type | Owner-occupied | Renter-occupied |
| Utility Gas | 1,427 (74.5%) | 219 (22.6%) |
| Bottled, Tank, or LP Gas | 110 (5.7%) | 21 (2.2%) |
| Electricity | 351 (18.3%) | 729 (75.2%) |
| Fuel Oil or Kerosene | 0 (0.0%) | 0 (0.0%) |
| Coal or Coke | 0 (0.0%) | 0 (0.0%) |
| All other Fuels | 27 (1.4%) | 0 (0.0%) |
| No Fuel Used | 0 (0.0%) | 0 (0.0%) |
| Total | 1,915 (100.0%) | 969 (100.0%) |
Household Vehicle Usage in Stanwood
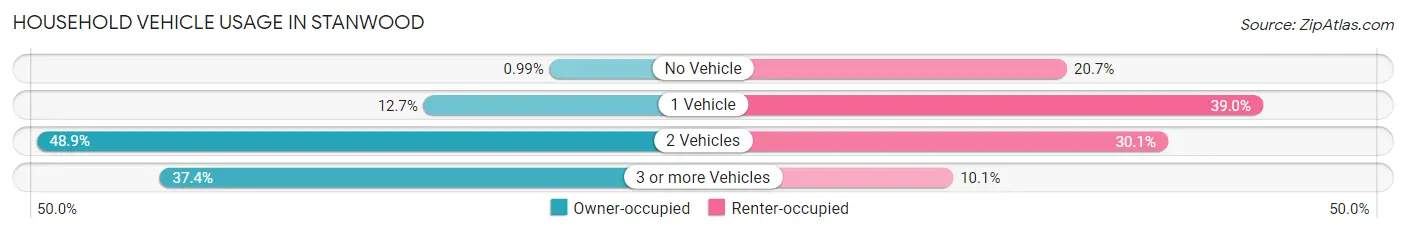
| Vehicles per Household | Owner-occupied | Renter-occupied |
| No Vehicle | 19 (1.0%) | 201 (20.7%) |
| 1 Vehicle | 244 (12.7%) | 378 (39.0%) |
| 2 Vehicles | 936 (48.9%) | 292 (30.1%) |
| 3 or more Vehicles | 716 (37.4%) | 98 (10.1%) |
| Total | 1,915 (100.0%) | 969 (100.0%) |
Real Estate & Mortgages in Stanwood
Real Estate and Mortgage Overview in Stanwood
| Characteristic | Without Mortgage | With Mortgage |
| Housing Units | 314 | 1,601 |
| Median Property Value | $501,600 | $484,400 |
| Median Household Income | $82,083 | $432 |
| Monthly Housing Costs | $656 | $235 |
| Real Estate Taxes | $4,364 | $0 |
Property Value by Mortgage Status in Stanwood
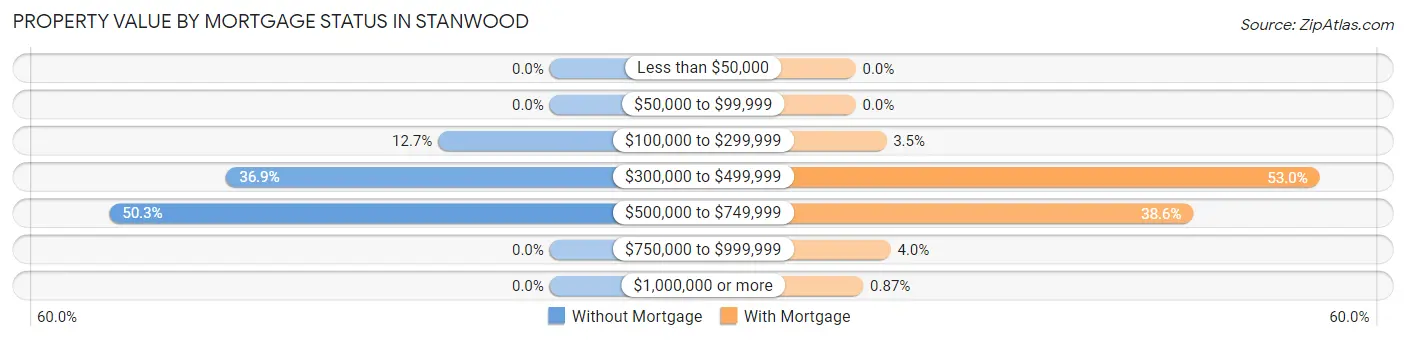
| Property Value | Without Mortgage | With Mortgage |
| Less than $50,000 | 0 (0.0%) | 0 (0.0%) |
| $50,000 to $99,999 | 0 (0.0%) | 0 (0.0%) |
| $100,000 to $299,999 | 40 (12.7%) | 56 (3.5%) |
| $300,000 to $499,999 | 116 (36.9%) | 849 (53.0%) |
| $500,000 to $749,999 | 158 (50.3%) | 618 (38.6%) |
| $750,000 to $999,999 | 0 (0.0%) | 64 (4.0%) |
| $1,000,000 or more | 0 (0.0%) | 14 (0.9%) |
| Total | 314 (100.0%) | 1,601 (100.0%) |
Household Income by Mortgage Status in Stanwood
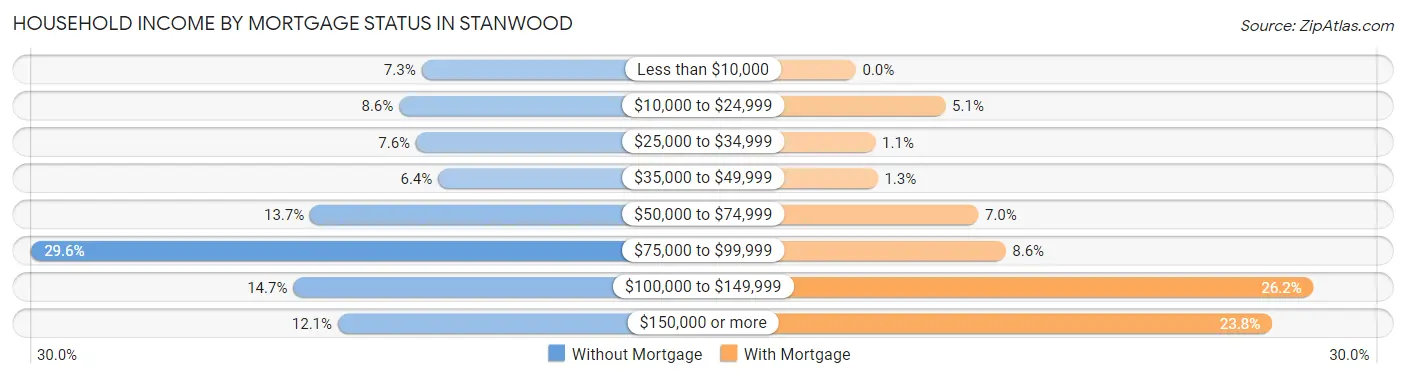
| Household Income | Without Mortgage | With Mortgage |
| Less than $10,000 | 23 (7.3%) | 0 (0.0%) |
| $10,000 to $24,999 | 27 (8.6%) | 82 (5.1%) |
| $25,000 to $34,999 | 24 (7.6%) | 18 (1.1%) |
| $35,000 to $49,999 | 20 (6.4%) | 20 (1.3%) |
| $50,000 to $74,999 | 43 (13.7%) | 112 (7.0%) |
| $75,000 to $99,999 | 93 (29.6%) | 137 (8.6%) |
| $100,000 to $149,999 | 46 (14.6%) | 419 (26.2%) |
| $150,000 or more | 38 (12.1%) | 381 (23.8%) |
| Total | 314 (100.0%) | 1,601 (100.0%) |
Property Value to Household Income Ratio in Stanwood
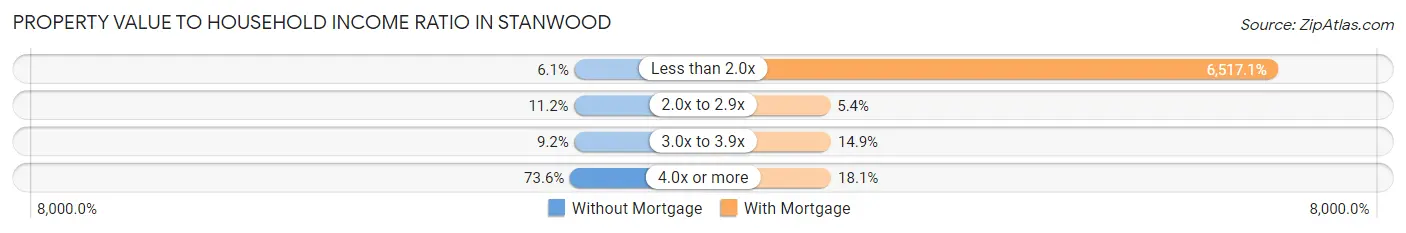
| Value-to-Income Ratio | Without Mortgage | With Mortgage |
| Less than 2.0x | 19 (6.0%) | 104,338 (6,517.1%) |
| 2.0x to 2.9x | 35 (11.2%) | 87 (5.4%) |
| 3.0x to 3.9x | 29 (9.2%) | 239 (14.9%) |
| 4.0x or more | 231 (73.6%) | 289 (18.0%) |
| Total | 314 (100.0%) | 1,601 (100.0%) |
Real Estate Taxes by Mortgage Status in Stanwood
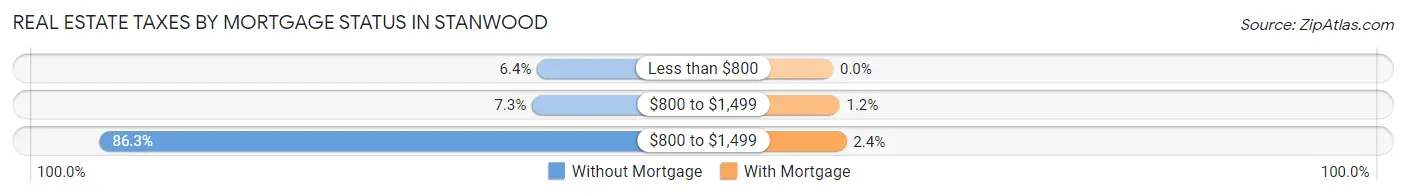
| Property Taxes | Without Mortgage | With Mortgage |
| Less than $800 | 20 (6.4%) | 0 (0.0%) |
| $800 to $1,499 | 23 (7.3%) | 19 (1.2%) |
| $800 to $1,499 | 271 (86.3%) | 39 (2.4%) |
| Total | 314 (100.0%) | 1,601 (100.0%) |
Health & Disability in Stanwood
Health Insurance Coverage by Age in Stanwood
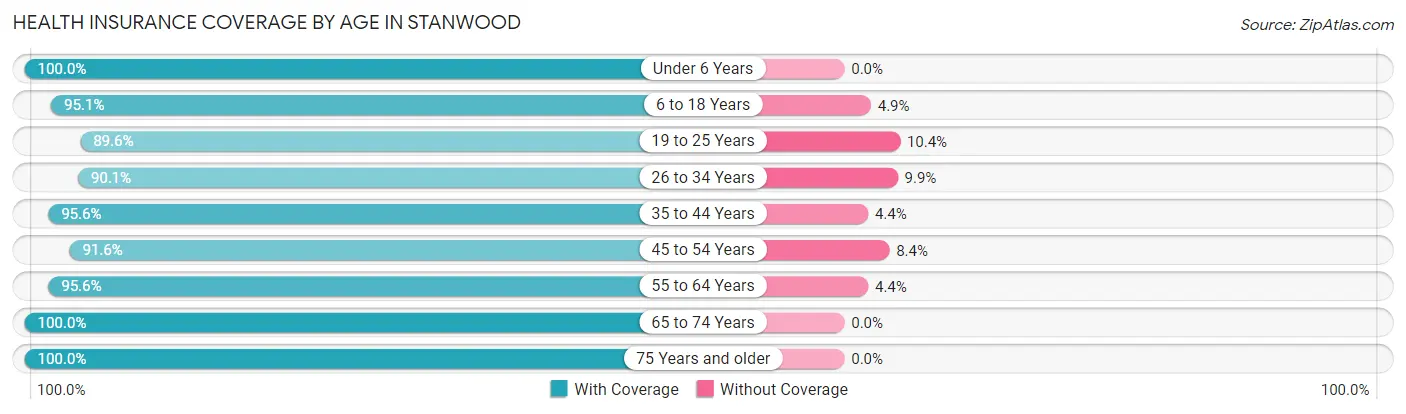
| Age Bracket | With Coverage | Without Coverage |
| Under 6 Years | 596 (100.0%) | 0 (0.0%) |
| 6 to 18 Years | 1,769 (95.1%) | 92 (4.9%) |
| 19 to 25 Years | 613 (89.6%) | 71 (10.4%) |
| 26 to 34 Years | 852 (90.1%) | 94 (9.9%) |
| 35 to 44 Years | 1,083 (95.6%) | 50 (4.4%) |
| 45 to 54 Years | 788 (91.6%) | 72 (8.4%) |
| 55 to 64 Years | 733 (95.6%) | 34 (4.4%) |
| 65 to 74 Years | 634 (100.0%) | 0 (0.0%) |
| 75 Years and older | 402 (100.0%) | 0 (0.0%) |
| Total | 7,470 (94.8%) | 413 (5.2%) |
Health Insurance Coverage by Citizenship Status in Stanwood
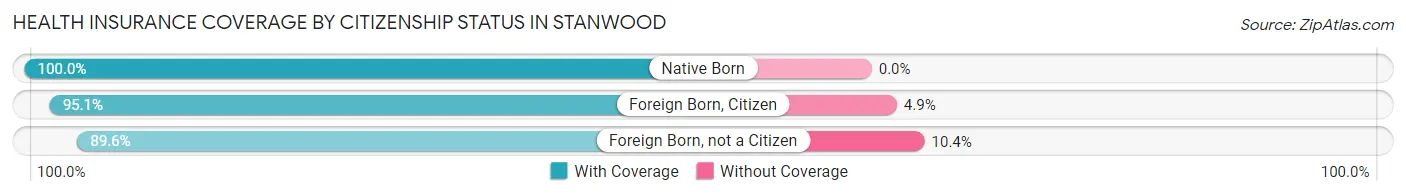
| Citizenship Status | With Coverage | Without Coverage |
| Native Born | 596 (100.0%) | 0 (0.0%) |
| Foreign Born, Citizen | 1,769 (95.1%) | 92 (4.9%) |
| Foreign Born, not a Citizen | 613 (89.6%) | 71 (10.4%) |
Health Insurance Coverage by Household Income in Stanwood
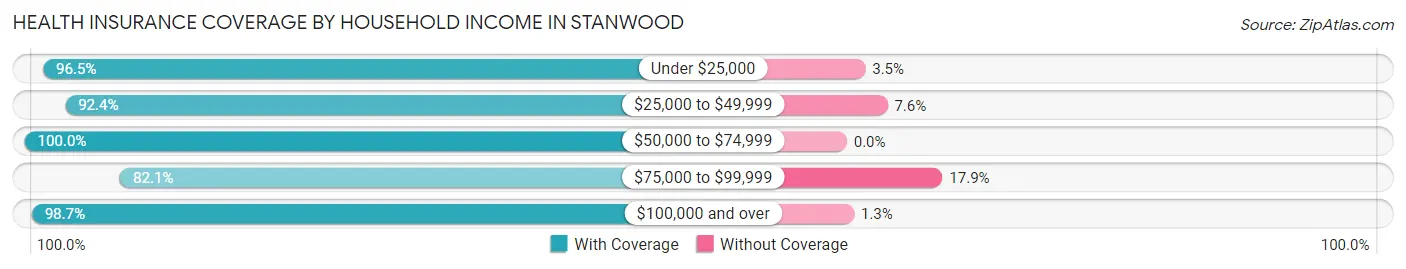
| Household Income | With Coverage | Without Coverage |
| Under $25,000 | 447 (96.5%) | 16 (3.5%) |
| $25,000 to $49,999 | 618 (92.4%) | 51 (7.6%) |
| $50,000 to $74,999 | 1,745 (100.0%) | 0 (0.0%) |
| $75,000 to $99,999 | 1,384 (82.1%) | 302 (17.9%) |
| $100,000 and over | 3,237 (98.7%) | 44 (1.3%) |
Public vs Private Health Insurance Coverage by Age in Stanwood
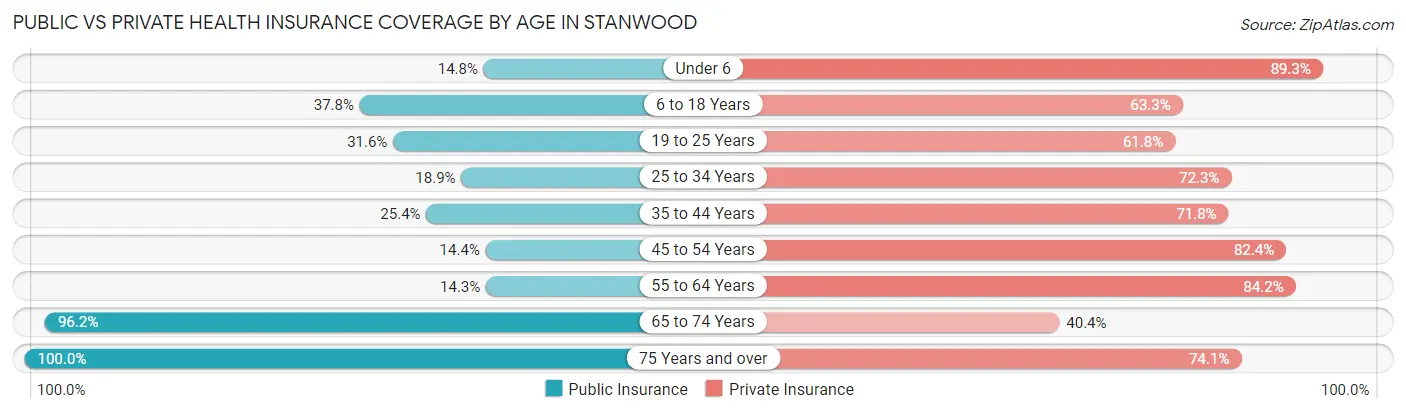
| Age Bracket | Public Insurance | Private Insurance |
| Under 6 | 88 (14.8%) | 532 (89.3%) |
| 6 to 18 Years | 703 (37.8%) | 1,177 (63.2%) |
| 19 to 25 Years | 216 (31.6%) | 423 (61.8%) |
| 25 to 34 Years | 179 (18.9%) | 684 (72.3%) |
| 35 to 44 Years | 288 (25.4%) | 813 (71.8%) |
| 45 to 54 Years | 124 (14.4%) | 709 (82.4%) |
| 55 to 64 Years | 110 (14.3%) | 646 (84.2%) |
| 65 to 74 Years | 610 (96.2%) | 256 (40.4%) |
| 75 Years and over | 402 (100.0%) | 298 (74.1%) |
| Total | 2,720 (34.5%) | 5,538 (70.3%) |
Disability Status by Sex by Age in Stanwood
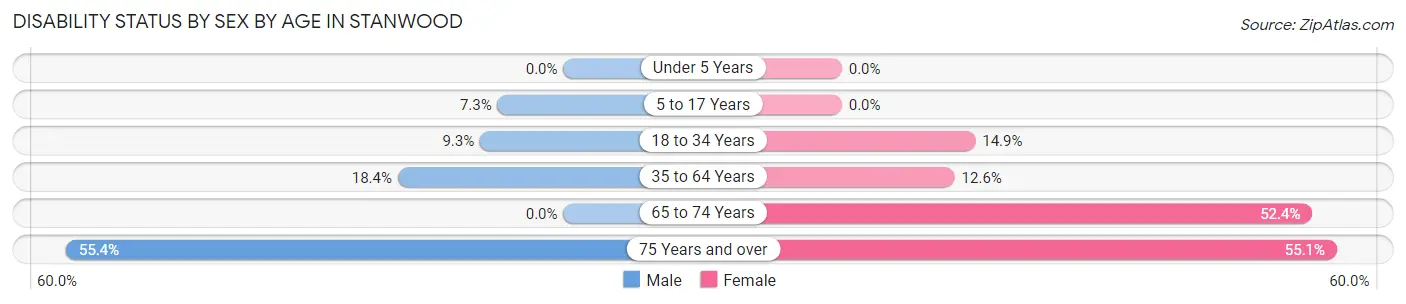
| Age Bracket | Male | Female |
| Under 5 Years | 0 (0.0%) | 0 (0.0%) |
| 5 to 17 Years | 74 (7.3%) | 0 (0.0%) |
| 18 to 34 Years | 87 (9.3%) | 112 (14.9%) |
| 35 to 64 Years | 236 (18.4%) | 186 (12.6%) |
| 65 to 74 Years | 0 (0.0%) | 208 (52.4%) |
| 75 Years and over | 77 (55.4%) | 145 (55.1%) |
Disability Class by Sex by Age in Stanwood
Disability Class: Hearing Difficulty
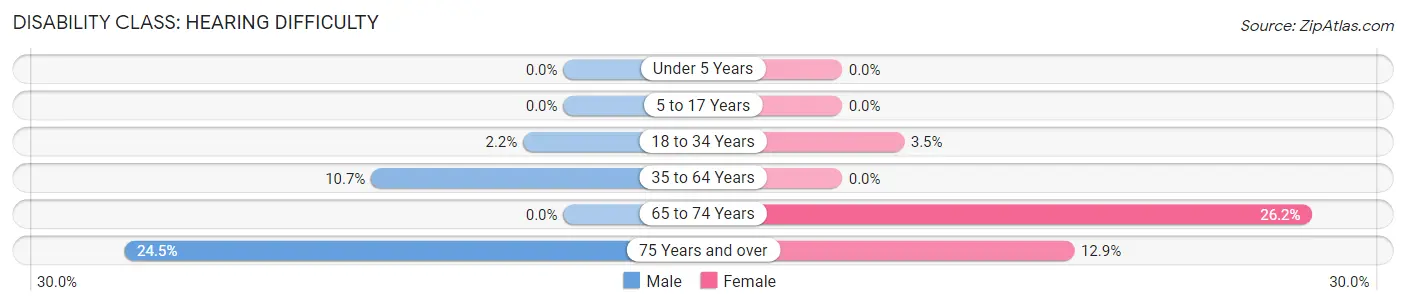
| Age Bracket | Male | Female |
| Under 5 Years | 0 (0.0%) | 0 (0.0%) |
| 5 to 17 Years | 0 (0.0%) | 0 (0.0%) |
| 18 to 34 Years | 21 (2.2%) | 26 (3.5%) |
| 35 to 64 Years | 137 (10.7%) | 0 (0.0%) |
| 65 to 74 Years | 0 (0.0%) | 104 (26.2%) |
| 75 Years and over | 34 (24.5%) | 34 (12.9%) |
Disability Class: Vision Difficulty
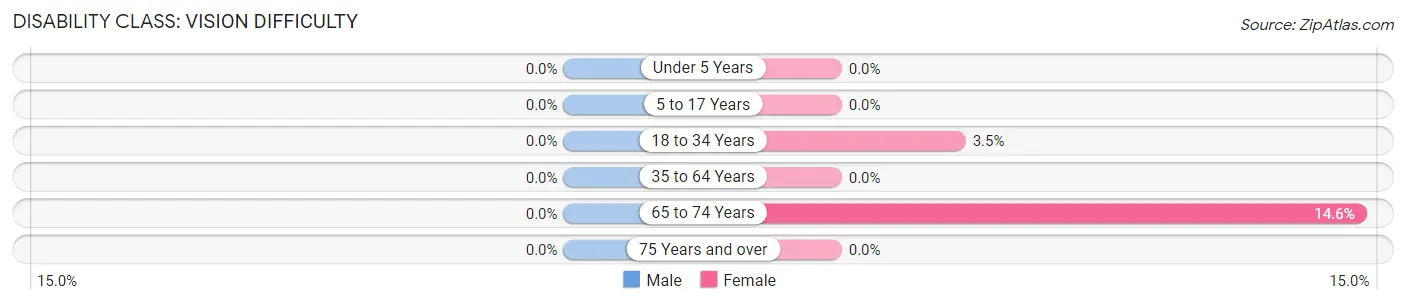
| Age Bracket | Male | Female |
| Under 5 Years | 0 (0.0%) | 0 (0.0%) |
| 5 to 17 Years | 0 (0.0%) | 0 (0.0%) |
| 18 to 34 Years | 0 (0.0%) | 26 (3.5%) |
| 35 to 64 Years | 0 (0.0%) | 0 (0.0%) |
| 65 to 74 Years | 0 (0.0%) | 58 (14.6%) |
| 75 Years and over | 0 (0.0%) | 0 (0.0%) |
Disability Class: Cognitive Difficulty
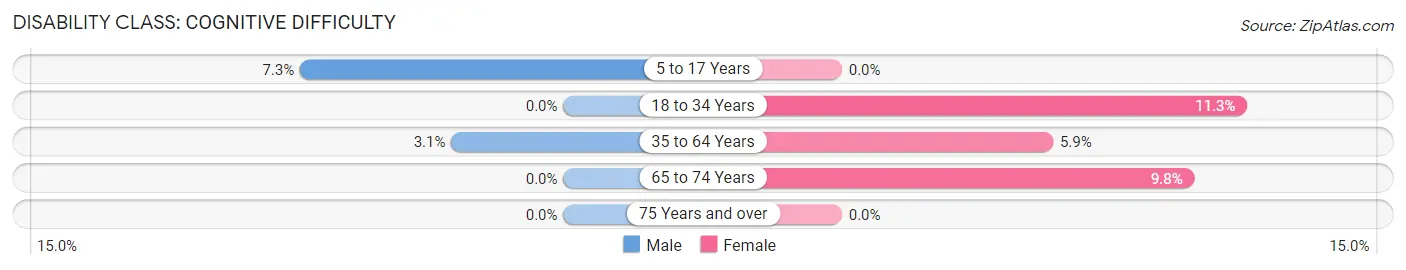
| Age Bracket | Male | Female |
| 5 to 17 Years | 74 (7.3%) | 0 (0.0%) |
| 18 to 34 Years | 0 (0.0%) | 85 (11.3%) |
| 35 to 64 Years | 40 (3.1%) | 87 (5.9%) |
| 65 to 74 Years | 0 (0.0%) | 39 (9.8%) |
| 75 Years and over | 0 (0.0%) | 0 (0.0%) |
Disability Class: Ambulatory Difficulty
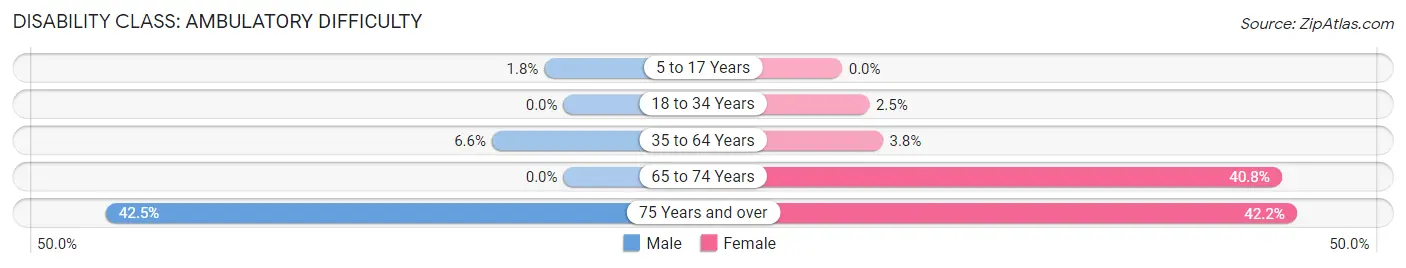
| Age Bracket | Male | Female |
| 5 to 17 Years | 18 (1.8%) | 0 (0.0%) |
| 18 to 34 Years | 0 (0.0%) | 19 (2.5%) |
| 35 to 64 Years | 85 (6.6%) | 56 (3.8%) |
| 65 to 74 Years | 0 (0.0%) | 162 (40.8%) |
| 75 Years and over | 59 (42.4%) | 111 (42.2%) |
Disability Class: Self-Care Difficulty
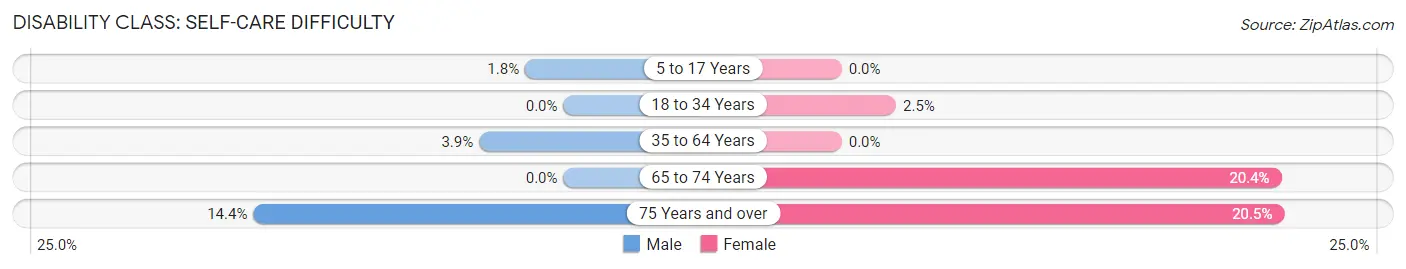
| Age Bracket | Male | Female |
| 5 to 17 Years | 18 (1.8%) | 0 (0.0%) |
| 18 to 34 Years | 0 (0.0%) | 19 (2.5%) |
| 35 to 64 Years | 50 (3.9%) | 0 (0.0%) |
| 65 to 74 Years | 0 (0.0%) | 81 (20.4%) |
| 75 Years and over | 20 (14.4%) | 54 (20.5%) |
Technology Access in Stanwood
Computing Device Access in Stanwood
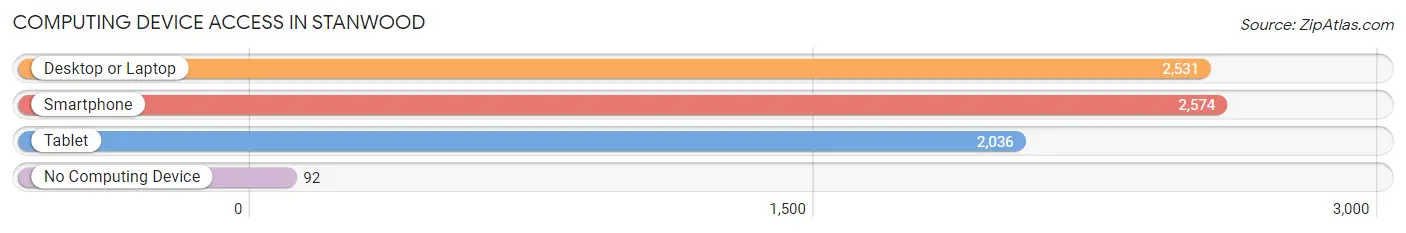
| Device Type | # Households | % Households |
| Desktop or Laptop | 2,531 | 87.8% |
| Smartphone | 2,574 | 89.2% |
| Tablet | 2,036 | 70.6% |
| No Computing Device | 92 | 3.2% |
| Total | 2,884 | 100.0% |
Internet Access in Stanwood
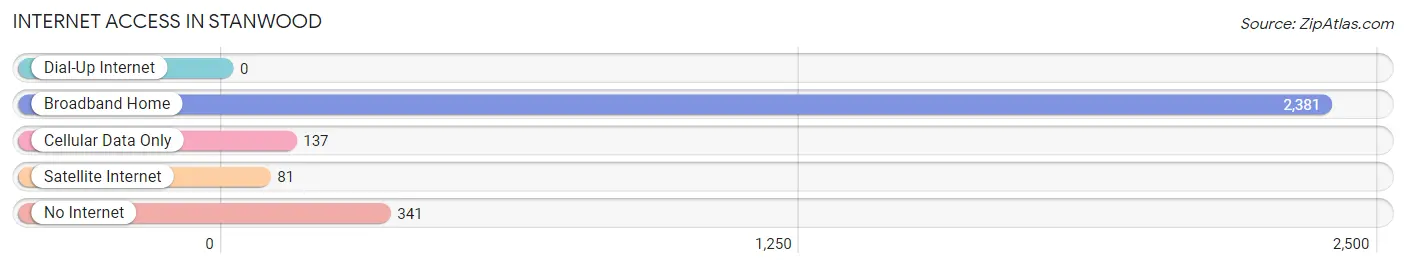
| Internet Type | # Households | % Households |
| Dial-Up Internet | 0 | 0.0% |
| Broadband Home | 2,381 | 82.6% |
| Cellular Data Only | 137 | 4.8% |
| Satellite Internet | 81 | 2.8% |
| No Internet | 341 | 11.8% |
| Total | 2,884 | 100.0% |
Stanwood Summary
Stanwood, Washington is a small city located in Snohomish County, Washington, United States. It is situated on the Stillaguamish River, approximately 40 miles north of Seattle. The city has a population of 6,231 as of the 2010 census, making it the largest city in Snohomish County.
History
The area that is now Stanwood was first inhabited by the Snohomish people, who lived in the area for thousands of years before the arrival of European settlers. The first European settlers arrived in the area in the late 1800s, and the town was officially incorporated in 1890. The town was named after the Stanwood family, who were among the first settlers in the area.
The town grew slowly in the early years, but began to experience rapid growth in the 1950s and 1960s as the Seattle metropolitan area expanded. The population of Stanwood grew from 1,000 in 1950 to over 6,000 by the year 2000.
Geography
Stanwood is located in the northwest corner of Snohomish County, Washington, approximately 40 miles north of Seattle. The city is situated on the Stillaguamish River, and is surrounded by the Cascade Mountains to the east and the Olympic Mountains to the west. The city has a total area of 5.3 square miles, of which 5.2 square miles is land and 0.1 square miles is water.
Economy
The economy of Stanwood is largely based on agriculture and tourism. The city is home to several farms, which produce a variety of crops, including apples, cherries, and blueberries. The city is also home to several wineries, which produce a variety of wines.
Tourism is also an important part of the local economy. The city is home to several parks and recreational areas, including the Stanwood Wildlife Area, which is a popular destination for bird watching and other outdoor activities. The city also hosts several annual festivals and events, including the Stanwood Camano Island Fair, which is held every August.
Demographics
As of the 2010 census, the population of Stanwood was 6,231. The racial makeup of the city was 87.3% White, 0.7% African American, 1.2% Native American, 2.2% Asian, 0.2% Pacific Islander, 5.2% from other races, and 3.4% from two or more races. Hispanic or Latino of any race were 11.2% of the population.
The median income for a household in Stanwood was $50,945, and the median income for a family was $60,945. The per capita income for the city was $25,945. About 8.2% of families and 11.2% of the population were below the poverty line, including 16.2% of those under age 18 and 6.2% of those age 65 or over.
Common Questions
What is Per Capita Income in Stanwood?
Per Capita income in Stanwood is $39,247.
What is the Median Family Income in Stanwood?
Median Family Income in Stanwood is $96,786.
What is the Median Household income in Stanwood?
Median Household Income in Stanwood is $85,357.
What is Income or Wage Gap in Stanwood?
Income or Wage Gap in Stanwood is 47.4%.
Women in Stanwood earn 52.6 cents for every dollar earned by a man.
What is Inequality or Gini Index in Stanwood?
Inequality or Gini Index in Stanwood is 0.46.
What is the Total Population of Stanwood?
Total Population of Stanwood is 8,051.
What is the Total Male Population of Stanwood?
Total Male Population of Stanwood is 3,857.
What is the Total Female Population of Stanwood?
Total Female Population of Stanwood is 4,194.
What is the Ratio of Males per 100 Females in Stanwood?
There are 91.96 Males per 100 Females in Stanwood.
What is the Ratio of Females per 100 Males in Stanwood?
There are 108.74 Females per 100 Males in Stanwood.
What is the Median Population Age in Stanwood?
Median Population Age in Stanwood is 34.4 Years.
What is the Average Family Size in Stanwood
Average Family Size in Stanwood is 3.5 People.
What is the Average Household Size in Stanwood
Average Household Size in Stanwood is 2.7 People.
How Large is the Labor Force in Stanwood?
There are 3,507 People in the Labor Forcein in Stanwood.
What is the Percentage of People in the Labor Force in Stanwood?
58.1% of People are in the Labor Force in Stanwood.
What is the Unemployment Rate in Stanwood?
Unemployment Rate in Stanwood is 1.5%.