Zip Codes with the Highest Percentage of Population Employed in Security & Protection in Bremerton, WA
RELATED REPORTS & OPTIONS
Security & Protection
Bremerton
Compare Zip Codes
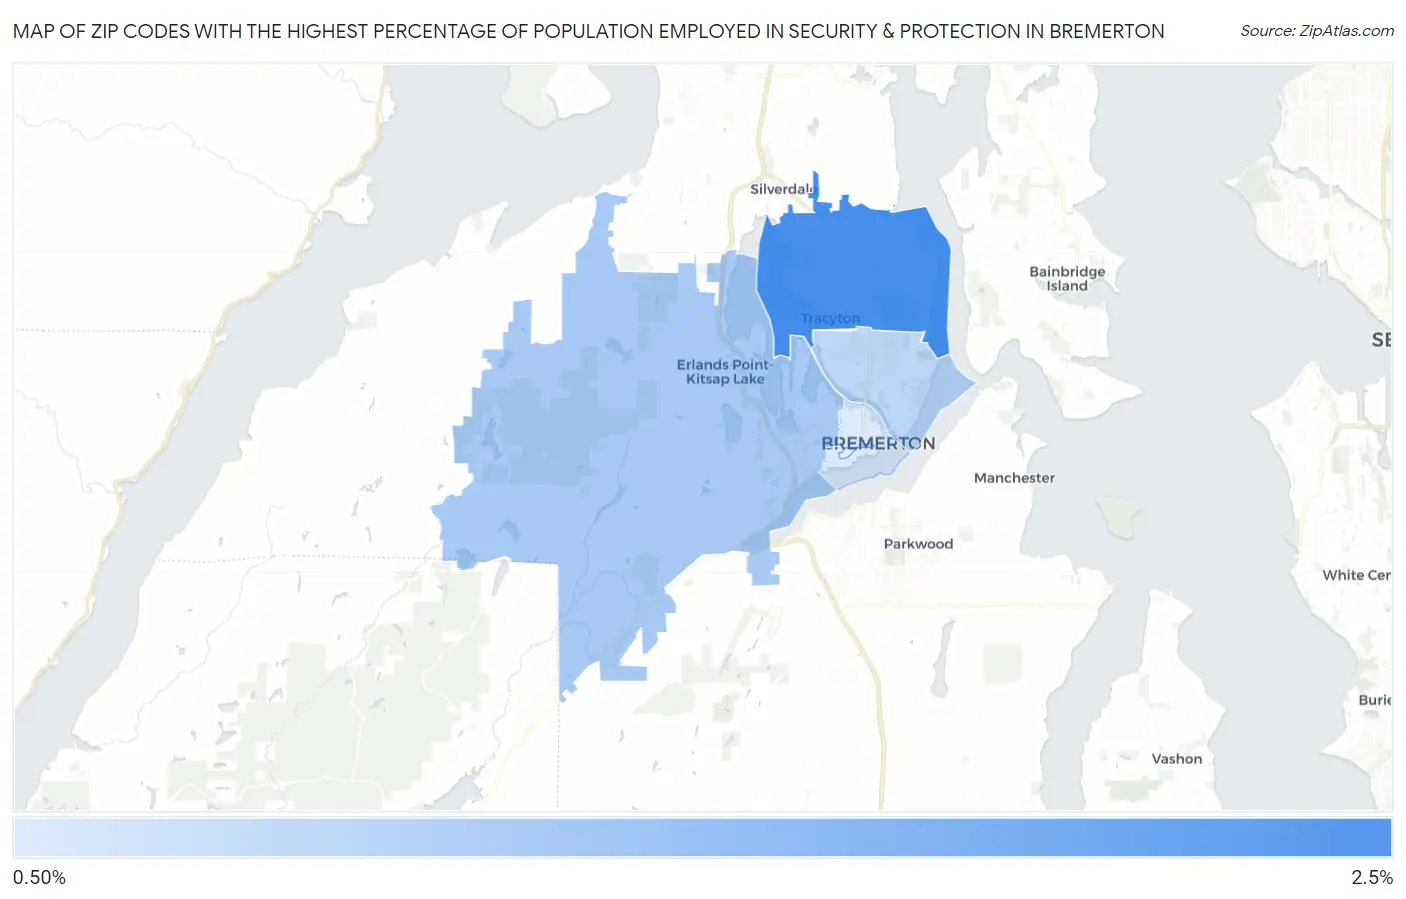
Map of Zip Codes with the Highest Percentage of Population Employed in Security & Protection in Bremerton
0.81%
2.4%
Zip Codes with the Highest Percentage of Population Employed in Security & Protection in Bremerton, WA
| Zip Code | % Employed | vs State | vs National | |
| 1. | 98311 | 2.4% | 1.8%(+0.625)#169 | 2.1%(+0.290)#9,865 |
| 2. | 98312 | 1.4% | 1.8%(-0.422)#327 | 2.1%(-0.757)#17,013 |
| 3. | 98310 | 1.1% | 1.8%(-0.666)#359 | 2.1%(-1.00)#18,916 |
| 4. | 98337 | 0.81% | 1.8%(-1.00)#403 | 2.1%(-1.34)#21,355 |
1
Common Questions
What are the Top 3 Zip Codes with the Highest Percentage of Population Employed in Security & Protection in Bremerton, WA?
Top 3 Zip Codes with the Highest Percentage of Population Employed in Security & Protection in Bremerton, WA are:
What zip code has the Highest Percentage of Population Employed in Security & Protection in Bremerton, WA?
98311 has the Highest Percentage of Population Employed in Security & Protection in Bremerton, WA with 2.4%.
What is the Percentage of Population Employed in Security & Protection in Bremerton, WA?
Percentage of Population Employed in Security & Protection in Bremerton is 0.99%.
What is the Percentage of Population Employed in Security & Protection in Washington?
Percentage of Population Employed in Security & Protection in Washington is 1.8%.
What is the Percentage of Population Employed in Security & Protection in the United States?
Percentage of Population Employed in Security & Protection in the United States is 2.1%.