Almira, WA Map & Demographics
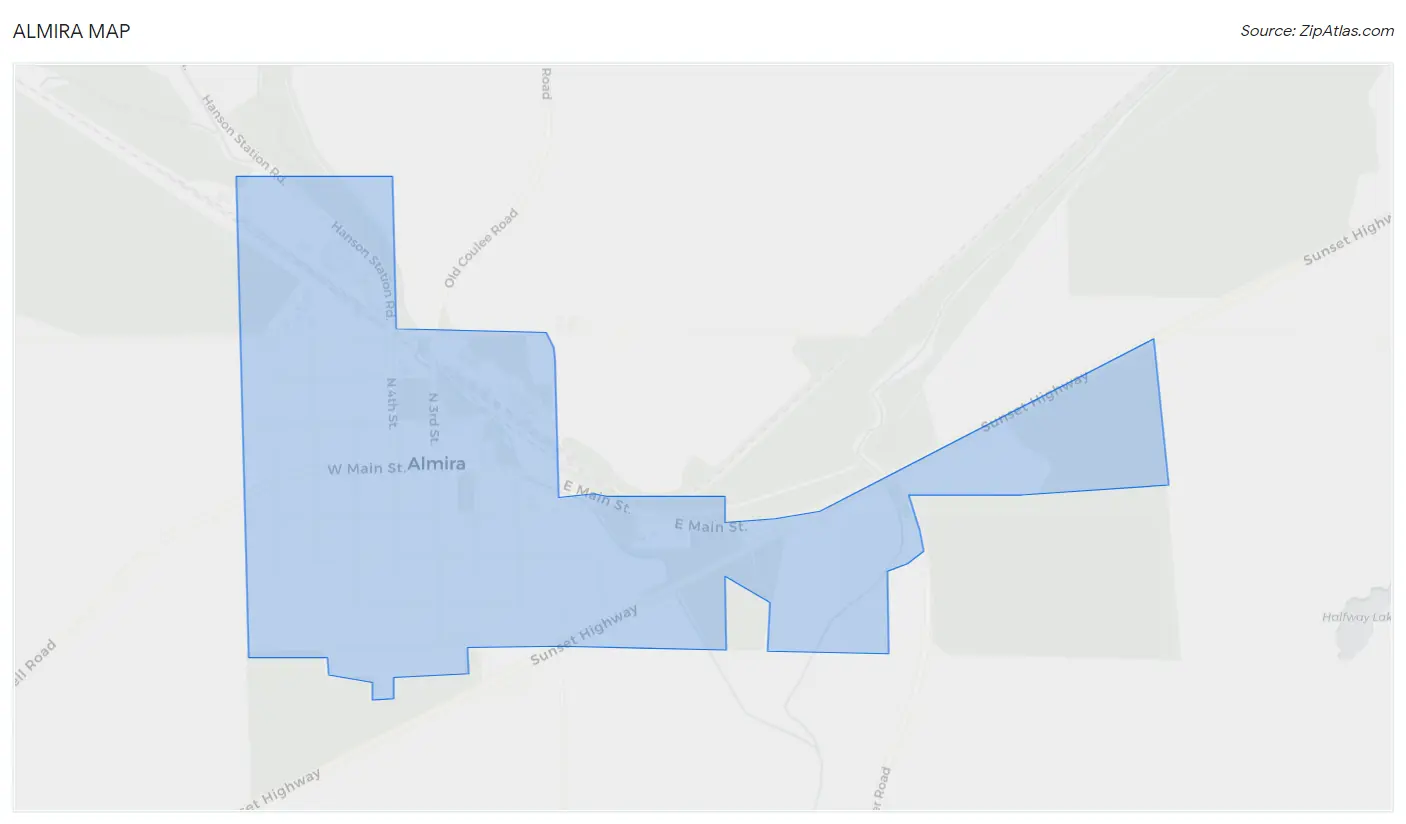
Almira Map
Almira Overview
$27,213
PER CAPITA INCOME
$75,313
AVG FAMILY INCOME
$72,188
AVG HOUSEHOLD INCOME
17.3%
WAGE / INCOME GAP [ % ]
82.7¢/ $1
WAGE / INCOME GAP [ $ ]
0.36
INEQUALITY / GINI INDEX
363
TOTAL POPULATION
175
MALE POPULATION
188
FEMALE POPULATION
93.09
MALES / 100 FEMALES
107.43
FEMALES / 100 MALES
37.0
MEDIAN AGE
3.9
AVG FAMILY SIZE
3.3
AVG HOUSEHOLD SIZE
107
LABOR FORCE [ PEOPLE ]
42.1%
PERCENT IN LABOR FORCE
10.3%
UNEMPLOYMENT RATE
Almira Zip Codes
Almira Area Codes
Income in Almira
Income Overview in Almira
Per Capita Income in Almira is $27,213, while median incomes of families and households are $75,313 and $72,188 respectively.
| Characteristic | Number | Measure |
| Per Capita Income | 363 | $27,213 |
| Median Family Income | 77 | $75,313 |
| Mean Family Income | 77 | $103,088 |
| Median Household Income | 109 | $72,188 |
| Mean Household Income | 109 | $94,098 |
| Income Deficit | 77 | $0 |
| Wage / Income Gap (%) | 363 | 17.33% |
| Wage / Income Gap ($) | 363 | 82.67¢ per $1 |
| Gini / Inequality Index | 363 | 0.36 |
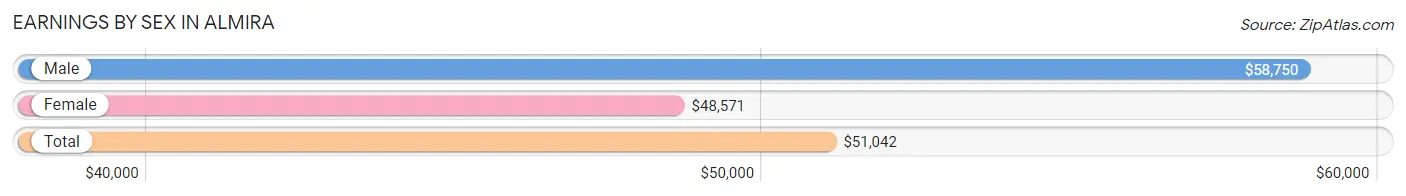
Earnings by Sex in Almira
Average Earnings in Almira are $51,042, $58,750 for men and $48,571 for women, a difference of 17.3%.
| Sex | Number | Average Earnings |
| Male | 73 (61.3%) | $58,750 |
| Female | 46 (38.7%) | $48,571 |
| Total | 119 (100.0%) | $51,042 |
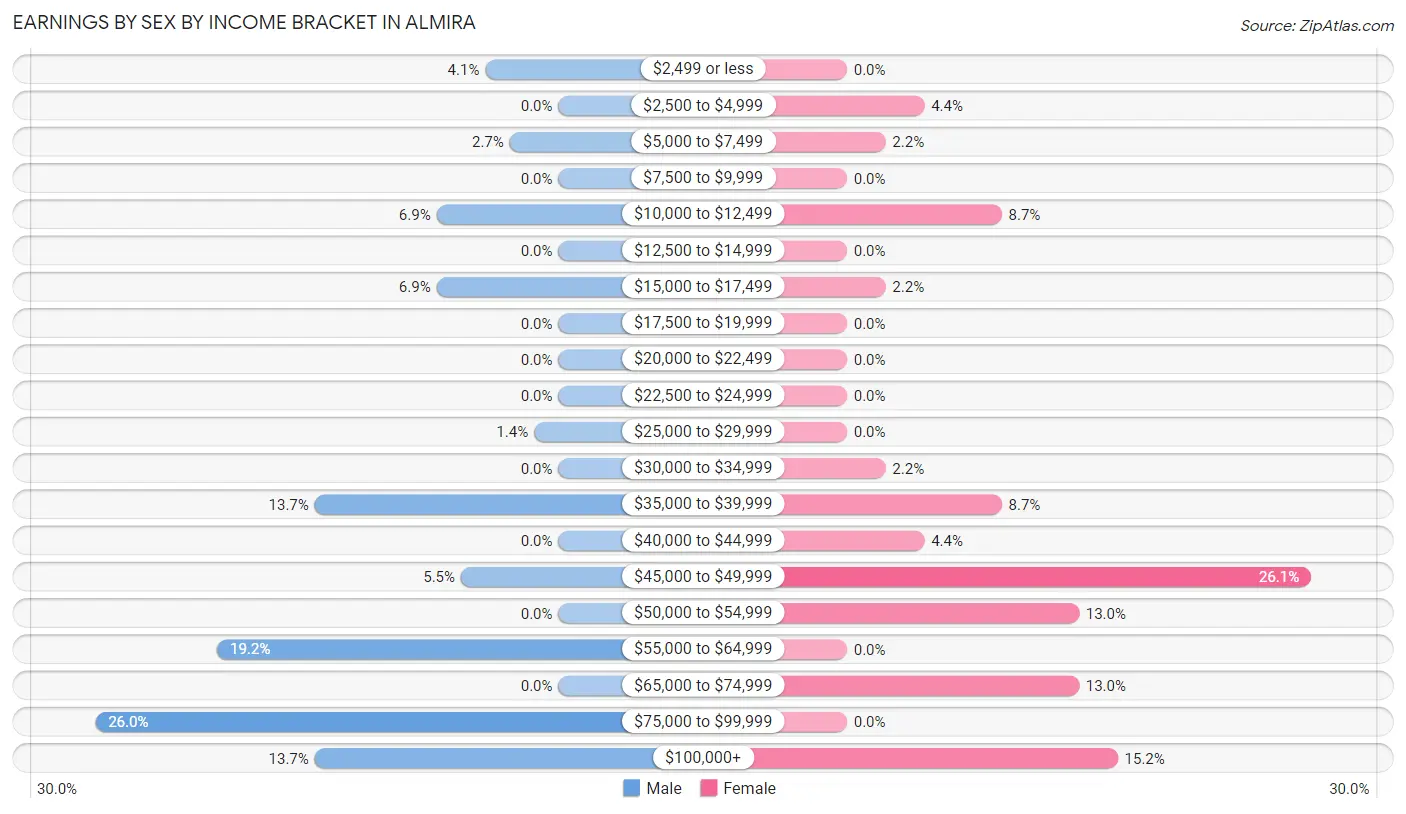
Earnings by Sex by Income Bracket in Almira
The most common earnings brackets in Almira are $75,000 to $99,999 for men (19 | 26.0%) and $45,000 to $49,999 for women (12 | 26.1%).
| Income | Male | Female |
| $2,499 or less | 3 (4.1%) | 0 (0.0%) |
| $2,500 to $4,999 | 0 (0.0%) | 2 (4.3%) |
| $5,000 to $7,499 | 2 (2.7%) | 1 (2.2%) |
| $7,500 to $9,999 | 0 (0.0%) | 0 (0.0%) |
| $10,000 to $12,499 | 5 (6.9%) | 4 (8.7%) |
| $12,500 to $14,999 | 0 (0.0%) | 0 (0.0%) |
| $15,000 to $17,499 | 5 (6.9%) | 1 (2.2%) |
| $17,500 to $19,999 | 0 (0.0%) | 0 (0.0%) |
| $20,000 to $22,499 | 0 (0.0%) | 0 (0.0%) |
| $22,500 to $24,999 | 0 (0.0%) | 0 (0.0%) |
| $25,000 to $29,999 | 1 (1.4%) | 0 (0.0%) |
| $30,000 to $34,999 | 0 (0.0%) | 1 (2.2%) |
| $35,000 to $39,999 | 10 (13.7%) | 4 (8.7%) |
| $40,000 to $44,999 | 0 (0.0%) | 2 (4.3%) |
| $45,000 to $49,999 | 4 (5.5%) | 12 (26.1%) |
| $50,000 to $54,999 | 0 (0.0%) | 6 (13.0%) |
| $55,000 to $64,999 | 14 (19.2%) | 0 (0.0%) |
| $65,000 to $74,999 | 0 (0.0%) | 6 (13.0%) |
| $75,000 to $99,999 | 19 (26.0%) | 0 (0.0%) |
| $100,000+ | 10 (13.7%) | 7 (15.2%) |
| Total | 73 (100.0%) | 46 (100.0%) |
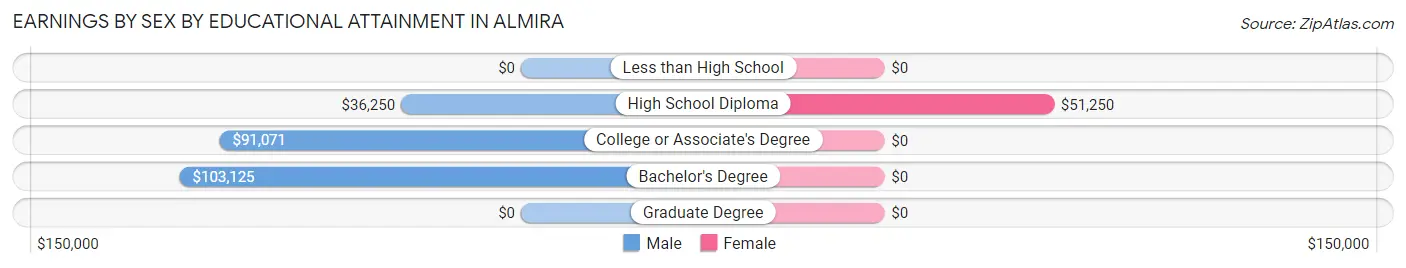
Earnings by Sex by Educational Attainment in Almira
Average earnings in Almira are $59,773 for men and $48,929 for women, a difference of 18.1%. Men with an educational attainment of bachelor's degree enjoy the highest average annual earnings of $103,125, while those with high school diploma education earn the least with $36,250. Women with an educational attainment of high school diploma earn the most with the average annual earnings of $51,250, while those with high school diploma education have the smallest earnings of $51,250.
| Educational Attainment | Male Income | Female Income |
| Less than High School | - | - |
| High School Diploma | $36,250 | $51,250 |
| College or Associate's Degree | $91,071 | $0 |
| Bachelor's Degree | $103,125 | $0 |
| Graduate Degree | - | - |
| Total | $59,773 | $48,929 |
Family Income in Almira
Family Income Brackets in Almira
According to the Almira family income data, there are 15 families falling into the $50,000 to $74,999 income range, which is the most common income bracket and makes up 19.5% of all families.
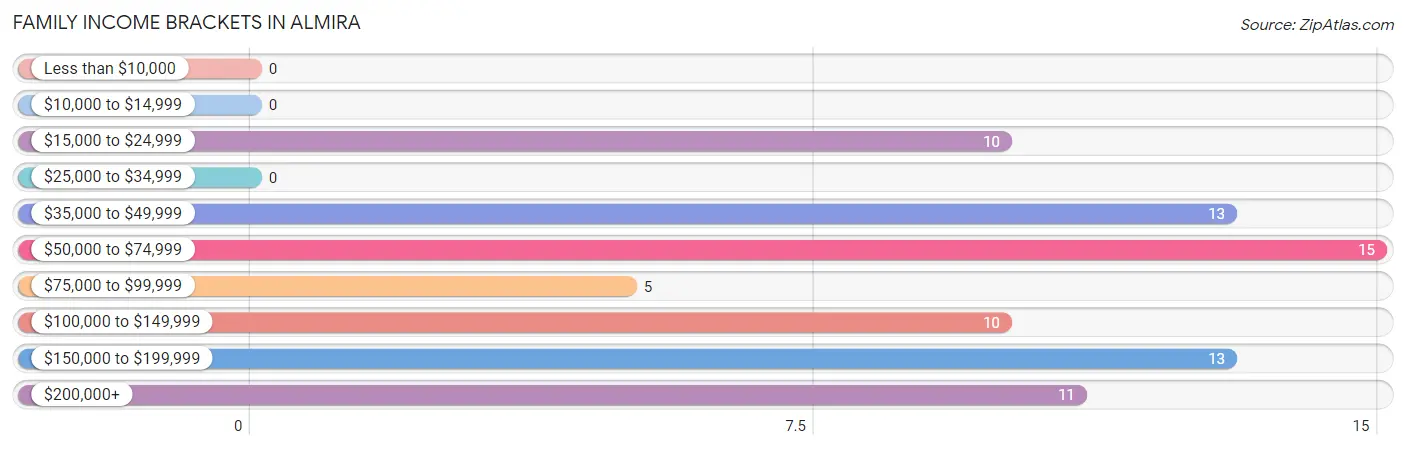
| Income Bracket | # Families | % Families |
| Less than $10,000 | 0 | 0.0% |
| $10,000 to $14,999 | 0 | 0.0% |
| $15,000 to $24,999 | 10 | 13.0% |
| $25,000 to $34,999 | 0 | 0.0% |
| $35,000 to $49,999 | 13 | 16.9% |
| $50,000 to $74,999 | 15 | 19.5% |
| $75,000 to $99,999 | 5 | 6.5% |
| $100,000 to $149,999 | 10 | 13.0% |
| $150,000 to $199,999 | 13 | 16.9% |
| $200,000+ | 11 | 14.3% |
Family Income by Famaliy Size in Almira
5-person families (16 | 20.8%) account for the highest median family income in Almira with $217,778 per family, while 5-person families (16 | 20.8%) have the highest median income of $43,556 per family member.
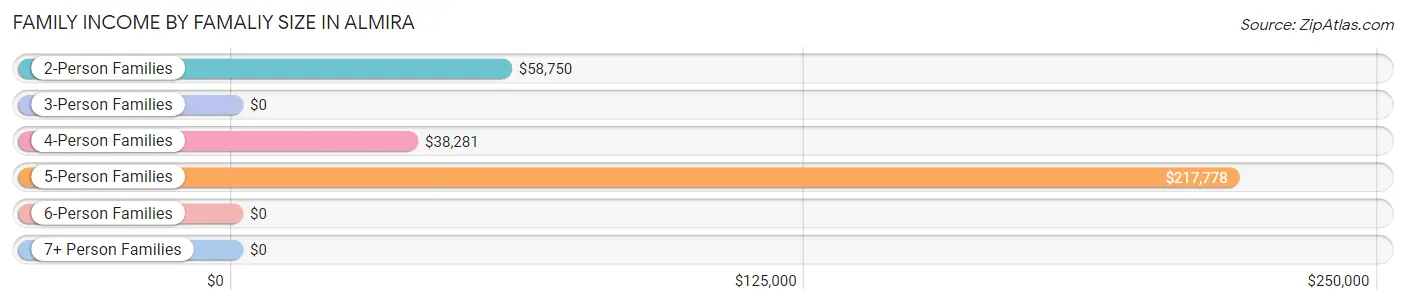
| Income Bracket | # Families | Median Income |
| 2-Person Families | 22 (28.6%) | $58,750 |
| 3-Person Families | 17 (22.1%) | $0 |
| 4-Person Families | 13 (16.9%) | $38,281 |
| 5-Person Families | 16 (20.8%) | $217,778 |
| 6-Person Families | 7 (9.1%) | $0 |
| 7+ Person Families | 2 (2.6%) | $0 |
| Total | 77 (100.0%) | $75,313 |
Family Income by Number of Earners in Almira
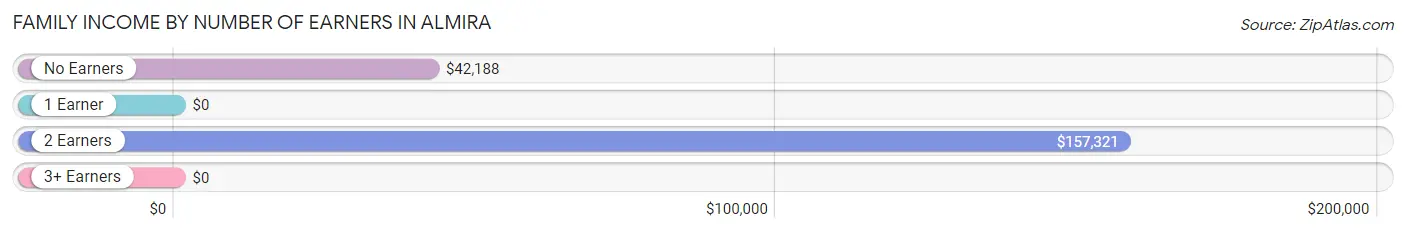
| Number of Earners | # Families | Median Income |
| No Earners | 27 (35.1%) | $42,188 |
| 1 Earner | 15 (19.5%) | $0 |
| 2 Earners | 31 (40.3%) | $157,321 |
| 3+ Earners | 4 (5.2%) | $0 |
| Total | 77 (100.0%) | $75,313 |
Household Income in Almira
Household Income Brackets in Almira
With 23 households falling in the category, the $50,000 to $74,999 income range is the most frequent in Almira, accounting for 21.1% of all households.
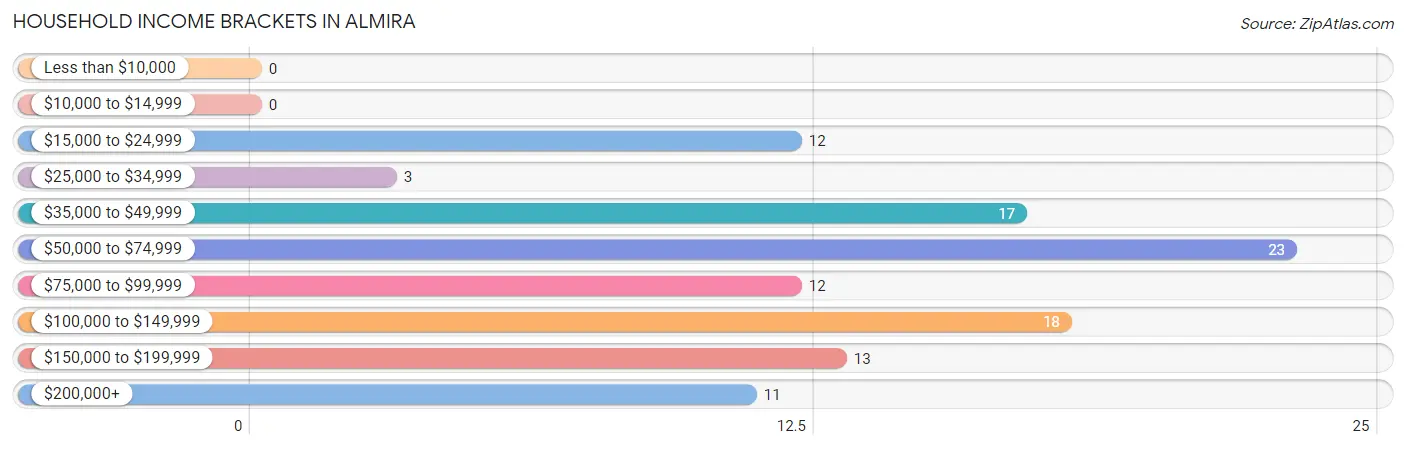
| Income Bracket | # Households | % Households |
| Less than $10,000 | 0 | 0.0% |
| $10,000 to $14,999 | 0 | 0.0% |
| $15,000 to $24,999 | 12 | 11.0% |
| $25,000 to $34,999 | 3 | 2.8% |
| $35,000 to $49,999 | 17 | 15.6% |
| $50,000 to $74,999 | 23 | 21.1% |
| $75,000 to $99,999 | 12 | 11.0% |
| $100,000 to $149,999 | 18 | 16.5% |
| $150,000 to $199,999 | 13 | 11.9% |
| $200,000+ | 11 | 10.1% |
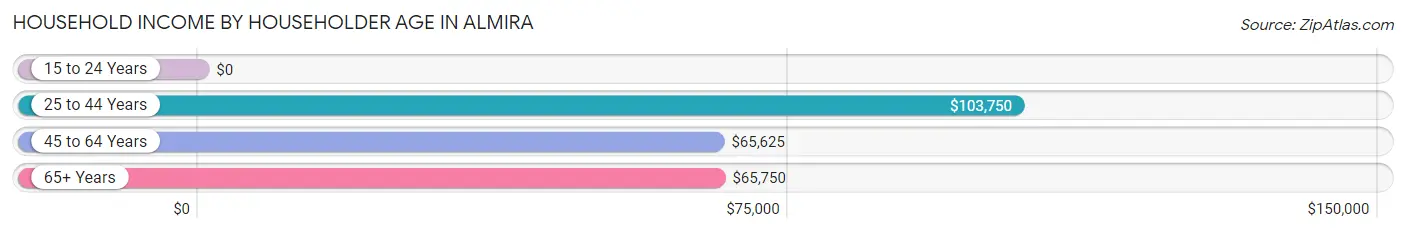
Household Income by Householder Age in Almira
The median household income in Almira is $72,188, with the highest median household income of $103,750 found in the 25 to 44 years age bracket for the primary householder. A total of 44 households (40.4%) fall into this category. Meanwhile, the 15 to 24 years age bracket for the primary householder has the lowest median household income of $0, with 4 households (3.7%) in this group.
| Income Bracket | # Households | Median Income |
| 15 to 24 Years | 4 (3.7%) | $0 |
| 25 to 44 Years | 44 (40.4%) | $103,750 |
| 45 to 64 Years | 30 (27.5%) | $65,625 |
| 65+ Years | 31 (28.4%) | $65,750 |
| Total | 109 (100.0%) | $72,188 |
Poverty in Almira
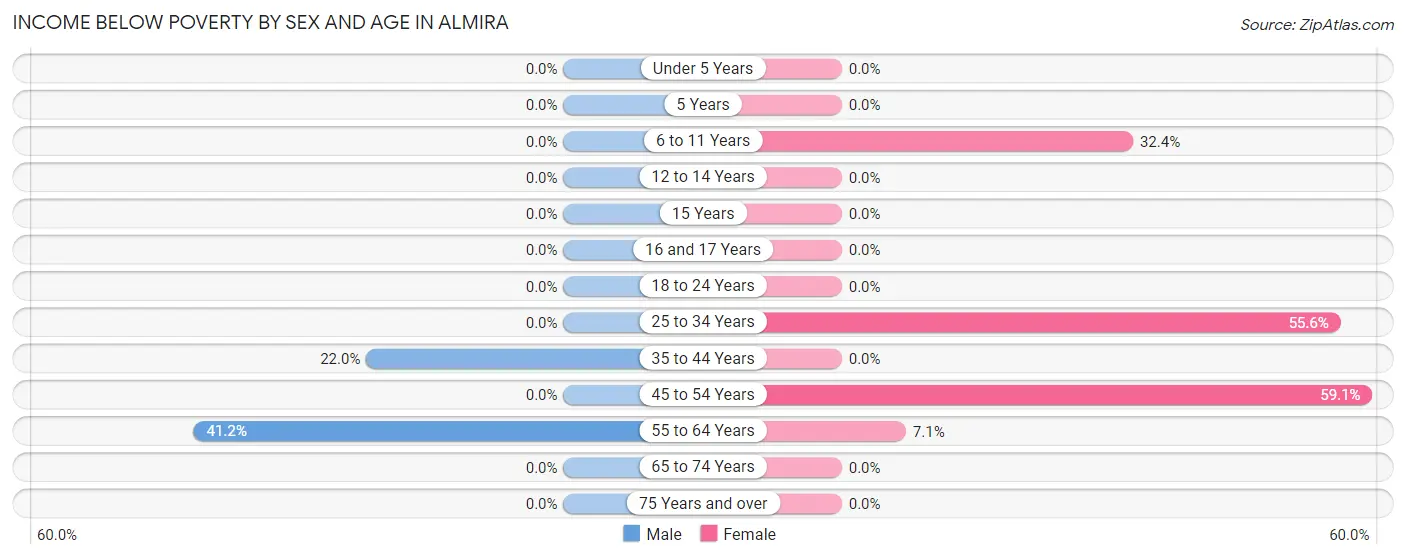
Income Below Poverty by Sex and Age in Almira
With 9.1% poverty level for males and 19.2% for females among the residents of Almira, 55 to 64 year old males and 45 to 54 year old females are the most vulnerable to poverty, with 7 males (41.2%) and 13 females (59.1%) in their respective age groups living below the poverty level.
| Age Bracket | Male | Female |
| Under 5 Years | 0 (0.0%) | 0 (0.0%) |
| 5 Years | 0 (0.0%) | 0 (0.0%) |
| 6 to 11 Years | 0 (0.0%) | 12 (32.4%) |
| 12 to 14 Years | 0 (0.0%) | 0 (0.0%) |
| 15 Years | 0 (0.0%) | 0 (0.0%) |
| 16 and 17 Years | 0 (0.0%) | 0 (0.0%) |
| 18 to 24 Years | 0 (0.0%) | 0 (0.0%) |
| 25 to 34 Years | 0 (0.0%) | 10 (55.6%) |
| 35 to 44 Years | 9 (22.0%) | 0 (0.0%) |
| 45 to 54 Years | 0 (0.0%) | 13 (59.1%) |
| 55 to 64 Years | 7 (41.2%) | 1 (7.1%) |
| 65 to 74 Years | 0 (0.0%) | 0 (0.0%) |
| 75 Years and over | 0 (0.0%) | 0 (0.0%) |
| Total | 16 (9.1%) | 36 (19.2%) |
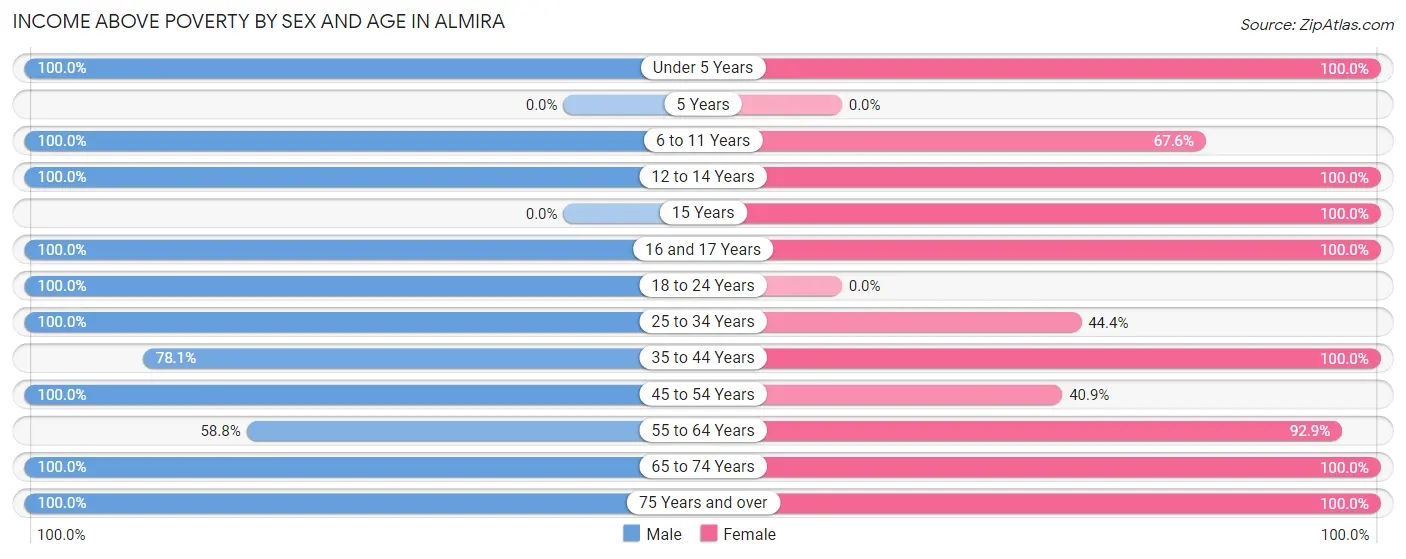
Income Above Poverty by Sex and Age in Almira
According to the poverty statistics in Almira, males aged under 5 years and females aged under 5 years are the age groups that are most secure financially, with 100.0% of males and 100.0% of females in these age groups living above the poverty line.
| Age Bracket | Male | Female |
| Under 5 Years | 9 (100.0%) | 6 (100.0%) |
| 5 Years | 0 (0.0%) | 0 (0.0%) |
| 6 to 11 Years | 20 (100.0%) | 25 (67.6%) |
| 12 to 14 Years | 16 (100.0%) | 16 (100.0%) |
| 15 Years | 0 (0.0%) | 5 (100.0%) |
| 16 and 17 Years | 8 (100.0%) | 16 (100.0%) |
| 18 to 24 Years | 9 (100.0%) | 0 (0.0%) |
| 25 to 34 Years | 9 (100.0%) | 8 (44.4%) |
| 35 to 44 Years | 32 (78.0%) | 24 (100.0%) |
| 45 to 54 Years | 10 (100.0%) | 9 (40.9%) |
| 55 to 64 Years | 10 (58.8%) | 13 (92.9%) |
| 65 to 74 Years | 11 (100.0%) | 11 (100.0%) |
| 75 Years and over | 25 (100.0%) | 19 (100.0%) |
| Total | 159 (90.9%) | 152 (80.8%) |
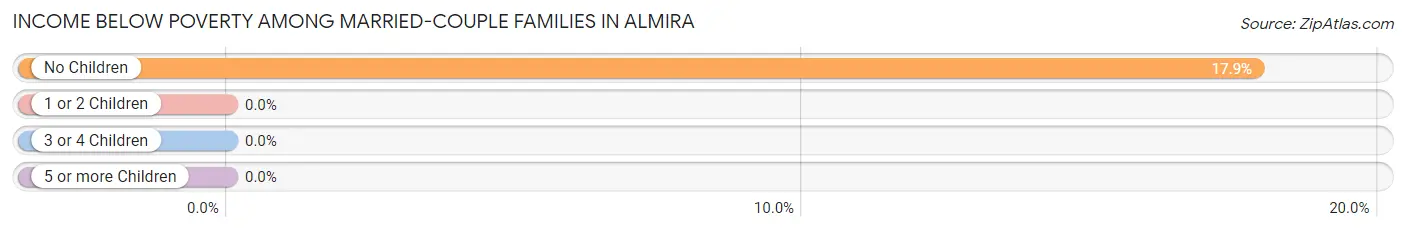
Income Below Poverty Among Married-Couple Families in Almira
The poverty statistics for married-couple families in Almira show that 8.3% or 5 of the total 60 families live below the poverty line. Families with no children have the highest poverty rate of 17.9%, comprising of 5 families. On the other hand, families with 1 or 2 children have the lowest poverty rate of 0.0%, which includes 0 families.
| Children | Above Poverty | Below Poverty |
| No Children | 23 (82.1%) | 5 (17.9%) |
| 1 or 2 Children | 14 (100.0%) | 0 (0.0%) |
| 3 or 4 Children | 16 (100.0%) | 0 (0.0%) |
| 5 or more Children | 2 (100.0%) | 0 (0.0%) |
| Total | 55 (91.7%) | 5 (8.3%) |
Income Below Poverty Among Single-Parent Households in Almira
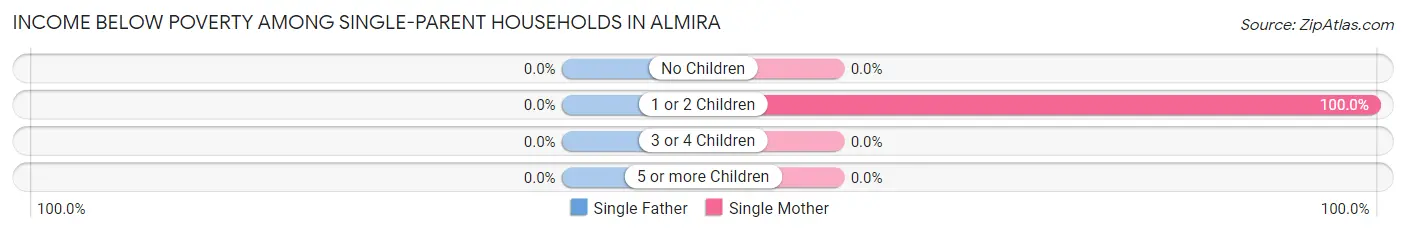
| Children | Single Father | Single Mother |
| No Children | 0 (0.0%) | 0 (0.0%) |
| 1 or 2 Children | 0 (0.0%) | 4 (100.0%) |
| 3 or 4 Children | 0 (0.0%) | 0 (0.0%) |
| 5 or more Children | 0 (0.0%) | 0 (0.0%) |
| Total | 0 (0.0%) | 4 (44.4%) |
Income Below Poverty Among Married-Couple vs Single-Parent Households in Almira
The poverty data for Almira shows that 5 of the married-couple family households (8.3%) and 4 of the single-parent households (23.5%) are living below the poverty level. Within the married-couple family households, those with no children have the highest poverty rate, with 5 households (17.9%) falling below the poverty line. Among the single-parent households, those with 1 or 2 children have the highest poverty rate, with 4 household (100.0%) living below poverty.
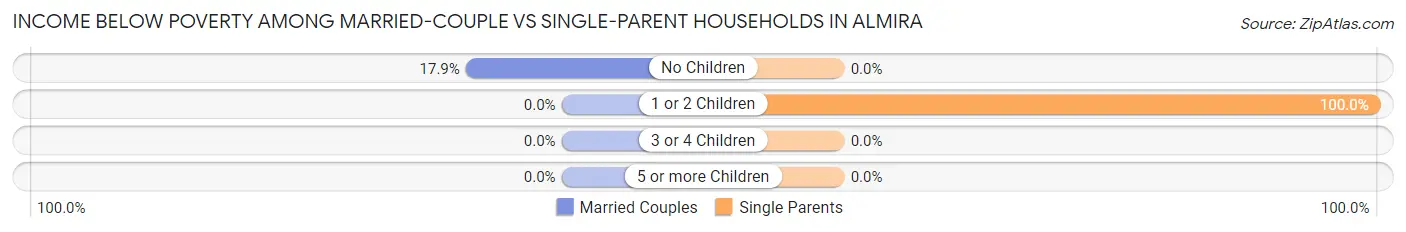
| Children | Married-Couple Families | Single-Parent Households |
| No Children | 5 (17.9%) | 0 (0.0%) |
| 1 or 2 Children | 0 (0.0%) | 4 (100.0%) |
| 3 or 4 Children | 0 (0.0%) | 0 (0.0%) |
| 5 or more Children | 0 (0.0%) | 0 (0.0%) |
| Total | 5 (8.3%) | 4 (23.5%) |
Race in Almira
The most populous races in Almira are White / Caucasian (360 | 99.2%), and Asian (3 | 0.8%).
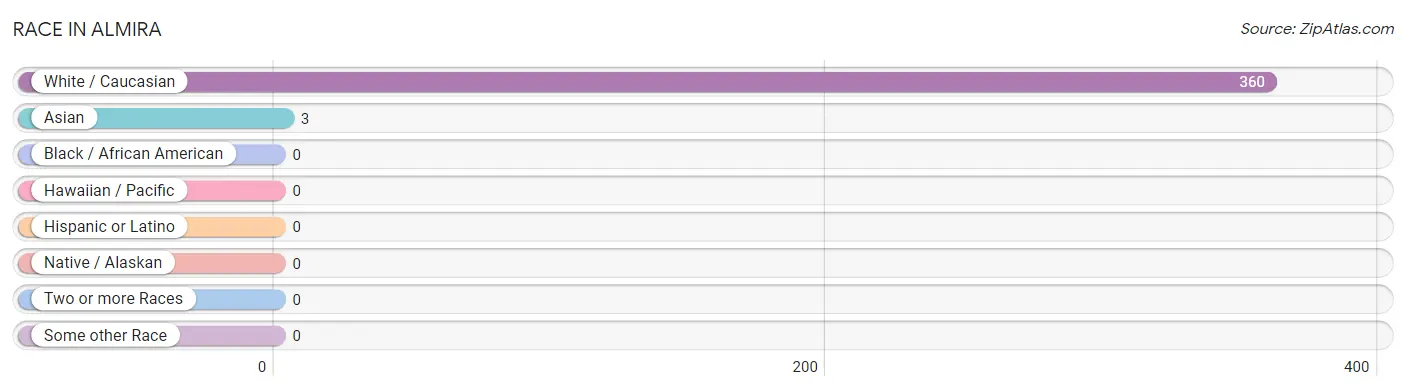
| Race | # Population | % Population |
| Asian | 3 | 0.8% |
| Black / African American | 0 | 0.0% |
| Hawaiian / Pacific | 0 | 0.0% |
| Hispanic or Latino | 0 | 0.0% |
| Native / Alaskan | 0 | 0.0% |
| White / Caucasian | 360 | 99.2% |
| Two or more Races | 0 | 0.0% |
| Some other Race | 0 | 0.0% |
| Total | 363 | 100.0% |
Ancestry in Almira
The most populous ancestries reported in Almira are American (96 | 26.5%), German (49 | 13.5%), Irish (25 | 6.9%), English (15 | 4.1%), and Scandinavian (11 | 3.0%), together accounting for 54.0% of all Almira residents.
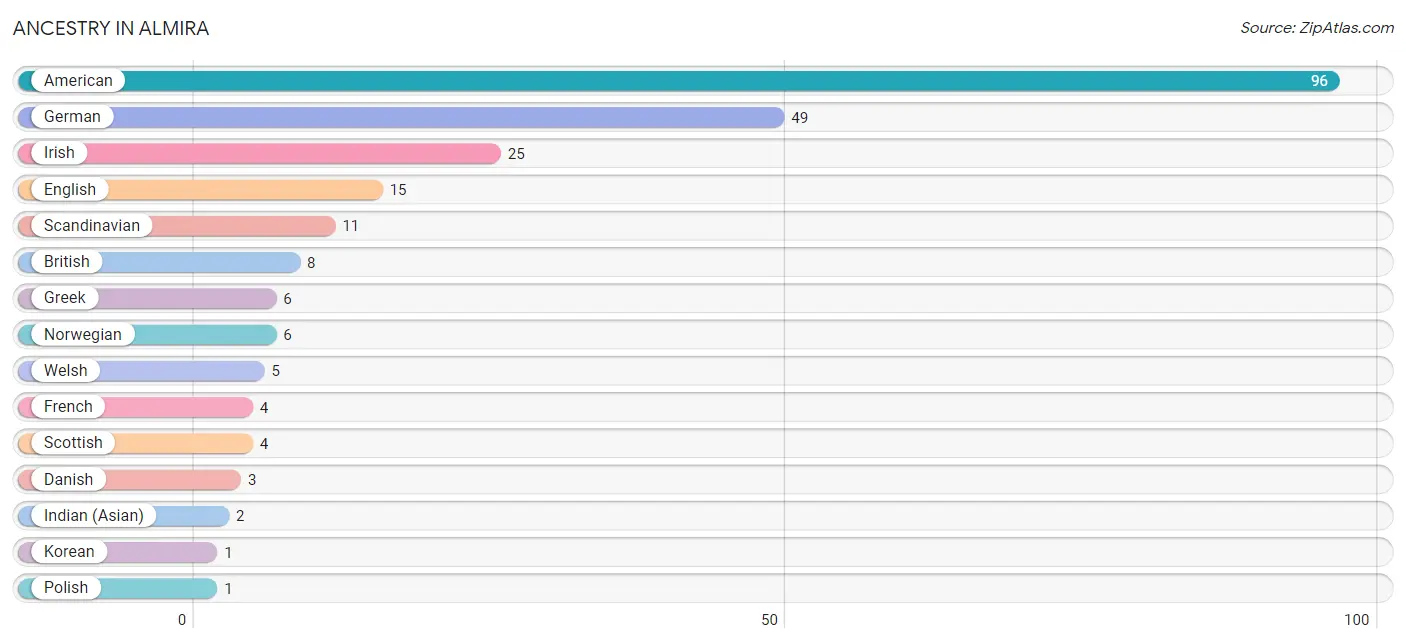
| Ancestry | # Population | % Population |
| American | 96 | 26.5% |
| British | 8 | 2.2% |
| Danish | 3 | 0.8% |
| English | 15 | 4.1% |
| French | 4 | 1.1% |
| German | 49 | 13.5% |
| Greek | 6 | 1.7% |
| Indian (Asian) | 2 | 0.5% |
| Irish | 25 | 6.9% |
| Korean | 1 | 0.3% |
| Norwegian | 6 | 1.7% |
| Polish | 1 | 0.3% |
| Scandinavian | 11 | 3.0% |
| Scotch-Irish | 1 | 0.3% |
| Scottish | 4 | 1.1% |
| Welsh | 5 | 1.4% | View All 16 Rows |
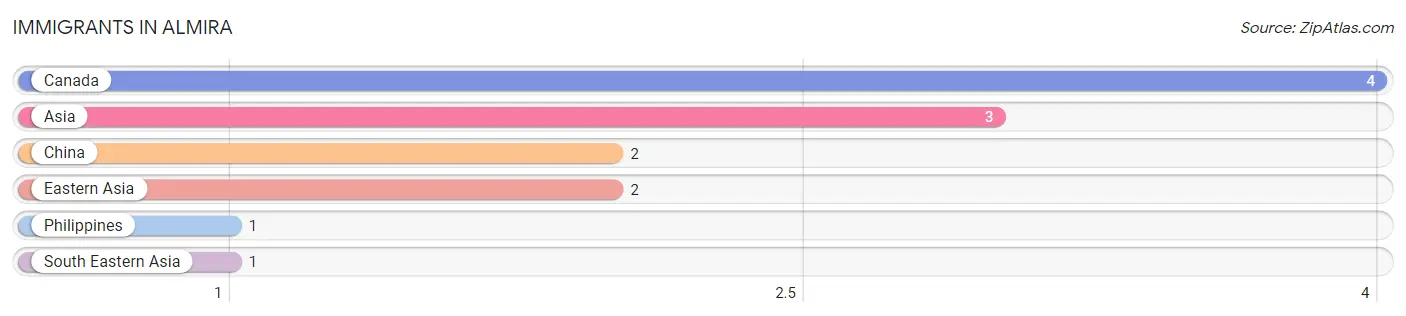
Immigrants in Almira
The most numerous immigrant groups reported in Almira came from Canada (4 | 1.1%), Asia (3 | 0.8%), China (2 | 0.5%), Eastern Asia (2 | 0.5%), and Philippines (1 | 0.3%), together accounting for 3.3% of all Almira residents.
| Immigration Origin | # Population | % Population |
| Asia | 3 | 0.8% |
| Canada | 4 | 1.1% |
| China | 2 | 0.5% |
| Eastern Asia | 2 | 0.5% |
| Philippines | 1 | 0.3% |
| South Eastern Asia | 1 | 0.3% | View All 6 Rows |
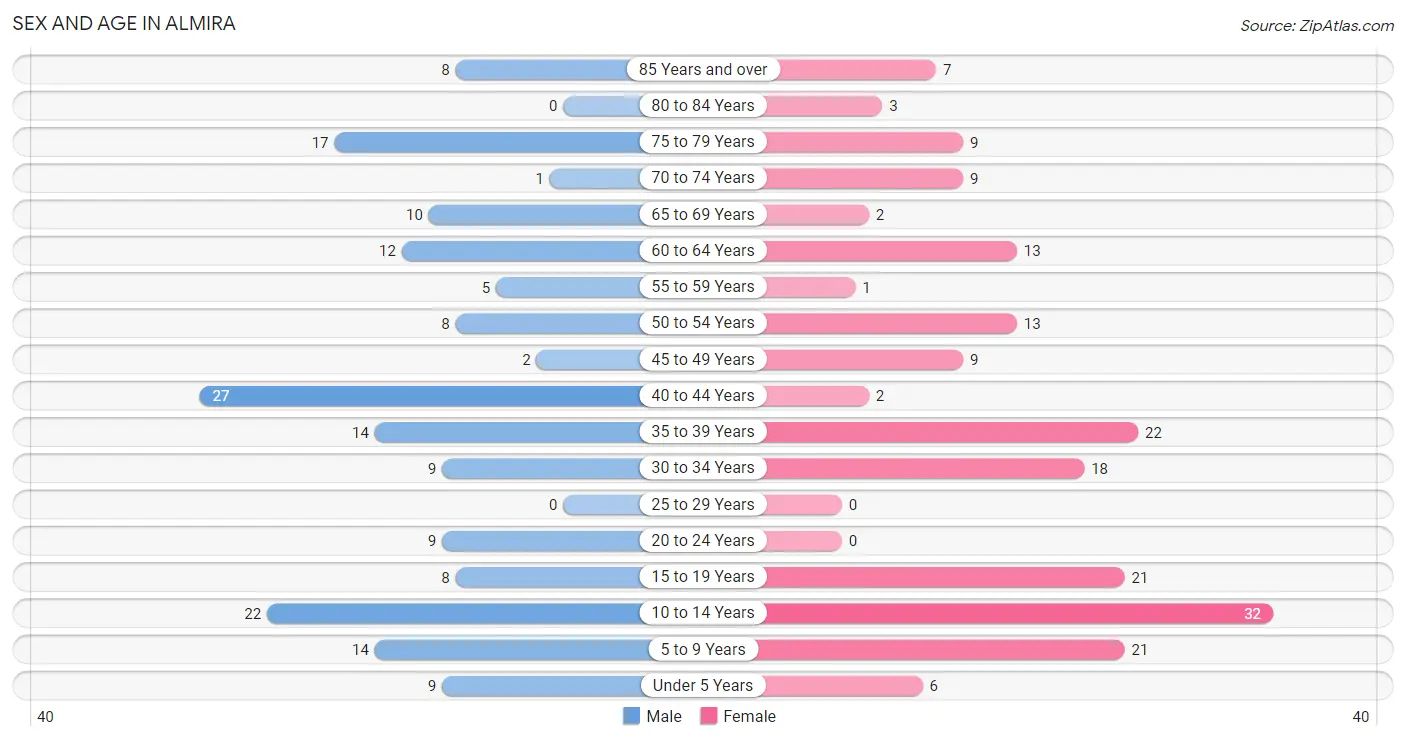
Sex and Age in Almira
Sex and Age in Almira
The most populous age groups in Almira are 40 to 44 Years (27 | 15.4%) for men and 10 to 14 Years (32 | 17.0%) for women.
| Age Bracket | Male | Female |
| Under 5 Years | 9 (5.1%) | 6 (3.2%) |
| 5 to 9 Years | 14 (8.0%) | 21 (11.2%) |
| 10 to 14 Years | 22 (12.6%) | 32 (17.0%) |
| 15 to 19 Years | 8 (4.6%) | 21 (11.2%) |
| 20 to 24 Years | 9 (5.1%) | 0 (0.0%) |
| 25 to 29 Years | 0 (0.0%) | 0 (0.0%) |
| 30 to 34 Years | 9 (5.1%) | 18 (9.6%) |
| 35 to 39 Years | 14 (8.0%) | 22 (11.7%) |
| 40 to 44 Years | 27 (15.4%) | 2 (1.1%) |
| 45 to 49 Years | 2 (1.1%) | 9 (4.8%) |
| 50 to 54 Years | 8 (4.6%) | 13 (6.9%) |
| 55 to 59 Years | 5 (2.9%) | 1 (0.5%) |
| 60 to 64 Years | 12 (6.9%) | 13 (6.9%) |
| 65 to 69 Years | 10 (5.7%) | 2 (1.1%) |
| 70 to 74 Years | 1 (0.6%) | 9 (4.8%) |
| 75 to 79 Years | 17 (9.7%) | 9 (4.8%) |
| 80 to 84 Years | 0 (0.0%) | 3 (1.6%) |
| 85 Years and over | 8 (4.6%) | 7 (3.7%) |
| Total | 175 (100.0%) | 188 (100.0%) |
Families and Households in Almira
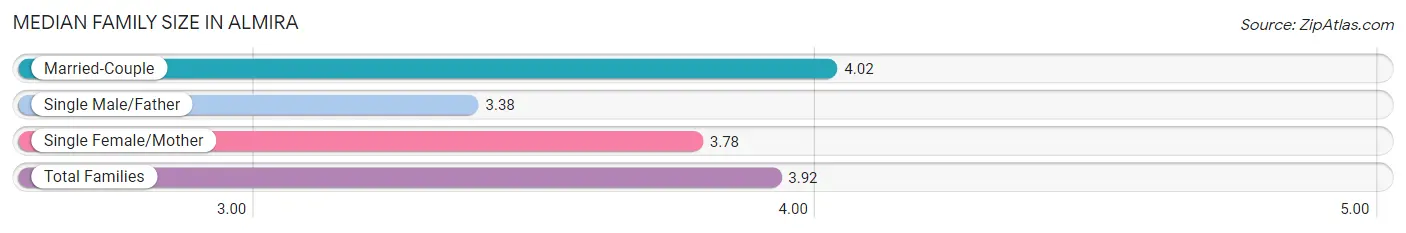
Median Family Size in Almira
The median family size in Almira is 3.92 persons per family, with married-couple families (60 | 77.9%) accounting for the largest median family size of 4.02 persons per family. On the other hand, single male/father families (8 | 10.4%) represent the smallest median family size with 3.38 persons per family.
| Family Type | # Families | Family Size |
| Married-Couple | 60 (77.9%) | 4.02 |
| Single Male/Father | 8 (10.4%) | 3.38 |
| Single Female/Mother | 9 (11.7%) | 3.78 |
| Total Families | 77 (100.0%) | 3.92 |
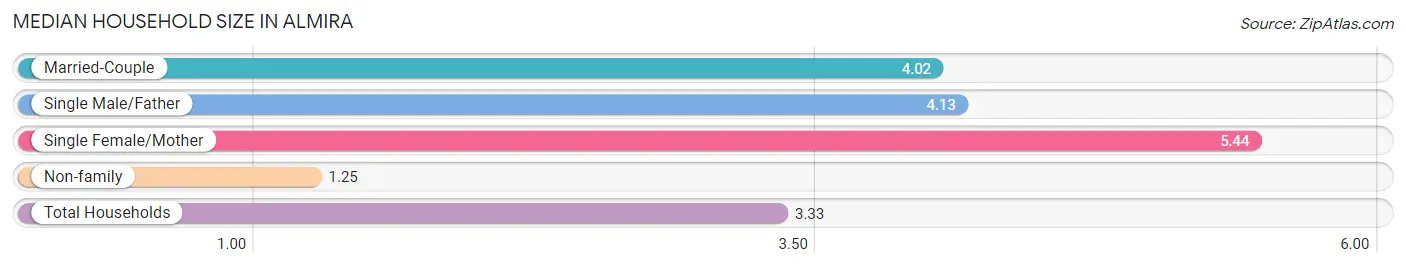
Median Household Size in Almira
The median household size in Almira is 3.33 persons per household, with single female/mother households (9 | 8.3%) accounting for the largest median household size of 5.44 persons per household. non-family households (32 | 29.4%) represent the smallest median household size with 1.25 persons per household.
| Household Type | # Households | Household Size |
| Married-Couple | 60 (55.0%) | 4.02 |
| Single Male/Father | 8 (7.3%) | 4.13 |
| Single Female/Mother | 9 (8.3%) | 5.44 |
| Non-family | 32 (29.4%) | 1.25 |
| Total Households | 109 (100.0%) | 3.33 |
Household Size by Marriage Status in Almira
Out of a total of 109 households in Almira, 77 (70.6%) are family households, while 32 (29.4%) are nonfamily households. The most numerous type of family households are 5-person households, comprising 24, and the most common type of nonfamily households are 1-person households, comprising 23.
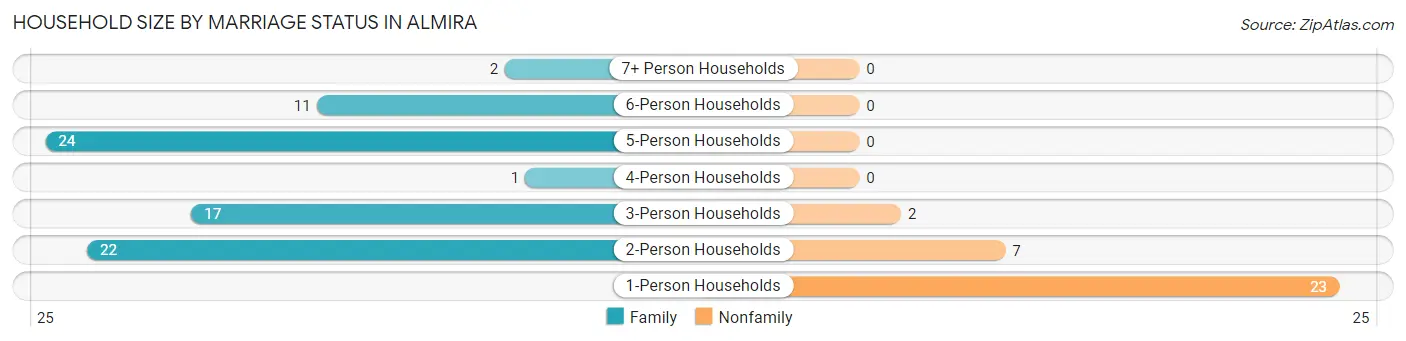
| Household Size | Family Households | Nonfamily Households |
| 1-Person Households | - | 23 (21.1%) |
| 2-Person Households | 22 (20.2%) | 7 (6.4%) |
| 3-Person Households | 17 (15.6%) | 2 (1.8%) |
| 4-Person Households | 1 (0.9%) | 0 (0.0%) |
| 5-Person Households | 24 (22.0%) | 0 (0.0%) |
| 6-Person Households | 11 (10.1%) | 0 (0.0%) |
| 7+ Person Households | 2 (1.8%) | 0 (0.0%) |
| Total | 77 (70.6%) | 32 (29.4%) |
Female Fertility in Almira
Fertility by Age in Almira
Average fertility rate in Almira is 56.0 births per 1,000 women. Women in the age bracket of 35 to 50 years have the highest fertility rate with 121.0 births per 1,000 women. Women in the age bracket of 35 to 50 years acount for 100.0% of all women with births.
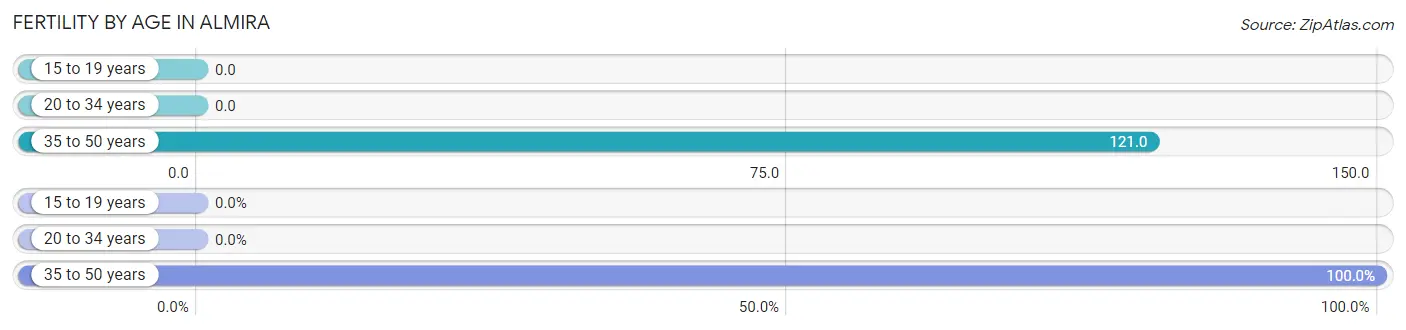
| Age Bracket | Women with Births | Births / 1,000 Women |
| 15 to 19 years | 0 (0.0%) | 0.0 |
| 20 to 34 years | 0 (0.0%) | 0.0 |
| 35 to 50 years | 4 (100.0%) | 121.0 |
| Total | 4 (100.0%) | 56.0 |
Fertility by Age by Marriage Status in Almira
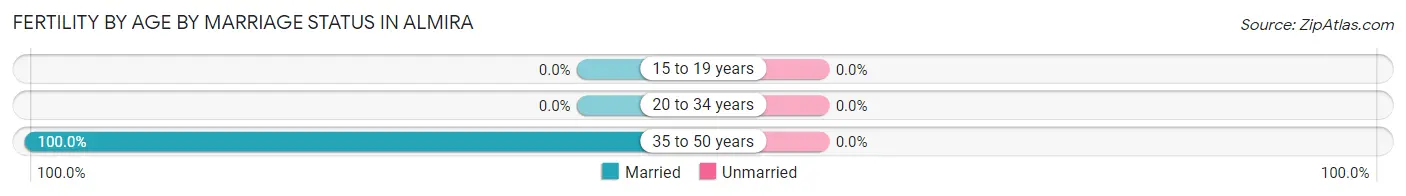
| Age Bracket | Married | Unmarried |
| 15 to 19 years | 0 (0.0%) | 0 (0.0%) |
| 20 to 34 years | 0 (0.0%) | 0 (0.0%) |
| 35 to 50 years | 4 (100.0%) | 0 (0.0%) |
| Total | 4 (100.0%) | 0 (0.0%) |
Fertility by Education in Almira
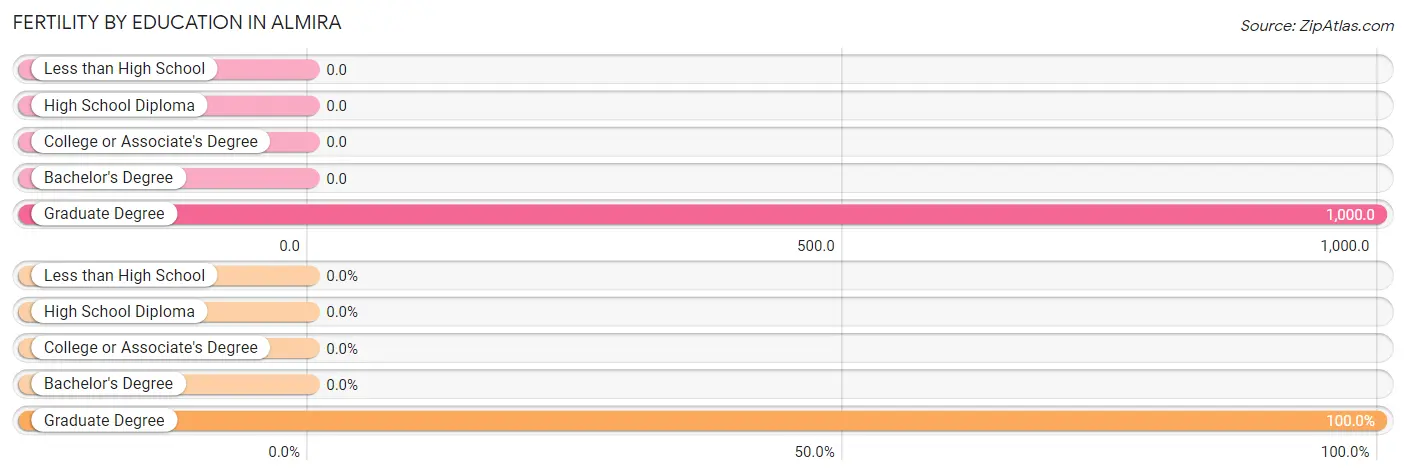
| Educational Attainment | Women with Births | Births / 1,000 Women |
| Less than High School | 0 (0.0%) | 0.0 |
| High School Diploma | 0 (0.0%) | 0.0 |
| College or Associate's Degree | 0 (0.0%) | 0.0 |
| Bachelor's Degree | 0 (0.0%) | 0.0 |
| Graduate Degree | 4 (100.0%) | 1,000.0 |
| Total | 4 (100.0%) | 56.0 |
Fertility by Education by Marriage Status in Almira
| Educational Attainment | Married | Unmarried |
| Less than High School | 0 (0.0%) | 0 (0.0%) |
| High School Diploma | 0 (0.0%) | 0 (0.0%) |
| College or Associate's Degree | 0 (0.0%) | 0 (0.0%) |
| Bachelor's Degree | 0 (0.0%) | 0 (0.0%) |
| Graduate Degree | 4 (100.0%) | 0 (0.0%) |
| Total | 4 (100.0%) | 0 (0.0%) |
Employment Characteristics in Almira
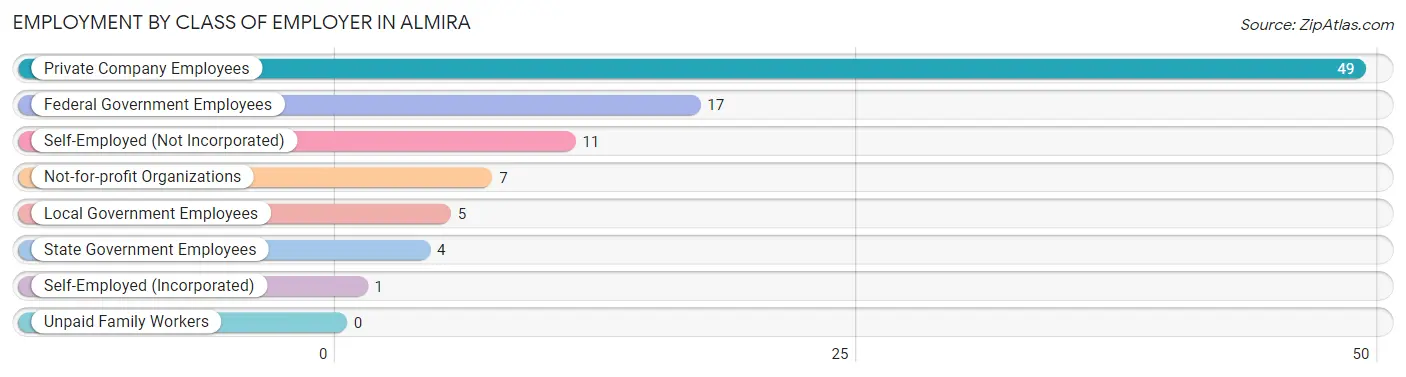
Employment by Class of Employer in Almira
Among the 94 employed individuals in Almira, private company employees (49 | 52.1%), federal government employees (17 | 18.1%), and self-employed (not incorporated) (11 | 11.7%) make up the most common classes of employment.
| Employer Class | # Employees | % Employees |
| Private Company Employees | 49 | 52.1% |
| Self-Employed (Incorporated) | 1 | 1.1% |
| Self-Employed (Not Incorporated) | 11 | 11.7% |
| Not-for-profit Organizations | 7 | 7.4% |
| Local Government Employees | 5 | 5.3% |
| State Government Employees | 4 | 4.3% |
| Federal Government Employees | 17 | 18.1% |
| Unpaid Family Workers | 0 | 0.0% |
| Total | 94 | 100.0% |
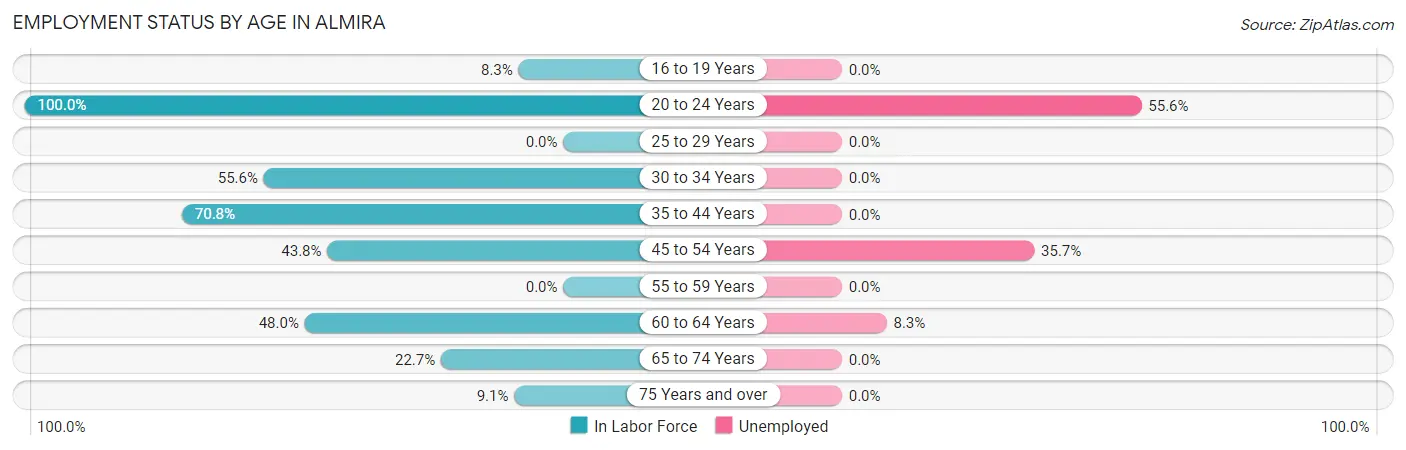
Employment Status by Age in Almira
According to the labor force statistics for Almira, out of the total population over 16 years of age (254), 42.1% or 107 individuals are in the labor force, with 10.3% or 11 of them unemployed. The age group with the highest labor force participation rate is 20 to 24 years, with 100.0% or 9 individuals in the labor force. Within the labor force, the 20 to 24 years age range has the highest percentage of unemployed individuals, with 55.6% or 5 of them being unemployed.
| Age Bracket | In Labor Force | Unemployed |
| 16 to 19 Years | 2 (8.3%) | 0 (0.0%) |
| 20 to 24 Years | 9 (100.0%) | 5 (55.6%) |
| 25 to 29 Years | 0 (0.0%) | 0 (0.0%) |
| 30 to 34 Years | 15 (55.6%) | 0 (0.0%) |
| 35 to 44 Years | 46 (70.8%) | 0 (0.0%) |
| 45 to 54 Years | 14 (43.8%) | 5 (35.7%) |
| 55 to 59 Years | 0 (0.0%) | 0 (0.0%) |
| 60 to 64 Years | 12 (48.0%) | 1 (8.3%) |
| 65 to 74 Years | 5 (22.7%) | 0 (0.0%) |
| 75 Years and over | 4 (9.1%) | 0 (0.0%) |
| Total | 107 (42.1%) | 11 (10.3%) |
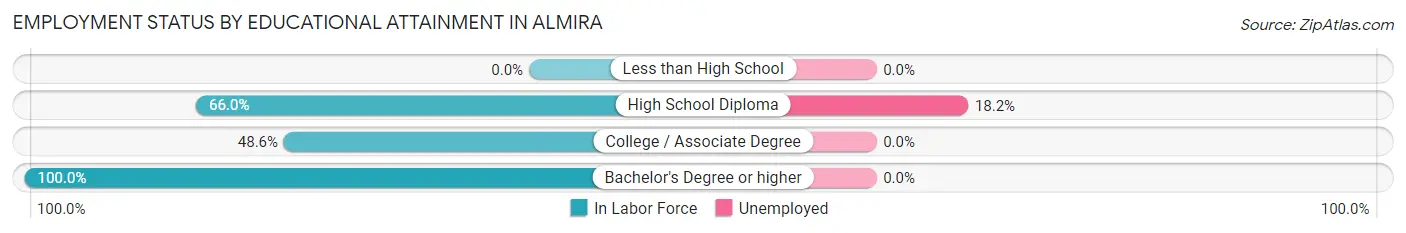
Employment Status by Educational Attainment in Almira
According to labor force statistics for Almira, 56.1% of individuals (87) out of the total population between 25 and 64 years of age (155) are in the labor force, with 6.9% or 6 of them being unemployed. The group with the highest labor force participation rate are those with the educational attainment of bachelor's degree or higher, with 100.0% or 18 individuals in the labor force. Within the labor force, individuals with high school diploma education have the highest percentage of unemployment, with 18.2% or 6 of them being unemployed.
| Educational Attainment | In Labor Force | Unemployed |
| Less than High School | 0 (0.0%) | 0 (0.0%) |
| High School Diploma | 33 (66.0%) | 9 (18.2%) |
| College / Associate Degree | 36 (48.6%) | 0 (0.0%) |
| Bachelor's Degree or higher | 18 (100.0%) | 0 (0.0%) |
| Total | 87 (56.1%) | 11 (6.9%) |
Employment Occupations by Sex in Almira
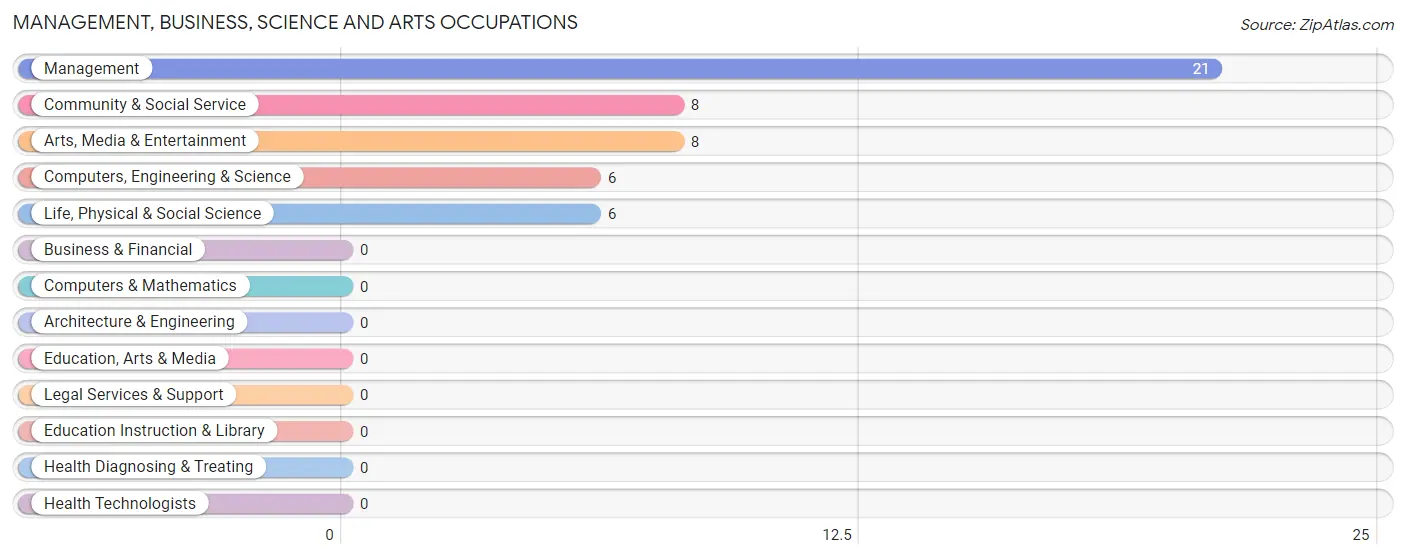
Management, Business, Science and Arts Occupations
The most common Management, Business, Science and Arts occupations in Almira are Management (21 | 21.9%), Community & Social Service (8 | 8.3%), Arts, Media & Entertainment (8 | 8.3%), Computers, Engineering & Science (6 | 6.2%), and Life, Physical & Social Science (6 | 6.2%).
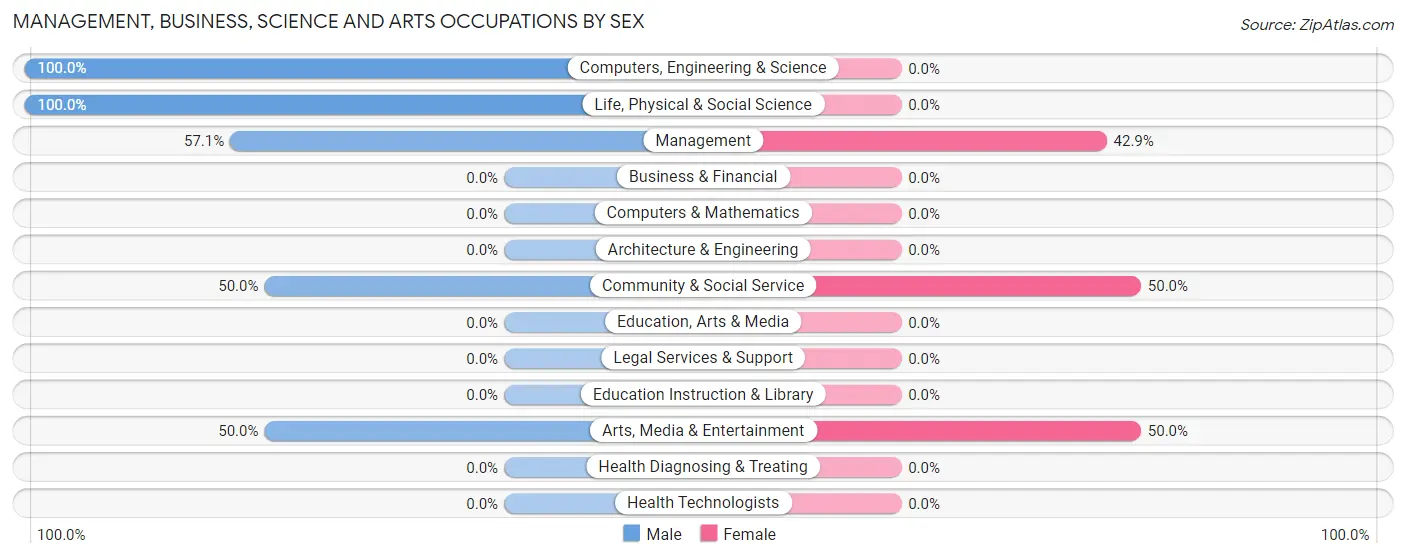
Management, Business, Science and Arts Occupations by Sex
Within the Management, Business, Science and Arts occupations in Almira, the most male-oriented occupations are Computers, Engineering & Science (100.0%), Life, Physical & Social Science (100.0%), and Management (57.1%), while the most female-oriented occupations are Community & Social Service (50.0%), Arts, Media & Entertainment (50.0%), and Management (42.9%).
| Occupation | Male | Female |
| Management | 12 (57.1%) | 9 (42.9%) |
| Business & Financial | 0 (0.0%) | 0 (0.0%) |
| Computers, Engineering & Science | 6 (100.0%) | 0 (0.0%) |
| Computers & Mathematics | 0 (0.0%) | 0 (0.0%) |
| Architecture & Engineering | 0 (0.0%) | 0 (0.0%) |
| Life, Physical & Social Science | 6 (100.0%) | 0 (0.0%) |
| Community & Social Service | 4 (50.0%) | 4 (50.0%) |
| Education, Arts & Media | 0 (0.0%) | 0 (0.0%) |
| Legal Services & Support | 0 (0.0%) | 0 (0.0%) |
| Education Instruction & Library | 0 (0.0%) | 0 (0.0%) |
| Arts, Media & Entertainment | 4 (50.0%) | 4 (50.0%) |
| Health Diagnosing & Treating | 0 (0.0%) | 0 (0.0%) |
| Health Technologists | 0 (0.0%) | 0 (0.0%) |
| Total (Category) | 22 (62.9%) | 13 (37.1%) |
| Total (Overall) | 59 (61.5%) | 37 (38.5%) |
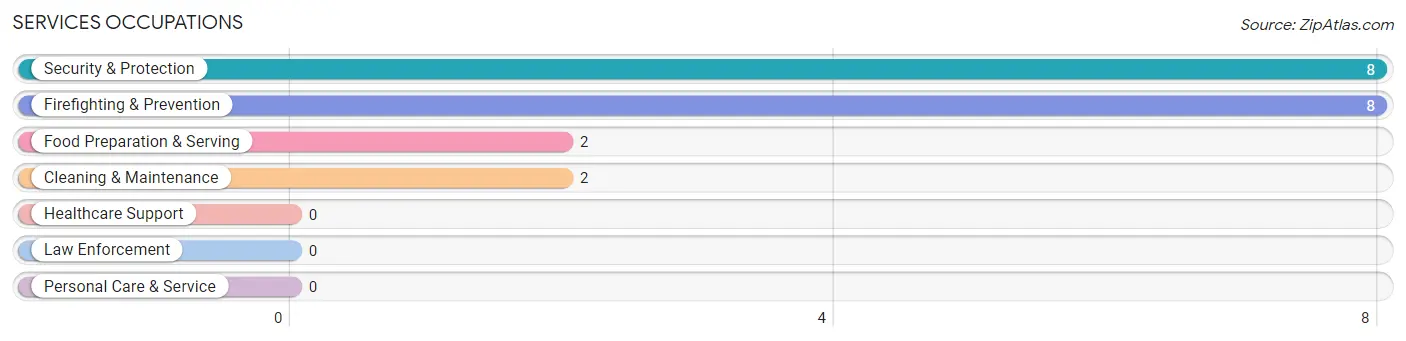
Services Occupations
The most common Services occupations in Almira are Security & Protection (8 | 8.3%), Firefighting & Prevention (8 | 8.3%), Food Preparation & Serving (2 | 2.1%), and Cleaning & Maintenance (2 | 2.1%).
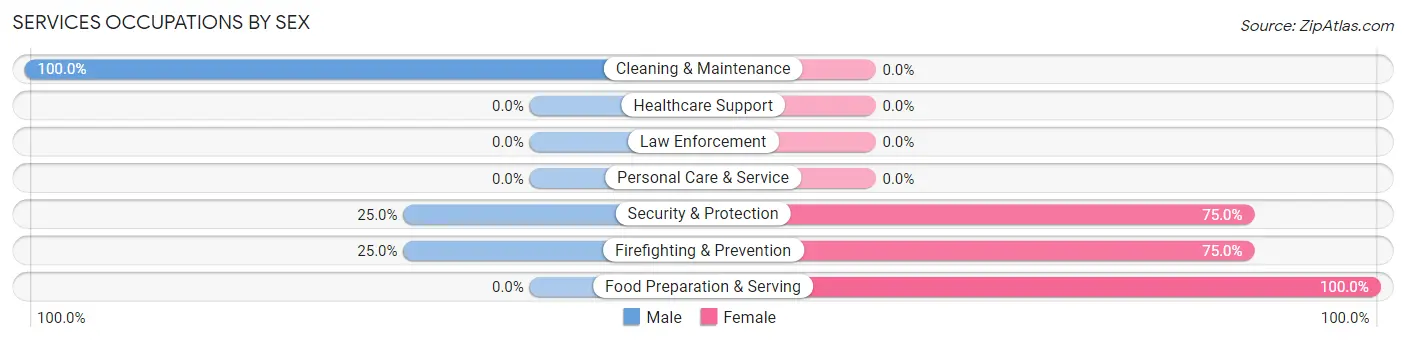
Services Occupations by Sex
Within the Services occupations in Almira, the most male-oriented occupations are Cleaning & Maintenance (100.0%), Security & Protection (25.0%), and Firefighting & Prevention (25.0%), while the most female-oriented occupations are Food Preparation & Serving (100.0%), Security & Protection (75.0%), and Firefighting & Prevention (75.0%).
| Occupation | Male | Female |
| Healthcare Support | 0 (0.0%) | 0 (0.0%) |
| Security & Protection | 2 (25.0%) | 6 (75.0%) |
| Firefighting & Prevention | 2 (25.0%) | 6 (75.0%) |
| Law Enforcement | 0 (0.0%) | 0 (0.0%) |
| Food Preparation & Serving | 0 (0.0%) | 2 (100.0%) |
| Cleaning & Maintenance | 2 (100.0%) | 0 (0.0%) |
| Personal Care & Service | 0 (0.0%) | 0 (0.0%) |
| Total (Category) | 4 (33.3%) | 8 (66.7%) |
| Total (Overall) | 59 (61.5%) | 37 (38.5%) |
Sales and Office Occupations
The most common Sales and Office occupations in Almira are Sales & Related (18 | 18.8%), and Office & Administration (6 | 6.2%).
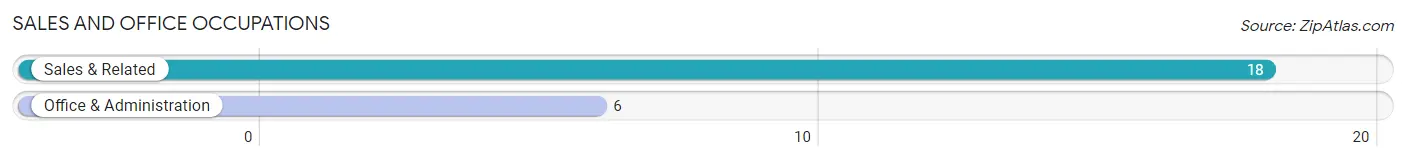
Sales and Office Occupations by Sex

| Occupation | Male | Female |
| Sales & Related | 8 (44.4%) | 10 (55.6%) |
| Office & Administration | 0 (0.0%) | 6 (100.0%) |
| Total (Category) | 8 (33.3%) | 16 (66.7%) |
| Total (Overall) | 59 (61.5%) | 37 (38.5%) |
Natural Resources, Construction and Maintenance Occupations
The most common Natural Resources, Construction and Maintenance occupations in Almira are Installation, Maintenance & Repair (16 | 16.7%), Farming, Fishing & Forestry (2 | 2.1%), and Construction & Extraction (1 | 1.0%).
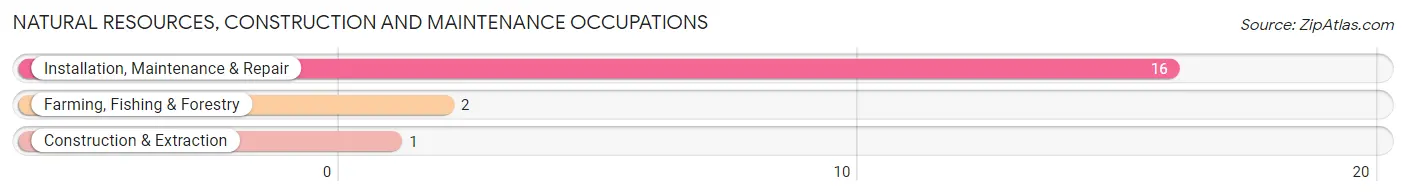
Natural Resources, Construction and Maintenance Occupations by Sex
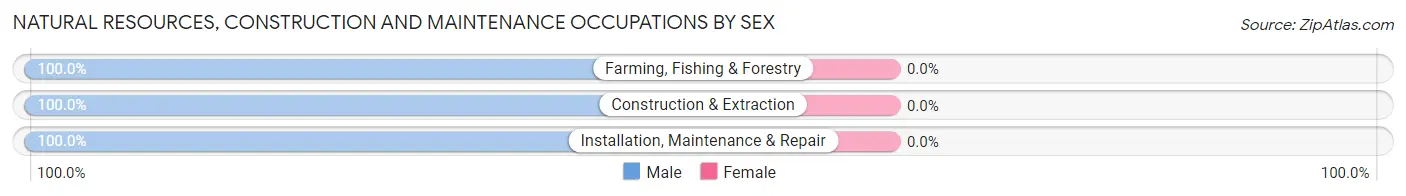
| Occupation | Male | Female |
| Farming, Fishing & Forestry | 2 (100.0%) | 0 (0.0%) |
| Construction & Extraction | 1 (100.0%) | 0 (0.0%) |
| Installation, Maintenance & Repair | 16 (100.0%) | 0 (0.0%) |
| Total (Category) | 19 (100.0%) | 0 (0.0%) |
| Total (Overall) | 59 (61.5%) | 37 (38.5%) |
Production, Transportation and Moving Occupations
The most common Production, Transportation and Moving occupations in Almira are , and Material Moving (6 | 6.2%).
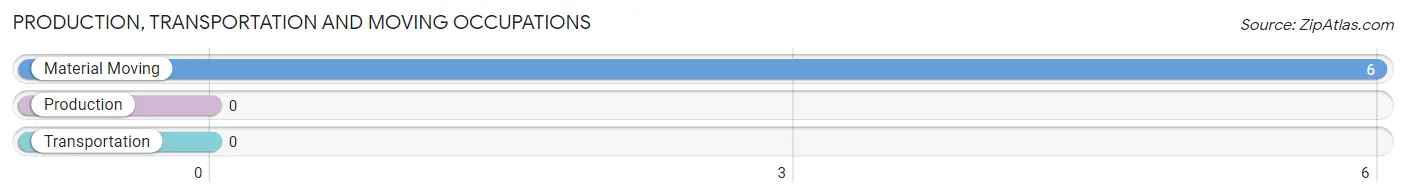
Production, Transportation and Moving Occupations by Sex
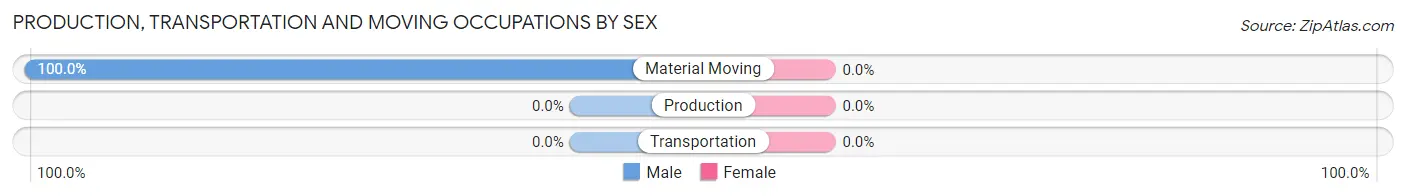
| Occupation | Male | Female |
| Production | 0 (0.0%) | 0 (0.0%) |
| Transportation | 0 (0.0%) | 0 (0.0%) |
| Material Moving | 6 (100.0%) | 0 (0.0%) |
| Total (Category) | 6 (100.0%) | 0 (0.0%) |
| Total (Overall) | 59 (61.5%) | 37 (38.5%) |
Employment Industries by Sex in Almira
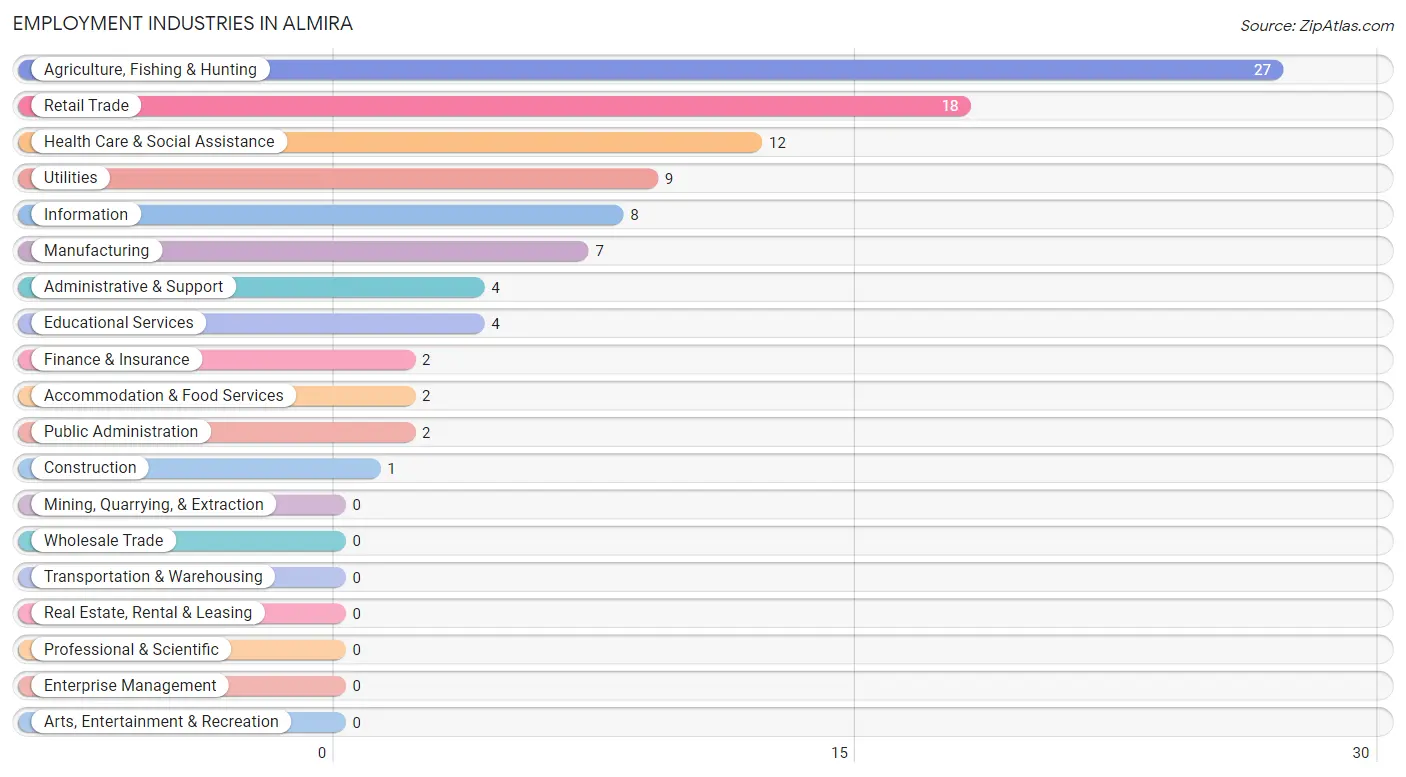
Employment Industries in Almira
The major employment industries in Almira include Agriculture, Fishing & Hunting (27 | 28.1%), Retail Trade (18 | 18.8%), Health Care & Social Assistance (12 | 12.5%), Utilities (9 | 9.4%), and Information (8 | 8.3%).
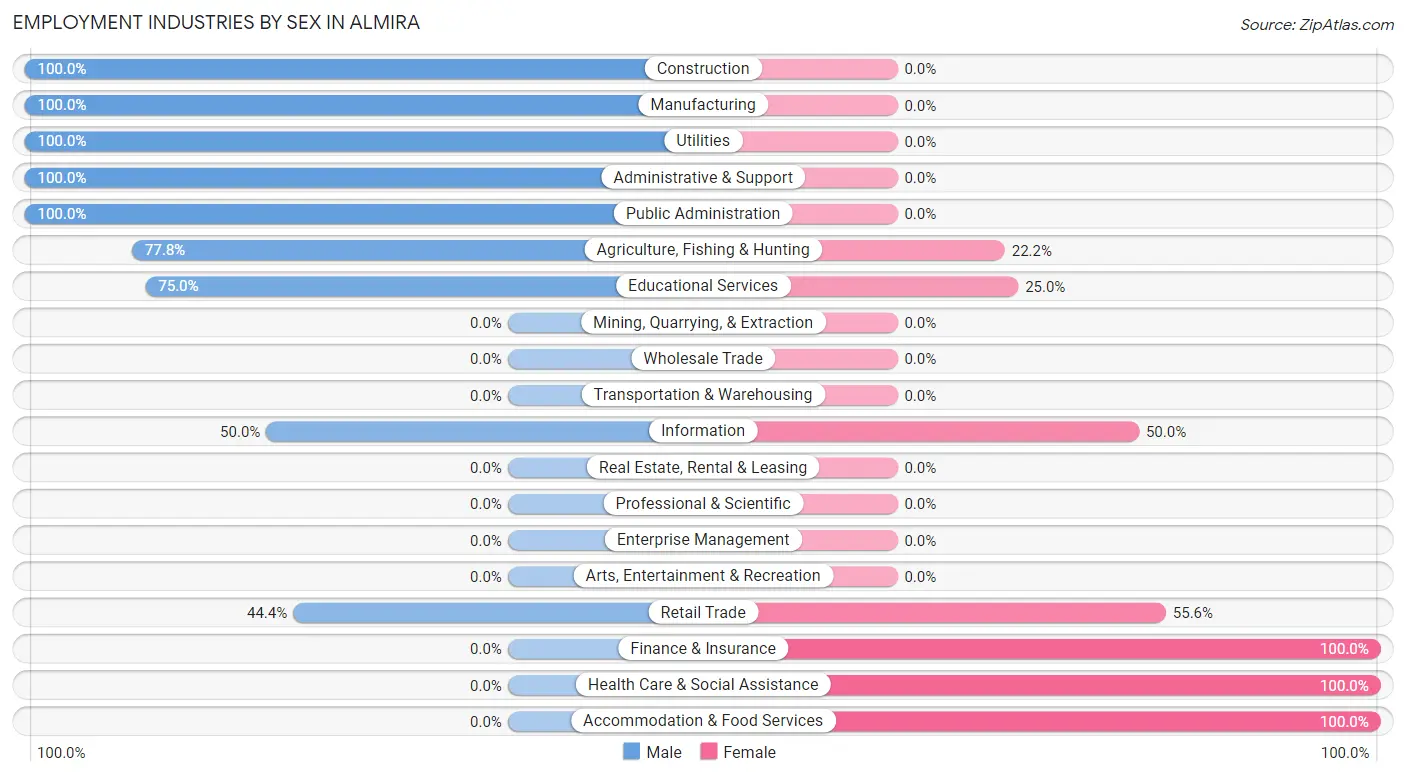
Employment Industries by Sex in Almira
The Almira industries that see more men than women are Construction (100.0%), Manufacturing (100.0%), and Utilities (100.0%), whereas the industries that tend to have a higher number of women are Finance & Insurance (100.0%), Health Care & Social Assistance (100.0%), and Accommodation & Food Services (100.0%).
| Industry | Male | Female |
| Agriculture, Fishing & Hunting | 21 (77.8%) | 6 (22.2%) |
| Mining, Quarrying, & Extraction | 0 (0.0%) | 0 (0.0%) |
| Construction | 1 (100.0%) | 0 (0.0%) |
| Manufacturing | 7 (100.0%) | 0 (0.0%) |
| Wholesale Trade | 0 (0.0%) | 0 (0.0%) |
| Retail Trade | 8 (44.4%) | 10 (55.6%) |
| Transportation & Warehousing | 0 (0.0%) | 0 (0.0%) |
| Utilities | 9 (100.0%) | 0 (0.0%) |
| Information | 4 (50.0%) | 4 (50.0%) |
| Finance & Insurance | 0 (0.0%) | 2 (100.0%) |
| Real Estate, Rental & Leasing | 0 (0.0%) | 0 (0.0%) |
| Professional & Scientific | 0 (0.0%) | 0 (0.0%) |
| Enterprise Management | 0 (0.0%) | 0 (0.0%) |
| Administrative & Support | 4 (100.0%) | 0 (0.0%) |
| Educational Services | 3 (75.0%) | 1 (25.0%) |
| Health Care & Social Assistance | 0 (0.0%) | 12 (100.0%) |
| Arts, Entertainment & Recreation | 0 (0.0%) | 0 (0.0%) |
| Accommodation & Food Services | 0 (0.0%) | 2 (100.0%) |
| Public Administration | 2 (100.0%) | 0 (0.0%) |
| Total | 59 (61.5%) | 37 (38.5%) |
Education in Almira
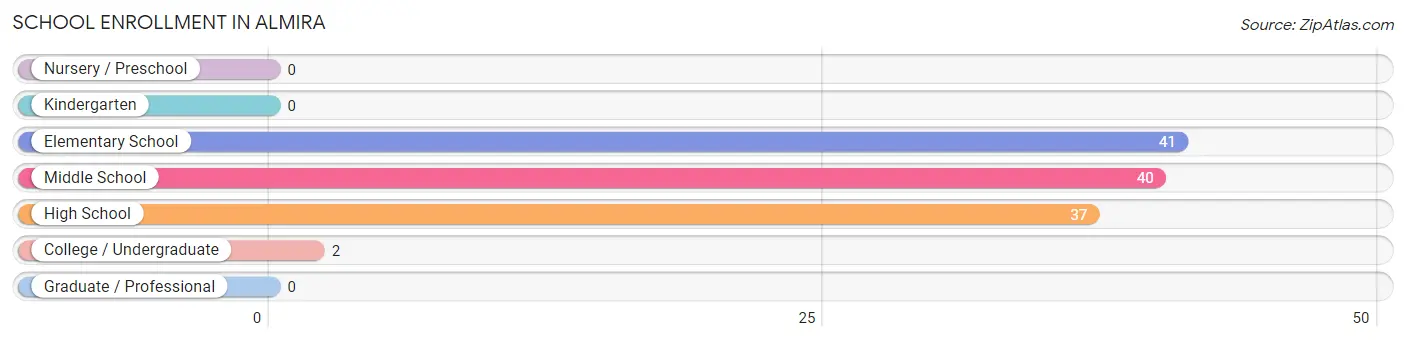
School Enrollment in Almira
The most common levels of schooling among the 120 students in Almira are elementary school (41 | 34.2%), middle school (40 | 33.3%), and high school (37 | 30.8%).
| School Level | # Students | % Students |
| Nursery / Preschool | 0 | 0.0% |
| Kindergarten | 0 | 0.0% |
| Elementary School | 41 | 34.2% |
| Middle School | 40 | 33.3% |
| High School | 37 | 30.8% |
| College / Undergraduate | 2 | 1.7% |
| Graduate / Professional | 0 | 0.0% |
| Total | 120 | 100.0% |
School Enrollment by Age by Funding Source in Almira
Out of a total of 120 students who are enrolled in schools in Almira, 2 (1.7%) attend a private institution, while the remaining 118 (98.3%) are enrolled in public schools. The age group of 35 years and over has the highest likelihood of being enrolled in private schools, with 2 (100.0% in the age bracket) enrolled. Conversely, the age group of 5 to 9 year old has the lowest likelihood of being enrolled in a private school, with 35 (100.0% in the age bracket) attending a public institution.
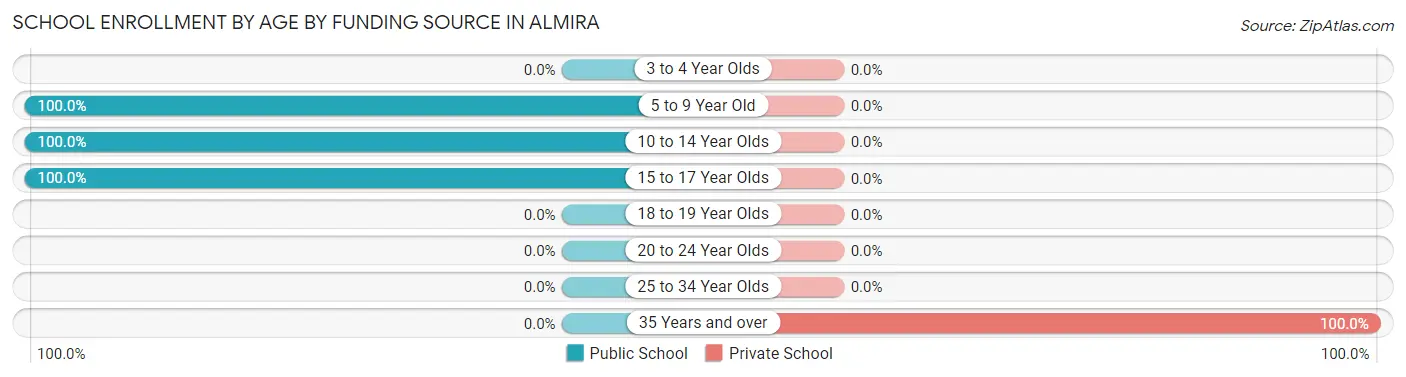
| Age Bracket | Public School | Private School |
| 3 to 4 Year Olds | 0 (0.0%) | 0 (0.0%) |
| 5 to 9 Year Old | 35 (100.0%) | 0 (0.0%) |
| 10 to 14 Year Olds | 54 (100.0%) | 0 (0.0%) |
| 15 to 17 Year Olds | 29 (100.0%) | 0 (0.0%) |
| 18 to 19 Year Olds | 0 (0.0%) | 0 (0.0%) |
| 20 to 24 Year Olds | 0 (0.0%) | 0 (0.0%) |
| 25 to 34 Year Olds | 0 (0.0%) | 0 (0.0%) |
| 35 Years and over | 0 (0.0%) | 2 (100.0%) |
| Total | 118 (98.3%) | 2 (1.7%) |
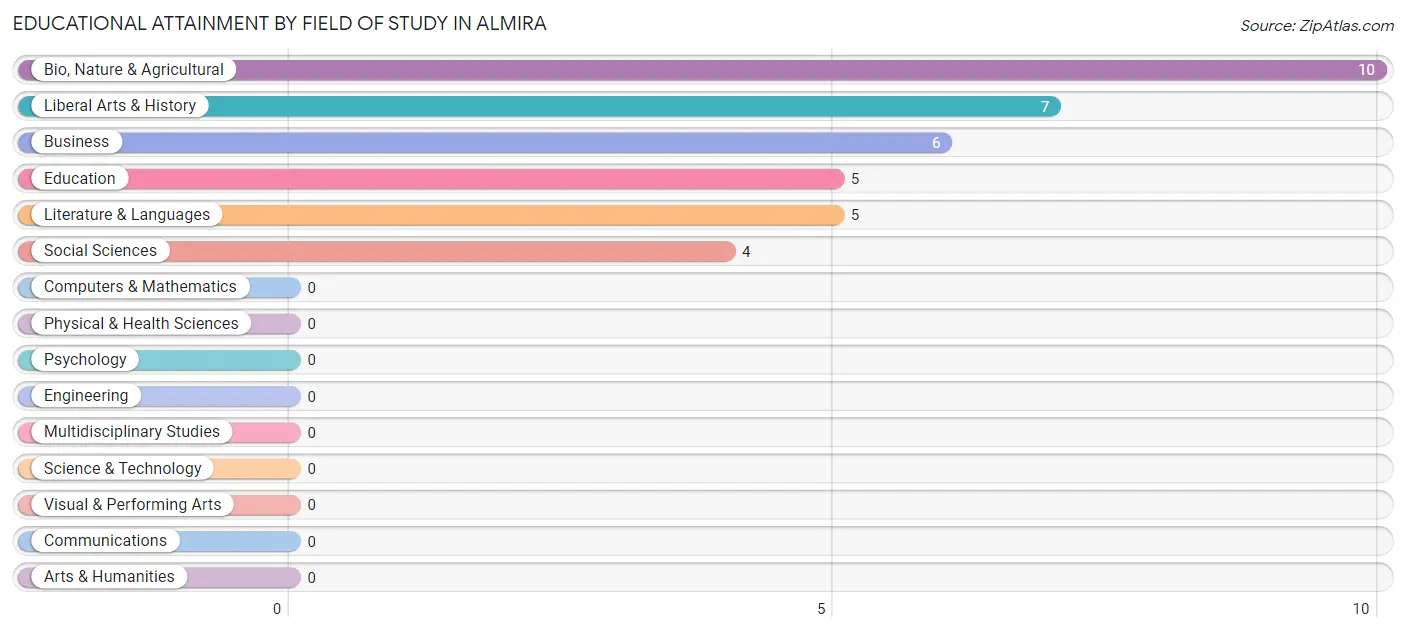
Educational Attainment by Field of Study in Almira
Bio, nature & agricultural (10 | 27.0%), liberal arts & history (7 | 18.9%), business (6 | 16.2%), education (5 | 13.5%), and literature & languages (5 | 13.5%) are the most common fields of study among 37 individuals in Almira who have obtained a bachelor's degree or higher.
| Field of Study | # Graduates | % Graduates |
| Computers & Mathematics | 0 | 0.0% |
| Bio, Nature & Agricultural | 10 | 27.0% |
| Physical & Health Sciences | 0 | 0.0% |
| Psychology | 0 | 0.0% |
| Social Sciences | 4 | 10.8% |
| Engineering | 0 | 0.0% |
| Multidisciplinary Studies | 0 | 0.0% |
| Science & Technology | 0 | 0.0% |
| Business | 6 | 16.2% |
| Education | 5 | 13.5% |
| Literature & Languages | 5 | 13.5% |
| Liberal Arts & History | 7 | 18.9% |
| Visual & Performing Arts | 0 | 0.0% |
| Communications | 0 | 0.0% |
| Arts & Humanities | 0 | 0.0% |
| Total | 37 | 100.0% |
Transportation & Commute in Almira
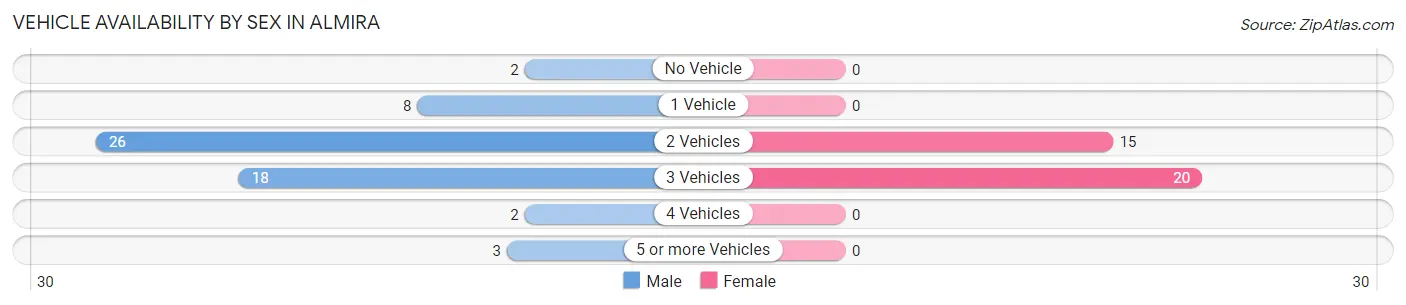
Vehicle Availability by Sex in Almira
The most prevalent vehicle ownership categories in Almira are males with 2 vehicles (26, accounting for 44.1%) and females with 2 vehicles (15, making up 74.3%).
| Vehicles Available | Male | Female |
| No Vehicle | 2 (3.4%) | 0 (0.0%) |
| 1 Vehicle | 8 (13.6%) | 0 (0.0%) |
| 2 Vehicles | 26 (44.1%) | 15 (42.9%) |
| 3 Vehicles | 18 (30.5%) | 20 (57.1%) |
| 4 Vehicles | 2 (3.4%) | 0 (0.0%) |
| 5 or more Vehicles | 3 (5.1%) | 0 (0.0%) |
| Total | 59 (100.0%) | 35 (100.0%) |
Commute Time in Almira
The most frequently occuring commute durations in Almira are 45 to 59 minutes (18 commuters, 25.4%), 30 to 34 minutes (16 commuters, 22.5%), and 25 to 29 minutes (9 commuters, 12.7%).
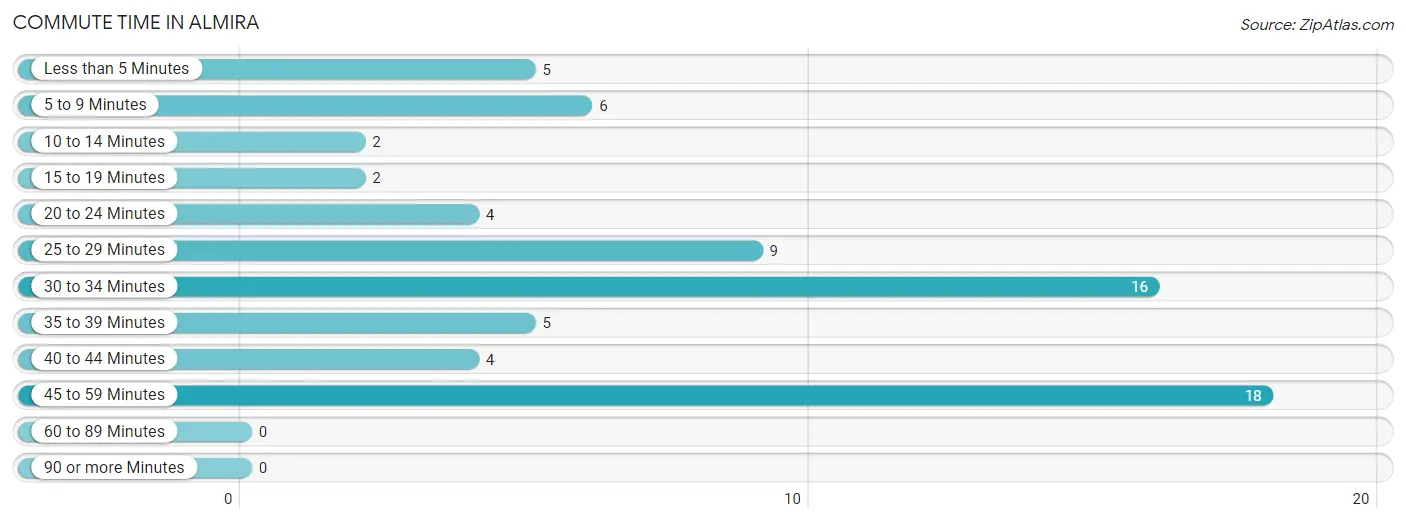
| Commute Time | # Commuters | % Commuters |
| Less than 5 Minutes | 5 | 7.0% |
| 5 to 9 Minutes | 6 | 8.5% |
| 10 to 14 Minutes | 2 | 2.8% |
| 15 to 19 Minutes | 2 | 2.8% |
| 20 to 24 Minutes | 4 | 5.6% |
| 25 to 29 Minutes | 9 | 12.7% |
| 30 to 34 Minutes | 16 | 22.5% |
| 35 to 39 Minutes | 5 | 7.0% |
| 40 to 44 Minutes | 4 | 5.6% |
| 45 to 59 Minutes | 18 | 25.4% |
| 60 to 89 Minutes | 0 | 0.0% |
| 90 or more Minutes | 0 | 0.0% |
Commute Time by Sex in Almira
The most common commute times in Almira are 45 to 59 minutes (10 commuters, 21.7%) for males and 45 to 59 minutes (8 commuters, 32.0%) for females.
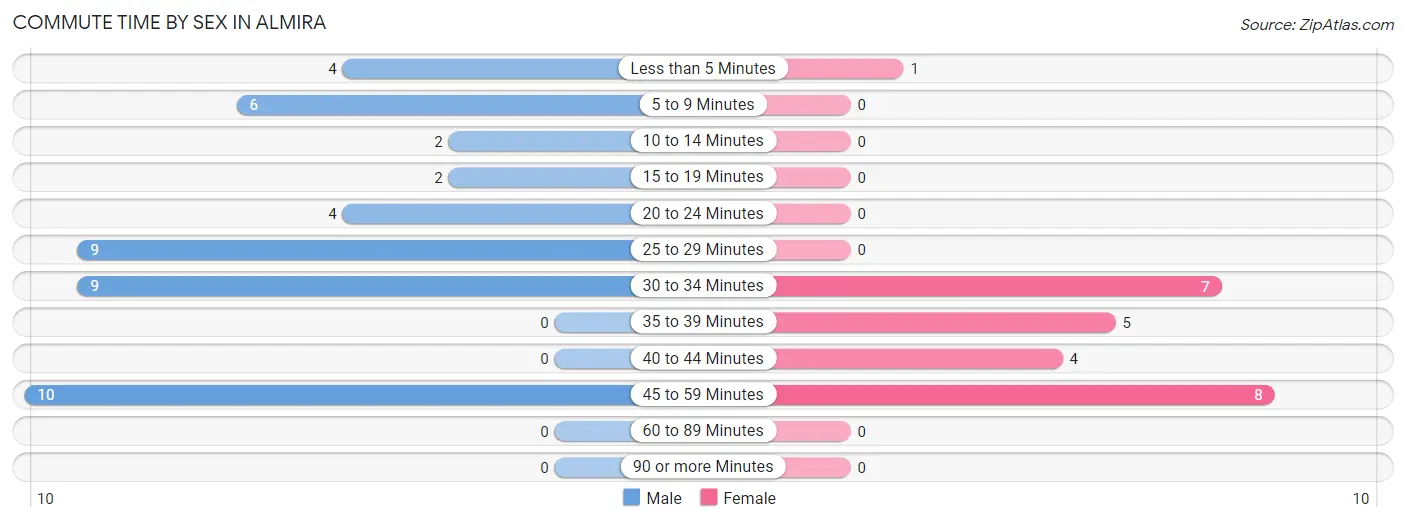
| Commute Time | Male | Female |
| Less than 5 Minutes | 4 (8.7%) | 1 (4.0%) |
| 5 to 9 Minutes | 6 (13.0%) | 0 (0.0%) |
| 10 to 14 Minutes | 2 (4.3%) | 0 (0.0%) |
| 15 to 19 Minutes | 2 (4.3%) | 0 (0.0%) |
| 20 to 24 Minutes | 4 (8.7%) | 0 (0.0%) |
| 25 to 29 Minutes | 9 (19.6%) | 0 (0.0%) |
| 30 to 34 Minutes | 9 (19.6%) | 7 (28.0%) |
| 35 to 39 Minutes | 0 (0.0%) | 5 (20.0%) |
| 40 to 44 Minutes | 0 (0.0%) | 4 (16.0%) |
| 45 to 59 Minutes | 10 (21.7%) | 8 (32.0%) |
| 60 to 89 Minutes | 0 (0.0%) | 0 (0.0%) |
| 90 or more Minutes | 0 (0.0%) | 0 (0.0%) |
Time of Departure to Work by Sex in Almira
The most frequent times of departure to work in Almira are 6:30 AM to 6:59 AM (18, 39.1%) for males and 6:00 AM to 6:29 AM (8, 32.0%) for females.
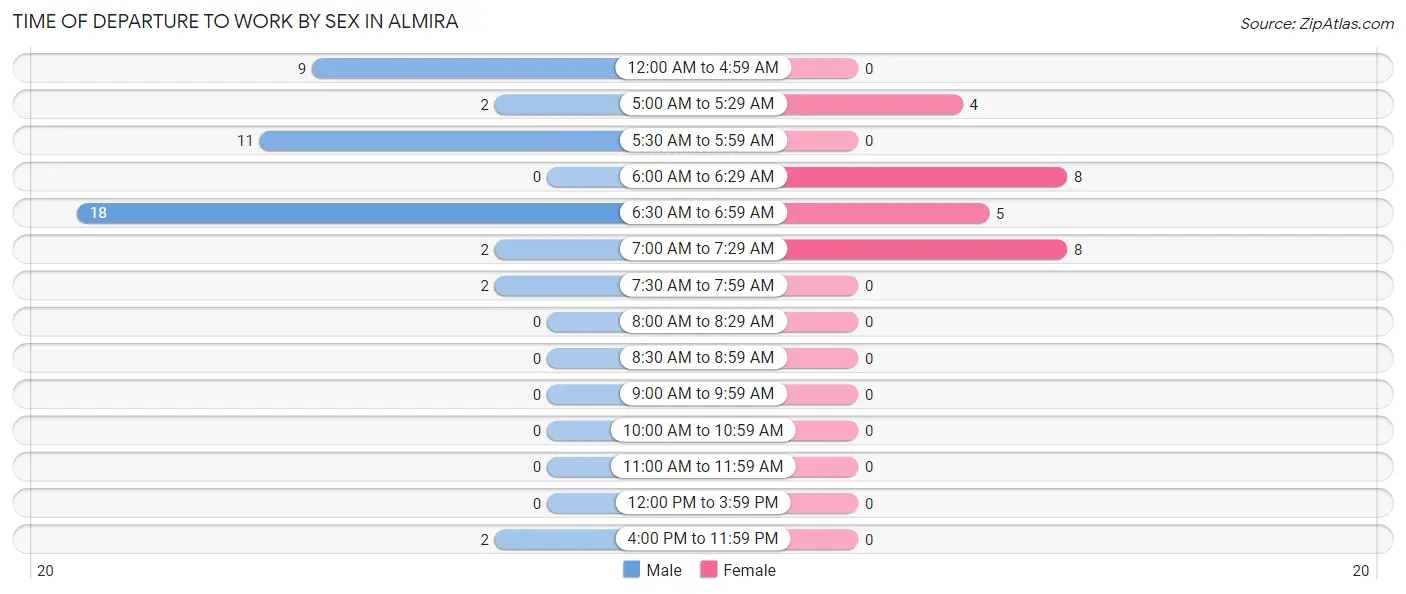
| Time of Departure | Male | Female |
| 12:00 AM to 4:59 AM | 9 (19.6%) | 0 (0.0%) |
| 5:00 AM to 5:29 AM | 2 (4.3%) | 4 (16.0%) |
| 5:30 AM to 5:59 AM | 11 (23.9%) | 0 (0.0%) |
| 6:00 AM to 6:29 AM | 0 (0.0%) | 8 (32.0%) |
| 6:30 AM to 6:59 AM | 18 (39.1%) | 5 (20.0%) |
| 7:00 AM to 7:29 AM | 2 (4.3%) | 8 (32.0%) |
| 7:30 AM to 7:59 AM | 2 (4.3%) | 0 (0.0%) |
| 8:00 AM to 8:29 AM | 0 (0.0%) | 0 (0.0%) |
| 8:30 AM to 8:59 AM | 0 (0.0%) | 0 (0.0%) |
| 9:00 AM to 9:59 AM | 0 (0.0%) | 0 (0.0%) |
| 10:00 AM to 10:59 AM | 0 (0.0%) | 0 (0.0%) |
| 11:00 AM to 11:59 AM | 0 (0.0%) | 0 (0.0%) |
| 12:00 PM to 3:59 PM | 0 (0.0%) | 0 (0.0%) |
| 4:00 PM to 11:59 PM | 2 (4.3%) | 0 (0.0%) |
| Total | 46 (100.0%) | 25 (100.0%) |
Housing Occupancy in Almira
Occupancy by Ownership in Almira
Of the total 109 dwellings in Almira, owner-occupied units account for 79 (72.5%), while renter-occupied units make up 30 (27.5%).
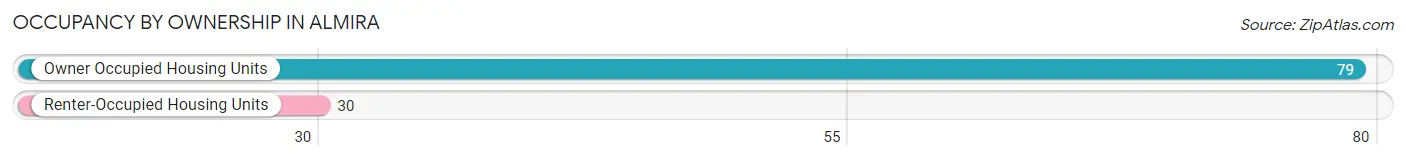
| Occupancy | # Housing Units | % Housing Units |
| Owner Occupied Housing Units | 79 | 72.5% |
| Renter-Occupied Housing Units | 30 | 27.5% |
| Total Occupied Housing Units | 109 | 100.0% |
Occupancy by Household Size in Almira
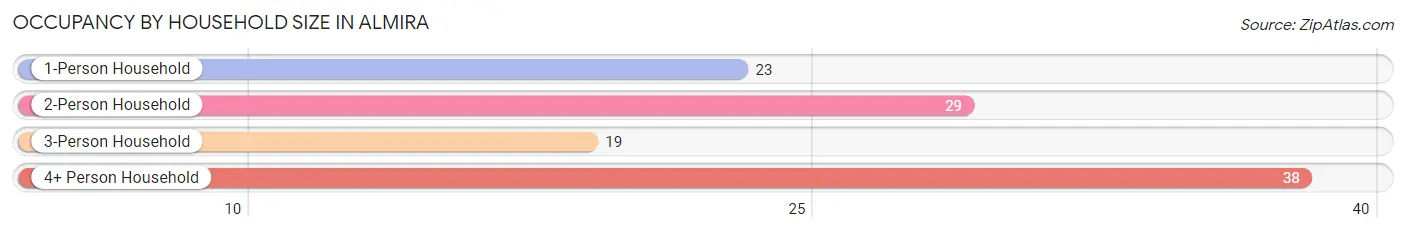
| Household Size | # Housing Units | % Housing Units |
| 1-Person Household | 23 | 21.1% |
| 2-Person Household | 29 | 26.6% |
| 3-Person Household | 19 | 17.4% |
| 4+ Person Household | 38 | 34.9% |
| Total Housing Units | 109 | 100.0% |
Occupancy by Ownership by Household Size in Almira
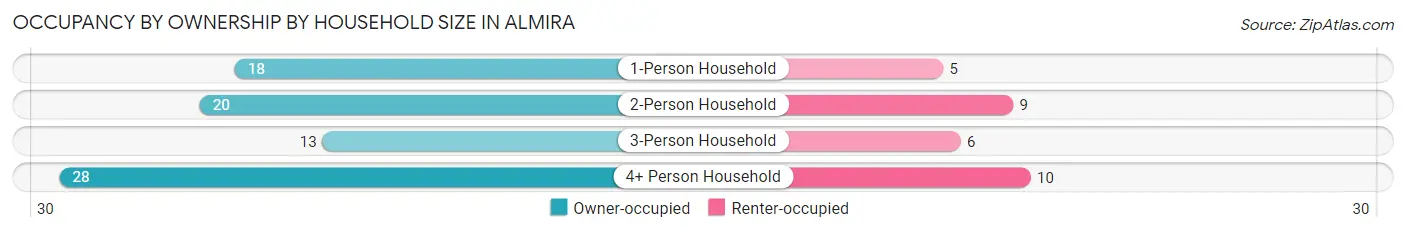
| Household Size | Owner-occupied | Renter-occupied |
| 1-Person Household | 18 (78.3%) | 5 (21.7%) |
| 2-Person Household | 20 (69.0%) | 9 (31.0%) |
| 3-Person Household | 13 (68.4%) | 6 (31.6%) |
| 4+ Person Household | 28 (73.7%) | 10 (26.3%) |
| Total Housing Units | 79 (72.5%) | 30 (27.5%) |
Occupancy by Educational Attainment in Almira
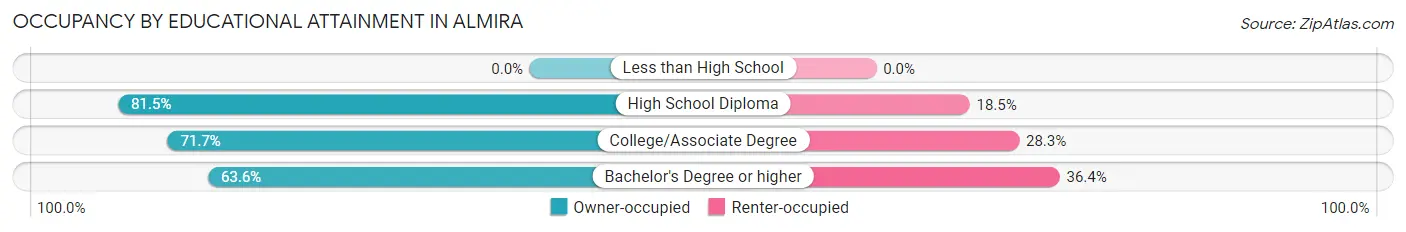
| Household Size | Owner-occupied | Renter-occupied |
| Less than High School | 0 (0.0%) | 0 (0.0%) |
| High School Diploma | 22 (81.5%) | 5 (18.5%) |
| College/Associate Degree | 43 (71.7%) | 17 (28.3%) |
| Bachelor's Degree or higher | 14 (63.6%) | 8 (36.4%) |
Occupancy by Age of Householder in Almira
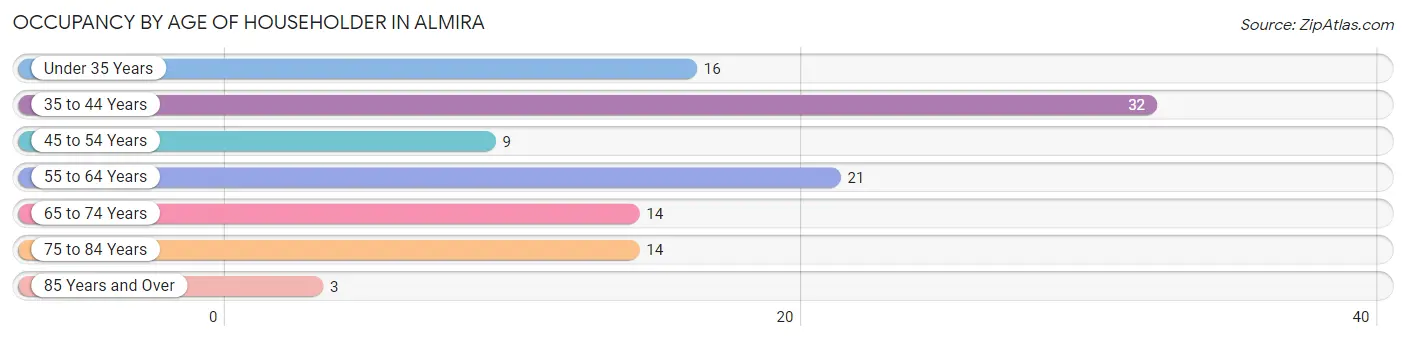
| Age Bracket | # Households | % Households |
| Under 35 Years | 16 | 14.7% |
| 35 to 44 Years | 32 | 29.4% |
| 45 to 54 Years | 9 | 8.3% |
| 55 to 64 Years | 21 | 19.3% |
| 65 to 74 Years | 14 | 12.8% |
| 75 to 84 Years | 14 | 12.8% |
| 85 Years and Over | 3 | 2.8% |
| Total | 109 | 100.0% |
Housing Finances in Almira
Median Income by Occupancy in Almira
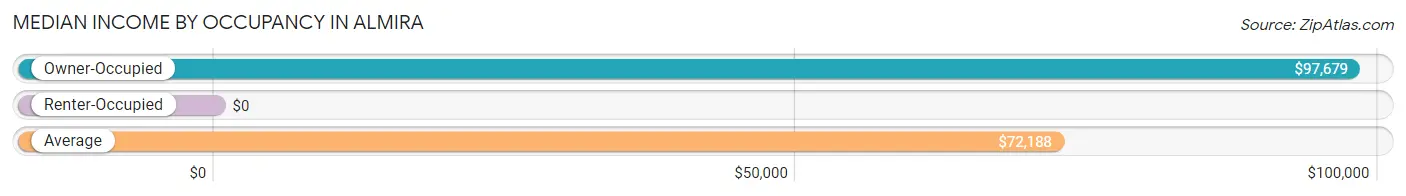
| Occupancy Type | # Households | Median Income |
| Owner-Occupied | 79 (72.5%) | $97,679 |
| Renter-Occupied | 30 (27.5%) | $0 |
| Average | 109 (100.0%) | $72,188 |
Occupancy by Householder Income Bracket in Almira
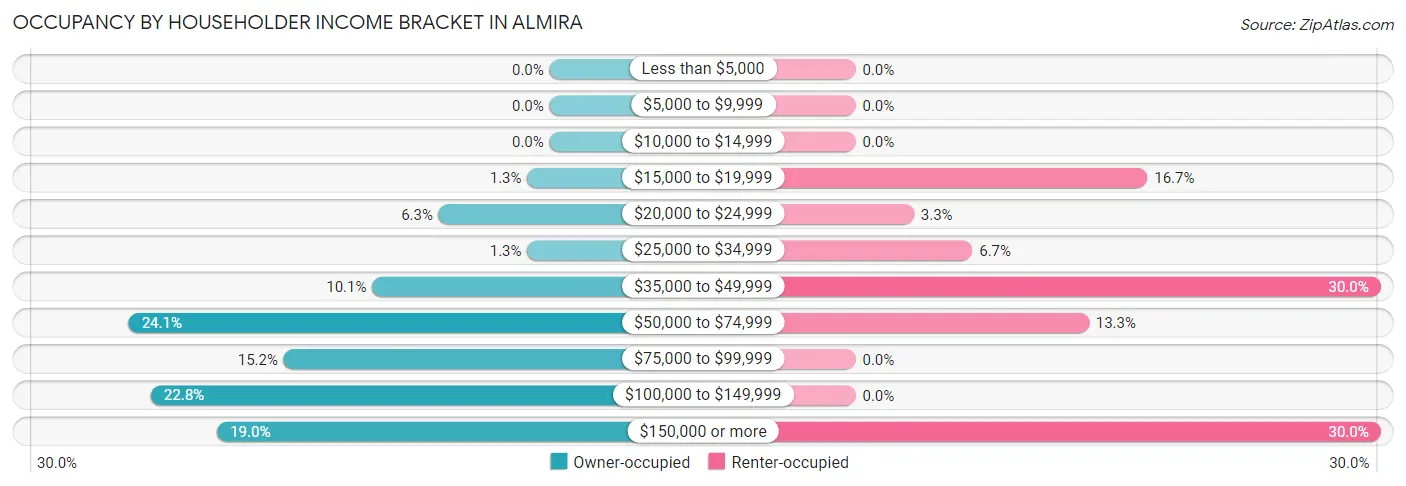
| Income Bracket | Owner-occupied | Renter-occupied |
| Less than $5,000 | 0 (0.0%) | 0 (0.0%) |
| $5,000 to $9,999 | 0 (0.0%) | 0 (0.0%) |
| $10,000 to $14,999 | 0 (0.0%) | 0 (0.0%) |
| $15,000 to $19,999 | 1 (1.3%) | 5 (16.7%) |
| $20,000 to $24,999 | 5 (6.3%) | 1 (3.3%) |
| $25,000 to $34,999 | 1 (1.3%) | 2 (6.7%) |
| $35,000 to $49,999 | 8 (10.1%) | 9 (30.0%) |
| $50,000 to $74,999 | 19 (24.0%) | 4 (13.3%) |
| $75,000 to $99,999 | 12 (15.2%) | 0 (0.0%) |
| $100,000 to $149,999 | 18 (22.8%) | 0 (0.0%) |
| $150,000 or more | 15 (19.0%) | 9 (30.0%) |
| Total | 79 (100.0%) | 30 (100.0%) |
Monthly Housing Cost Tiers in Almira
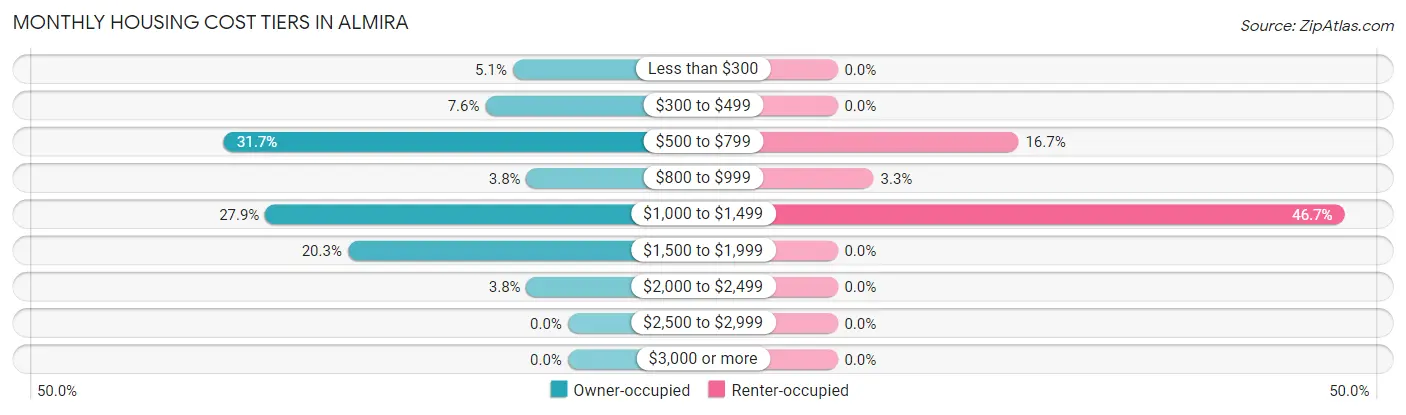
| Monthly Cost | Owner-occupied | Renter-occupied |
| Less than $300 | 4 (5.1%) | 0 (0.0%) |
| $300 to $499 | 6 (7.6%) | 0 (0.0%) |
| $500 to $799 | 25 (31.7%) | 5 (16.7%) |
| $800 to $999 | 3 (3.8%) | 1 (3.3%) |
| $1,000 to $1,499 | 22 (27.9%) | 14 (46.7%) |
| $1,500 to $1,999 | 16 (20.3%) | 0 (0.0%) |
| $2,000 to $2,499 | 3 (3.8%) | 0 (0.0%) |
| $2,500 to $2,999 | 0 (0.0%) | 0 (0.0%) |
| $3,000 or more | 0 (0.0%) | 0 (0.0%) |
| Total | 79 (100.0%) | 30 (100.0%) |
Physical Housing Characteristics in Almira
Housing Structures in Almira
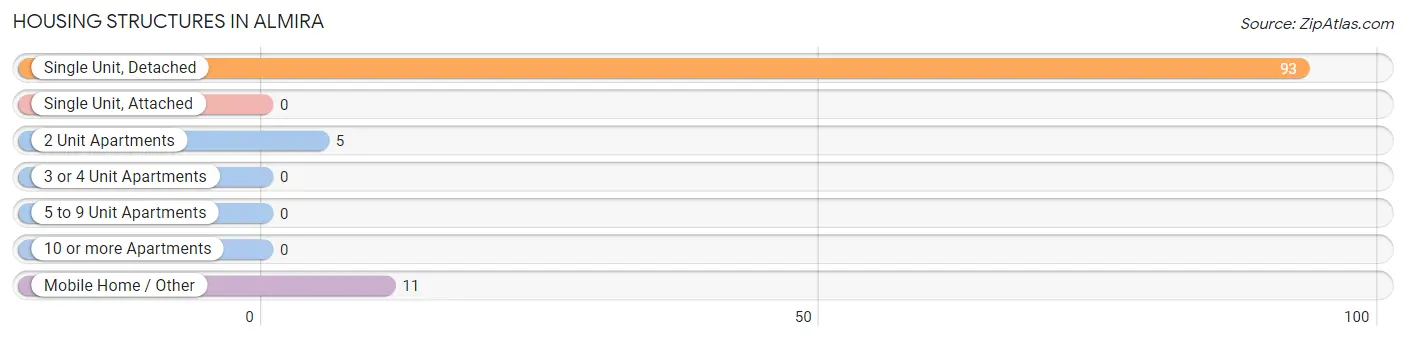
| Structure Type | # Housing Units | % Housing Units |
| Single Unit, Detached | 93 | 85.3% |
| Single Unit, Attached | 0 | 0.0% |
| 2 Unit Apartments | 5 | 4.6% |
| 3 or 4 Unit Apartments | 0 | 0.0% |
| 5 to 9 Unit Apartments | 0 | 0.0% |
| 10 or more Apartments | 0 | 0.0% |
| Mobile Home / Other | 11 | 10.1% |
| Total | 109 | 100.0% |
Housing Structures by Occupancy in Almira
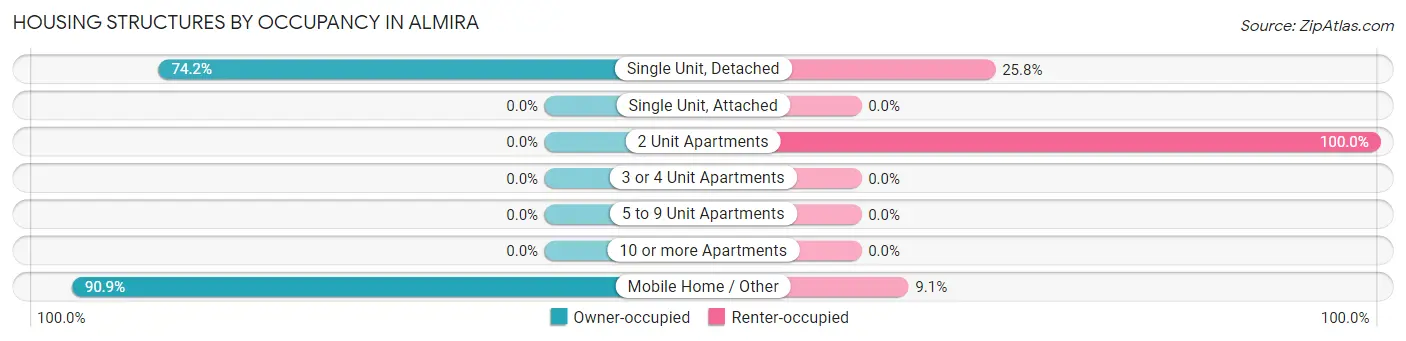
| Structure Type | Owner-occupied | Renter-occupied |
| Single Unit, Detached | 69 (74.2%) | 24 (25.8%) |
| Single Unit, Attached | 0 (0.0%) | 0 (0.0%) |
| 2 Unit Apartments | 0 (0.0%) | 5 (100.0%) |
| 3 or 4 Unit Apartments | 0 (0.0%) | 0 (0.0%) |
| 5 to 9 Unit Apartments | 0 (0.0%) | 0 (0.0%) |
| 10 or more Apartments | 0 (0.0%) | 0 (0.0%) |
| Mobile Home / Other | 10 (90.9%) | 1 (9.1%) |
| Total | 79 (72.5%) | 30 (27.5%) |
Housing Structures by Number of Rooms in Almira
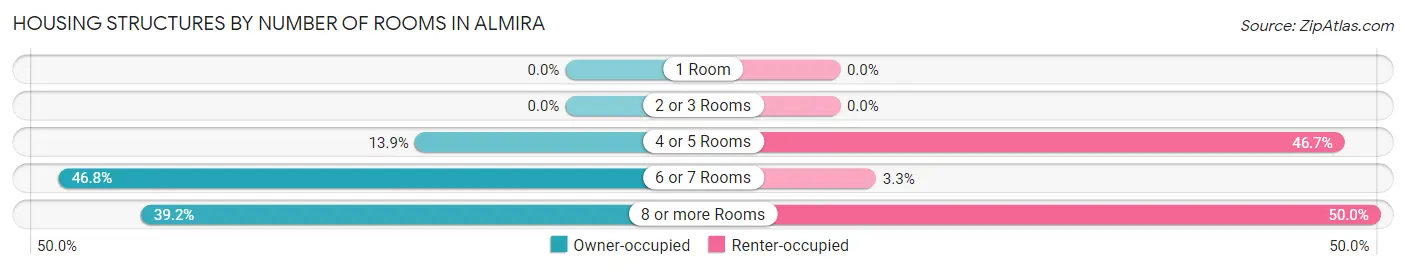
| Number of Rooms | Owner-occupied | Renter-occupied |
| 1 Room | 0 (0.0%) | 0 (0.0%) |
| 2 or 3 Rooms | 0 (0.0%) | 0 (0.0%) |
| 4 or 5 Rooms | 11 (13.9%) | 14 (46.7%) |
| 6 or 7 Rooms | 37 (46.8%) | 1 (3.3%) |
| 8 or more Rooms | 31 (39.2%) | 15 (50.0%) |
| Total | 79 (100.0%) | 30 (100.0%) |
Housing Structure by Heating Type in Almira
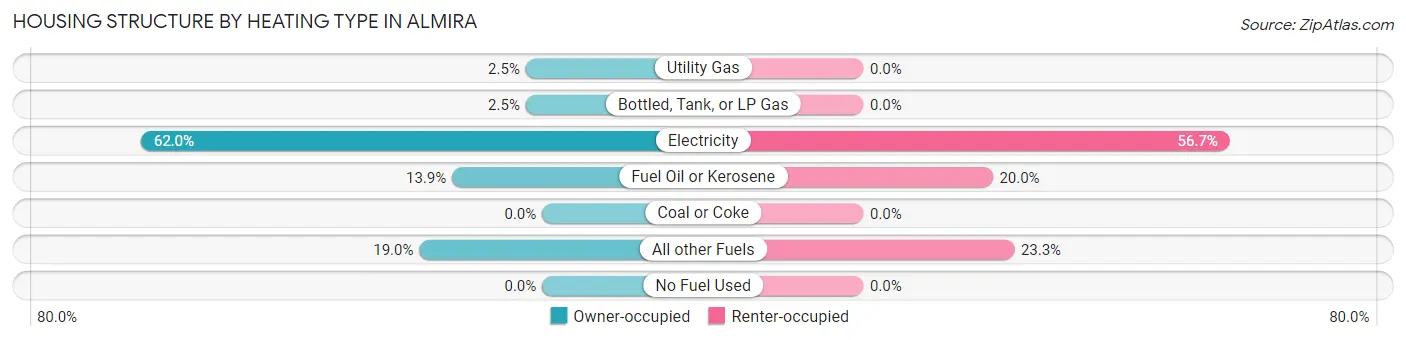
| Heating Type | Owner-occupied | Renter-occupied |
| Utility Gas | 2 (2.5%) | 0 (0.0%) |
| Bottled, Tank, or LP Gas | 2 (2.5%) | 0 (0.0%) |
| Electricity | 49 (62.0%) | 17 (56.7%) |
| Fuel Oil or Kerosene | 11 (13.9%) | 6 (20.0%) |
| Coal or Coke | 0 (0.0%) | 0 (0.0%) |
| All other Fuels | 15 (19.0%) | 7 (23.3%) |
| No Fuel Used | 0 (0.0%) | 0 (0.0%) |
| Total | 79 (100.0%) | 30 (100.0%) |
Household Vehicle Usage in Almira
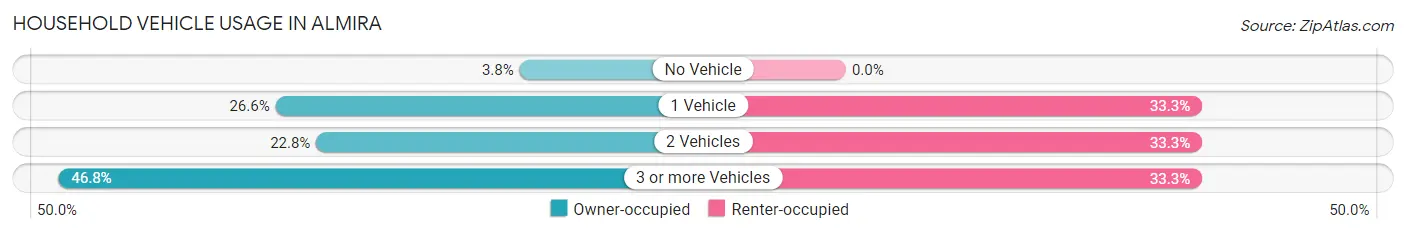
| Vehicles per Household | Owner-occupied | Renter-occupied |
| No Vehicle | 3 (3.8%) | 0 (0.0%) |
| 1 Vehicle | 21 (26.6%) | 10 (33.3%) |
| 2 Vehicles | 18 (22.8%) | 10 (33.3%) |
| 3 or more Vehicles | 37 (46.8%) | 10 (33.3%) |
| Total | 79 (100.0%) | 30 (100.0%) |
Real Estate & Mortgages in Almira
Real Estate and Mortgage Overview in Almira
| Characteristic | Without Mortgage | With Mortgage |
| Housing Units | 33 | 46 |
| Median Property Value | $110,600 | $200,000 |
| Median Household Income | $66,806 | $13 |
| Monthly Housing Costs | $623 | $0 |
| Real Estate Taxes | $675 | $0 |
Property Value by Mortgage Status in Almira
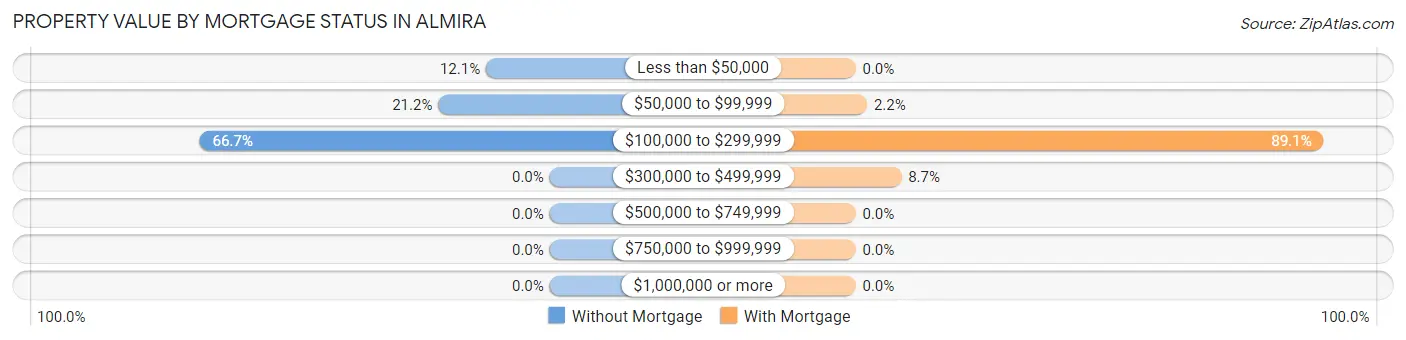
| Property Value | Without Mortgage | With Mortgage |
| Less than $50,000 | 4 (12.1%) | 0 (0.0%) |
| $50,000 to $99,999 | 7 (21.2%) | 1 (2.2%) |
| $100,000 to $299,999 | 22 (66.7%) | 41 (89.1%) |
| $300,000 to $499,999 | 0 (0.0%) | 4 (8.7%) |
| $500,000 to $749,999 | 0 (0.0%) | 0 (0.0%) |
| $750,000 to $999,999 | 0 (0.0%) | 0 (0.0%) |
| $1,000,000 or more | 0 (0.0%) | 0 (0.0%) |
| Total | 33 (100.0%) | 46 (100.0%) |
Household Income by Mortgage Status in Almira
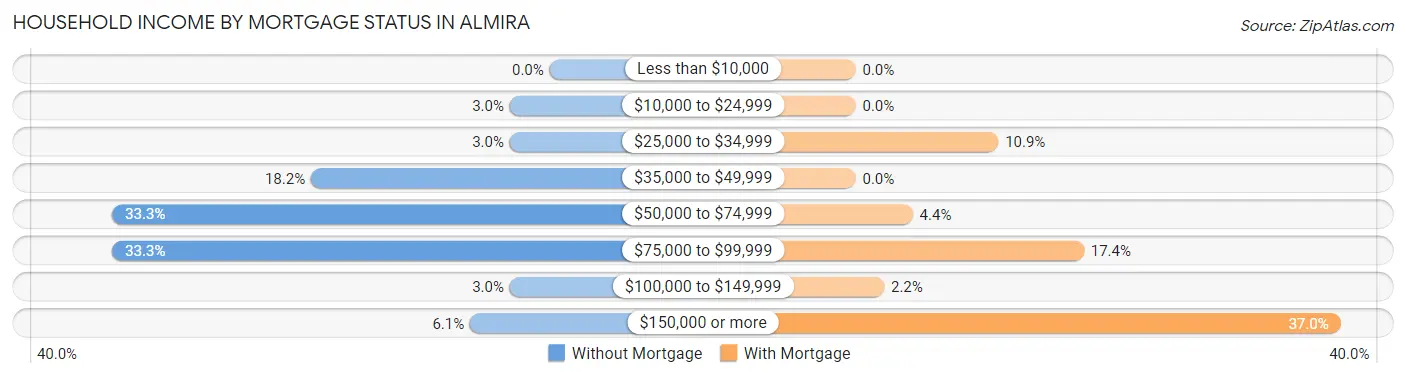
| Household Income | Without Mortgage | With Mortgage |
| Less than $10,000 | 0 (0.0%) | 0 (0.0%) |
| $10,000 to $24,999 | 1 (3.0%) | 0 (0.0%) |
| $25,000 to $34,999 | 1 (3.0%) | 5 (10.9%) |
| $35,000 to $49,999 | 6 (18.2%) | 0 (0.0%) |
| $50,000 to $74,999 | 11 (33.3%) | 2 (4.3%) |
| $75,000 to $99,999 | 11 (33.3%) | 8 (17.4%) |
| $100,000 to $149,999 | 1 (3.0%) | 1 (2.2%) |
| $150,000 or more | 2 (6.1%) | 17 (37.0%) |
| Total | 33 (100.0%) | 46 (100.0%) |
Property Value to Household Income Ratio in Almira
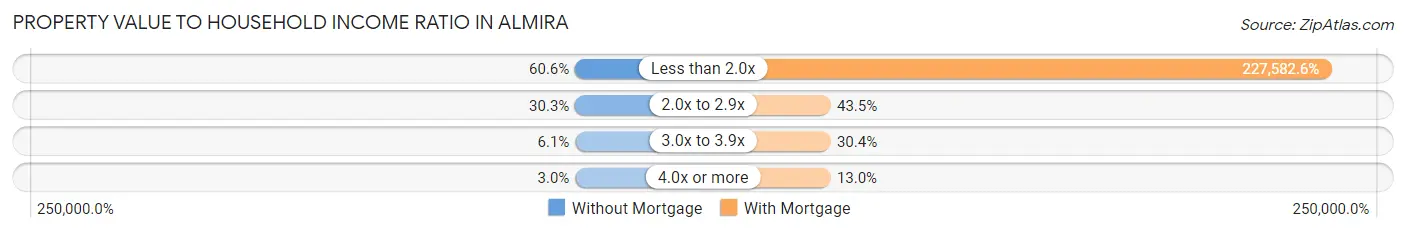
| Value-to-Income Ratio | Without Mortgage | With Mortgage |
| Less than 2.0x | 20 (60.6%) | 104,688 (227,582.6%) |
| 2.0x to 2.9x | 10 (30.3%) | 20 (43.5%) |
| 3.0x to 3.9x | 2 (6.1%) | 14 (30.4%) |
| 4.0x or more | 1 (3.0%) | 6 (13.0%) |
| Total | 33 (100.0%) | 46 (100.0%) |
Real Estate Taxes by Mortgage Status in Almira
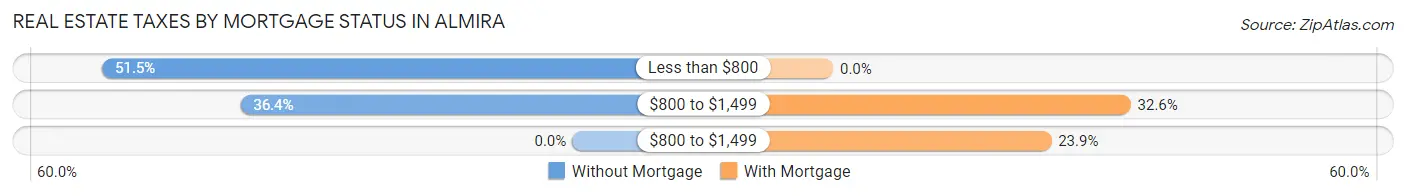
| Property Taxes | Without Mortgage | With Mortgage |
| Less than $800 | 17 (51.5%) | 0 (0.0%) |
| $800 to $1,499 | 12 (36.4%) | 15 (32.6%) |
| $800 to $1,499 | 0 (0.0%) | 11 (23.9%) |
| Total | 33 (100.0%) | 46 (100.0%) |
Health & Disability in Almira
Health Insurance Coverage by Age in Almira
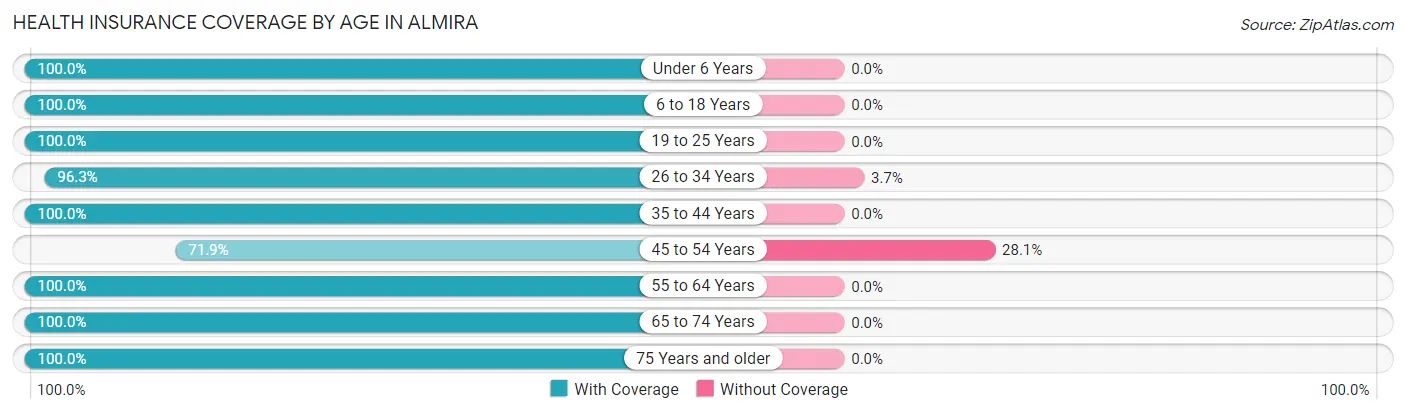
| Age Bracket | With Coverage | Without Coverage |
| Under 6 Years | 15 (100.0%) | 0 (0.0%) |
| 6 to 18 Years | 118 (100.0%) | 0 (0.0%) |
| 19 to 25 Years | 9 (100.0%) | 0 (0.0%) |
| 26 to 34 Years | 26 (96.3%) | 1 (3.7%) |
| 35 to 44 Years | 65 (100.0%) | 0 (0.0%) |
| 45 to 54 Years | 23 (71.9%) | 9 (28.1%) |
| 55 to 64 Years | 31 (100.0%) | 0 (0.0%) |
| 65 to 74 Years | 22 (100.0%) | 0 (0.0%) |
| 75 Years and older | 44 (100.0%) | 0 (0.0%) |
| Total | 353 (97.3%) | 10 (2.8%) |
Health Insurance Coverage by Citizenship Status in Almira

| Citizenship Status | With Coverage | Without Coverage |
| Native Born | 15 (100.0%) | 0 (0.0%) |
| Foreign Born, Citizen | 118 (100.0%) | 0 (0.0%) |
| Foreign Born, not a Citizen | 9 (100.0%) | 0 (0.0%) |
Health Insurance Coverage by Household Income in Almira
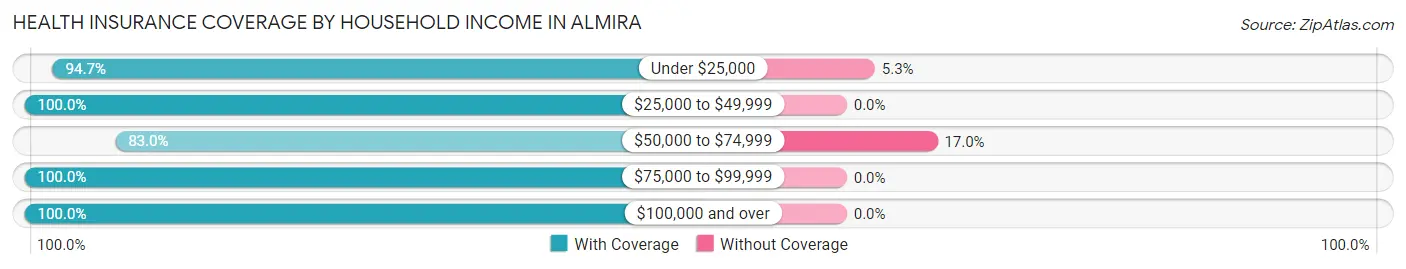
| Household Income | With Coverage | Without Coverage |
| Under $25,000 | 18 (94.7%) | 1 (5.3%) |
| $25,000 to $49,999 | 66 (100.0%) | 0 (0.0%) |
| $50,000 to $74,999 | 44 (83.0%) | 9 (17.0%) |
| $75,000 to $99,999 | 37 (100.0%) | 0 (0.0%) |
| $100,000 and over | 188 (100.0%) | 0 (0.0%) |
Public vs Private Health Insurance Coverage by Age in Almira
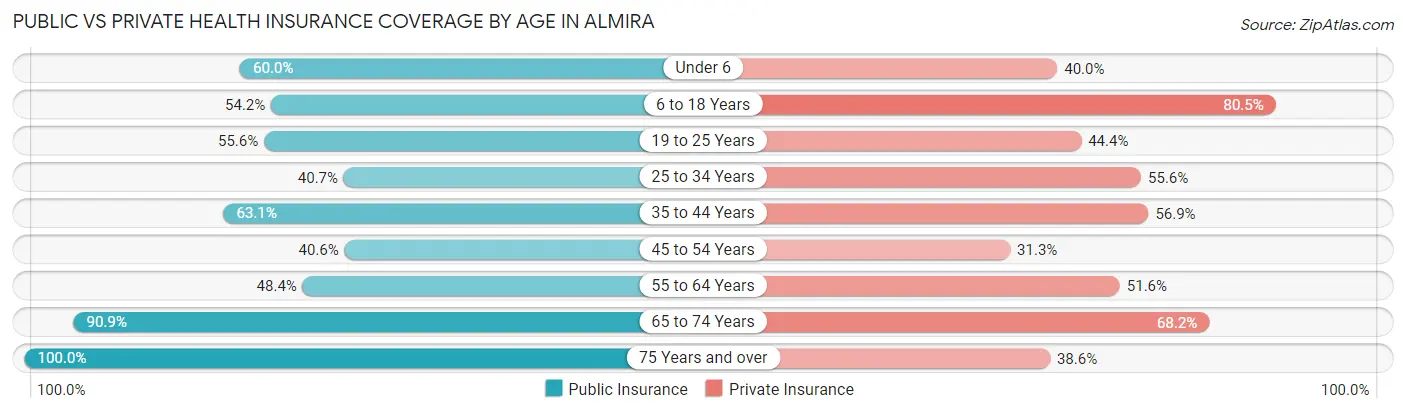
| Age Bracket | Public Insurance | Private Insurance |
| Under 6 | 9 (60.0%) | 6 (40.0%) |
| 6 to 18 Years | 64 (54.2%) | 95 (80.5%) |
| 19 to 25 Years | 5 (55.6%) | 4 (44.4%) |
| 25 to 34 Years | 11 (40.7%) | 15 (55.6%) |
| 35 to 44 Years | 41 (63.1%) | 37 (56.9%) |
| 45 to 54 Years | 13 (40.6%) | 10 (31.2%) |
| 55 to 64 Years | 15 (48.4%) | 16 (51.6%) |
| 65 to 74 Years | 20 (90.9%) | 15 (68.2%) |
| 75 Years and over | 44 (100.0%) | 17 (38.6%) |
| Total | 222 (61.2%) | 215 (59.2%) |
Disability Status by Sex by Age in Almira
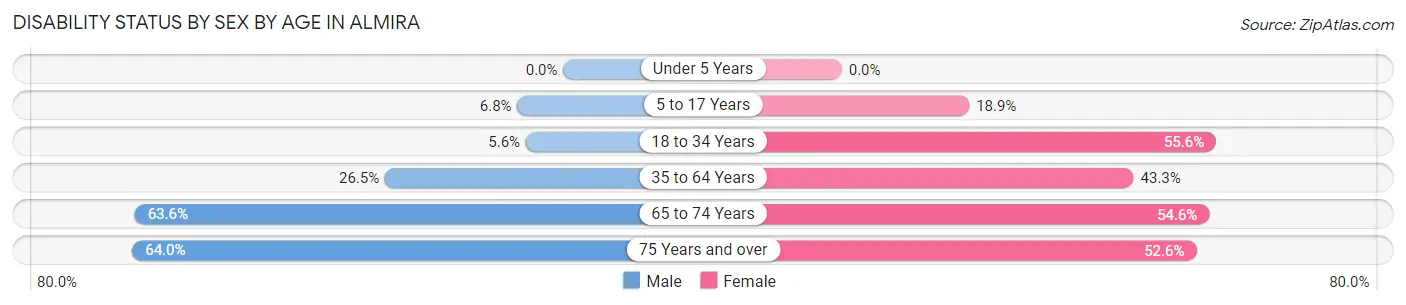
| Age Bracket | Male | Female |
| Under 5 Years | 0 (0.0%) | 0 (0.0%) |
| 5 to 17 Years | 3 (6.8%) | 14 (18.9%) |
| 18 to 34 Years | 1 (5.6%) | 10 (55.6%) |
| 35 to 64 Years | 18 (26.5%) | 26 (43.3%) |
| 65 to 74 Years | 7 (63.6%) | 6 (54.5%) |
| 75 Years and over | 16 (64.0%) | 10 (52.6%) |
Disability Class by Sex by Age in Almira
Disability Class: Hearing Difficulty
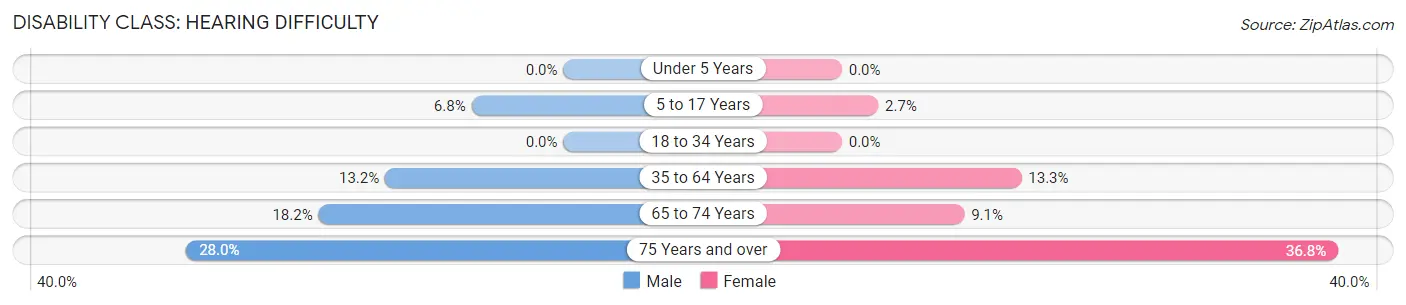
| Age Bracket | Male | Female |
| Under 5 Years | 0 (0.0%) | 0 (0.0%) |
| 5 to 17 Years | 3 (6.8%) | 2 (2.7%) |
| 18 to 34 Years | 0 (0.0%) | 0 (0.0%) |
| 35 to 64 Years | 9 (13.2%) | 8 (13.3%) |
| 65 to 74 Years | 2 (18.2%) | 1 (9.1%) |
| 75 Years and over | 7 (28.0%) | 7 (36.8%) |
Disability Class: Vision Difficulty
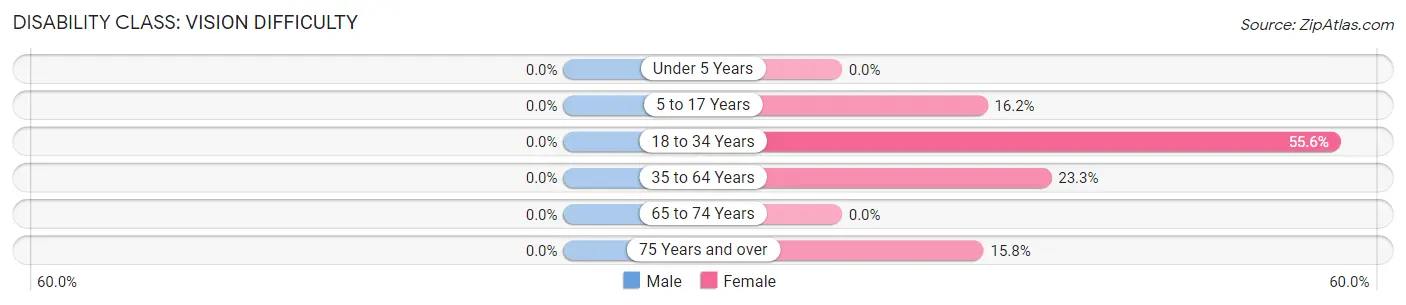
| Age Bracket | Male | Female |
| Under 5 Years | 0 (0.0%) | 0 (0.0%) |
| 5 to 17 Years | 0 (0.0%) | 12 (16.2%) |
| 18 to 34 Years | 0 (0.0%) | 10 (55.6%) |
| 35 to 64 Years | 0 (0.0%) | 14 (23.3%) |
| 65 to 74 Years | 0 (0.0%) | 0 (0.0%) |
| 75 Years and over | 0 (0.0%) | 3 (15.8%) |
Disability Class: Cognitive Difficulty
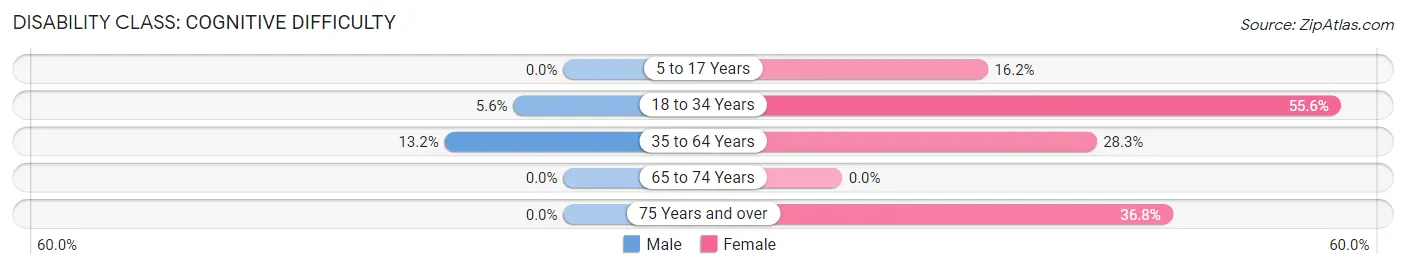
| Age Bracket | Male | Female |
| 5 to 17 Years | 0 (0.0%) | 12 (16.2%) |
| 18 to 34 Years | 1 (5.6%) | 10 (55.6%) |
| 35 to 64 Years | 9 (13.2%) | 17 (28.3%) |
| 65 to 74 Years | 0 (0.0%) | 0 (0.0%) |
| 75 Years and over | 0 (0.0%) | 7 (36.8%) |
Disability Class: Ambulatory Difficulty
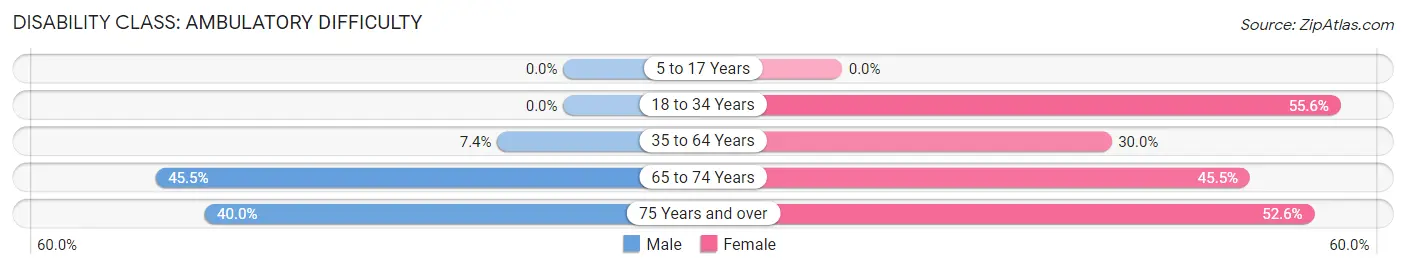
| Age Bracket | Male | Female |
| 5 to 17 Years | 0 (0.0%) | 0 (0.0%) |
| 18 to 34 Years | 0 (0.0%) | 10 (55.6%) |
| 35 to 64 Years | 5 (7.3%) | 18 (30.0%) |
| 65 to 74 Years | 5 (45.5%) | 5 (45.5%) |
| 75 Years and over | 10 (40.0%) | 10 (52.6%) |
Disability Class: Self-Care Difficulty
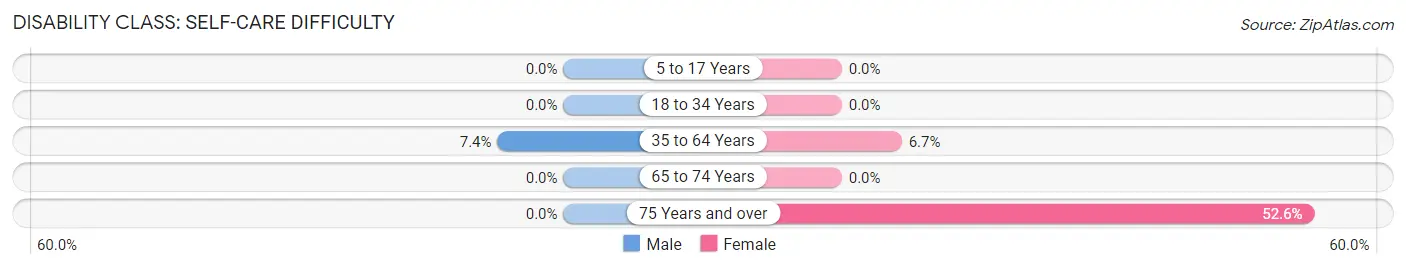
| Age Bracket | Male | Female |
| 5 to 17 Years | 0 (0.0%) | 0 (0.0%) |
| 18 to 34 Years | 0 (0.0%) | 0 (0.0%) |
| 35 to 64 Years | 5 (7.3%) | 4 (6.7%) |
| 65 to 74 Years | 0 (0.0%) | 0 (0.0%) |
| 75 Years and over | 0 (0.0%) | 10 (52.6%) |
Technology Access in Almira
Computing Device Access in Almira
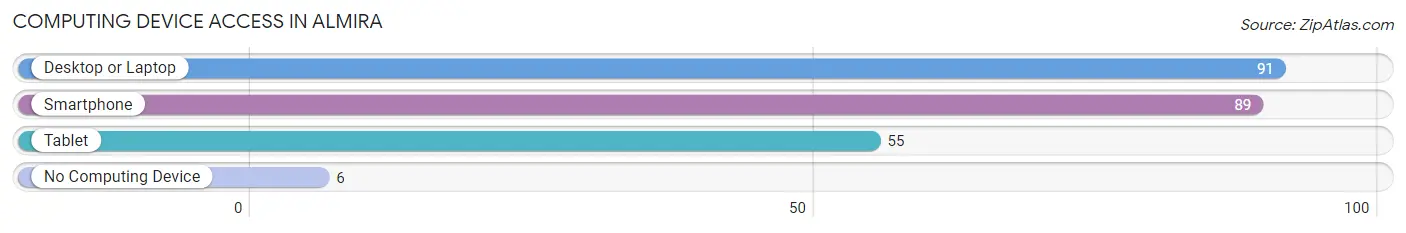
| Device Type | # Households | % Households |
| Desktop or Laptop | 91 | 83.5% |
| Smartphone | 89 | 81.7% |
| Tablet | 55 | 50.5% |
| No Computing Device | 6 | 5.5% |
| Total | 109 | 100.0% |
Internet Access in Almira
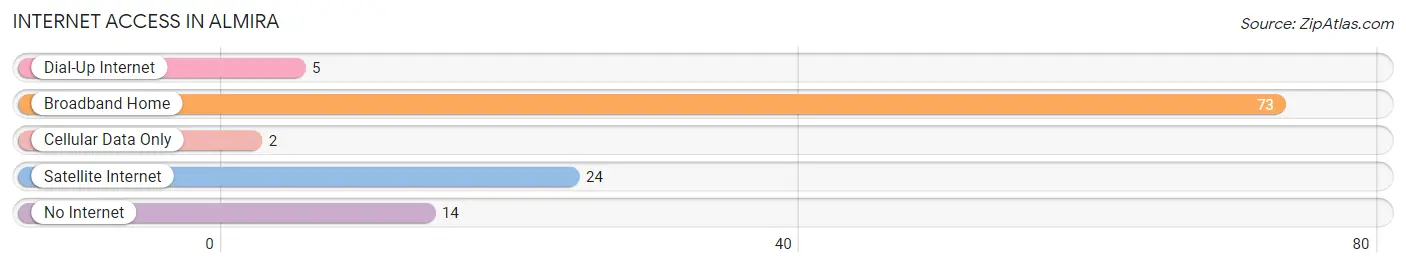
| Internet Type | # Households | % Households |
| Dial-Up Internet | 5 | 4.6% |
| Broadband Home | 73 | 67.0% |
| Cellular Data Only | 2 | 1.8% |
| Satellite Internet | 24 | 22.0% |
| No Internet | 14 | 12.8% |
| Total | 109 | 100.0% |
Almira Summary
Almira is a small town located in Lincoln County, Washington, United States. It is situated on the banks of the Columbia River, about 25 miles east of Spokane. The town was founded in 1883 and was named after Almira F. Paddock, the daughter of a local rancher. The population of Almira was estimated to be around 545 in 2020.
Geography
Almira is located in the Columbia Basin region of Washington, which is characterized by rolling hills and wide open spaces. The town is situated on the banks of the Columbia River, which provides a scenic backdrop for the town. The area is also home to a variety of wildlife, including deer, elk, and antelope. The climate in Almira is semi-arid, with hot summers and cold winters.
Economy
Almira’s economy is largely based on agriculture and tourism. The town is home to several farms, which produce a variety of crops, including wheat, barley, and alfalfa. The town also has a thriving tourism industry, with visitors coming to enjoy the area’s natural beauty and outdoor activities.
Demographics
As of the 2010 census, the population of Almira was 545, with a median age of 44.7 years. The racial makeup of the town was 94.2% White, 0.2% African American, 0.4% Native American, 0.4% Asian, 0.2% Pacific Islander, and 4.6% from other races. The median household income was $37,500, and the median family income was $41,250.
History
Almira was founded in 1883 by a group of settlers from the Midwest. The town was named after Almira F. Paddock, the daughter of a local rancher. The town quickly grew, and by the early 1900s, it had become a thriving agricultural center. In the 1920s, the town was home to a number of businesses, including a bank, a hotel, and a movie theater.
In the 1950s, the town began to decline as the population shifted to larger cities. However, in recent years, the town has seen a resurgence in population and economic activity. Today, Almira is a small but vibrant community, with a variety of businesses and attractions.
Conclusion
Almira is a small town located in Lincoln County, Washington, United States. It is situated on the banks of the Columbia River, about 25 miles east of Spokane. The town was founded in 1883 and was named after Almira F. Paddock, the daughter of a local rancher. The population of Almira was estimated to be around 545 in 2020. The town’s economy is largely based on agriculture and tourism, and the town is home to a variety of businesses and attractions. Almira is a small but vibrant community, with a rich history and a bright future.
Common Questions
What is Per Capita Income in Almira?
Per Capita income in Almira is $27,213.
What is the Median Family Income in Almira?
Median Family Income in Almira is $75,313.
What is the Median Household income in Almira?
Median Household Income in Almira is $72,188.
What is Income or Wage Gap in Almira?
Income or Wage Gap in Almira is 17.3%.
Women in Almira earn 82.7 cents for every dollar earned by a man.
What is Inequality or Gini Index in Almira?
Inequality or Gini Index in Almira is 0.36.
What is the Total Population of Almira?
Total Population of Almira is 363.
What is the Total Male Population of Almira?
Total Male Population of Almira is 175.
What is the Total Female Population of Almira?
Total Female Population of Almira is 188.
What is the Ratio of Males per 100 Females in Almira?
There are 93.09 Males per 100 Females in Almira.
What is the Ratio of Females per 100 Males in Almira?
There are 107.43 Females per 100 Males in Almira.
What is the Median Population Age in Almira?
Median Population Age in Almira is 37.0 Years.
What is the Average Family Size in Almira
Average Family Size in Almira is 3.9 People.
What is the Average Household Size in Almira
Average Household Size in Almira is 3.3 People.
How Large is the Labor Force in Almira?
There are 107 People in the Labor Forcein in Almira.
What is the Percentage of People in the Labor Force in Almira?
42.1% of People are in the Labor Force in Almira.
What is the Unemployment Rate in Almira?
Unemployment Rate in Almira is 10.3%.