Carlsborg, WA Map & Demographics
Carlsborg Map
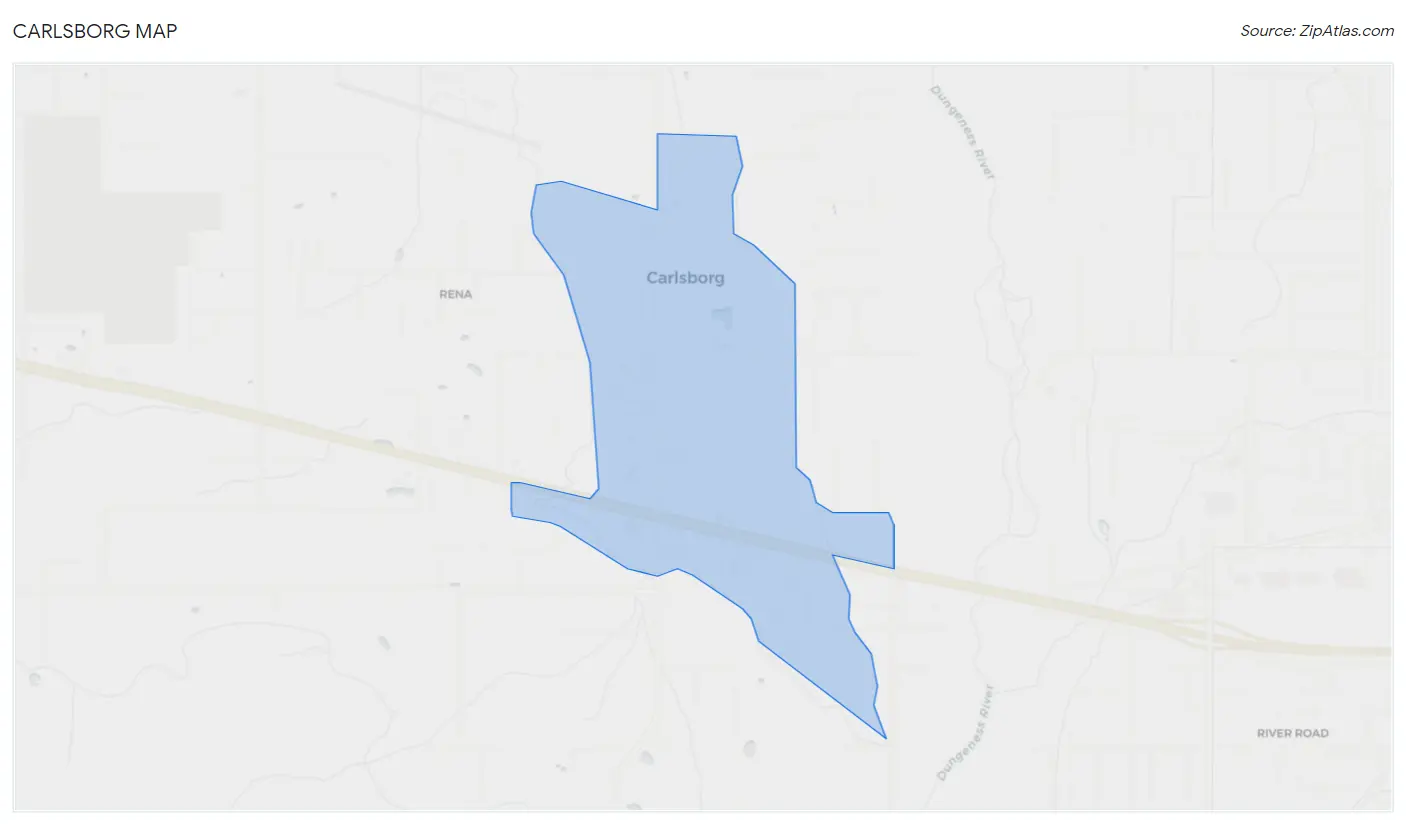
Carlsborg Overview
$28,749
PER CAPITA INCOME
$94,615
AVG FAMILY INCOME
$39,483
AVG HOUSEHOLD INCOME
0.47
INEQUALITY / GINI INDEX
932
TOTAL POPULATION
417
MALE POPULATION
515
FEMALE POPULATION
80.97
MALES / 100 FEMALES
123.50
FEMALES / 100 MALES
56.7
MEDIAN AGE
2.7
AVG FAMILY SIZE
1.8
AVG HOUSEHOLD SIZE
302
LABOR FORCE [ PEOPLE ]
36.6%
PERCENT IN LABOR FORCE
Carlsborg Area Codes
Income in Carlsborg
Income Overview in Carlsborg
Per Capita Income in Carlsborg is $28,749, while median incomes of families and households are $94,615 and $39,483 respectively.
| Characteristic | Number | Measure |
| Per Capita Income | 932 | $28,749 |
| Median Family Income | 226 | $94,615 |
| Mean Family Income | 226 | $93,227 |
| Median Household Income | 512 | $39,483 |
| Mean Household Income | 512 | $54,413 |
| Income Deficit | 226 | $0 |
| Wage / Income Gap (%) | 932 | 0.00% |
| Wage / Income Gap ($) | 932 | 100.00¢ per $1 |
| Gini / Inequality Index | 932 | 0.47 |
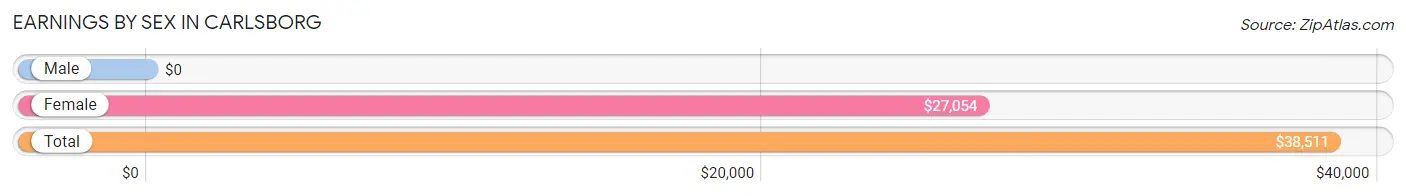
Earnings by Sex in Carlsborg
| Sex | Number | Average Earnings |
| Male | 207 (62.7%) | $0 |
| Female | 123 (37.3%) | $27,054 |
| Total | 330 (100.0%) | $38,511 |
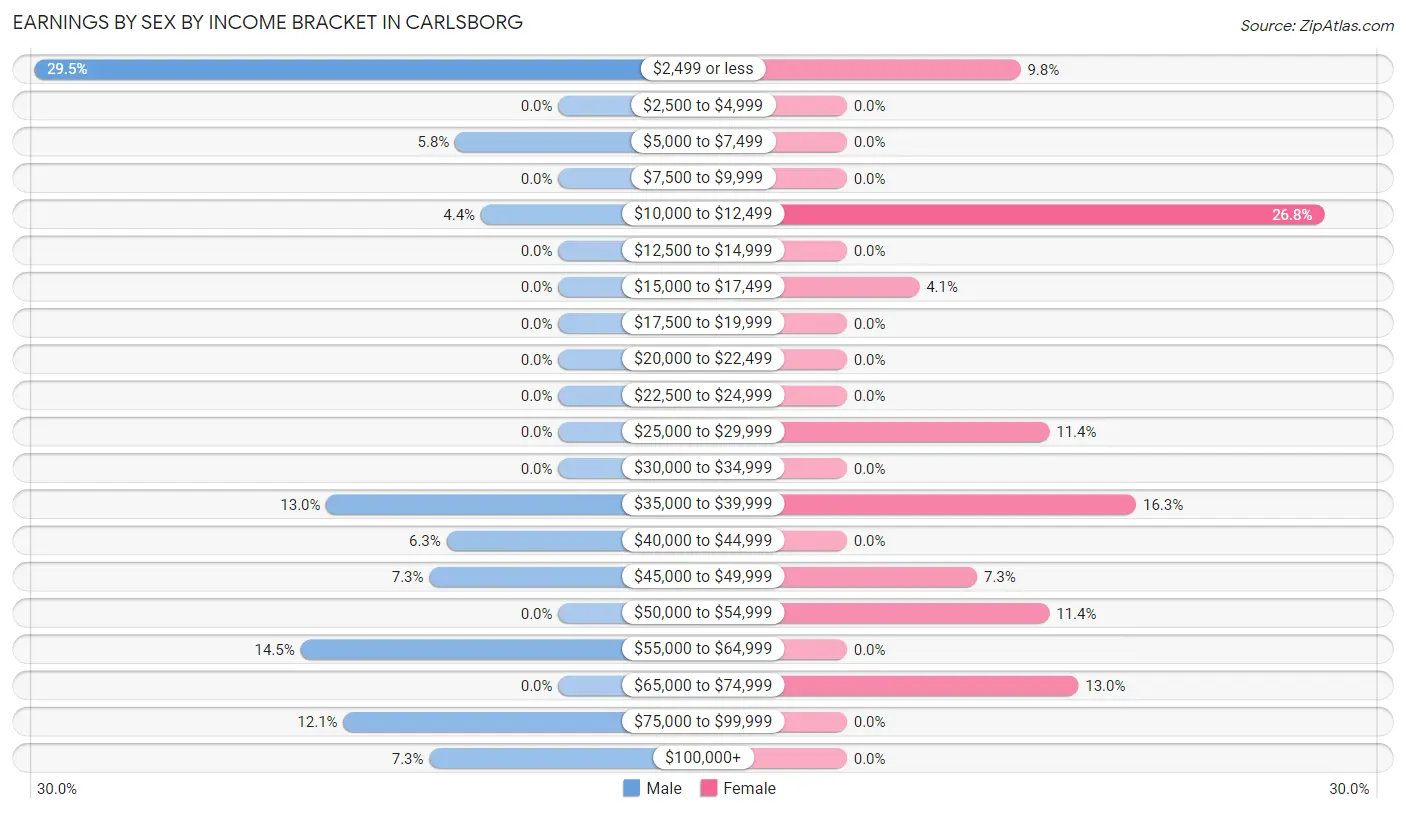
Earnings by Sex by Income Bracket in Carlsborg
The most common earnings brackets in Carlsborg are $2,499 or less for men (61 | 29.5%) and $10,000 to $12,499 for women (33 | 26.8%).
| Income | Male | Female |
| $2,499 or less | 61 (29.5%) | 12 (9.8%) |
| $2,500 to $4,999 | 0 (0.0%) | 0 (0.0%) |
| $5,000 to $7,499 | 12 (5.8%) | 0 (0.0%) |
| $7,500 to $9,999 | 0 (0.0%) | 0 (0.0%) |
| $10,000 to $12,499 | 9 (4.3%) | 33 (26.8%) |
| $12,500 to $14,999 | 0 (0.0%) | 0 (0.0%) |
| $15,000 to $17,499 | 0 (0.0%) | 5 (4.1%) |
| $17,500 to $19,999 | 0 (0.0%) | 0 (0.0%) |
| $20,000 to $22,499 | 0 (0.0%) | 0 (0.0%) |
| $22,500 to $24,999 | 0 (0.0%) | 0 (0.0%) |
| $25,000 to $29,999 | 0 (0.0%) | 14 (11.4%) |
| $30,000 to $34,999 | 0 (0.0%) | 0 (0.0%) |
| $35,000 to $39,999 | 27 (13.0%) | 20 (16.3%) |
| $40,000 to $44,999 | 13 (6.3%) | 0 (0.0%) |
| $45,000 to $49,999 | 15 (7.2%) | 9 (7.3%) |
| $50,000 to $54,999 | 0 (0.0%) | 14 (11.4%) |
| $55,000 to $64,999 | 30 (14.5%) | 0 (0.0%) |
| $65,000 to $74,999 | 0 (0.0%) | 16 (13.0%) |
| $75,000 to $99,999 | 25 (12.1%) | 0 (0.0%) |
| $100,000+ | 15 (7.2%) | 0 (0.0%) |
| Total | 207 (100.0%) | 123 (100.0%) |
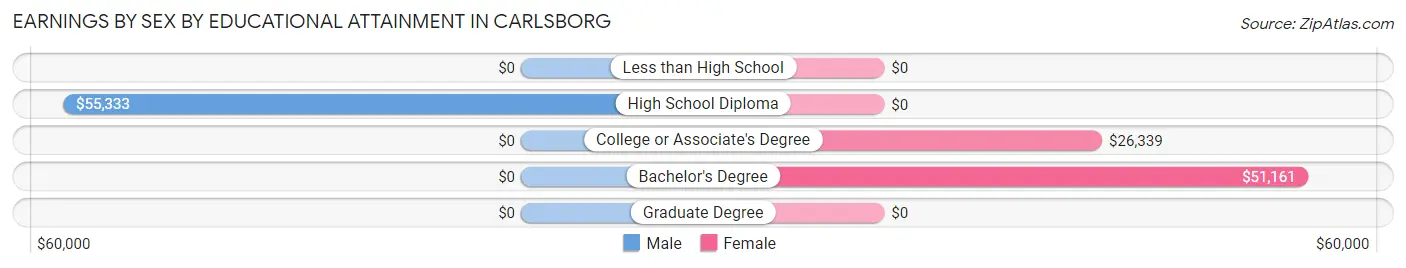
Earnings by Sex by Educational Attainment in Carlsborg
| Educational Attainment | Male Income | Female Income |
| Less than High School | - | - |
| High School Diploma | $55,333 | $0 |
| College or Associate's Degree | - | - |
| Bachelor's Degree | - | - |
| Graduate Degree | - | - |
| Total | - | - |
Family Income in Carlsborg
Family Income Brackets in Carlsborg
According to the Carlsborg family income data, there are 71 families falling into the $100,000 to $149,999 income range, which is the most common income bracket and makes up 31.4% of all families.
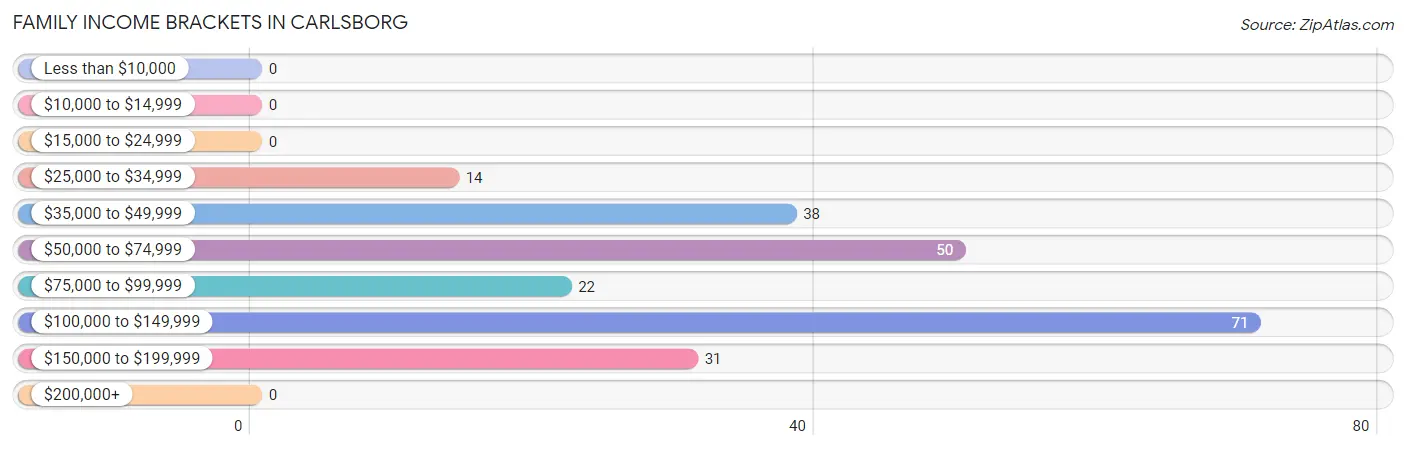
| Income Bracket | # Families | % Families |
| Less than $10,000 | 0 | 0.0% |
| $10,000 to $14,999 | 0 | 0.0% |
| $15,000 to $24,999 | 0 | 0.0% |
| $25,000 to $34,999 | 14 | 6.2% |
| $35,000 to $49,999 | 38 | 16.8% |
| $50,000 to $74,999 | 50 | 22.1% |
| $75,000 to $99,999 | 22 | 9.7% |
| $100,000 to $149,999 | 71 | 31.4% |
| $150,000 to $199,999 | 31 | 13.7% |
| $200,000+ | 0 | 0.0% |
Family Income by Famaliy Size in Carlsborg
3-person families (61 | 27.0%) account for the highest median family income in Carlsborg with $106,208 per family, while 3-person families (61 | 27.0%) have the highest median income of $35,403 per family member.
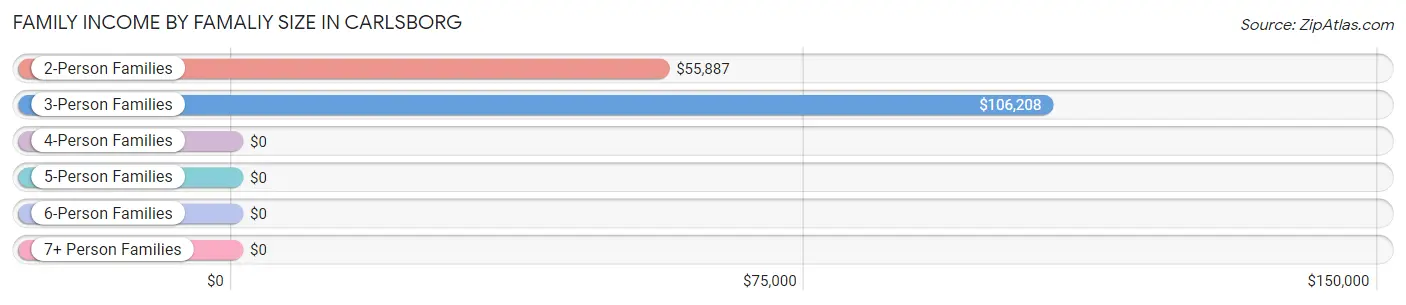
| Income Bracket | # Families | Median Income |
| 2-Person Families | 126 (55.7%) | $55,887 |
| 3-Person Families | 61 (27.0%) | $106,208 |
| 4-Person Families | 25 (11.1%) | $0 |
| 5-Person Families | 0 (0.0%) | $0 |
| 6-Person Families | 0 (0.0%) | $0 |
| 7+ Person Families | 14 (6.2%) | $0 |
| Total | 226 (100.0%) | $94,615 |
Family Income by Number of Earners in Carlsborg
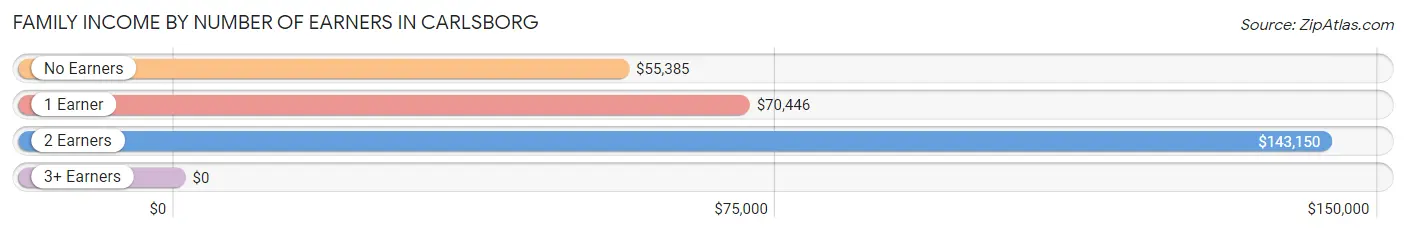
| Number of Earners | # Families | Median Income |
| No Earners | 72 (31.9%) | $55,385 |
| 1 Earner | 55 (24.3%) | $70,446 |
| 2 Earners | 99 (43.8%) | $143,150 |
| 3+ Earners | 0 (0.0%) | $0 |
| Total | 226 (100.0%) | $94,615 |
Household Income in Carlsborg
Household Income Brackets in Carlsborg
With 127 households falling in the category, the less than $10,000 income range is the most frequent in Carlsborg, accounting for 24.8% of all households.
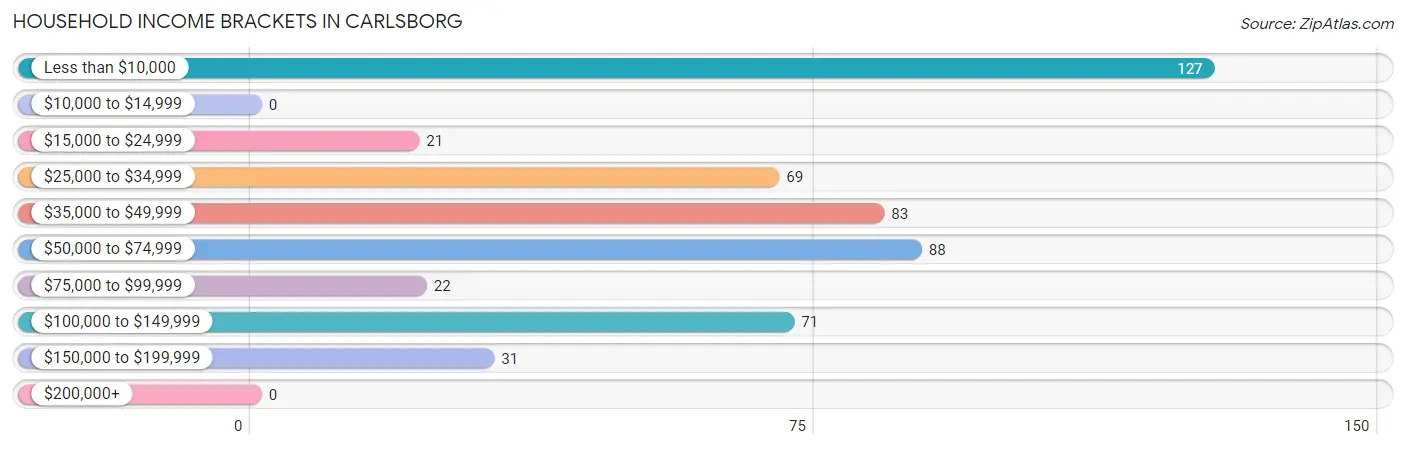
| Income Bracket | # Households | % Households |
| Less than $10,000 | 127 | 24.8% |
| $10,000 to $14,999 | 0 | 0.0% |
| $15,000 to $24,999 | 21 | 4.1% |
| $25,000 to $34,999 | 69 | 13.5% |
| $35,000 to $49,999 | 83 | 16.2% |
| $50,000 to $74,999 | 88 | 17.2% |
| $75,000 to $99,999 | 22 | 4.3% |
| $100,000 to $149,999 | 71 | 13.9% |
| $150,000 to $199,999 | 31 | 6.1% |
| $200,000+ | 0 | 0.0% |
Household Income by Householder Age in Carlsborg
The median household income in Carlsborg is $39,483, with the highest median household income of $37,672 found in the 65+ years age bracket for the primary householder. A total of 254 households (49.6%) fall into this category.
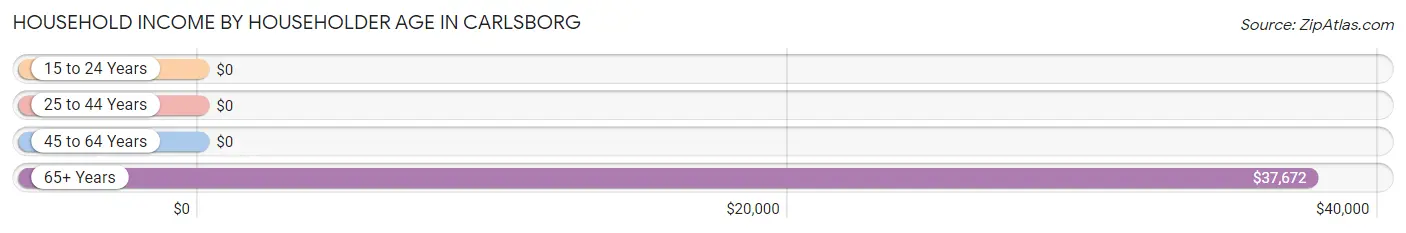
| Income Bracket | # Households | Median Income |
| 15 to 24 Years | 0 (0.0%) | $0 |
| 25 to 44 Years | 116 (22.7%) | $0 |
| 45 to 64 Years | 142 (27.7%) | $0 |
| 65+ Years | 254 (49.6%) | $37,672 |
| Total | 512 (100.0%) | $39,483 |
Poverty in Carlsborg
Income Below Poverty by Sex and Age in Carlsborg
With 14.6% poverty level for males and 15.1% for females among the residents of Carlsborg, 45 to 54 year old males and 25 to 34 year old females are the most vulnerable to poverty, with 61 males (87.1%) and 47 females (77.0%) in their respective age groups living below the poverty level.
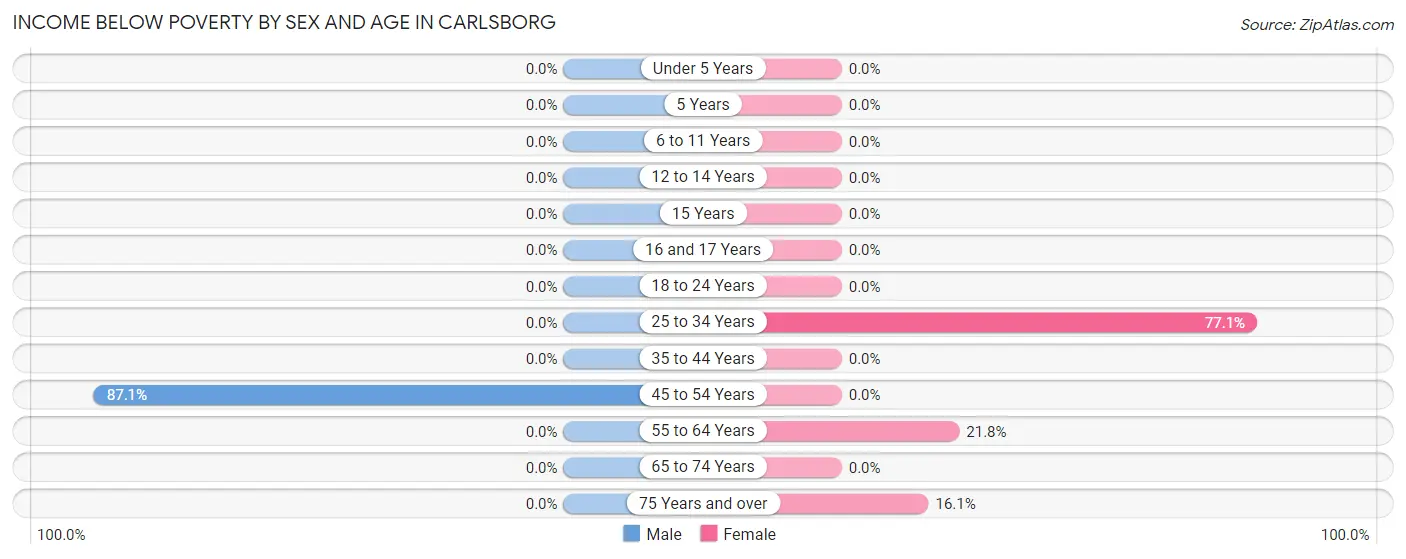
| Age Bracket | Male | Female |
| Under 5 Years | 0 (0.0%) | 0 (0.0%) |
| 5 Years | 0 (0.0%) | 0 (0.0%) |
| 6 to 11 Years | 0 (0.0%) | 0 (0.0%) |
| 12 to 14 Years | 0 (0.0%) | 0 (0.0%) |
| 15 Years | 0 (0.0%) | 0 (0.0%) |
| 16 and 17 Years | 0 (0.0%) | 0 (0.0%) |
| 18 to 24 Years | 0 (0.0%) | 0 (0.0%) |
| 25 to 34 Years | 0 (0.0%) | 47 (77.0%) |
| 35 to 44 Years | 0 (0.0%) | 0 (0.0%) |
| 45 to 54 Years | 61 (87.1%) | 0 (0.0%) |
| 55 to 64 Years | 0 (0.0%) | 12 (21.8%) |
| 65 to 74 Years | 0 (0.0%) | 0 (0.0%) |
| 75 Years and over | 0 (0.0%) | 19 (16.1%) |
| Total | 61 (14.6%) | 78 (15.1%) |
Income Above Poverty by Sex and Age in Carlsborg
According to the poverty statistics in Carlsborg, males aged under 5 years and females aged 5 years are the age groups that are most secure financially, with 100.0% of males and 100.0% of females in these age groups living above the poverty line.
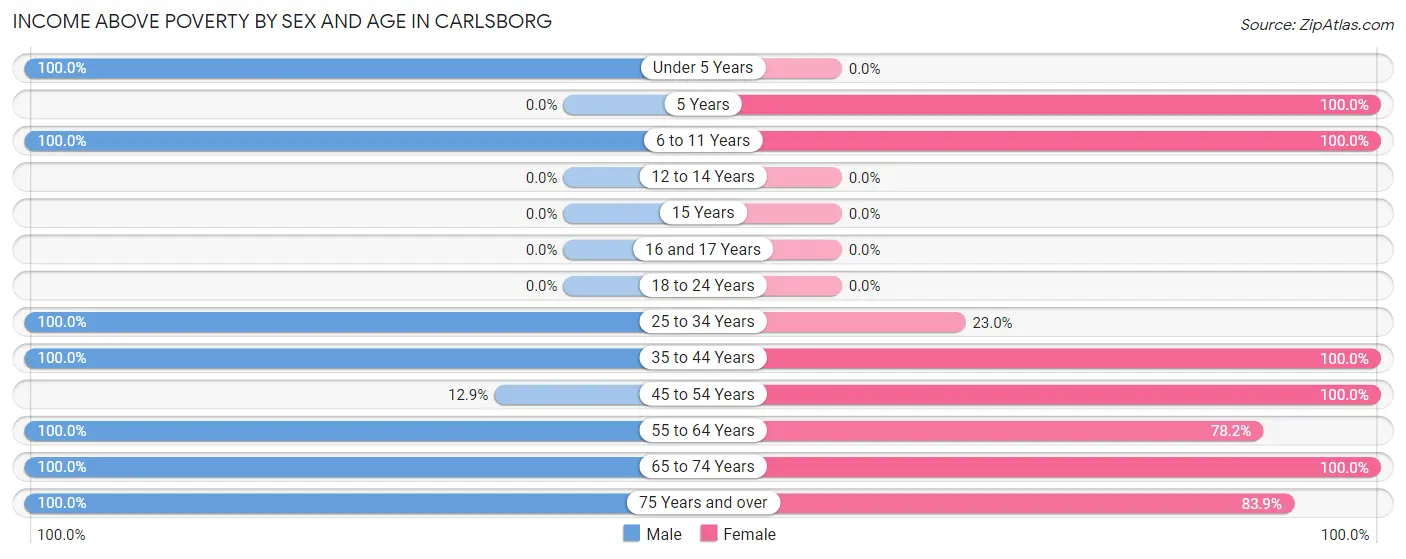
| Age Bracket | Male | Female |
| Under 5 Years | 18 (100.0%) | 0 (0.0%) |
| 5 Years | 0 (0.0%) | 11 (100.0%) |
| 6 to 11 Years | 47 (100.0%) | 30 (100.0%) |
| 12 to 14 Years | 0 (0.0%) | 0 (0.0%) |
| 15 Years | 0 (0.0%) | 0 (0.0%) |
| 16 and 17 Years | 0 (0.0%) | 0 (0.0%) |
| 18 to 24 Years | 0 (0.0%) | 0 (0.0%) |
| 25 to 34 Years | 87 (100.0%) | 14 (23.0%) |
| 35 to 44 Years | 25 (100.0%) | 16 (100.0%) |
| 45 to 54 Years | 9 (12.9%) | 91 (100.0%) |
| 55 to 64 Years | 48 (100.0%) | 43 (78.2%) |
| 65 to 74 Years | 41 (100.0%) | 133 (100.0%) |
| 75 Years and over | 81 (100.0%) | 99 (83.9%) |
| Total | 356 (85.4%) | 437 (84.9%) |
Income Below Poverty Among Married-Couple Families in Carlsborg
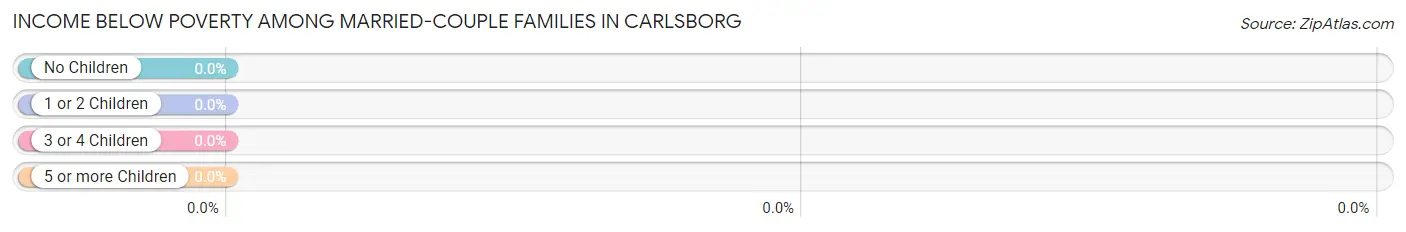
| Children | Above Poverty | Below Poverty |
| No Children | 151 (100.0%) | 0 (0.0%) |
| 1 or 2 Children | 25 (100.0%) | 0 (0.0%) |
| 3 or 4 Children | 0 (0.0%) | 0 (0.0%) |
| 5 or more Children | 14 (100.0%) | 0 (0.0%) |
| Total | 190 (100.0%) | 0 (0.0%) |
Income Below Poverty Among Single-Parent Households in Carlsborg
| Children | Single Father | Single Mother |
| No Children | 0 (0.0%) | 0 (0.0%) |
| 1 or 2 Children | 0 (0.0%) | 0 (0.0%) |
| 3 or 4 Children | 0 (0.0%) | 0 (0.0%) |
| 5 or more Children | 0 (0.0%) | 0 (0.0%) |
| Total | 0 (0.0%) | 0 (0.0%) |
Income Below Poverty Among Married-Couple vs Single-Parent Households in Carlsborg
| Children | Married-Couple Families | Single-Parent Households |
| No Children | 0 (0.0%) | 0 (0.0%) |
| 1 or 2 Children | 0 (0.0%) | 0 (0.0%) |
| 3 or 4 Children | 0 (0.0%) | 0 (0.0%) |
| 5 or more Children | 0 (0.0%) | 0 (0.0%) |
| Total | 0 (0.0%) | 0 (0.0%) |
Race in Carlsborg
The most populous races in Carlsborg are White / Caucasian (779 | 83.6%), Two or more Races (139 | 14.9%), and Asian (14 | 1.5%).
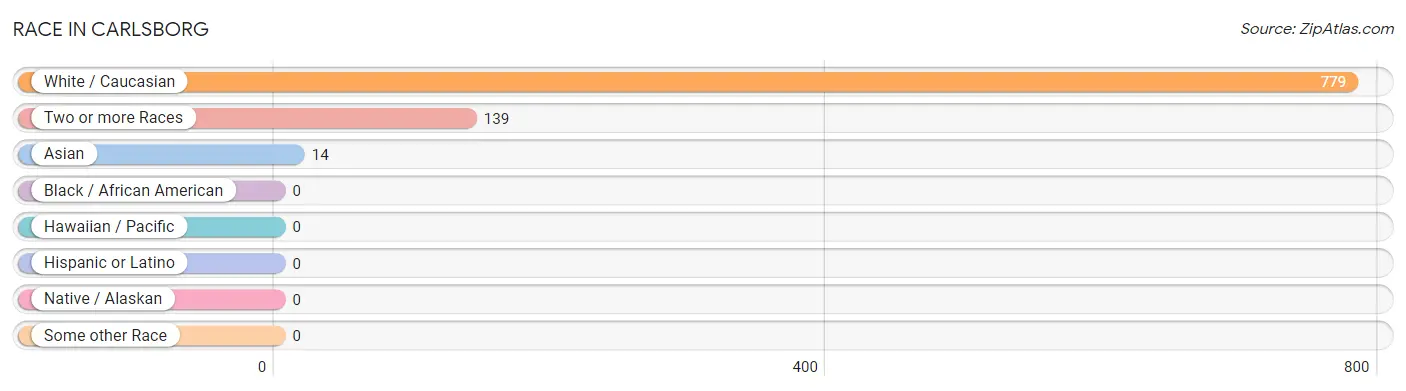
| Race | # Population | % Population |
| Asian | 14 | 1.5% |
| Black / African American | 0 | 0.0% |
| Hawaiian / Pacific | 0 | 0.0% |
| Hispanic or Latino | 0 | 0.0% |
| Native / Alaskan | 0 | 0.0% |
| White / Caucasian | 779 | 83.6% |
| Two or more Races | 139 | 14.9% |
| Some other Race | 0 | 0.0% |
| Total | 932 | 100.0% |
Ancestry in Carlsborg
The most populous ancestries reported in Carlsborg are English (203 | 21.8%), German (174 | 18.7%), Dutch (165 | 17.7%), Scandinavian (95 | 10.2%), and Korean (83 | 8.9%), together accounting for 77.2% of all Carlsborg residents.
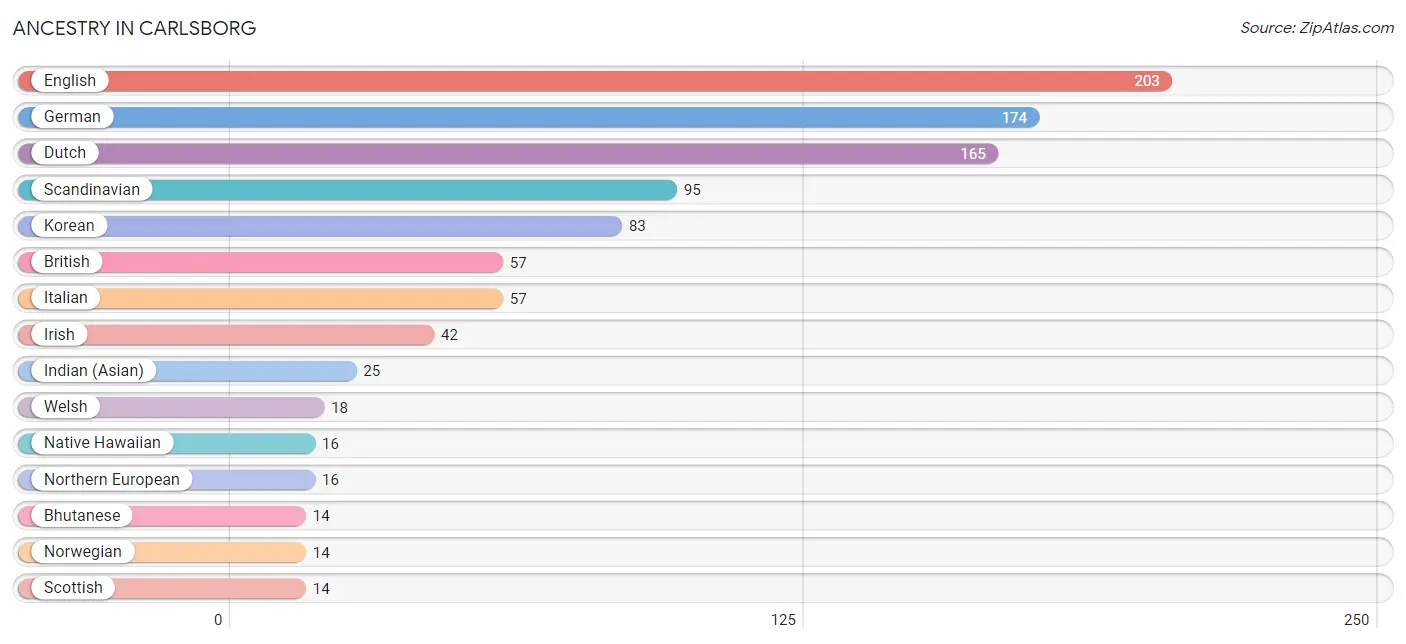
| Ancestry | # Population | % Population |
| American | 11 | 1.2% |
| Bermudan | 11 | 1.2% |
| Bhutanese | 14 | 1.5% |
| British | 57 | 6.1% |
| Dutch | 165 | 17.7% |
| English | 203 | 21.8% |
| French Canadian | 11 | 1.2% |
| German | 174 | 18.7% |
| Indian (Asian) | 25 | 2.7% |
| Irish | 42 | 4.5% |
| Italian | 57 | 6.1% |
| Korean | 83 | 8.9% |
| Native Hawaiian | 16 | 1.7% |
| Northern European | 16 | 1.7% |
| Norwegian | 14 | 1.5% |
| Scandinavian | 95 | 10.2% |
| Scottish | 14 | 1.5% |
| Swedish | 5 | 0.5% |
| Welsh | 18 | 1.9% | View All 19 Rows |
Immigrants in Carlsborg
The most numerous immigrant groups reported in Carlsborg came from Europe (28 | 3.0%), Northern Europe (28 | 3.0%), England (13 | 1.4%), Asia (9 | 1.0%), and Malaysia (9 | 1.0%), together accounting for 9.3% of all Carlsborg residents.
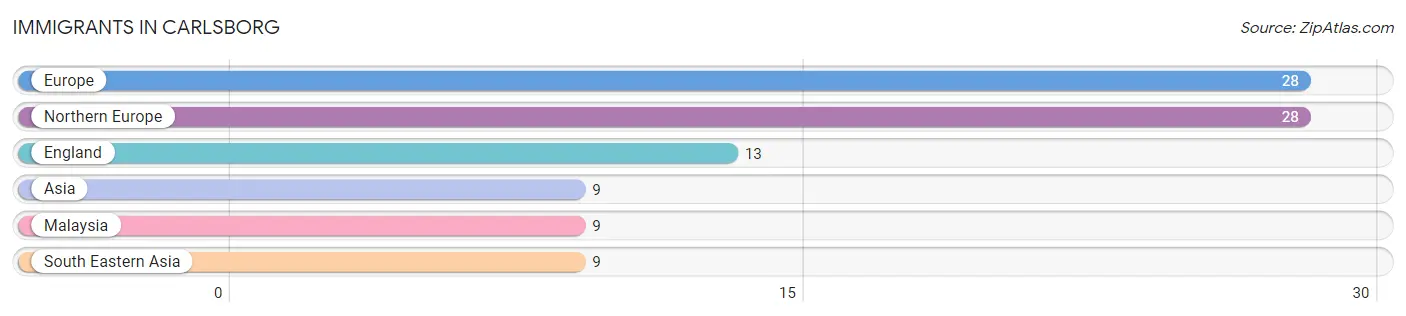
| Immigration Origin | # Population | % Population |
| Asia | 9 | 1.0% |
| England | 13 | 1.4% |
| Europe | 28 | 3.0% |
| Malaysia | 9 | 1.0% |
| Northern Europe | 28 | 3.0% |
| South Eastern Asia | 9 | 1.0% | View All 6 Rows |
Sex and Age in Carlsborg
Sex and Age in Carlsborg
The most populous age groups in Carlsborg are 30 to 34 Years (87 | 20.9%) for men and 70 to 74 Years (99 | 19.2%) for women.
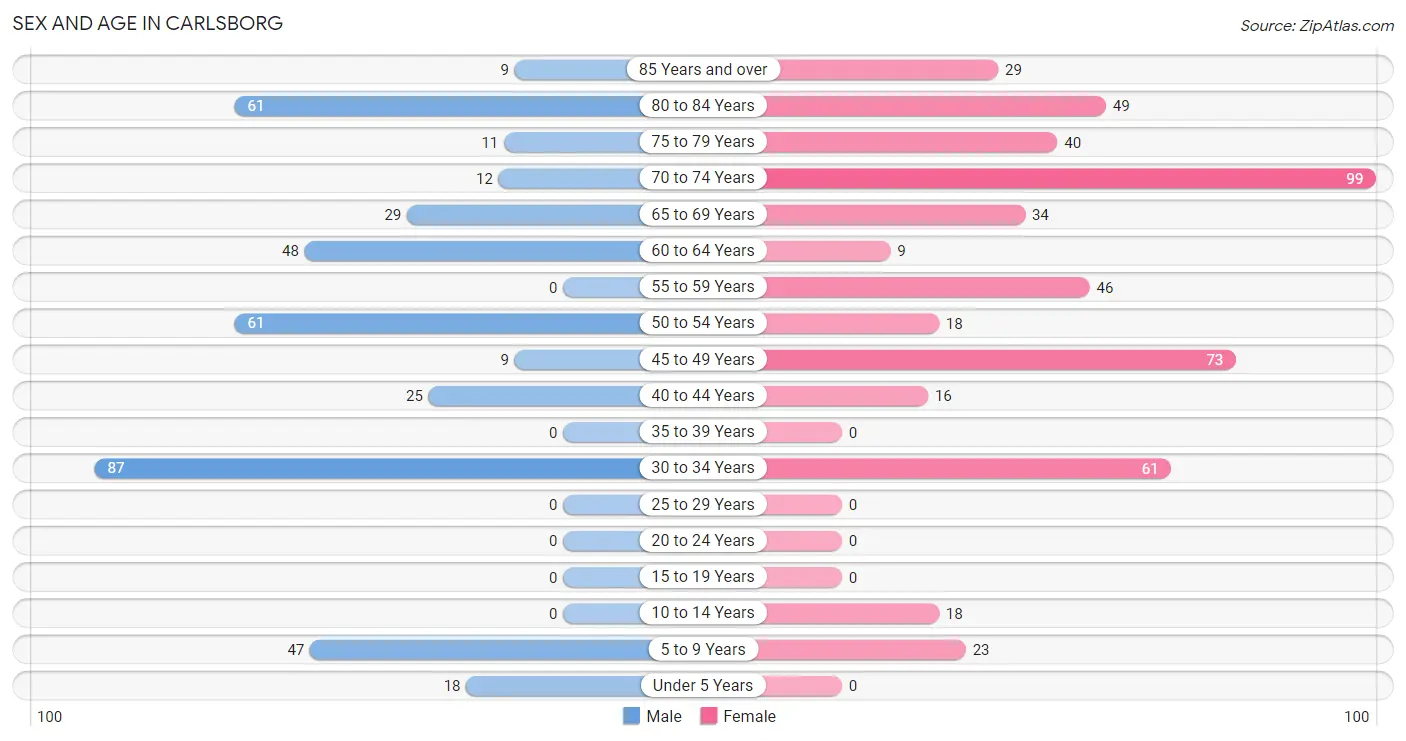
| Age Bracket | Male | Female |
| Under 5 Years | 18 (4.3%) | 0 (0.0%) |
| 5 to 9 Years | 47 (11.3%) | 23 (4.5%) |
| 10 to 14 Years | 0 (0.0%) | 18 (3.5%) |
| 15 to 19 Years | 0 (0.0%) | 0 (0.0%) |
| 20 to 24 Years | 0 (0.0%) | 0 (0.0%) |
| 25 to 29 Years | 0 (0.0%) | 0 (0.0%) |
| 30 to 34 Years | 87 (20.9%) | 61 (11.8%) |
| 35 to 39 Years | 0 (0.0%) | 0 (0.0%) |
| 40 to 44 Years | 25 (6.0%) | 16 (3.1%) |
| 45 to 49 Years | 9 (2.2%) | 73 (14.2%) |
| 50 to 54 Years | 61 (14.6%) | 18 (3.5%) |
| 55 to 59 Years | 0 (0.0%) | 46 (8.9%) |
| 60 to 64 Years | 48 (11.5%) | 9 (1.8%) |
| 65 to 69 Years | 29 (7.0%) | 34 (6.6%) |
| 70 to 74 Years | 12 (2.9%) | 99 (19.2%) |
| 75 to 79 Years | 11 (2.6%) | 40 (7.8%) |
| 80 to 84 Years | 61 (14.6%) | 49 (9.5%) |
| 85 Years and over | 9 (2.2%) | 29 (5.6%) |
| Total | 417 (100.0%) | 515 (100.0%) |
Families and Households in Carlsborg
Median Family Size in Carlsborg
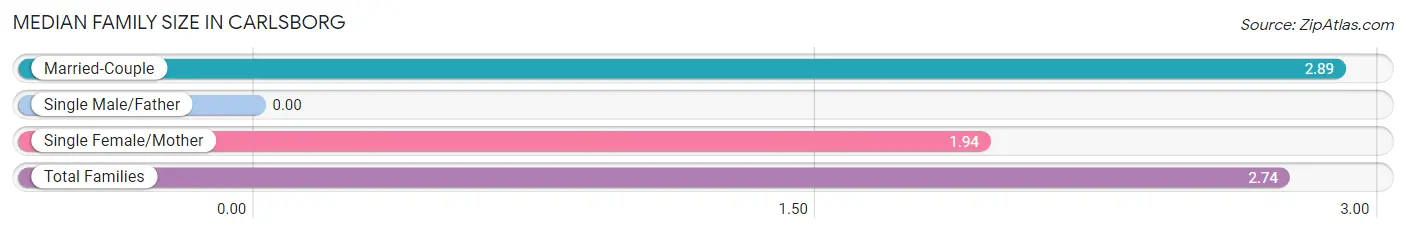
| Family Type | # Families | Family Size |
| Married-Couple | 190 (84.1%) | 2.89 |
| Single Male/Father | 0 (0.0%) | - |
| Single Female/Mother | 36 (15.9%) | 1.94 |
| Total Families | 226 (100.0%) | 2.74 |
Median Household Size in Carlsborg
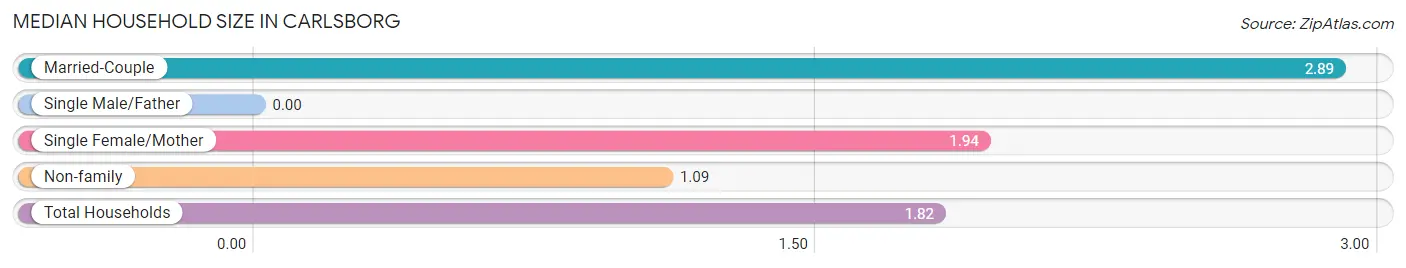
| Household Type | # Households | Household Size |
| Married-Couple | 190 (37.1%) | 2.89 |
| Single Male/Father | 0 (0.0%) | - |
| Single Female/Mother | 36 (7.0%) | 1.94 |
| Non-family | 286 (55.9%) | 1.09 |
| Total Households | 512 (100.0%) | 1.82 |
Household Size by Marriage Status in Carlsborg
Out of a total of 512 households in Carlsborg, 226 (44.1%) are family households, while 286 (55.9%) are nonfamily households. The most numerous type of family households are 2-person households, comprising 126, and the most common type of nonfamily households are 1-person households, comprising 263.
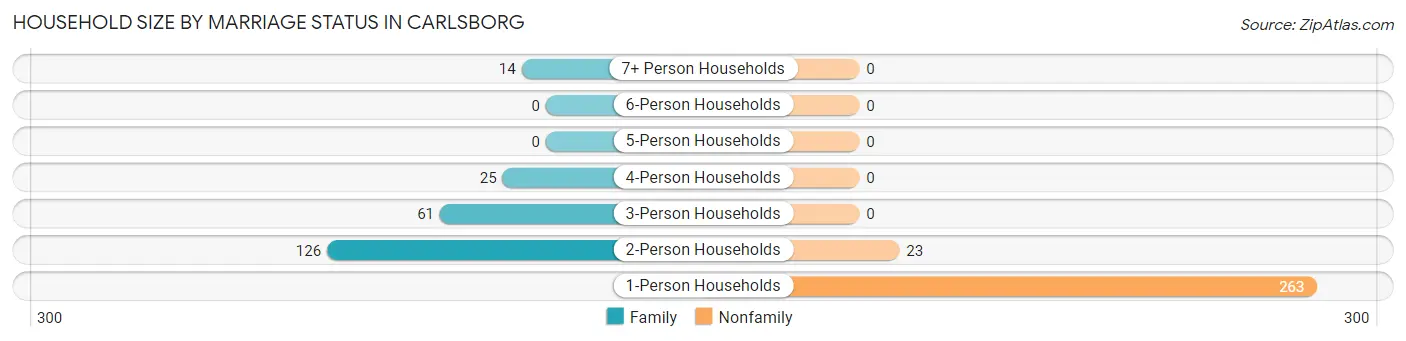
| Household Size | Family Households | Nonfamily Households |
| 1-Person Households | - | 263 (51.4%) |
| 2-Person Households | 126 (24.6%) | 23 (4.5%) |
| 3-Person Households | 61 (11.9%) | 0 (0.0%) |
| 4-Person Households | 25 (4.9%) | 0 (0.0%) |
| 5-Person Households | 0 (0.0%) | 0 (0.0%) |
| 6-Person Households | 0 (0.0%) | 0 (0.0%) |
| 7+ Person Households | 14 (2.7%) | 0 (0.0%) |
| Total | 226 (44.1%) | 286 (55.9%) |
Female Fertility in Carlsborg
Fertility by Age in Carlsborg
Average fertility rate in Carlsborg is 83.0 births per 1,000 women. Women in the age bracket of 20 to 34 years have the highest fertility rate with 230.0 births per 1,000 women. Women in the age bracket of 20 to 34 years acount for 100.0% of all women with births.
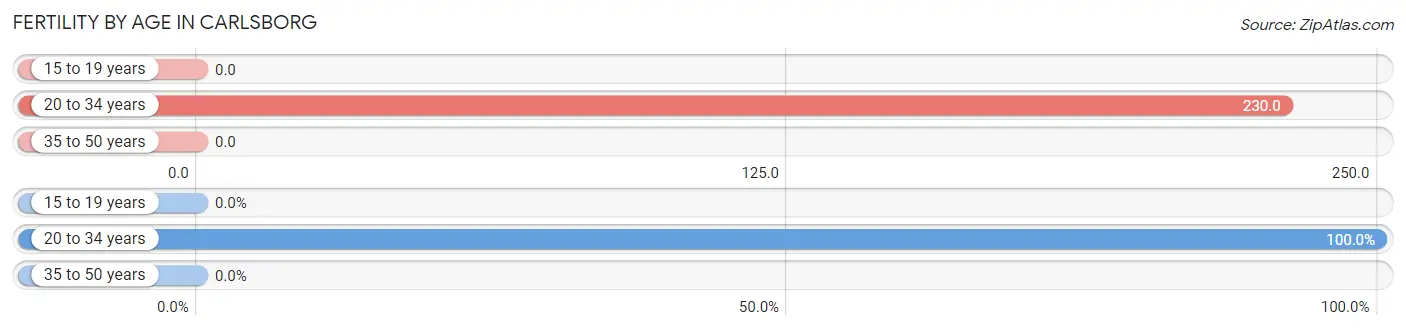
| Age Bracket | Women with Births | Births / 1,000 Women |
| 15 to 19 years | 0 (0.0%) | 0.0 |
| 20 to 34 years | 14 (100.0%) | 230.0 |
| 35 to 50 years | 0 (0.0%) | 0.0 |
| Total | 14 (100.0%) | 83.0 |
Fertility by Age by Marriage Status in Carlsborg
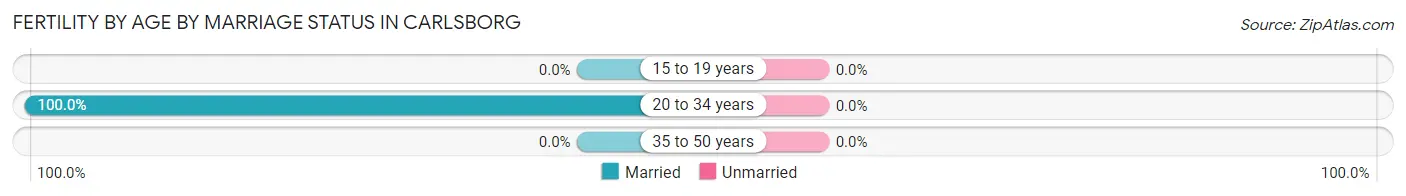
| Age Bracket | Married | Unmarried |
| 15 to 19 years | 0 (0.0%) | 0 (0.0%) |
| 20 to 34 years | 14 (100.0%) | 0 (0.0%) |
| 35 to 50 years | 0 (0.0%) | 0 (0.0%) |
| Total | 14 (100.0%) | 0 (0.0%) |
Fertility by Education in Carlsborg
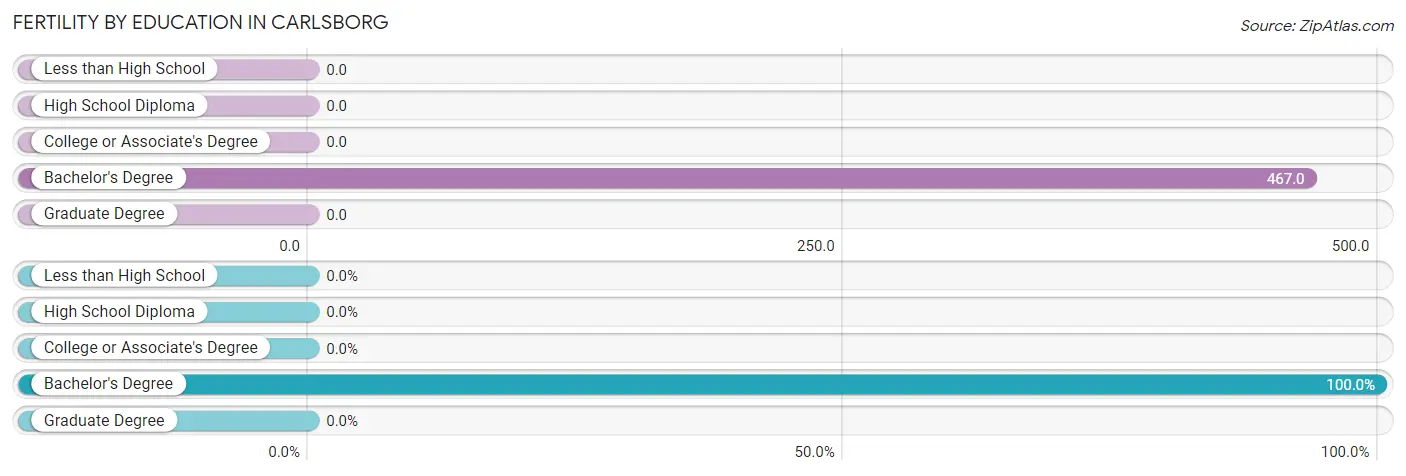
| Educational Attainment | Women with Births | Births / 1,000 Women |
| Less than High School | 0 (0.0%) | 0.0 |
| High School Diploma | 0 (0.0%) | 0.0 |
| College or Associate's Degree | 0 (0.0%) | 0.0 |
| Bachelor's Degree | 14 (100.0%) | 467.0 |
| Graduate Degree | 0 (0.0%) | 0.0 |
| Total | 14 (100.0%) | 83.0 |
Fertility by Education by Marriage Status in Carlsborg
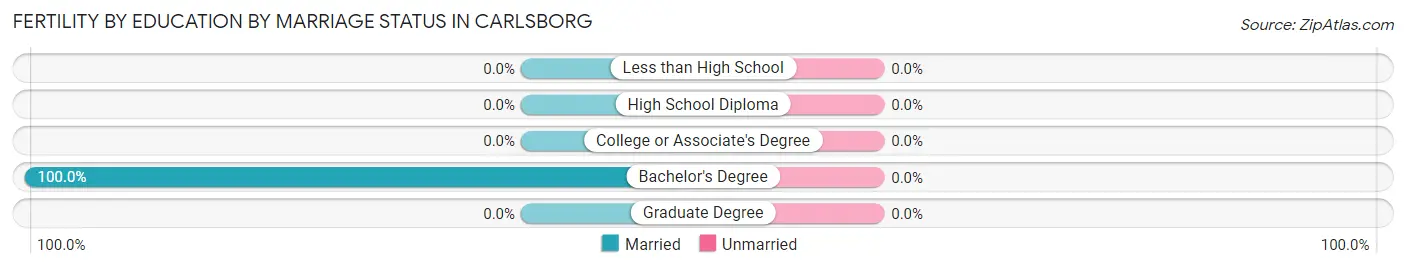
| Educational Attainment | Married | Unmarried |
| Less than High School | 0 (0.0%) | 0 (0.0%) |
| High School Diploma | 0 (0.0%) | 0 (0.0%) |
| College or Associate's Degree | 0 (0.0%) | 0 (0.0%) |
| Bachelor's Degree | 14 (100.0%) | 0 (0.0%) |
| Graduate Degree | 0 (0.0%) | 0 (0.0%) |
| Total | 14 (100.0%) | 0 (0.0%) |
Employment Characteristics in Carlsborg
Employment by Class of Employer in Carlsborg
Among the 302 employed individuals in Carlsborg, private company employees (144 | 47.7%), not-for-profit organizations (80 | 26.5%), and federal government employees (25 | 8.3%) make up the most common classes of employment.
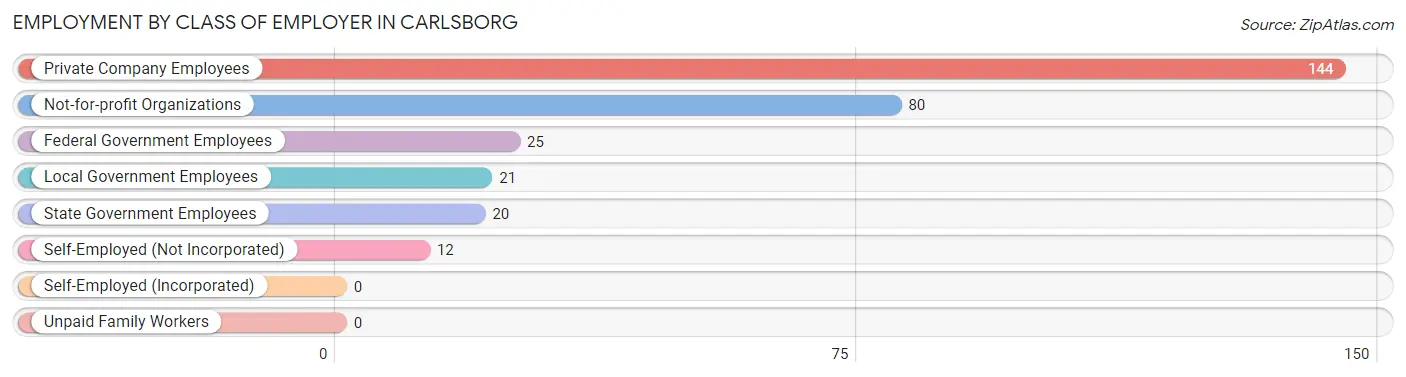
| Employer Class | # Employees | % Employees |
| Private Company Employees | 144 | 47.7% |
| Self-Employed (Incorporated) | 0 | 0.0% |
| Self-Employed (Not Incorporated) | 12 | 4.0% |
| Not-for-profit Organizations | 80 | 26.5% |
| Local Government Employees | 21 | 7.0% |
| State Government Employees | 20 | 6.6% |
| Federal Government Employees | 25 | 8.3% |
| Unpaid Family Workers | 0 | 0.0% |
| Total | 302 | 100.0% |
Employment Status by Age in Carlsborg
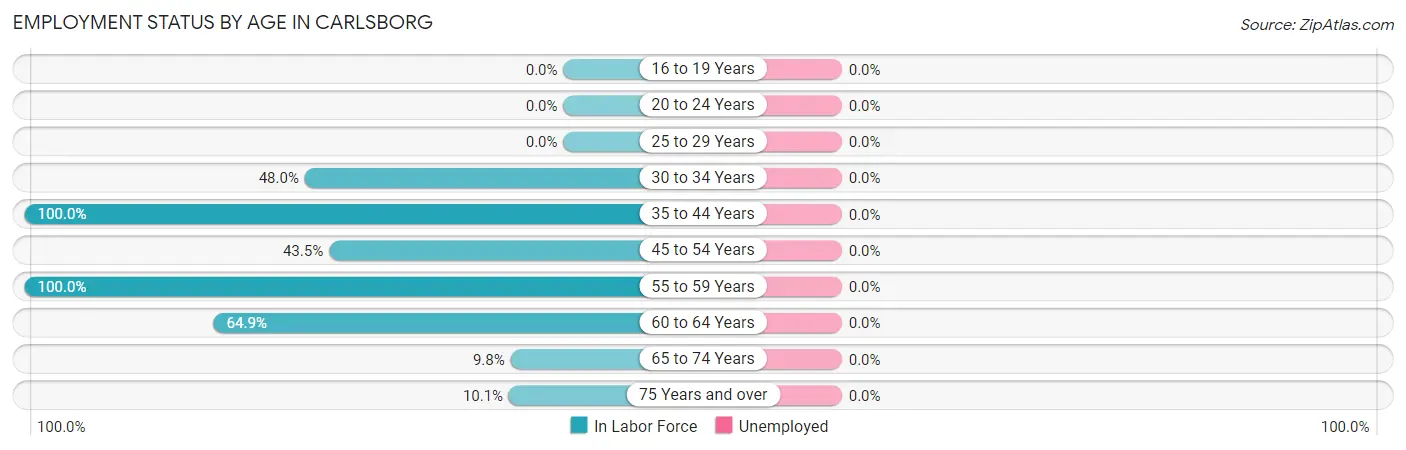
| Age Bracket | In Labor Force | Unemployed |
| 16 to 19 Years | 0 (0.0%) | 0 (0.0%) |
| 20 to 24 Years | 0 (0.0%) | 0 (0.0%) |
| 25 to 29 Years | 0 (0.0%) | 0 (0.0%) |
| 30 to 34 Years | 71 (48.0%) | 0 (0.0%) |
| 35 to 44 Years | 41 (100.0%) | 0 (0.0%) |
| 45 to 54 Years | 70 (43.5%) | 0 (0.0%) |
| 55 to 59 Years | 46 (100.0%) | 0 (0.0%) |
| 60 to 64 Years | 37 (64.9%) | 0 (0.0%) |
| 65 to 74 Years | 17 (9.8%) | 0 (0.0%) |
| 75 Years and over | 20 (10.1%) | 0 (0.0%) |
| Total | 302 (36.6%) | 0 (0.0%) |
Employment Status by Educational Attainment in Carlsborg
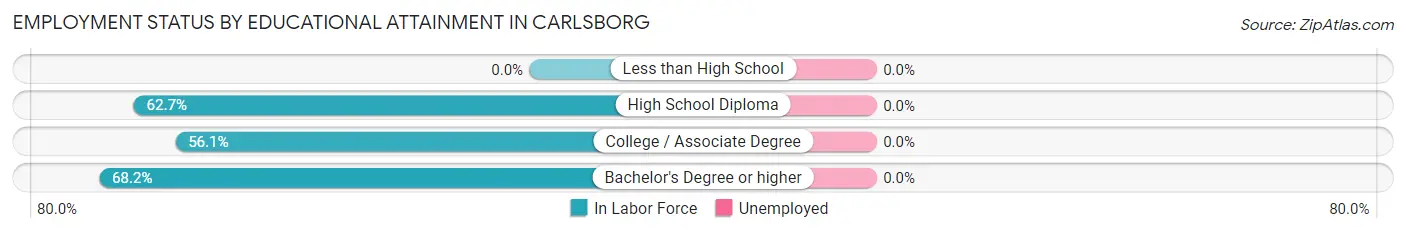
| Educational Attainment | In Labor Force | Unemployed |
| Less than High School | 0 (0.0%) | 0 (0.0%) |
| High School Diploma | 52 (62.7%) | 0 (0.0%) |
| College / Associate Degree | 183 (56.1%) | 0 (0.0%) |
| Bachelor's Degree or higher | 30 (68.2%) | 0 (0.0%) |
| Total | 265 (58.5%) | 0 (0.0%) |
Employment Occupations by Sex in Carlsborg
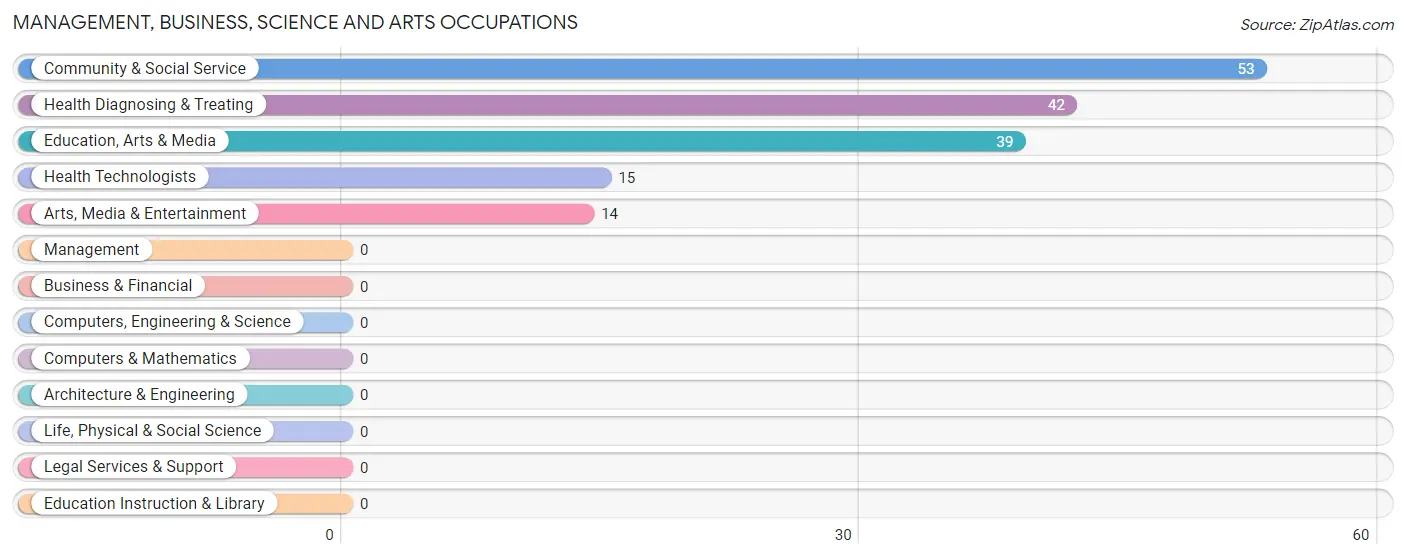
Management, Business, Science and Arts Occupations
The most common Management, Business, Science and Arts occupations in Carlsborg are Community & Social Service (53 | 17.5%), Health Diagnosing & Treating (42 | 13.9%), Education, Arts & Media (39 | 12.9%), Health Technologists (15 | 5.0%), and Arts, Media & Entertainment (14 | 4.6%).
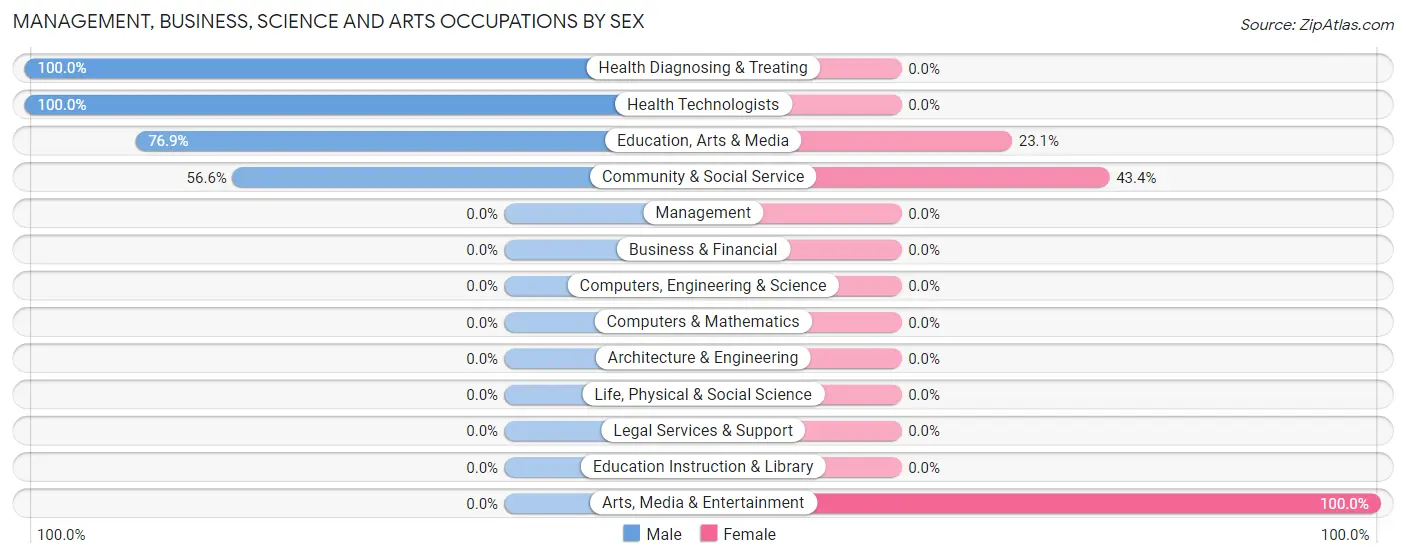
Management, Business, Science and Arts Occupations by Sex
Within the Management, Business, Science and Arts occupations in Carlsborg, the most male-oriented occupations are Health Diagnosing & Treating (100.0%), Health Technologists (100.0%), and Education, Arts & Media (76.9%), while the most female-oriented occupations are Arts, Media & Entertainment (100.0%), Community & Social Service (43.4%), and Education, Arts & Media (23.1%).
| Occupation | Male | Female |
| Management | 0 (0.0%) | 0 (0.0%) |
| Business & Financial | 0 (0.0%) | 0 (0.0%) |
| Computers, Engineering & Science | 0 (0.0%) | 0 (0.0%) |
| Computers & Mathematics | 0 (0.0%) | 0 (0.0%) |
| Architecture & Engineering | 0 (0.0%) | 0 (0.0%) |
| Life, Physical & Social Science | 0 (0.0%) | 0 (0.0%) |
| Community & Social Service | 30 (56.6%) | 23 (43.4%) |
| Education, Arts & Media | 30 (76.9%) | 9 (23.1%) |
| Legal Services & Support | 0 (0.0%) | 0 (0.0%) |
| Education Instruction & Library | 0 (0.0%) | 0 (0.0%) |
| Arts, Media & Entertainment | 0 (0.0%) | 14 (100.0%) |
| Health Diagnosing & Treating | 42 (100.0%) | 0 (0.0%) |
| Health Technologists | 15 (100.0%) | 0 (0.0%) |
| Total (Category) | 72 (75.8%) | 23 (24.2%) |
| Total (Overall) | 195 (64.6%) | 107 (35.4%) |
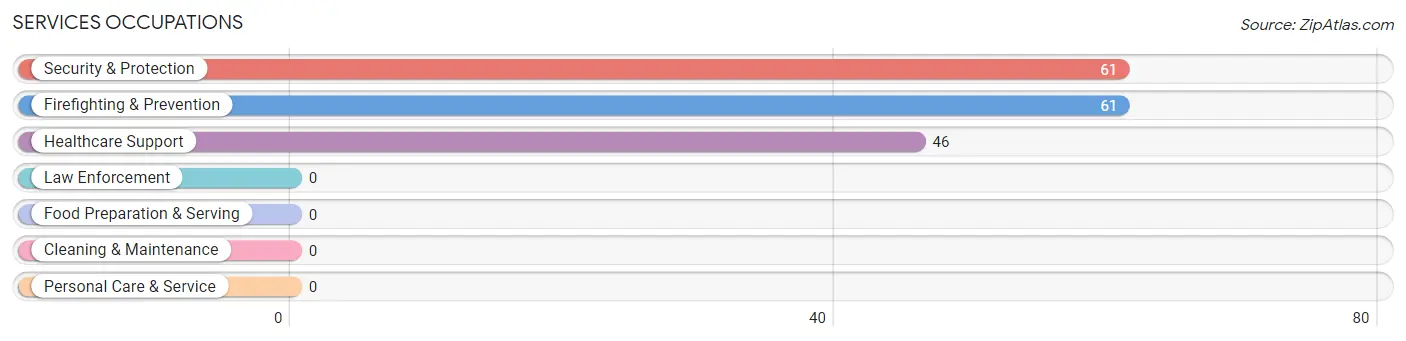
Services Occupations
The most common Services occupations in Carlsborg are Security & Protection (61 | 20.2%), Firefighting & Prevention (61 | 20.2%), and Healthcare Support (46 | 15.2%).
Services Occupations by Sex
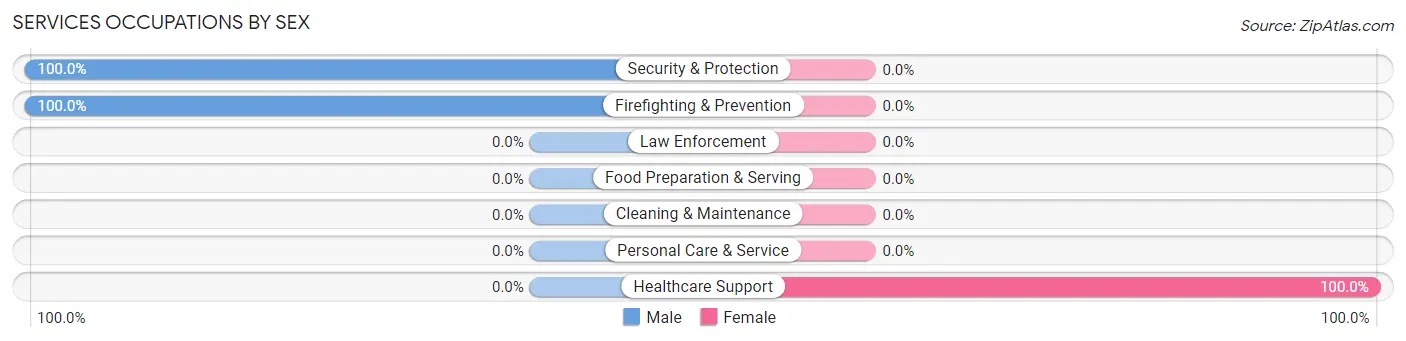
| Occupation | Male | Female |
| Healthcare Support | 0 (0.0%) | 46 (100.0%) |
| Security & Protection | 61 (100.0%) | 0 (0.0%) |
| Firefighting & Prevention | 61 (100.0%) | 0 (0.0%) |
| Law Enforcement | 0 (0.0%) | 0 (0.0%) |
| Food Preparation & Serving | 0 (0.0%) | 0 (0.0%) |
| Cleaning & Maintenance | 0 (0.0%) | 0 (0.0%) |
| Personal Care & Service | 0 (0.0%) | 0 (0.0%) |
| Total (Category) | 61 (57.0%) | 46 (43.0%) |
| Total (Overall) | 195 (64.6%) | 107 (35.4%) |
Sales and Office Occupations
The most common Sales and Office occupations in Carlsborg are Office & Administration (41 | 13.6%), and Sales & Related (30 | 9.9%).
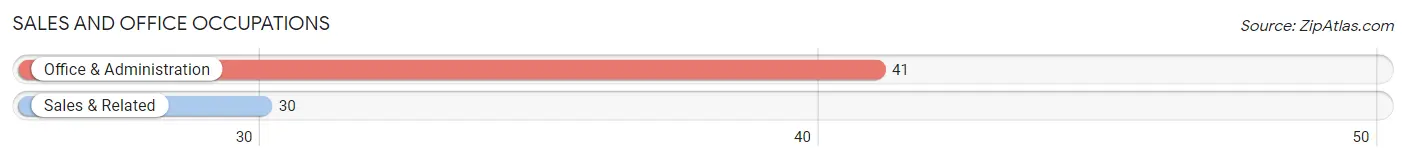
Sales and Office Occupations by Sex
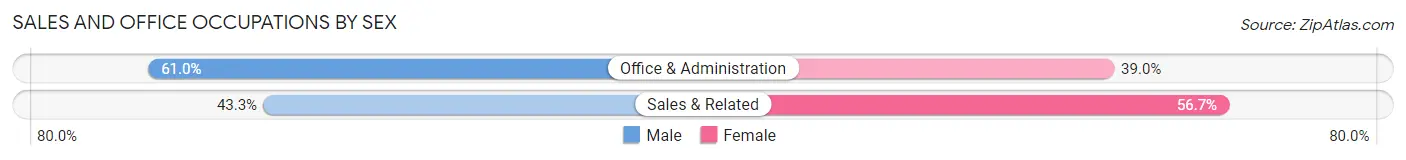
| Occupation | Male | Female |
| Sales & Related | 13 (43.3%) | 17 (56.7%) |
| Office & Administration | 25 (61.0%) | 16 (39.0%) |
| Total (Category) | 38 (53.5%) | 33 (46.5%) |
| Total (Overall) | 195 (64.6%) | 107 (35.4%) |
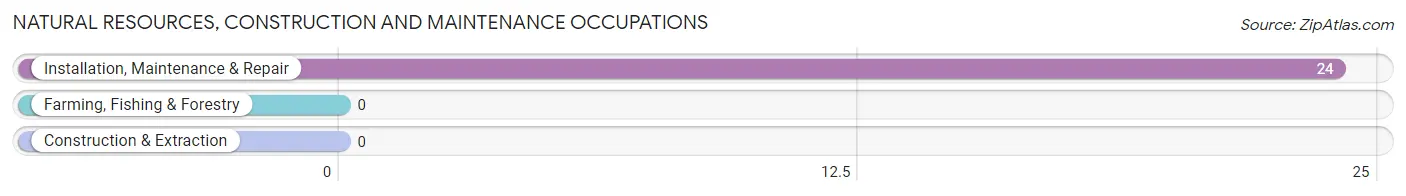
Natural Resources, Construction and Maintenance Occupations
The most common Natural Resources, Construction and Maintenance occupations in Carlsborg are , and Installation, Maintenance & Repair (24 | 8.0%).
Natural Resources, Construction and Maintenance Occupations by Sex
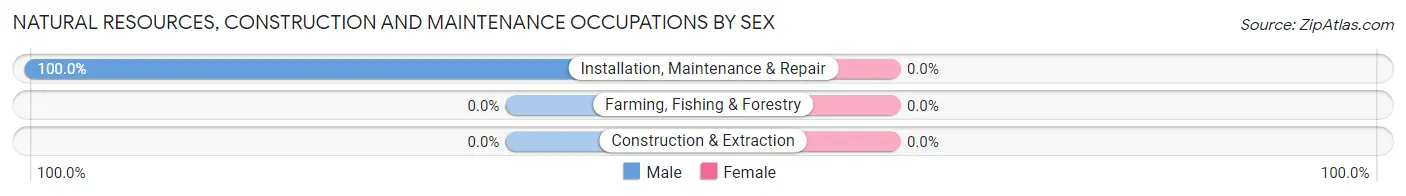
| Occupation | Male | Female |
| Farming, Fishing & Forestry | 0 (0.0%) | 0 (0.0%) |
| Construction & Extraction | 0 (0.0%) | 0 (0.0%) |
| Installation, Maintenance & Repair | 24 (100.0%) | 0 (0.0%) |
| Total (Category) | 24 (100.0%) | 0 (0.0%) |
| Total (Overall) | 195 (64.6%) | 107 (35.4%) |
Production, Transportation and Moving Occupations
The most common Production, Transportation and Moving occupations in Carlsborg are , and Transportation (5 | 1.7%).
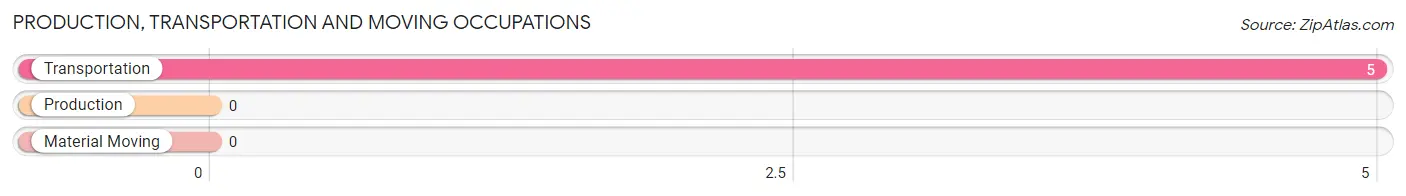
Production, Transportation and Moving Occupations by Sex
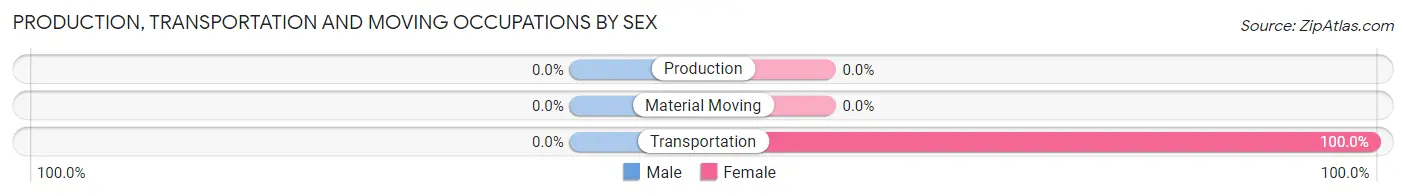
| Occupation | Male | Female |
| Production | 0 (0.0%) | 0 (0.0%) |
| Transportation | 0 (0.0%) | 5 (100.0%) |
| Material Moving | 0 (0.0%) | 0 (0.0%) |
| Total (Category) | 0 (0.0%) | 5 (100.0%) |
| Total (Overall) | 195 (64.6%) | 107 (35.4%) |
Employment Industries by Sex in Carlsborg
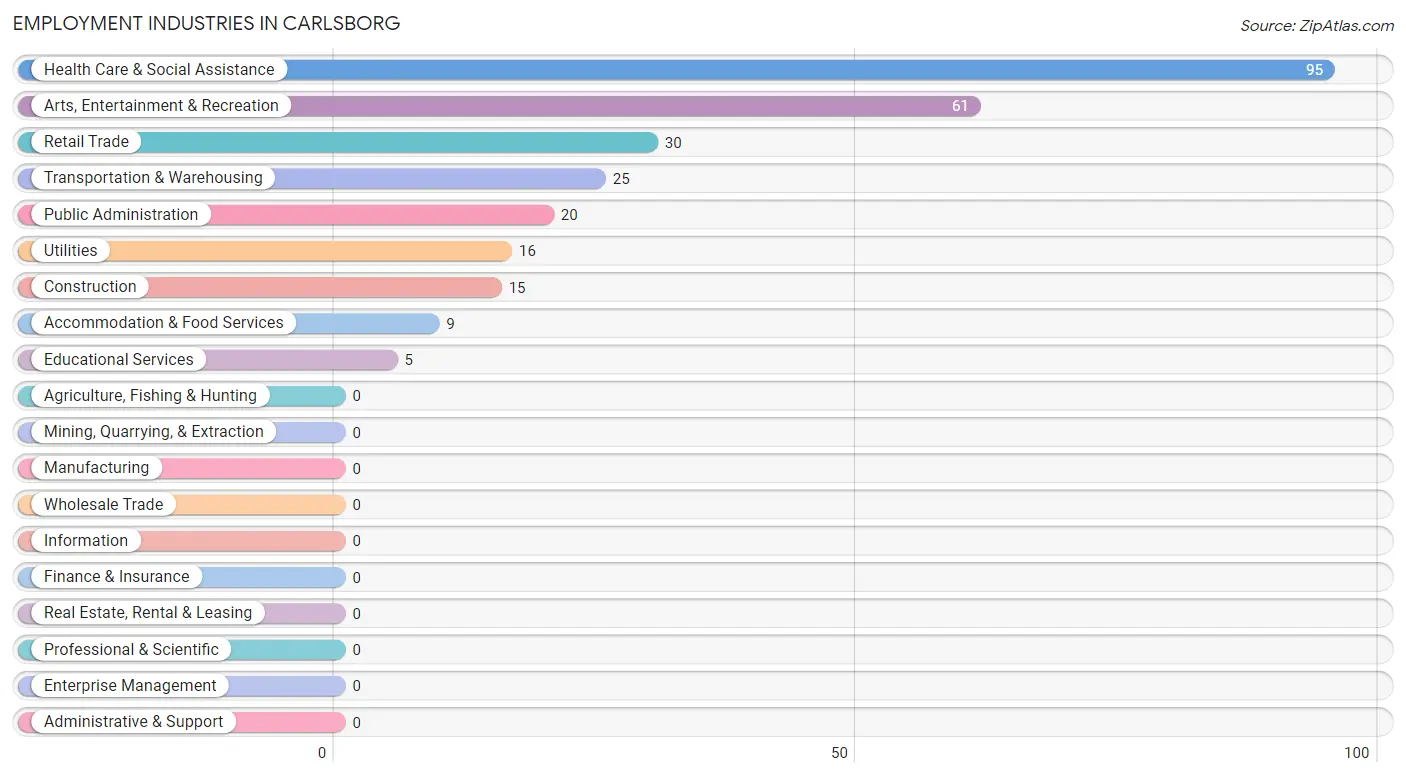
Employment Industries in Carlsborg
The major employment industries in Carlsborg include Health Care & Social Assistance (95 | 31.5%), Arts, Entertainment & Recreation (61 | 20.2%), Retail Trade (30 | 9.9%), Transportation & Warehousing (25 | 8.3%), and Public Administration (20 | 6.6%).
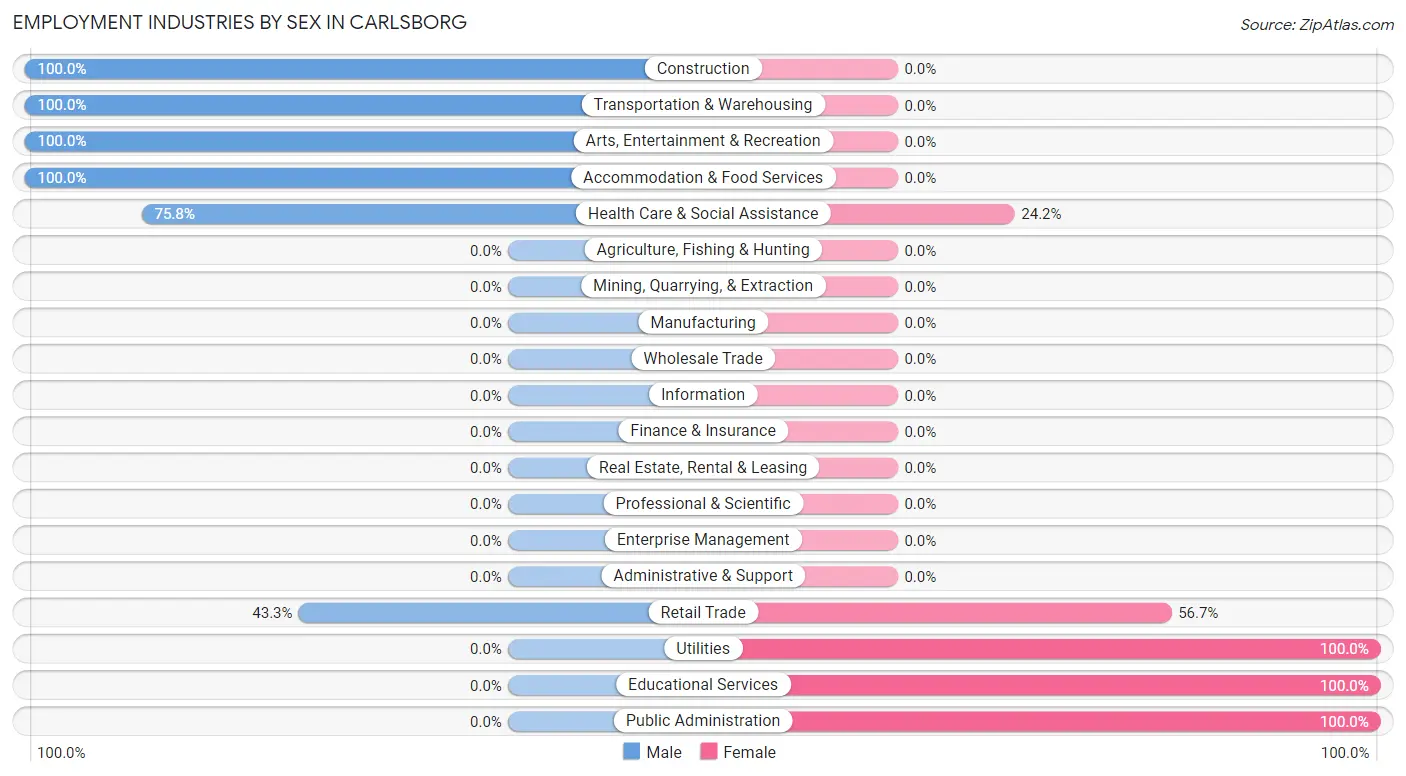
Employment Industries by Sex in Carlsborg
The Carlsborg industries that see more men than women are Construction (100.0%), Transportation & Warehousing (100.0%), and Arts, Entertainment & Recreation (100.0%), whereas the industries that tend to have a higher number of women are Utilities (100.0%), Educational Services (100.0%), and Public Administration (100.0%).
| Industry | Male | Female |
| Agriculture, Fishing & Hunting | 0 (0.0%) | 0 (0.0%) |
| Mining, Quarrying, & Extraction | 0 (0.0%) | 0 (0.0%) |
| Construction | 15 (100.0%) | 0 (0.0%) |
| Manufacturing | 0 (0.0%) | 0 (0.0%) |
| Wholesale Trade | 0 (0.0%) | 0 (0.0%) |
| Retail Trade | 13 (43.3%) | 17 (56.7%) |
| Transportation & Warehousing | 25 (100.0%) | 0 (0.0%) |
| Utilities | 0 (0.0%) | 16 (100.0%) |
| Information | 0 (0.0%) | 0 (0.0%) |
| Finance & Insurance | 0 (0.0%) | 0 (0.0%) |
| Real Estate, Rental & Leasing | 0 (0.0%) | 0 (0.0%) |
| Professional & Scientific | 0 (0.0%) | 0 (0.0%) |
| Enterprise Management | 0 (0.0%) | 0 (0.0%) |
| Administrative & Support | 0 (0.0%) | 0 (0.0%) |
| Educational Services | 0 (0.0%) | 5 (100.0%) |
| Health Care & Social Assistance | 72 (75.8%) | 23 (24.2%) |
| Arts, Entertainment & Recreation | 61 (100.0%) | 0 (0.0%) |
| Accommodation & Food Services | 9 (100.0%) | 0 (0.0%) |
| Public Administration | 0 (0.0%) | 20 (100.0%) |
| Total | 195 (64.6%) | 107 (35.4%) |
Education in Carlsborg
School Enrollment in Carlsborg
The most common levels of schooling among the 102 students in Carlsborg are elementary school (59 | 57.8%), middle school (18 | 17.6%), and graduate / professional (14 | 13.7%).
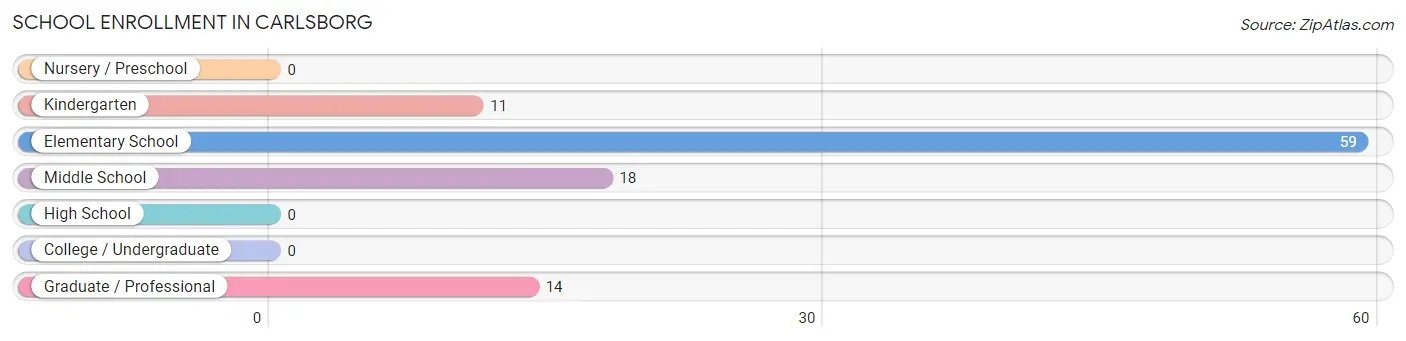
| School Level | # Students | % Students |
| Nursery / Preschool | 0 | 0.0% |
| Kindergarten | 11 | 10.8% |
| Elementary School | 59 | 57.8% |
| Middle School | 18 | 17.6% |
| High School | 0 | 0.0% |
| College / Undergraduate | 0 | 0.0% |
| Graduate / Professional | 14 | 13.7% |
| Total | 102 | 100.0% |
School Enrollment by Age by Funding Source in Carlsborg
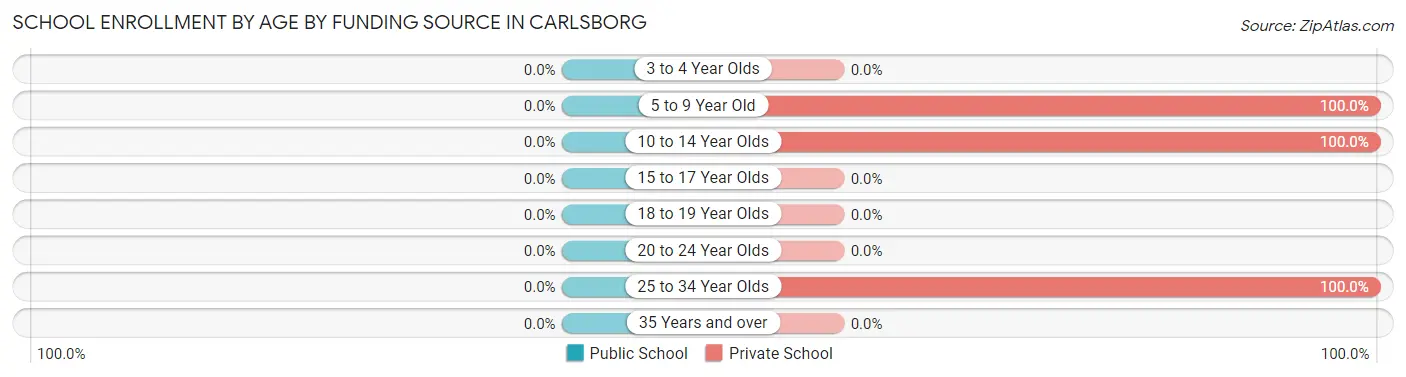
| Age Bracket | Public School | Private School |
| 3 to 4 Year Olds | 0 (0.0%) | 0 (0.0%) |
| 5 to 9 Year Old | 0 (0.0%) | 70 (100.0%) |
| 10 to 14 Year Olds | 0 (0.0%) | 18 (100.0%) |
| 15 to 17 Year Olds | 0 (0.0%) | 0 (0.0%) |
| 18 to 19 Year Olds | 0 (0.0%) | 0 (0.0%) |
| 20 to 24 Year Olds | 0 (0.0%) | 0 (0.0%) |
| 25 to 34 Year Olds | 0 (0.0%) | 14 (100.0%) |
| 35 Years and over | 0 (0.0%) | 0 (0.0%) |
| Total | 0 (0.0%) | 102 (100.0%) |
Educational Attainment by Field of Study in Carlsborg
Arts & humanities (31 | 19.6%), social sciences (29 | 18.3%), literature & languages (20 | 12.7%), science & technology (15 | 9.5%), and psychology (14 | 8.9%) are the most common fields of study among 158 individuals in Carlsborg who have obtained a bachelor's degree or higher.
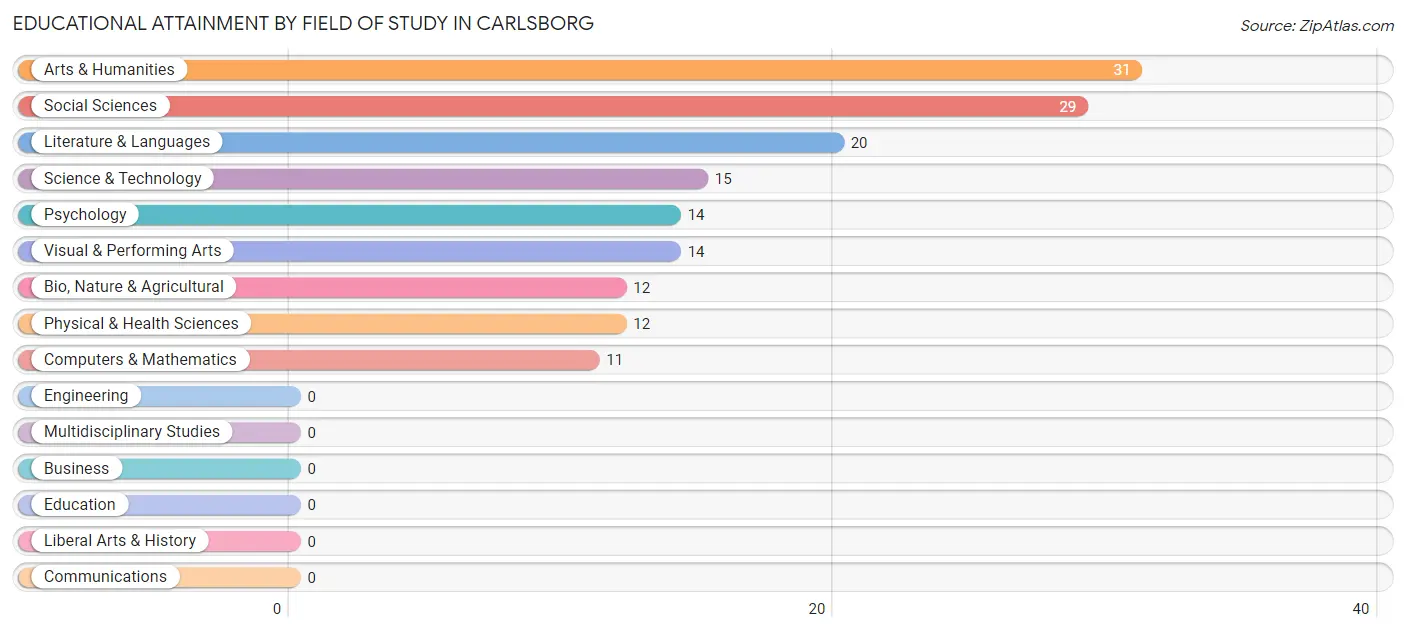
| Field of Study | # Graduates | % Graduates |
| Computers & Mathematics | 11 | 7.0% |
| Bio, Nature & Agricultural | 12 | 7.6% |
| Physical & Health Sciences | 12 | 7.6% |
| Psychology | 14 | 8.9% |
| Social Sciences | 29 | 18.3% |
| Engineering | 0 | 0.0% |
| Multidisciplinary Studies | 0 | 0.0% |
| Science & Technology | 15 | 9.5% |
| Business | 0 | 0.0% |
| Education | 0 | 0.0% |
| Literature & Languages | 20 | 12.7% |
| Liberal Arts & History | 0 | 0.0% |
| Visual & Performing Arts | 14 | 8.9% |
| Communications | 0 | 0.0% |
| Arts & Humanities | 31 | 19.6% |
| Total | 158 | 100.0% |
Transportation & Commute in Carlsborg
Vehicle Availability by Sex in Carlsborg
The most prevalent vehicle ownership categories in Carlsborg are males with 2 vehicles (72, accounting for 36.9%) and females with 2 vehicles (19, making up 67.3%).
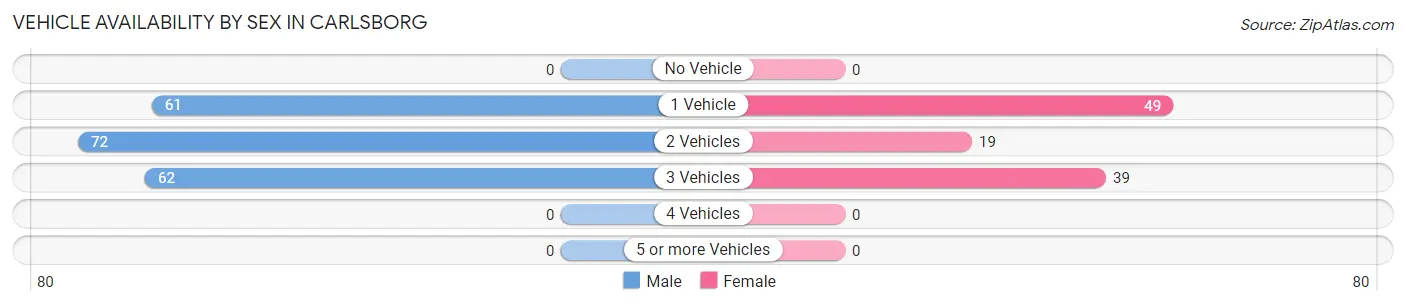
| Vehicles Available | Male | Female |
| No Vehicle | 0 (0.0%) | 0 (0.0%) |
| 1 Vehicle | 61 (31.3%) | 49 (45.8%) |
| 2 Vehicles | 72 (36.9%) | 19 (17.8%) |
| 3 Vehicles | 62 (31.8%) | 39 (36.4%) |
| 4 Vehicles | 0 (0.0%) | 0 (0.0%) |
| 5 or more Vehicles | 0 (0.0%) | 0 (0.0%) |
| Total | 195 (100.0%) | 107 (100.0%) |
Commute Time in Carlsborg
The most frequently occuring commute durations in Carlsborg are 15 to 19 minutes (135 commuters, 47.9%), 10 to 14 minutes (74 commuters, 26.2%), and 45 to 59 minutes (25 commuters, 8.9%).
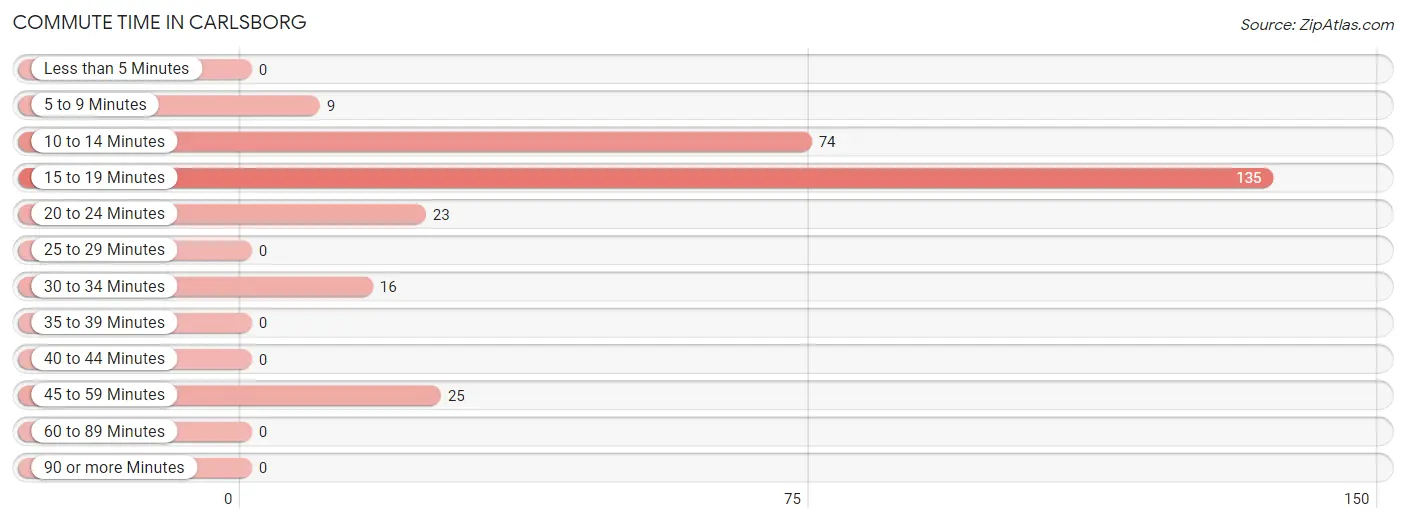
| Commute Time | # Commuters | % Commuters |
| Less than 5 Minutes | 0 | 0.0% |
| 5 to 9 Minutes | 9 | 3.2% |
| 10 to 14 Minutes | 74 | 26.2% |
| 15 to 19 Minutes | 135 | 47.9% |
| 20 to 24 Minutes | 23 | 8.2% |
| 25 to 29 Minutes | 0 | 0.0% |
| 30 to 34 Minutes | 16 | 5.7% |
| 35 to 39 Minutes | 0 | 0.0% |
| 40 to 44 Minutes | 0 | 0.0% |
| 45 to 59 Minutes | 25 | 8.9% |
| 60 to 89 Minutes | 0 | 0.0% |
| 90 or more Minutes | 0 | 0.0% |
Commute Time by Sex in Carlsborg
The most common commute times in Carlsborg are 15 to 19 minutes (104 commuters, 53.3%) for males and 15 to 19 minutes (31 commuters, 35.6%) for females.
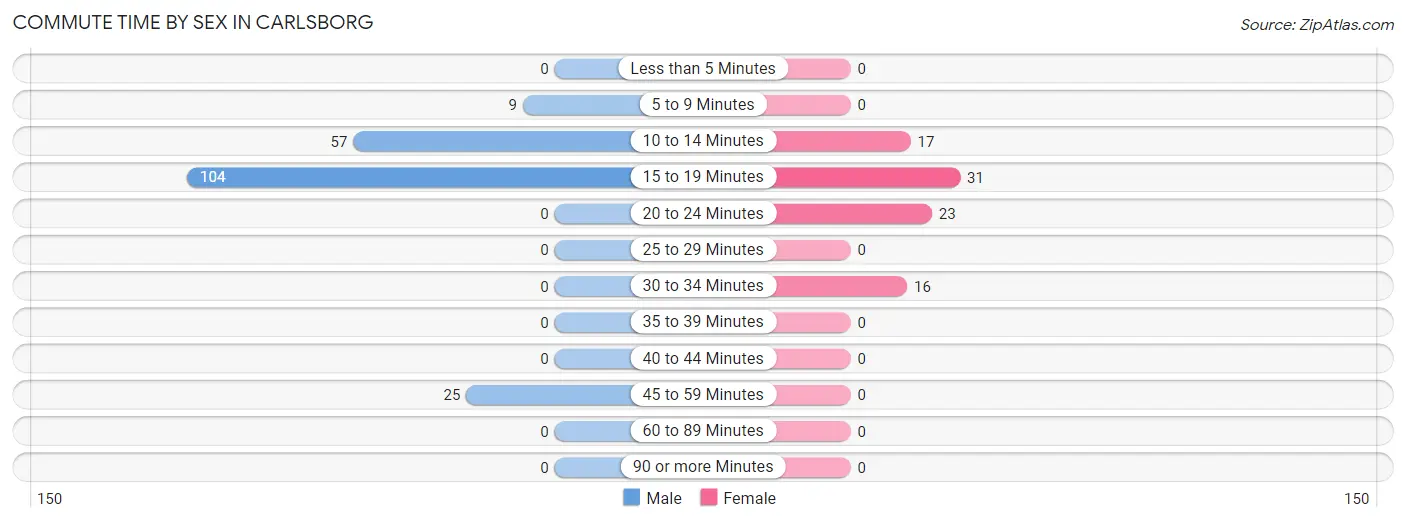
| Commute Time | Male | Female |
| Less than 5 Minutes | 0 (0.0%) | 0 (0.0%) |
| 5 to 9 Minutes | 9 (4.6%) | 0 (0.0%) |
| 10 to 14 Minutes | 57 (29.2%) | 17 (19.5%) |
| 15 to 19 Minutes | 104 (53.3%) | 31 (35.6%) |
| 20 to 24 Minutes | 0 (0.0%) | 23 (26.4%) |
| 25 to 29 Minutes | 0 (0.0%) | 0 (0.0%) |
| 30 to 34 Minutes | 0 (0.0%) | 16 (18.4%) |
| 35 to 39 Minutes | 0 (0.0%) | 0 (0.0%) |
| 40 to 44 Minutes | 0 (0.0%) | 0 (0.0%) |
| 45 to 59 Minutes | 25 (12.8%) | 0 (0.0%) |
| 60 to 89 Minutes | 0 (0.0%) | 0 (0.0%) |
| 90 or more Minutes | 0 (0.0%) | 0 (0.0%) |
Time of Departure to Work by Sex in Carlsborg
The most frequent times of departure to work in Carlsborg are 4:00 PM to 11:59 PM (61, 31.3%) for males and 12:00 PM to 3:59 PM (17, 19.5%) for females.
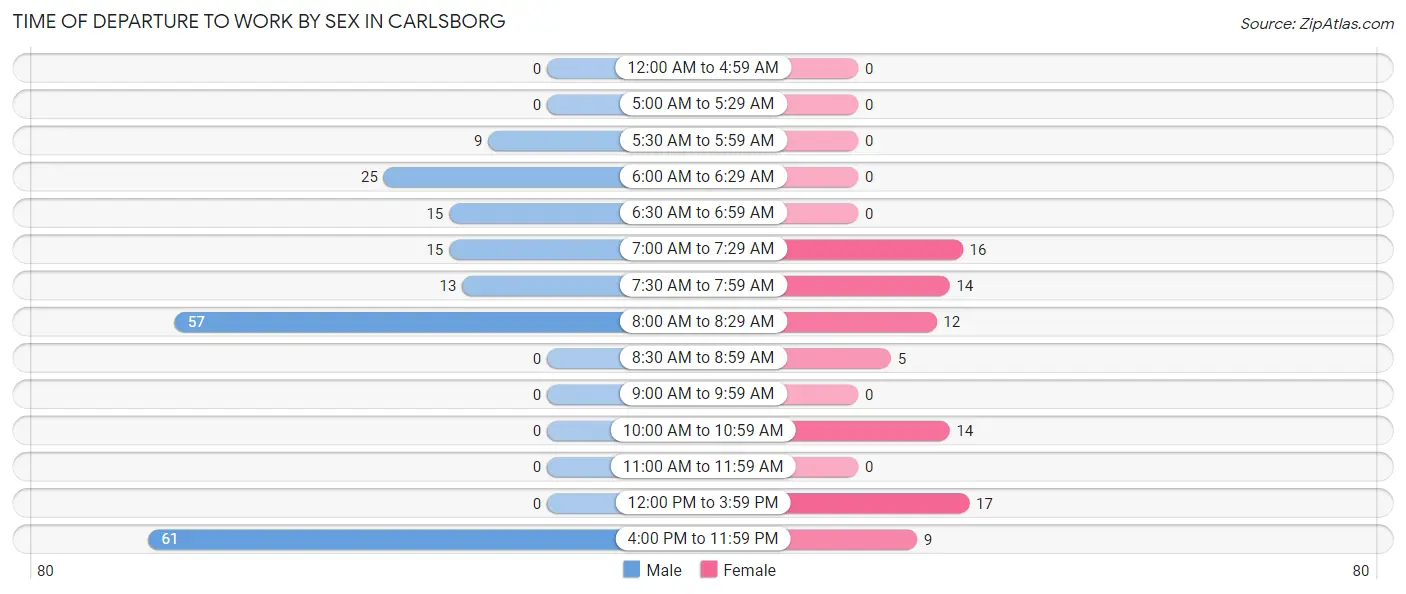
| Time of Departure | Male | Female |
| 12:00 AM to 4:59 AM | 0 (0.0%) | 0 (0.0%) |
| 5:00 AM to 5:29 AM | 0 (0.0%) | 0 (0.0%) |
| 5:30 AM to 5:59 AM | 9 (4.6%) | 0 (0.0%) |
| 6:00 AM to 6:29 AM | 25 (12.8%) | 0 (0.0%) |
| 6:30 AM to 6:59 AM | 15 (7.7%) | 0 (0.0%) |
| 7:00 AM to 7:29 AM | 15 (7.7%) | 16 (18.4%) |
| 7:30 AM to 7:59 AM | 13 (6.7%) | 14 (16.1%) |
| 8:00 AM to 8:29 AM | 57 (29.2%) | 12 (13.8%) |
| 8:30 AM to 8:59 AM | 0 (0.0%) | 5 (5.8%) |
| 9:00 AM to 9:59 AM | 0 (0.0%) | 0 (0.0%) |
| 10:00 AM to 10:59 AM | 0 (0.0%) | 14 (16.1%) |
| 11:00 AM to 11:59 AM | 0 (0.0%) | 0 (0.0%) |
| 12:00 PM to 3:59 PM | 0 (0.0%) | 17 (19.5%) |
| 4:00 PM to 11:59 PM | 61 (31.3%) | 9 (10.3%) |
| Total | 195 (100.0%) | 87 (100.0%) |
Housing Occupancy in Carlsborg
Occupancy by Ownership in Carlsborg
Of the total 512 dwellings in Carlsborg, owner-occupied units account for 398 (77.7%), while renter-occupied units make up 114 (22.3%).
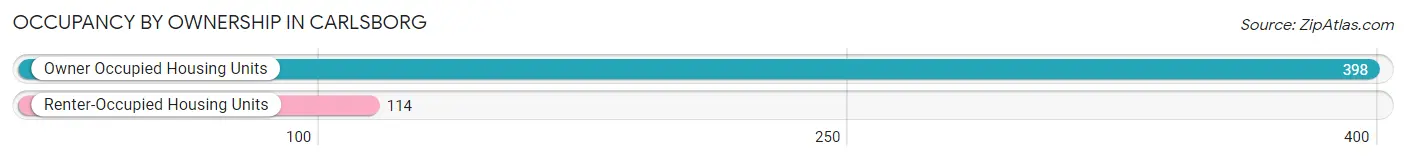
| Occupancy | # Housing Units | % Housing Units |
| Owner Occupied Housing Units | 398 | 77.7% |
| Renter-Occupied Housing Units | 114 | 22.3% |
| Total Occupied Housing Units | 512 | 100.0% |
Occupancy by Household Size in Carlsborg
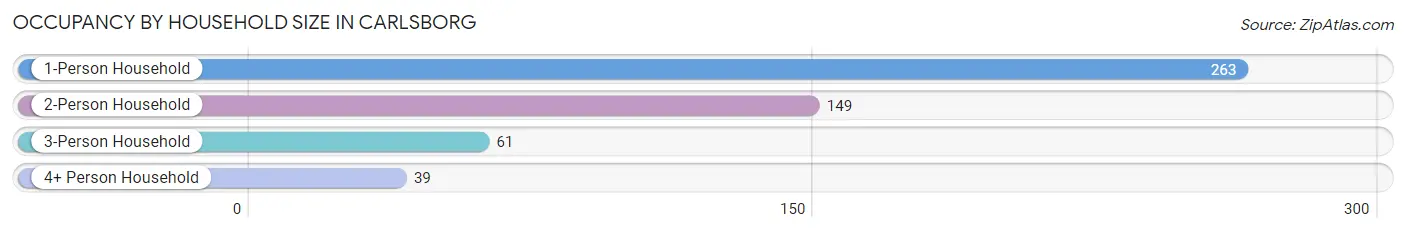
| Household Size | # Housing Units | % Housing Units |
| 1-Person Household | 263 | 51.4% |
| 2-Person Household | 149 | 29.1% |
| 3-Person Household | 61 | 11.9% |
| 4+ Person Household | 39 | 7.6% |
| Total Housing Units | 512 | 100.0% |
Occupancy by Ownership by Household Size in Carlsborg
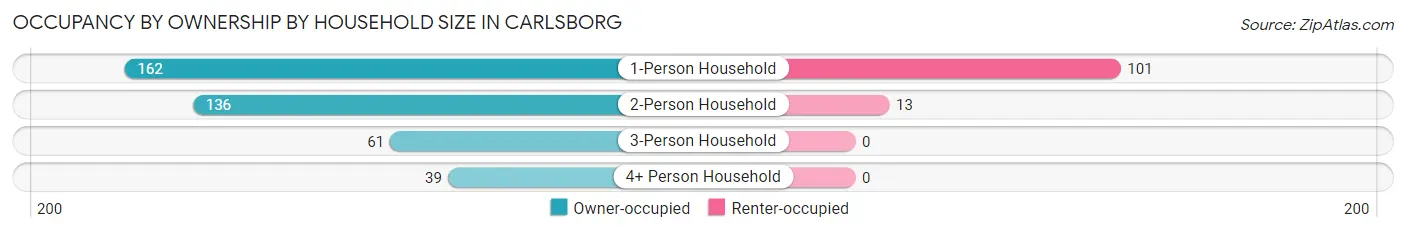
| Household Size | Owner-occupied | Renter-occupied |
| 1-Person Household | 162 (61.6%) | 101 (38.4%) |
| 2-Person Household | 136 (91.3%) | 13 (8.7%) |
| 3-Person Household | 61 (100.0%) | 0 (0.0%) |
| 4+ Person Household | 39 (100.0%) | 0 (0.0%) |
| Total Housing Units | 398 (77.7%) | 114 (22.3%) |
Occupancy by Educational Attainment in Carlsborg
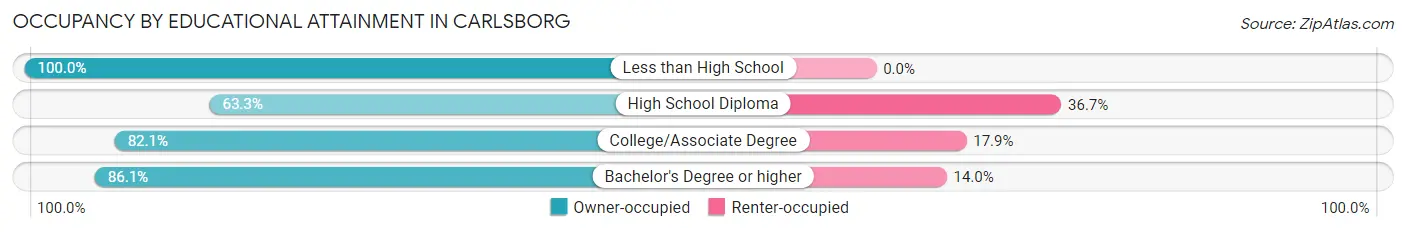
| Household Size | Owner-occupied | Renter-occupied |
| Less than High School | 13 (100.0%) | 0 (0.0%) |
| High School Diploma | 95 (63.3%) | 55 (36.7%) |
| College/Associate Degree | 216 (82.1%) | 47 (17.9%) |
| Bachelor's Degree or higher | 74 (86.1%) | 12 (14.0%) |
Occupancy by Age of Householder in Carlsborg
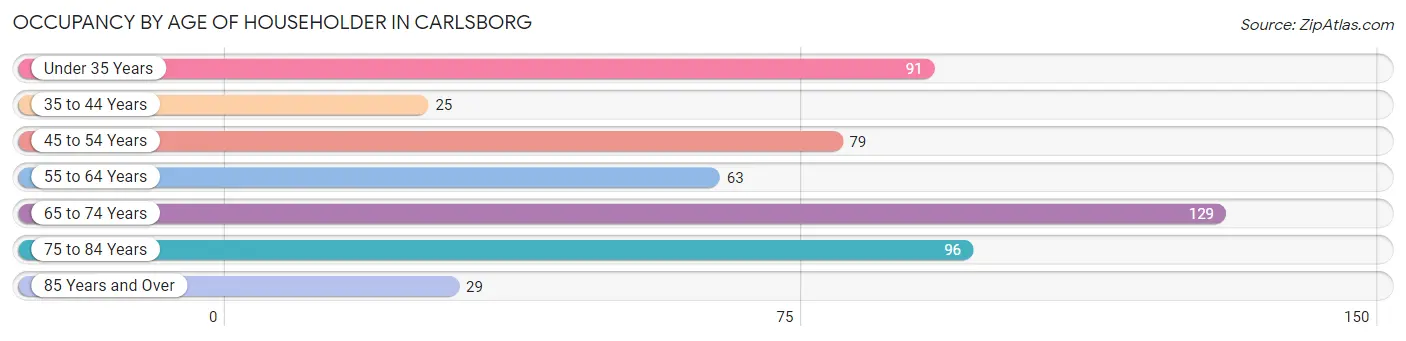
| Age Bracket | # Households | % Households |
| Under 35 Years | 91 | 17.8% |
| 35 to 44 Years | 25 | 4.9% |
| 45 to 54 Years | 79 | 15.4% |
| 55 to 64 Years | 63 | 12.3% |
| 65 to 74 Years | 129 | 25.2% |
| 75 to 84 Years | 96 | 18.8% |
| 85 Years and Over | 29 | 5.7% |
| Total | 512 | 100.0% |
Housing Finances in Carlsborg
Median Income by Occupancy in Carlsborg
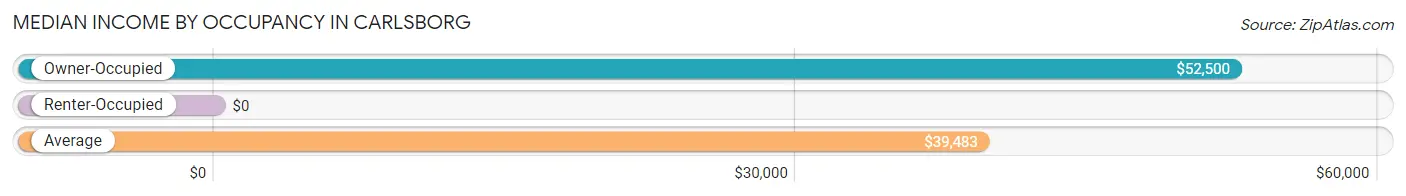
| Occupancy Type | # Households | Median Income |
| Owner-Occupied | 398 (77.7%) | $52,500 |
| Renter-Occupied | 114 (22.3%) | $0 |
| Average | 512 (100.0%) | $39,483 |
Occupancy by Householder Income Bracket in Carlsborg
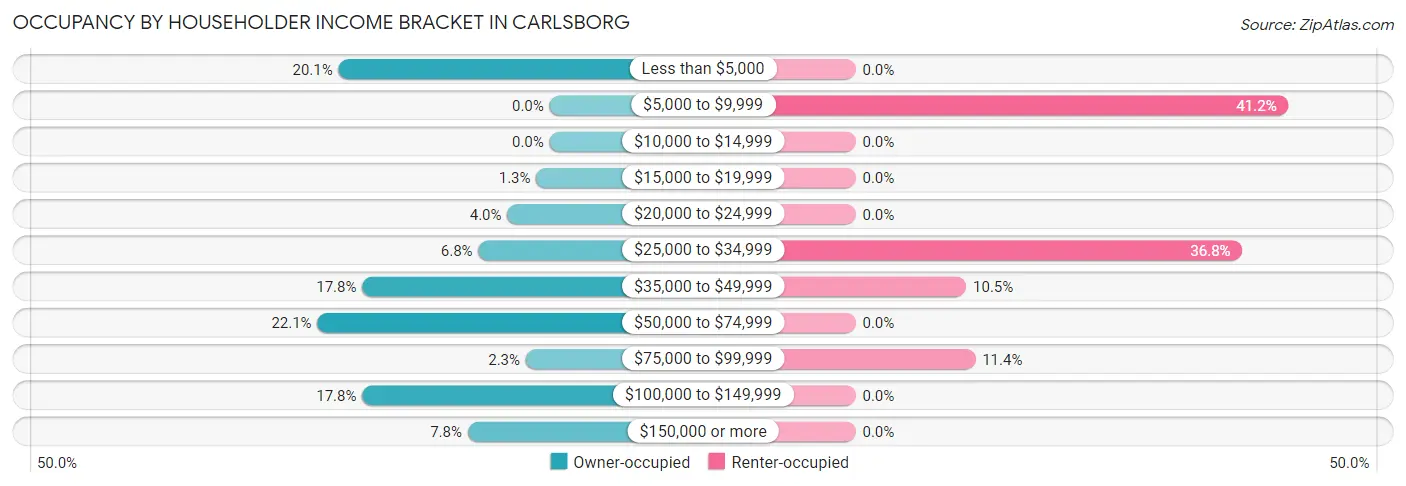
| Income Bracket | Owner-occupied | Renter-occupied |
| Less than $5,000 | 80 (20.1%) | 0 (0.0%) |
| $5,000 to $9,999 | 0 (0.0%) | 47 (41.2%) |
| $10,000 to $14,999 | 0 (0.0%) | 0 (0.0%) |
| $15,000 to $19,999 | 5 (1.3%) | 0 (0.0%) |
| $20,000 to $24,999 | 16 (4.0%) | 0 (0.0%) |
| $25,000 to $34,999 | 27 (6.8%) | 42 (36.8%) |
| $35,000 to $49,999 | 71 (17.8%) | 12 (10.5%) |
| $50,000 to $74,999 | 88 (22.1%) | 0 (0.0%) |
| $75,000 to $99,999 | 9 (2.3%) | 13 (11.4%) |
| $100,000 to $149,999 | 71 (17.8%) | 0 (0.0%) |
| $150,000 or more | 31 (7.8%) | 0 (0.0%) |
| Total | 398 (100.0%) | 114 (100.0%) |
Monthly Housing Cost Tiers in Carlsborg
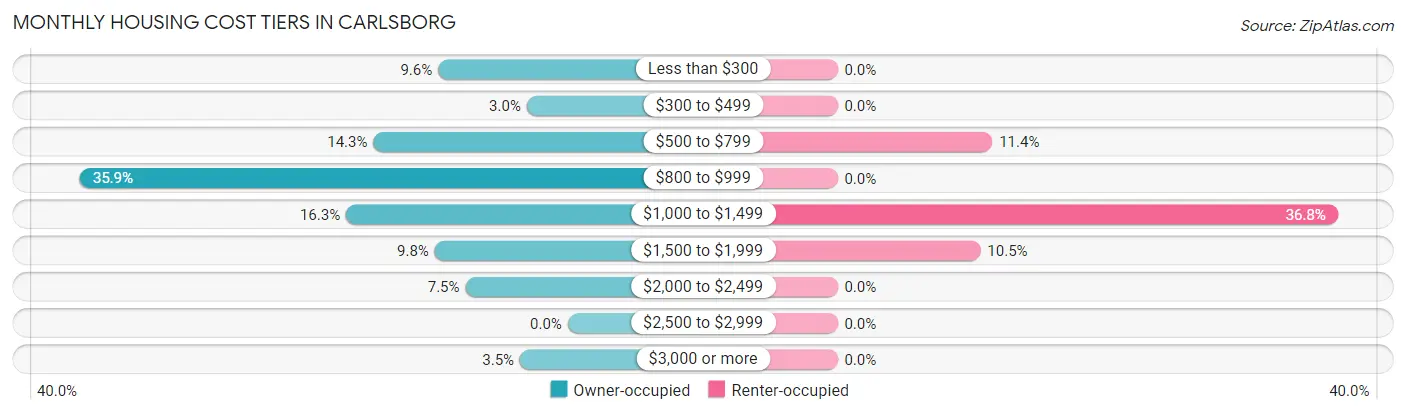
| Monthly Cost | Owner-occupied | Renter-occupied |
| Less than $300 | 38 (9.6%) | 0 (0.0%) |
| $300 to $499 | 12 (3.0%) | 0 (0.0%) |
| $500 to $799 | 57 (14.3%) | 13 (11.4%) |
| $800 to $999 | 143 (35.9%) | 0 (0.0%) |
| $1,000 to $1,499 | 65 (16.3%) | 42 (36.8%) |
| $1,500 to $1,999 | 39 (9.8%) | 12 (10.5%) |
| $2,000 to $2,499 | 30 (7.5%) | 0 (0.0%) |
| $2,500 to $2,999 | 0 (0.0%) | 0 (0.0%) |
| $3,000 or more | 14 (3.5%) | 0 (0.0%) |
| Total | 398 (100.0%) | 114 (100.0%) |
Physical Housing Characteristics in Carlsborg
Housing Structures in Carlsborg
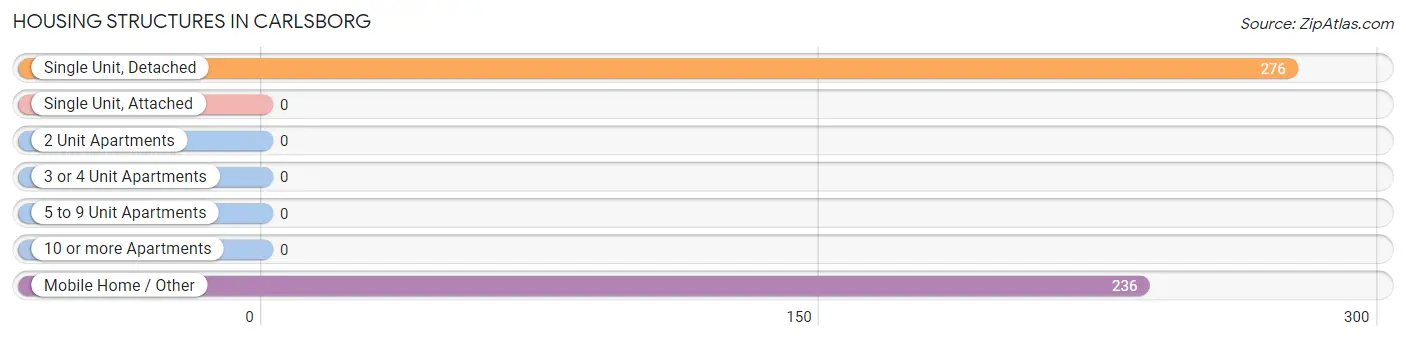
| Structure Type | # Housing Units | % Housing Units |
| Single Unit, Detached | 276 | 53.9% |
| Single Unit, Attached | 0 | 0.0% |
| 2 Unit Apartments | 0 | 0.0% |
| 3 or 4 Unit Apartments | 0 | 0.0% |
| 5 to 9 Unit Apartments | 0 | 0.0% |
| 10 or more Apartments | 0 | 0.0% |
| Mobile Home / Other | 236 | 46.1% |
| Total | 512 | 100.0% |
Housing Structures by Occupancy in Carlsborg
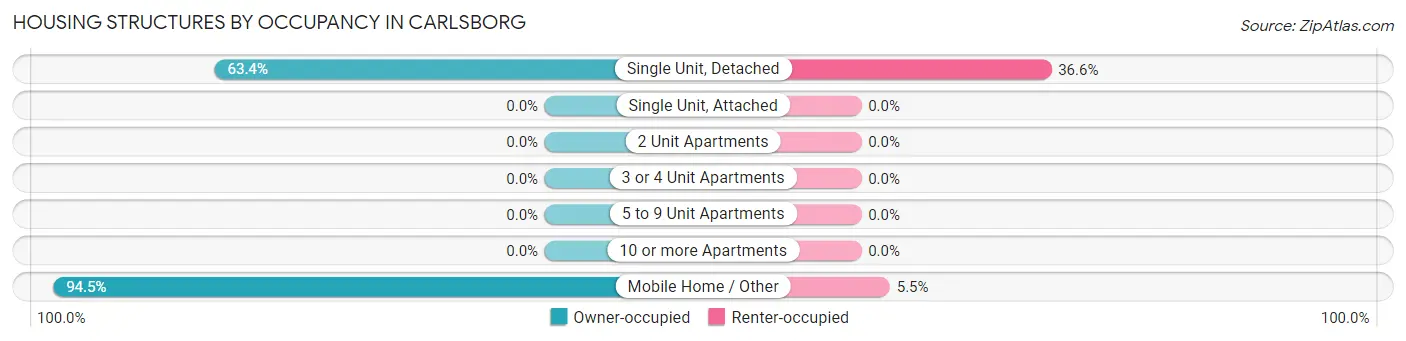
| Structure Type | Owner-occupied | Renter-occupied |
| Single Unit, Detached | 175 (63.4%) | 101 (36.6%) |
| Single Unit, Attached | 0 (0.0%) | 0 (0.0%) |
| 2 Unit Apartments | 0 (0.0%) | 0 (0.0%) |
| 3 or 4 Unit Apartments | 0 (0.0%) | 0 (0.0%) |
| 5 to 9 Unit Apartments | 0 (0.0%) | 0 (0.0%) |
| 10 or more Apartments | 0 (0.0%) | 0 (0.0%) |
| Mobile Home / Other | 223 (94.5%) | 13 (5.5%) |
| Total | 398 (77.7%) | 114 (22.3%) |
Housing Structures by Number of Rooms in Carlsborg
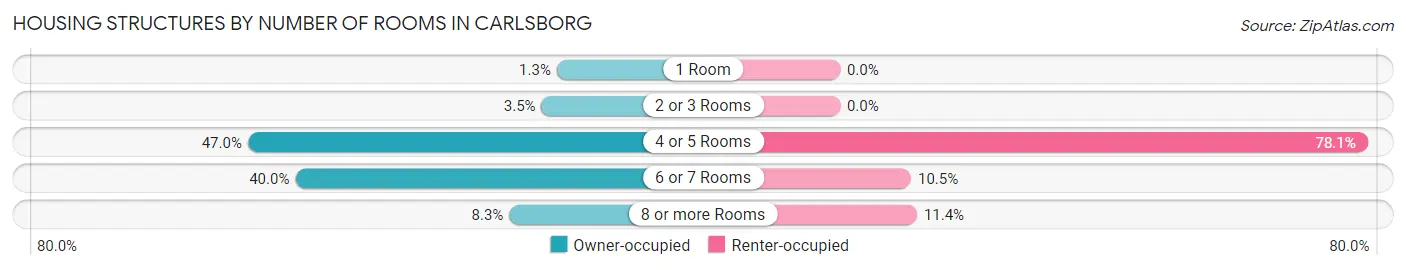
| Number of Rooms | Owner-occupied | Renter-occupied |
| 1 Room | 5 (1.3%) | 0 (0.0%) |
| 2 or 3 Rooms | 14 (3.5%) | 0 (0.0%) |
| 4 or 5 Rooms | 187 (47.0%) | 89 (78.1%) |
| 6 or 7 Rooms | 159 (40.0%) | 12 (10.5%) |
| 8 or more Rooms | 33 (8.3%) | 13 (11.4%) |
| Total | 398 (100.0%) | 114 (100.0%) |
Housing Structure by Heating Type in Carlsborg
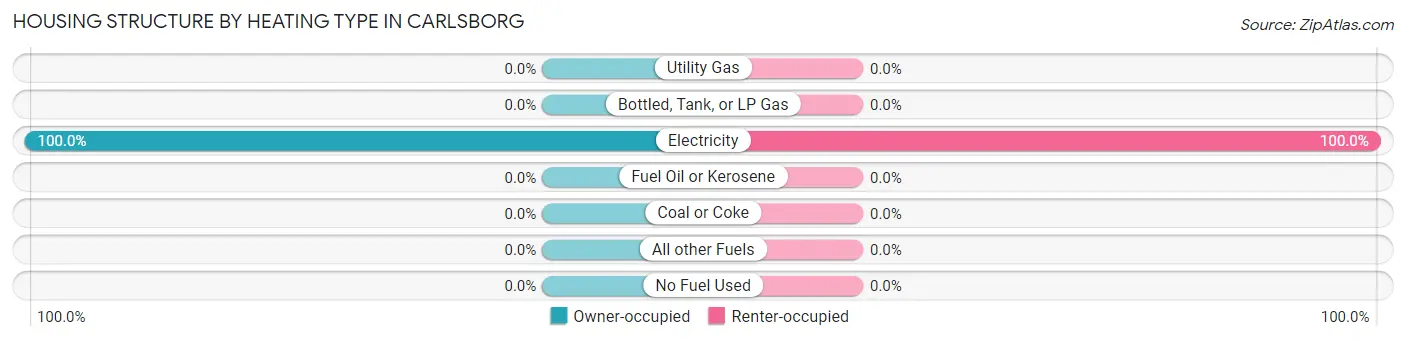
| Heating Type | Owner-occupied | Renter-occupied |
| Utility Gas | 0 (0.0%) | 0 (0.0%) |
| Bottled, Tank, or LP Gas | 0 (0.0%) | 0 (0.0%) |
| Electricity | 398 (100.0%) | 114 (100.0%) |
| Fuel Oil or Kerosene | 0 (0.0%) | 0 (0.0%) |
| Coal or Coke | 0 (0.0%) | 0 (0.0%) |
| All other Fuels | 0 (0.0%) | 0 (0.0%) |
| No Fuel Used | 0 (0.0%) | 0 (0.0%) |
| Total | 398 (100.0%) | 114 (100.0%) |
Household Vehicle Usage in Carlsborg
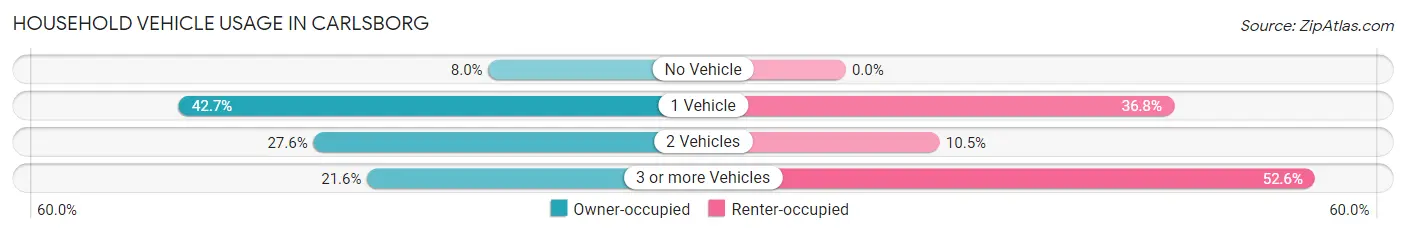
| Vehicles per Household | Owner-occupied | Renter-occupied |
| No Vehicle | 32 (8.0%) | 0 (0.0%) |
| 1 Vehicle | 170 (42.7%) | 42 (36.8%) |
| 2 Vehicles | 110 (27.6%) | 12 (10.5%) |
| 3 or more Vehicles | 86 (21.6%) | 60 (52.6%) |
| Total | 398 (100.0%) | 114 (100.0%) |
Real Estate & Mortgages in Carlsborg
Real Estate and Mortgage Overview in Carlsborg
| Characteristic | Without Mortgage | With Mortgage |
| Housing Units | 246 | 152 |
| Median Property Value | $142,200 | $315,900 |
| Median Household Income | $36,406 | $16 |
| Monthly Housing Costs | $818 | $14 |
| Real Estate Taxes | $989 | $33 |
Property Value by Mortgage Status in Carlsborg
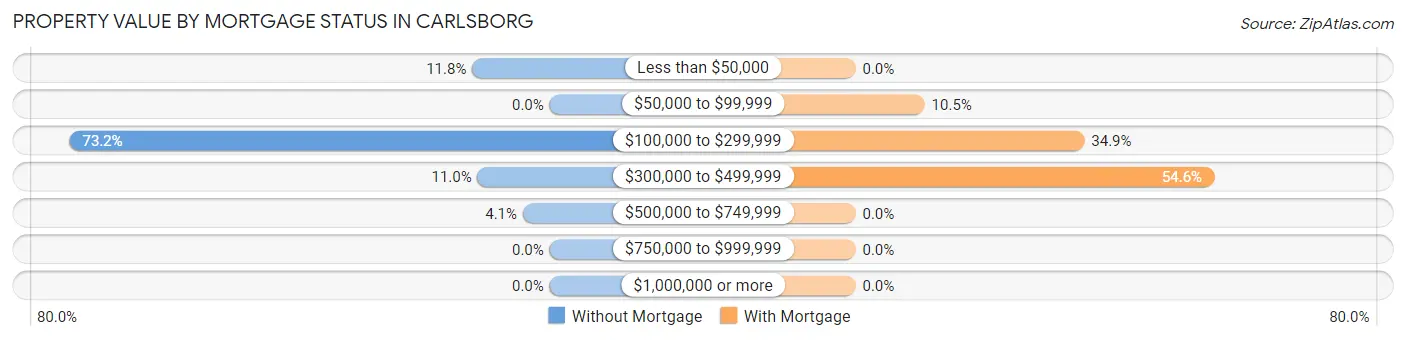
| Property Value | Without Mortgage | With Mortgage |
| Less than $50,000 | 29 (11.8%) | 0 (0.0%) |
| $50,000 to $99,999 | 0 (0.0%) | 16 (10.5%) |
| $100,000 to $299,999 | 180 (73.2%) | 53 (34.9%) |
| $300,000 to $499,999 | 27 (11.0%) | 83 (54.6%) |
| $500,000 to $749,999 | 10 (4.1%) | 0 (0.0%) |
| $750,000 to $999,999 | 0 (0.0%) | 0 (0.0%) |
| $1,000,000 or more | 0 (0.0%) | 0 (0.0%) |
| Total | 246 (100.0%) | 152 (100.0%) |
Household Income by Mortgage Status in Carlsborg
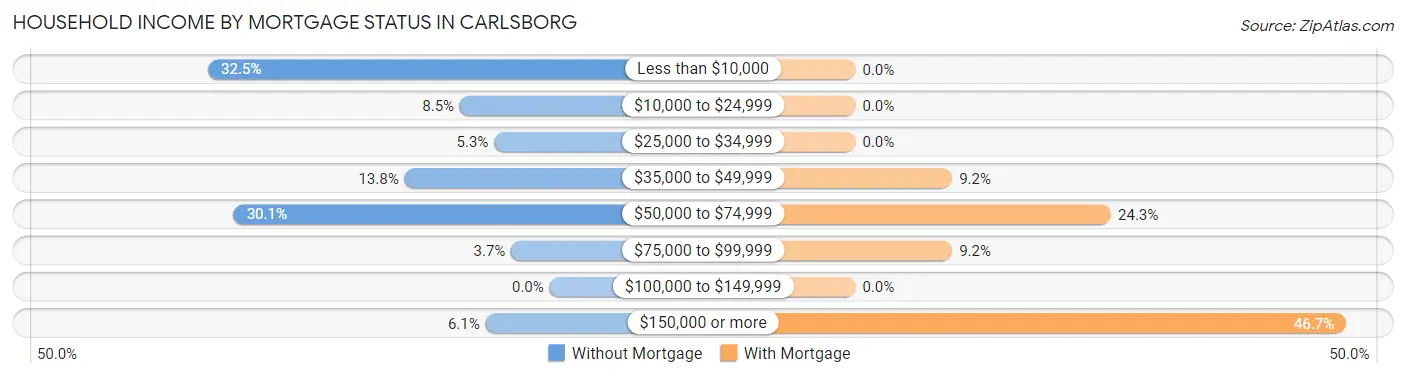
| Household Income | Without Mortgage | With Mortgage |
| Less than $10,000 | 80 (32.5%) | 0 (0.0%) |
| $10,000 to $24,999 | 21 (8.5%) | 0 (0.0%) |
| $25,000 to $34,999 | 13 (5.3%) | 0 (0.0%) |
| $35,000 to $49,999 | 34 (13.8%) | 14 (9.2%) |
| $50,000 to $74,999 | 74 (30.1%) | 37 (24.3%) |
| $75,000 to $99,999 | 9 (3.7%) | 14 (9.2%) |
| $100,000 to $149,999 | 0 (0.0%) | 0 (0.0%) |
| $150,000 or more | 15 (6.1%) | 71 (46.7%) |
| Total | 246 (100.0%) | 152 (100.0%) |
Property Value to Household Income Ratio in Carlsborg
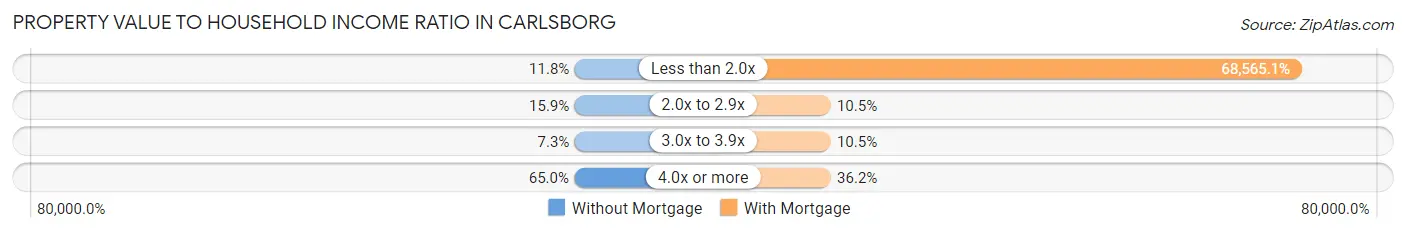
| Value-to-Income Ratio | Without Mortgage | With Mortgage |
| Less than 2.0x | 29 (11.8%) | 104,219 (68,565.1%) |
| 2.0x to 2.9x | 39 (15.9%) | 16 (10.5%) |
| 3.0x to 3.9x | 18 (7.3%) | 16 (10.5%) |
| 4.0x or more | 160 (65.0%) | 55 (36.2%) |
| Total | 246 (100.0%) | 152 (100.0%) |
Real Estate Taxes by Mortgage Status in Carlsborg
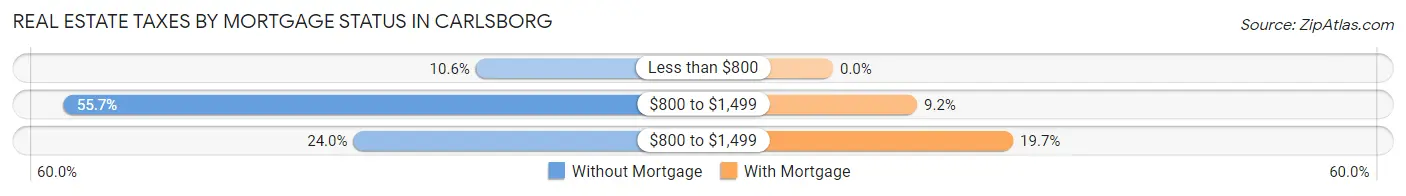
| Property Taxes | Without Mortgage | With Mortgage |
| Less than $800 | 26 (10.6%) | 0 (0.0%) |
| $800 to $1,499 | 137 (55.7%) | 14 (9.2%) |
| $800 to $1,499 | 59 (24.0%) | 30 (19.7%) |
| Total | 246 (100.0%) | 152 (100.0%) |
Health & Disability in Carlsborg
Health Insurance Coverage by Age in Carlsborg
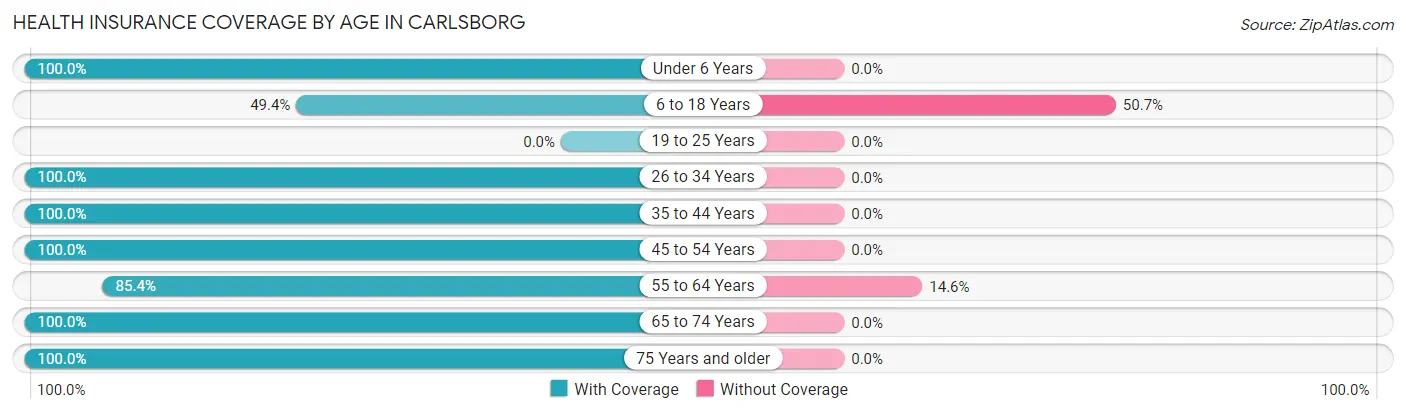
| Age Bracket | With Coverage | Without Coverage |
| Under 6 Years | 29 (100.0%) | 0 (0.0%) |
| 6 to 18 Years | 38 (49.3%) | 39 (50.6%) |
| 19 to 25 Years | 0 (0.0%) | 0 (0.0%) |
| 26 to 34 Years | 148 (100.0%) | 0 (0.0%) |
| 35 to 44 Years | 41 (100.0%) | 0 (0.0%) |
| 45 to 54 Years | 161 (100.0%) | 0 (0.0%) |
| 55 to 64 Years | 88 (85.4%) | 15 (14.6%) |
| 65 to 74 Years | 174 (100.0%) | 0 (0.0%) |
| 75 Years and older | 199 (100.0%) | 0 (0.0%) |
| Total | 878 (94.2%) | 54 (5.8%) |
Health Insurance Coverage by Citizenship Status in Carlsborg
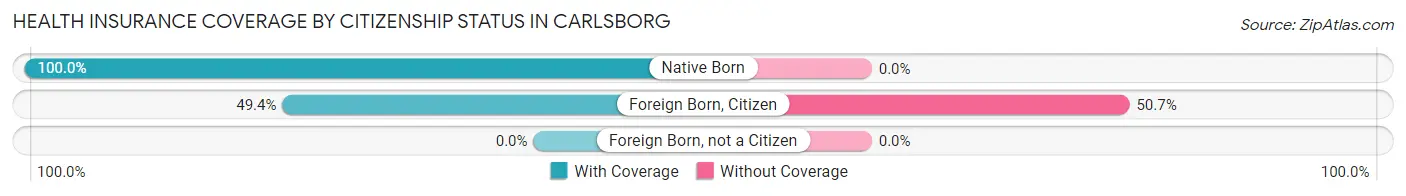
| Citizenship Status | With Coverage | Without Coverage |
| Native Born | 29 (100.0%) | 0 (0.0%) |
| Foreign Born, Citizen | 38 (49.3%) | 39 (50.6%) |
| Foreign Born, not a Citizen | 0 (0.0%) | 0 (0.0%) |
Health Insurance Coverage by Household Income in Carlsborg
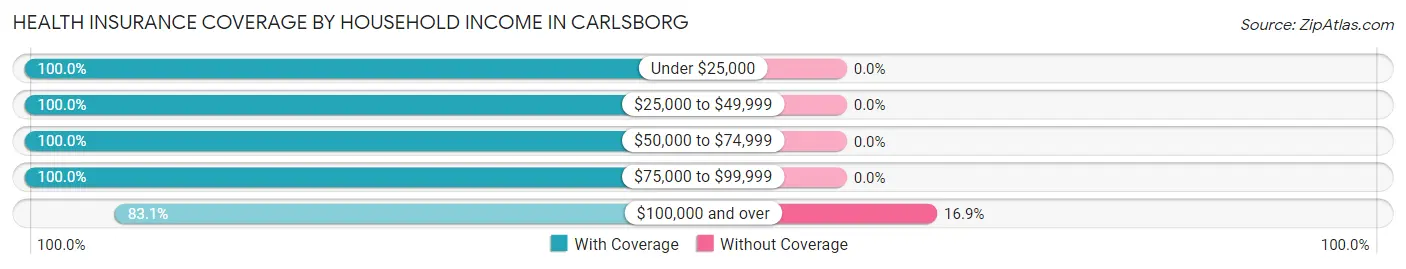
| Household Income | With Coverage | Without Coverage |
| Under $25,000 | 160 (100.0%) | 0 (0.0%) |
| $25,000 to $49,999 | 193 (100.0%) | 0 (0.0%) |
| $50,000 to $74,999 | 219 (100.0%) | 0 (0.0%) |
| $75,000 to $99,999 | 41 (100.0%) | 0 (0.0%) |
| $100,000 and over | 265 (83.1%) | 54 (16.9%) |
Public vs Private Health Insurance Coverage by Age in Carlsborg
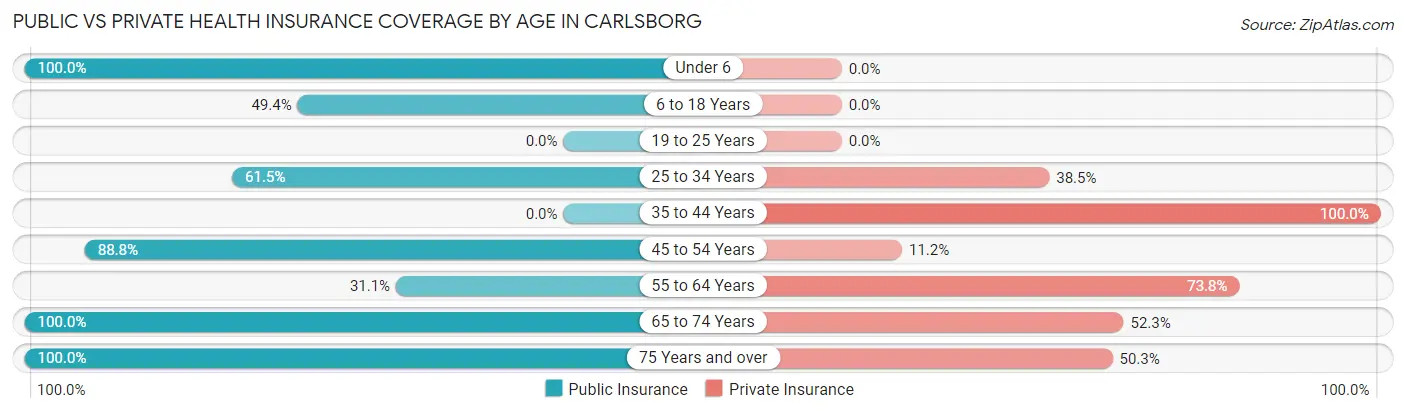
| Age Bracket | Public Insurance | Private Insurance |
| Under 6 | 29 (100.0%) | 0 (0.0%) |
| 6 to 18 Years | 38 (49.3%) | 0 (0.0%) |
| 19 to 25 Years | 0 (0.0%) | 0 (0.0%) |
| 25 to 34 Years | 91 (61.5%) | 57 (38.5%) |
| 35 to 44 Years | 0 (0.0%) | 41 (100.0%) |
| 45 to 54 Years | 143 (88.8%) | 18 (11.2%) |
| 55 to 64 Years | 32 (31.1%) | 76 (73.8%) |
| 65 to 74 Years | 174 (100.0%) | 91 (52.3%) |
| 75 Years and over | 199 (100.0%) | 100 (50.2%) |
| Total | 706 (75.7%) | 383 (41.1%) |
Disability Status by Sex by Age in Carlsborg
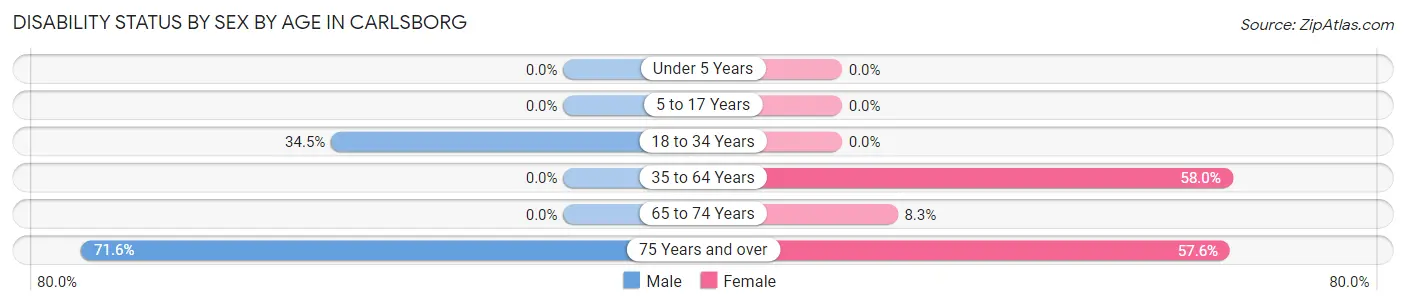
| Age Bracket | Male | Female |
| Under 5 Years | 0 (0.0%) | 0 (0.0%) |
| 5 to 17 Years | 0 (0.0%) | 0 (0.0%) |
| 18 to 34 Years | 30 (34.5%) | 0 (0.0%) |
| 35 to 64 Years | 0 (0.0%) | 94 (58.0%) |
| 65 to 74 Years | 0 (0.0%) | 11 (8.3%) |
| 75 Years and over | 58 (71.6%) | 68 (57.6%) |
Disability Class by Sex by Age in Carlsborg
Disability Class: Hearing Difficulty
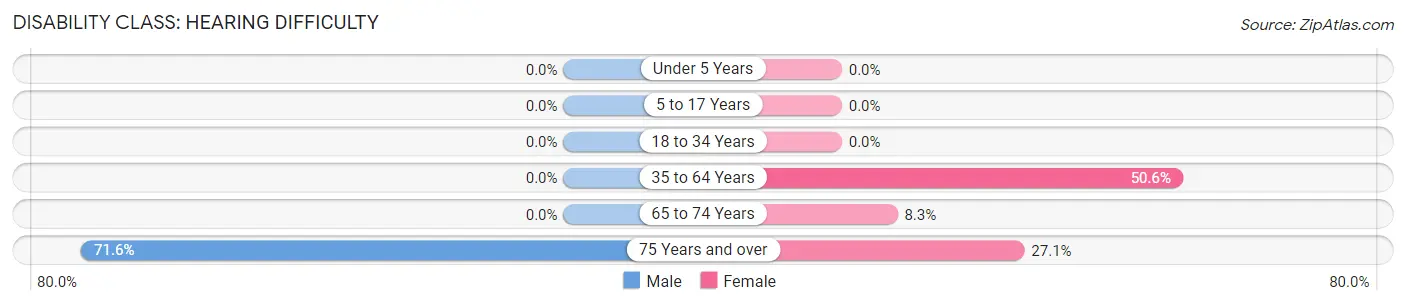
| Age Bracket | Male | Female |
| Under 5 Years | 0 (0.0%) | 0 (0.0%) |
| 5 to 17 Years | 0 (0.0%) | 0 (0.0%) |
| 18 to 34 Years | 0 (0.0%) | 0 (0.0%) |
| 35 to 64 Years | 0 (0.0%) | 82 (50.6%) |
| 65 to 74 Years | 0 (0.0%) | 11 (8.3%) |
| 75 Years and over | 58 (71.6%) | 32 (27.1%) |
Disability Class: Vision Difficulty
| Age Bracket | Male | Female |
| Under 5 Years | 0 (0.0%) | 0 (0.0%) |
| 5 to 17 Years | 0 (0.0%) | 0 (0.0%) |
| 18 to 34 Years | 0 (0.0%) | 0 (0.0%) |
| 35 to 64 Years | 0 (0.0%) | 0 (0.0%) |
| 65 to 74 Years | 0 (0.0%) | 0 (0.0%) |
| 75 Years and over | 0 (0.0%) | 0 (0.0%) |
Disability Class: Cognitive Difficulty
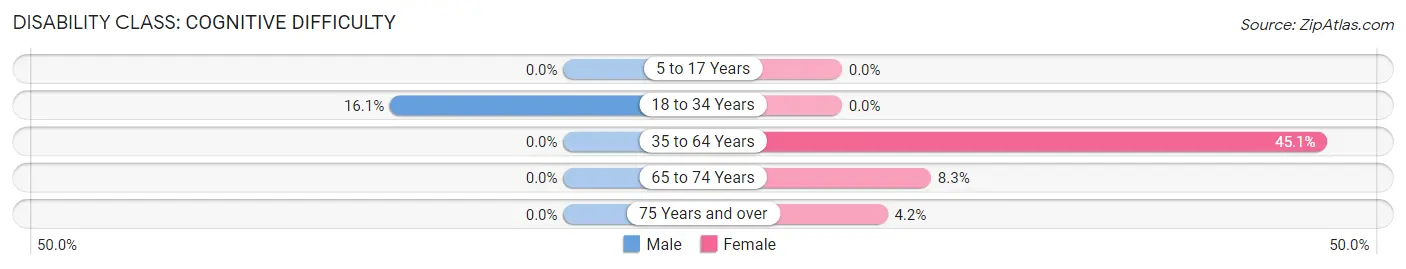
| Age Bracket | Male | Female |
| 5 to 17 Years | 0 (0.0%) | 0 (0.0%) |
| 18 to 34 Years | 14 (16.1%) | 0 (0.0%) |
| 35 to 64 Years | 0 (0.0%) | 73 (45.1%) |
| 65 to 74 Years | 0 (0.0%) | 11 (8.3%) |
| 75 Years and over | 0 (0.0%) | 5 (4.2%) |
Disability Class: Ambulatory Difficulty
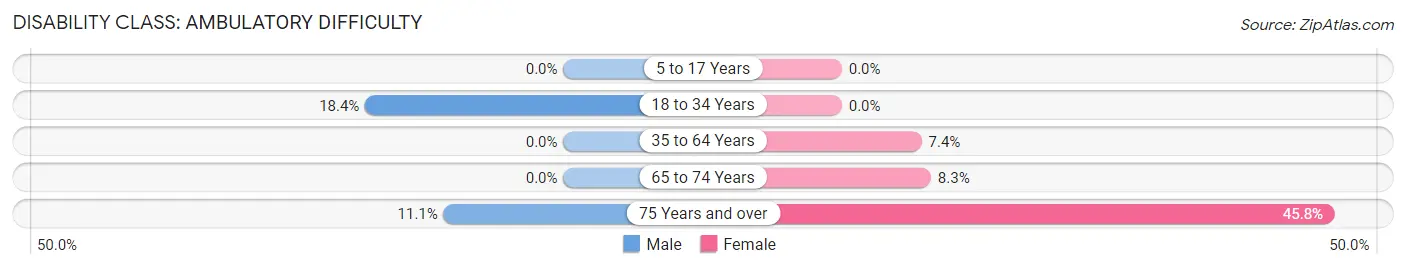
| Age Bracket | Male | Female |
| 5 to 17 Years | 0 (0.0%) | 0 (0.0%) |
| 18 to 34 Years | 16 (18.4%) | 0 (0.0%) |
| 35 to 64 Years | 0 (0.0%) | 12 (7.4%) |
| 65 to 74 Years | 0 (0.0%) | 11 (8.3%) |
| 75 Years and over | 9 (11.1%) | 54 (45.8%) |
Disability Class: Self-Care Difficulty
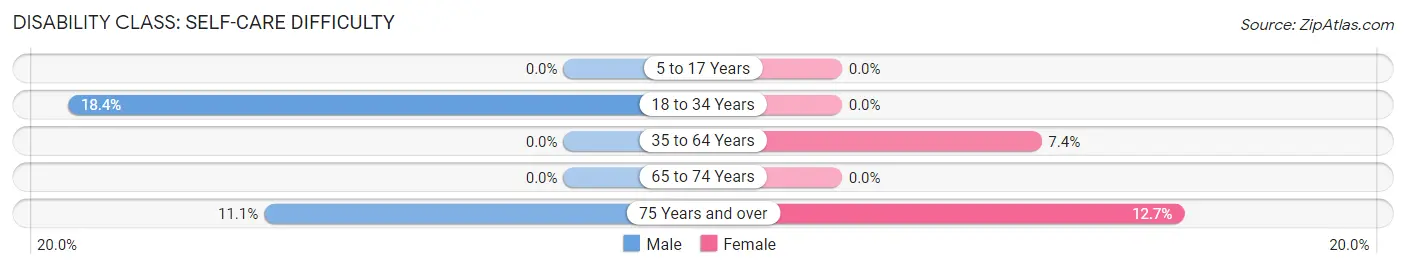
| Age Bracket | Male | Female |
| 5 to 17 Years | 0 (0.0%) | 0 (0.0%) |
| 18 to 34 Years | 16 (18.4%) | 0 (0.0%) |
| 35 to 64 Years | 0 (0.0%) | 12 (7.4%) |
| 65 to 74 Years | 0 (0.0%) | 0 (0.0%) |
| 75 Years and over | 9 (11.1%) | 15 (12.7%) |
Technology Access in Carlsborg
Computing Device Access in Carlsborg
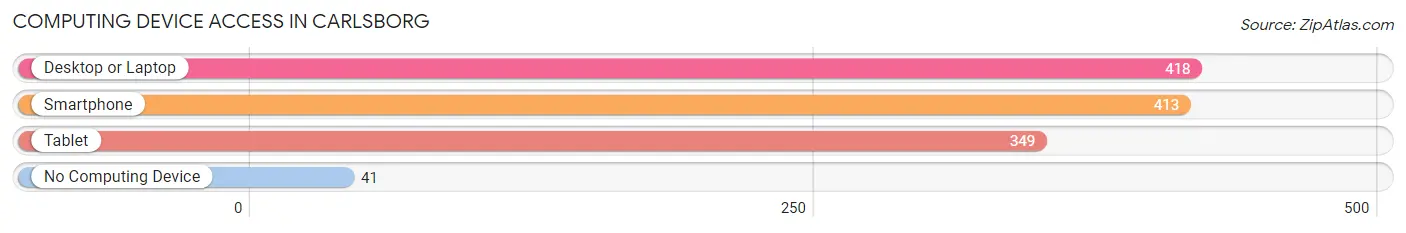
| Device Type | # Households | % Households |
| Desktop or Laptop | 418 | 81.6% |
| Smartphone | 413 | 80.7% |
| Tablet | 349 | 68.2% |
| No Computing Device | 41 | 8.0% |
| Total | 512 | 100.0% |
Internet Access in Carlsborg
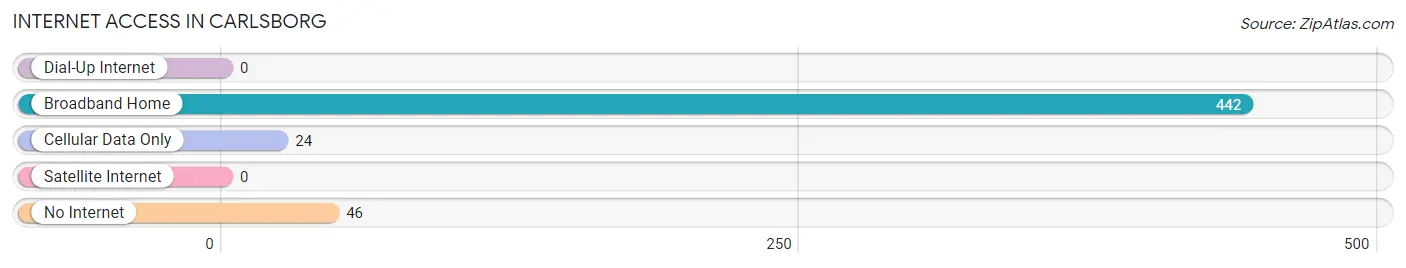
| Internet Type | # Households | % Households |
| Dial-Up Internet | 0 | 0.0% |
| Broadband Home | 442 | 86.3% |
| Cellular Data Only | 24 | 4.7% |
| Satellite Internet | 0 | 0.0% |
| No Internet | 46 | 9.0% |
| Total | 512 | 100.0% |
Carlsborg Summary
Carlsborg is a small unincorporated community located in Clallam County, Washington, United States. It is situated on the Olympic Peninsula, approximately 8 miles south of Sequim and 8 miles north of Port Angeles. The population of Carlsborg was estimated to be 1,845 in 2019.
History
The area that is now Carlsborg was first settled in the late 1800s by Swedish immigrants. The town was named after Carl Anderson, who was one of the first settlers in the area. Anderson was a Swedish immigrant who had come to the United States in 1883. He purchased land in the area and began farming.
In the early 1900s, the area began to develop as a logging and farming community. The first post office was established in Carlsborg in 1906. The town was officially incorporated in 1910.
In the 1920s, the area began to experience a population boom as more people moved to the area to take advantage of the logging and farming opportunities. The population of Carlsborg peaked in the 1940s, when it had a population of over 2,000 people.
Geography
Carlsborg is located in the Olympic Peninsula of Washington State. It is situated on the Strait of Juan de Fuca, approximately 8 miles south of Sequim and 8 miles north of Port Angeles. The area is characterized by rolling hills and lush forests.
The climate in Carlsborg is mild and temperate. The average temperature in the summer is around 70 degrees Fahrenheit, and the average temperature in the winter is around 40 degrees Fahrenheit. The area receives an average of 40 inches of rain per year.
Economy
The economy of Carlsborg is largely based on agriculture and forestry. The area is home to several farms and ranches, as well as several logging companies. The area is also home to several small businesses, including restaurants, retail stores, and service providers.
The area is also home to several manufacturing companies, including a paper mill and a wood products plant. The area is also home to several wineries and breweries.
Demographics
The population of Carlsborg was estimated to be 1,845 in 2019. The population is largely white (94.3%), with a small percentage of Hispanic (2.2%) and Asian (1.2%) residents. The median household income in Carlsborg is $50,000, and the median home value is $250,000.
Conclusion
Carlsborg is a small unincorporated community located in Clallam County, Washington, United States. It is situated on the Olympic Peninsula, approximately 8 miles south of Sequim and 8 miles north of Port Angeles. The population of Carlsborg was estimated to be 1,845 in 2019. The area is characterized by rolling hills and lush forests, and the economy is largely based on agriculture and forestry. The population is largely white, with a small percentage of Hispanic and Asian residents. The median household income in Carlsborg is $50,000, and the median home value is $250,000.
Common Questions
What is Per Capita Income in Carlsborg?
Per Capita income in Carlsborg is $28,749.
What is the Median Family Income in Carlsborg?
Median Family Income in Carlsborg is $94,615.
What is the Median Household income in Carlsborg?
Median Household Income in Carlsborg is $39,483.
What is Inequality or Gini Index in Carlsborg?
Inequality or Gini Index in Carlsborg is 0.47.
What is the Total Population of Carlsborg?
Total Population of Carlsborg is 932.
What is the Total Male Population of Carlsborg?
Total Male Population of Carlsborg is 417.
What is the Total Female Population of Carlsborg?
Total Female Population of Carlsborg is 515.
What is the Ratio of Males per 100 Females in Carlsborg?
There are 80.97 Males per 100 Females in Carlsborg.
What is the Ratio of Females per 100 Males in Carlsborg?
There are 123.50 Females per 100 Males in Carlsborg.
What is the Median Population Age in Carlsborg?
Median Population Age in Carlsborg is 56.7 Years.
What is the Average Family Size in Carlsborg
Average Family Size in Carlsborg is 2.7 People.
What is the Average Household Size in Carlsborg
Average Household Size in Carlsborg is 1.8 People.
How Large is the Labor Force in Carlsborg?
There are 302 People in the Labor Forcein in Carlsborg.
What is the Percentage of People in the Labor Force in Carlsborg?
36.6% of People are in the Labor Force in Carlsborg.