Coulee City, WA Map & Demographics
Coulee City Map
Coulee City Overview
$25,666
PER CAPITA INCOME
$47,454
AVG FAMILY INCOME
$44,464
AVG HOUSEHOLD INCOME
12.3%
WAGE / INCOME GAP [ % ]
87.7¢/ $1
WAGE / INCOME GAP [ $ ]
0.37
INEQUALITY / GINI INDEX
503
TOTAL POPULATION
312
MALE POPULATION
191
FEMALE POPULATION
163.35
MALES / 100 FEMALES
61.22
FEMALES / 100 MALES
56.7
MEDIAN AGE
2.4
AVG FAMILY SIZE
2.0
AVG HOUSEHOLD SIZE
170
LABOR FORCE [ PEOPLE ]
38.7%
PERCENT IN LABOR FORCE
8.2%
UNEMPLOYMENT RATE
Coulee City Zip Codes
Coulee City Area Codes
Income in Coulee City
Income Overview in Coulee City
Per Capita Income in Coulee City is $25,666, while median incomes of families and households are $47,454 and $44,464 respectively.
| Characteristic | Number | Measure |
| Per Capita Income | 503 | $25,666 |
| Median Family Income | 157 | $47,454 |
| Mean Family Income | 157 | $62,213 |
| Median Household Income | 257 | $44,464 |
| Mean Household Income | 257 | $50,444 |
| Income Deficit | 157 | $0 |
| Wage / Income Gap (%) | 503 | 12.33% |
| Wage / Income Gap ($) | 503 | 87.67¢ per $1 |
| Gini / Inequality Index | 503 | 0.37 |
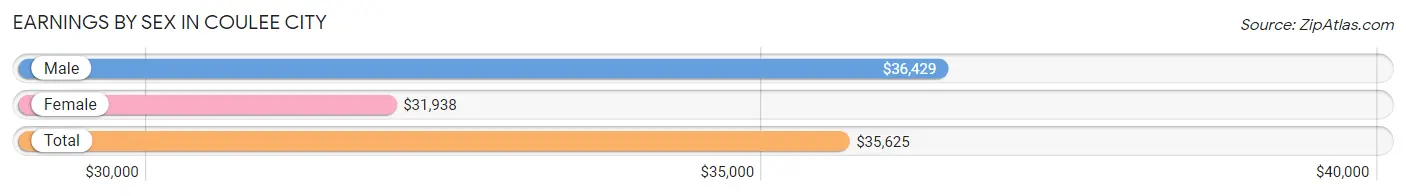
Earnings by Sex in Coulee City
Average Earnings in Coulee City are $35,625, $36,429 for men and $31,938 for women, a difference of 12.3%.
| Sex | Number | Average Earnings |
| Male | 106 (59.9%) | $36,429 |
| Female | 71 (40.1%) | $31,938 |
| Total | 177 (100.0%) | $35,625 |
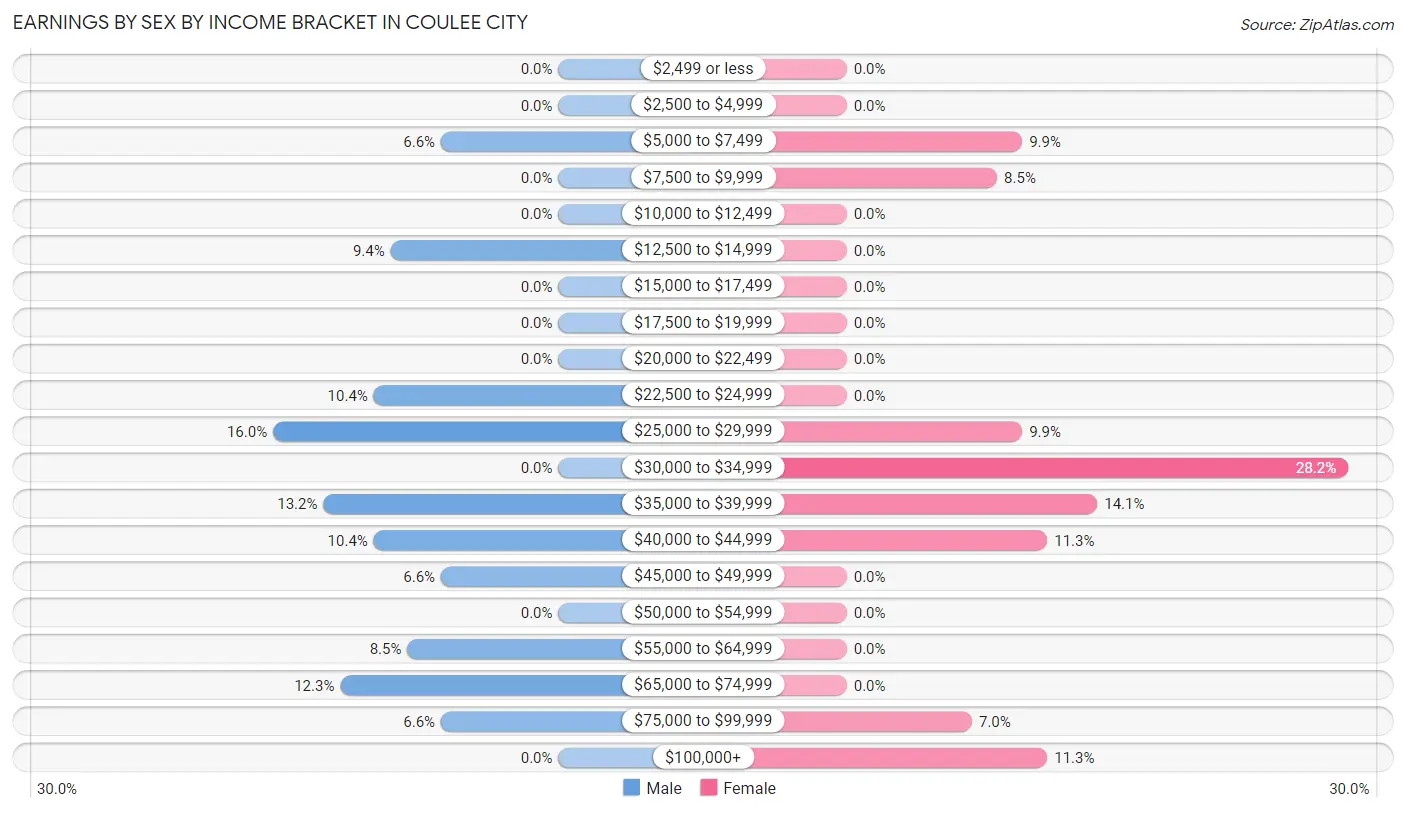
Earnings by Sex by Income Bracket in Coulee City
The most common earnings brackets in Coulee City are $25,000 to $29,999 for men (17 | 16.0%) and $30,000 to $34,999 for women (20 | 28.2%).
| Income | Male | Female |
| $2,499 or less | 0 (0.0%) | 0 (0.0%) |
| $2,500 to $4,999 | 0 (0.0%) | 0 (0.0%) |
| $5,000 to $7,499 | 7 (6.6%) | 7 (9.9%) |
| $7,500 to $9,999 | 0 (0.0%) | 6 (8.5%) |
| $10,000 to $12,499 | 0 (0.0%) | 0 (0.0%) |
| $12,500 to $14,999 | 10 (9.4%) | 0 (0.0%) |
| $15,000 to $17,499 | 0 (0.0%) | 0 (0.0%) |
| $17,500 to $19,999 | 0 (0.0%) | 0 (0.0%) |
| $20,000 to $22,499 | 0 (0.0%) | 0 (0.0%) |
| $22,500 to $24,999 | 11 (10.4%) | 0 (0.0%) |
| $25,000 to $29,999 | 17 (16.0%) | 7 (9.9%) |
| $30,000 to $34,999 | 0 (0.0%) | 20 (28.2%) |
| $35,000 to $39,999 | 14 (13.2%) | 10 (14.1%) |
| $40,000 to $44,999 | 11 (10.4%) | 8 (11.3%) |
| $45,000 to $49,999 | 7 (6.6%) | 0 (0.0%) |
| $50,000 to $54,999 | 0 (0.0%) | 0 (0.0%) |
| $55,000 to $64,999 | 9 (8.5%) | 0 (0.0%) |
| $65,000 to $74,999 | 13 (12.3%) | 0 (0.0%) |
| $75,000 to $99,999 | 7 (6.6%) | 5 (7.0%) |
| $100,000+ | 0 (0.0%) | 8 (11.3%) |
| Total | 106 (100.0%) | 71 (100.0%) |
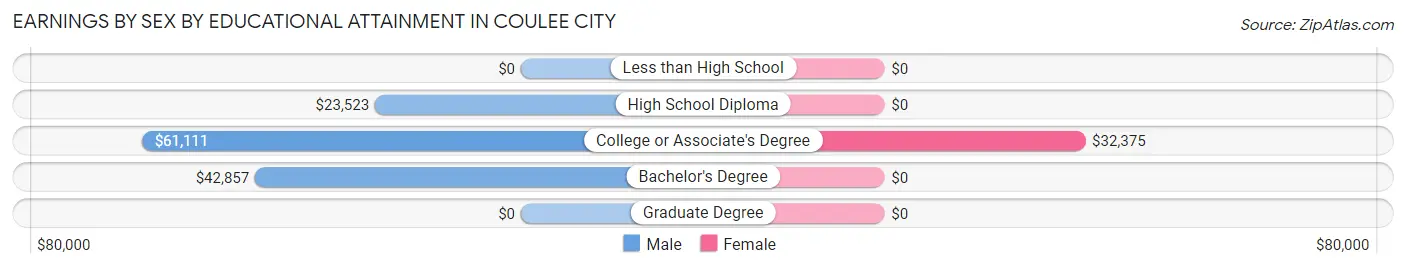
Earnings by Sex by Educational Attainment in Coulee City
Average earnings in Coulee City are $35,268 for men and $32,375 for women, a difference of 8.2%. Men with an educational attainment of college or associate's degree enjoy the highest average annual earnings of $61,111, while those with high school diploma education earn the least with $23,523. Women with an educational attainment of college or associate's degree earn the most with the average annual earnings of $32,375, while those with college or associate's degree education have the smallest earnings of $32,375.
| Educational Attainment | Male Income | Female Income |
| Less than High School | - | - |
| High School Diploma | $23,523 | $0 |
| College or Associate's Degree | $61,111 | $32,375 |
| Bachelor's Degree | $42,857 | $0 |
| Graduate Degree | - | - |
| Total | $35,268 | $32,375 |
Family Income in Coulee City
Family Income Brackets in Coulee City
According to the Coulee City family income data, there are 33 families falling into the $100,000 to $149,999 income range, which is the most common income bracket and makes up 21.0% of all families.
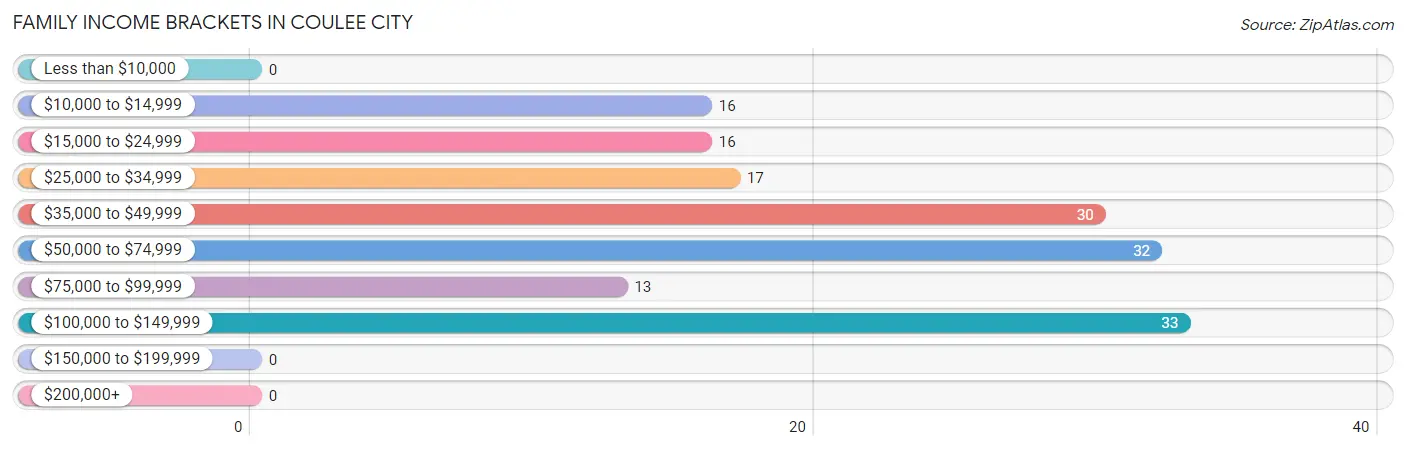
| Income Bracket | # Families | % Families |
| Less than $10,000 | 0 | 0.0% |
| $10,000 to $14,999 | 16 | 10.2% |
| $15,000 to $24,999 | 16 | 10.2% |
| $25,000 to $34,999 | 17 | 10.8% |
| $35,000 to $49,999 | 30 | 19.1% |
| $50,000 to $74,999 | 32 | 20.4% |
| $75,000 to $99,999 | 13 | 8.3% |
| $100,000 to $149,999 | 33 | 21.0% |
| $150,000 to $199,999 | 0 | 0.0% |
| $200,000+ | 0 | 0.0% |
Family Income by Famaliy Size in Coulee City
4-person families (30 | 19.1%) account for the highest median family income in Coulee City with $69,500 per family, while 2-person families (118 | 75.2%) have the highest median income of $22,963 per family member.
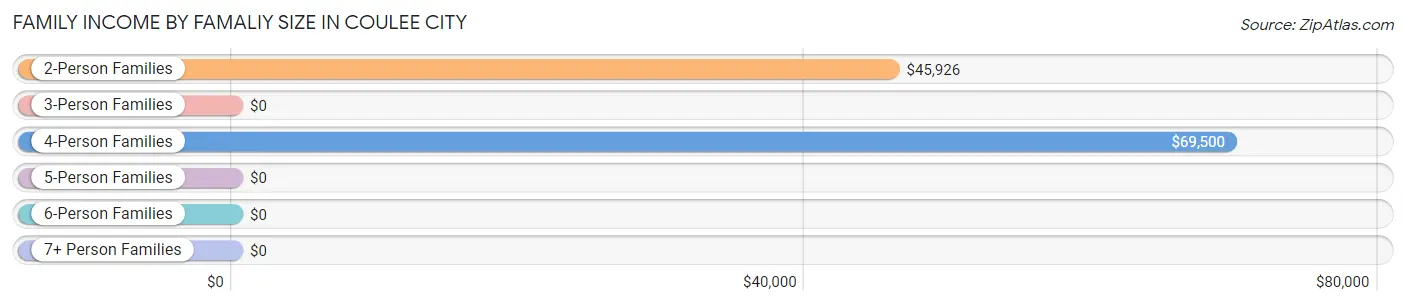
| Income Bracket | # Families | Median Income |
| 2-Person Families | 118 (75.2%) | $45,926 |
| 3-Person Families | 9 (5.7%) | $0 |
| 4-Person Families | 30 (19.1%) | $69,500 |
| 5-Person Families | 0 (0.0%) | $0 |
| 6-Person Families | 0 (0.0%) | $0 |
| 7+ Person Families | 0 (0.0%) | $0 |
| Total | 157 (100.0%) | $47,454 |
Family Income by Number of Earners in Coulee City
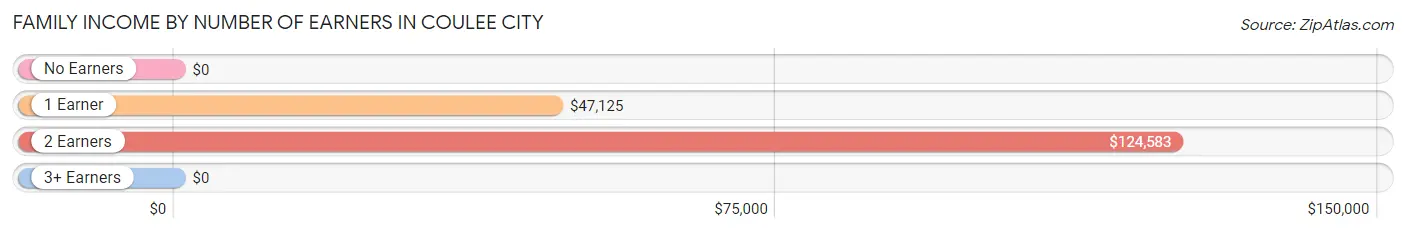
| Number of Earners | # Families | Median Income |
| No Earners | 65 (41.4%) | $0 |
| 1 Earner | 62 (39.5%) | $47,125 |
| 2 Earners | 30 (19.1%) | $124,583 |
| 3+ Earners | 0 (0.0%) | $0 |
| Total | 157 (100.0%) | $47,454 |
Household Income in Coulee City
Household Income Brackets in Coulee City
With 54 households falling in the category, the $50,000 to $74,999 income range is the most frequent in Coulee City, accounting for 21.0% of all households.
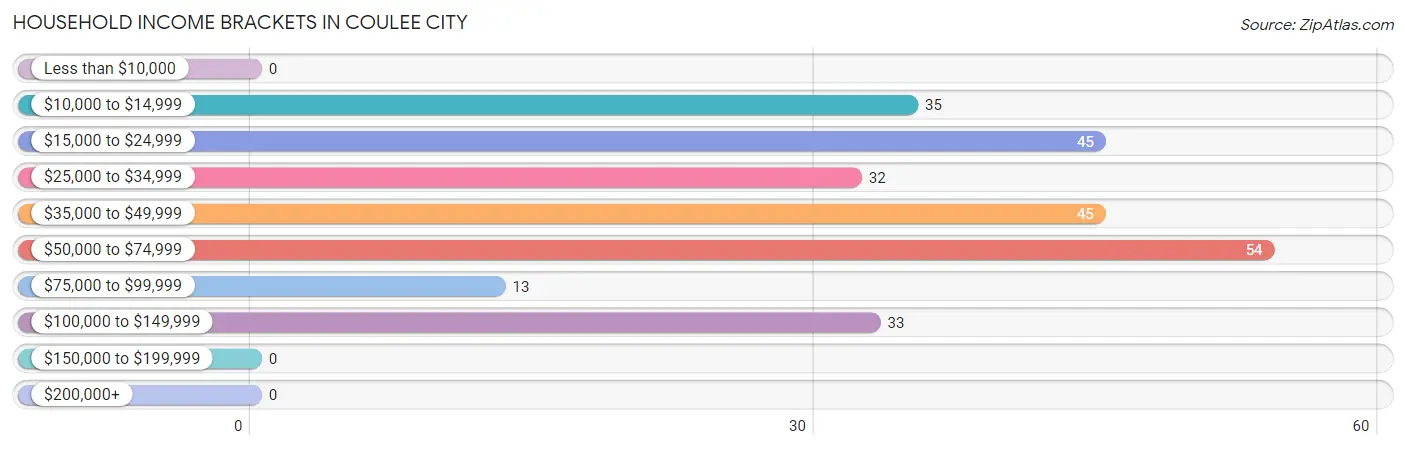
| Income Bracket | # Households | % Households |
| Less than $10,000 | 0 | 0.0% |
| $10,000 to $14,999 | 35 | 13.6% |
| $15,000 to $24,999 | 45 | 17.5% |
| $25,000 to $34,999 | 32 | 12.5% |
| $35,000 to $49,999 | 45 | 17.5% |
| $50,000 to $74,999 | 54 | 21.0% |
| $75,000 to $99,999 | 13 | 5.1% |
| $100,000 to $149,999 | 33 | 12.8% |
| $150,000 to $199,999 | 0 | 0.0% |
| $200,000+ | 0 | 0.0% |
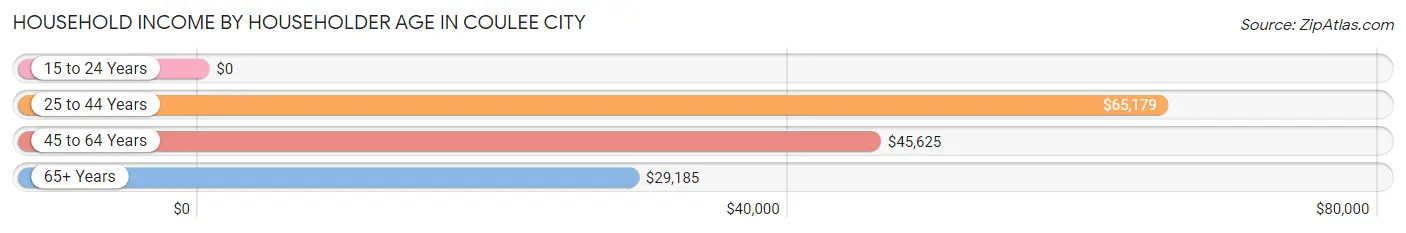
Household Income by Householder Age in Coulee City
The median household income in Coulee City is $44,464, with the highest median household income of $65,179 found in the 25 to 44 years age bracket for the primary householder. A total of 47 households (18.3%) fall into this category. Meanwhile, the 15 to 24 years age bracket for the primary householder has the lowest median household income of $0, with 13 households (5.1%) in this group.
| Income Bracket | # Households | Median Income |
| 15 to 24 Years | 13 (5.1%) | $0 |
| 25 to 44 Years | 47 (18.3%) | $65,179 |
| 45 to 64 Years | 58 (22.6%) | $45,625 |
| 65+ Years | 139 (54.1%) | $29,185 |
| Total | 257 (100.0%) | $44,464 |
Poverty in Coulee City
Income Below Poverty by Sex and Age in Coulee City
With 19.2% poverty level for males and 12.0% for females among the residents of Coulee City, 75 year old and over males and 18 to 24 year old females are the most vulnerable to poverty, with 43 males (62.3%) and 7 females (100.0%) in their respective age groups living below the poverty level.
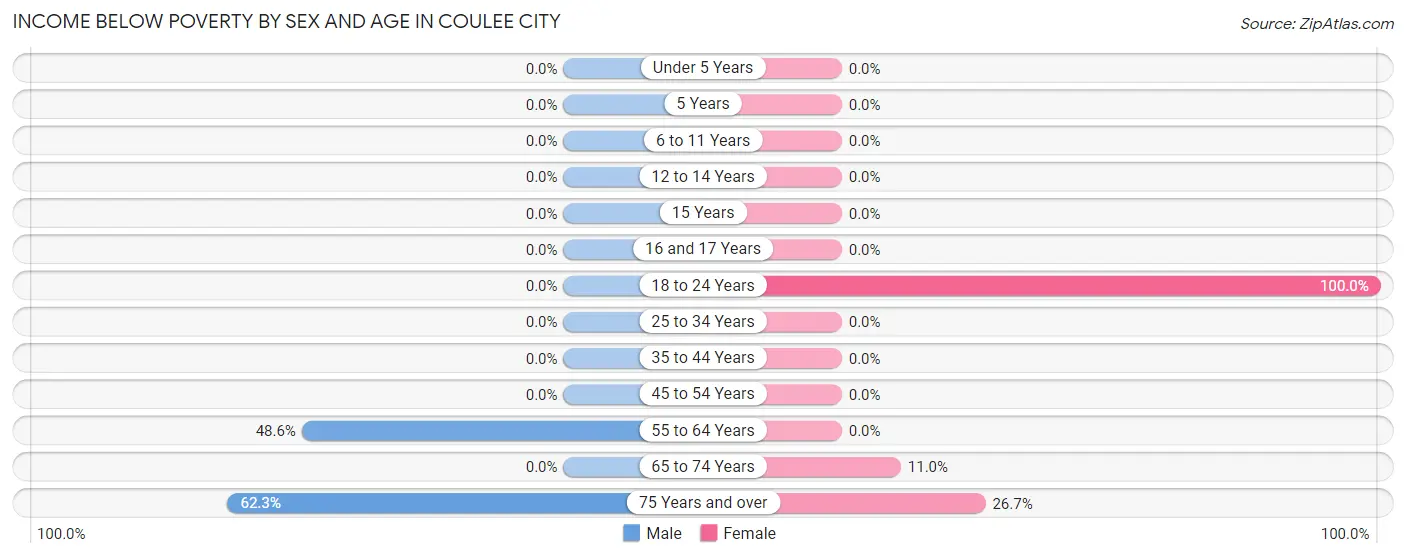
| Age Bracket | Male | Female |
| Under 5 Years | 0 (0.0%) | 0 (0.0%) |
| 5 Years | 0 (0.0%) | 0 (0.0%) |
| 6 to 11 Years | 0 (0.0%) | 0 (0.0%) |
| 12 to 14 Years | 0 (0.0%) | 0 (0.0%) |
| 15 Years | 0 (0.0%) | 0 (0.0%) |
| 16 and 17 Years | 0 (0.0%) | 0 (0.0%) |
| 18 to 24 Years | 0 (0.0%) | 7 (100.0%) |
| 25 to 34 Years | 0 (0.0%) | 0 (0.0%) |
| 35 to 44 Years | 0 (0.0%) | 0 (0.0%) |
| 45 to 54 Years | 0 (0.0%) | 0 (0.0%) |
| 55 to 64 Years | 17 (48.6%) | 0 (0.0%) |
| 65 to 74 Years | 0 (0.0%) | 8 (11.0%) |
| 75 Years and over | 43 (62.3%) | 8 (26.7%) |
| Total | 60 (19.2%) | 23 (12.0%) |
Income Above Poverty by Sex and Age in Coulee City
According to the poverty statistics in Coulee City, males aged under 5 years and females aged 12 to 14 years are the age groups that are most secure financially, with 100.0% of males and 100.0% of females in these age groups living above the poverty line.
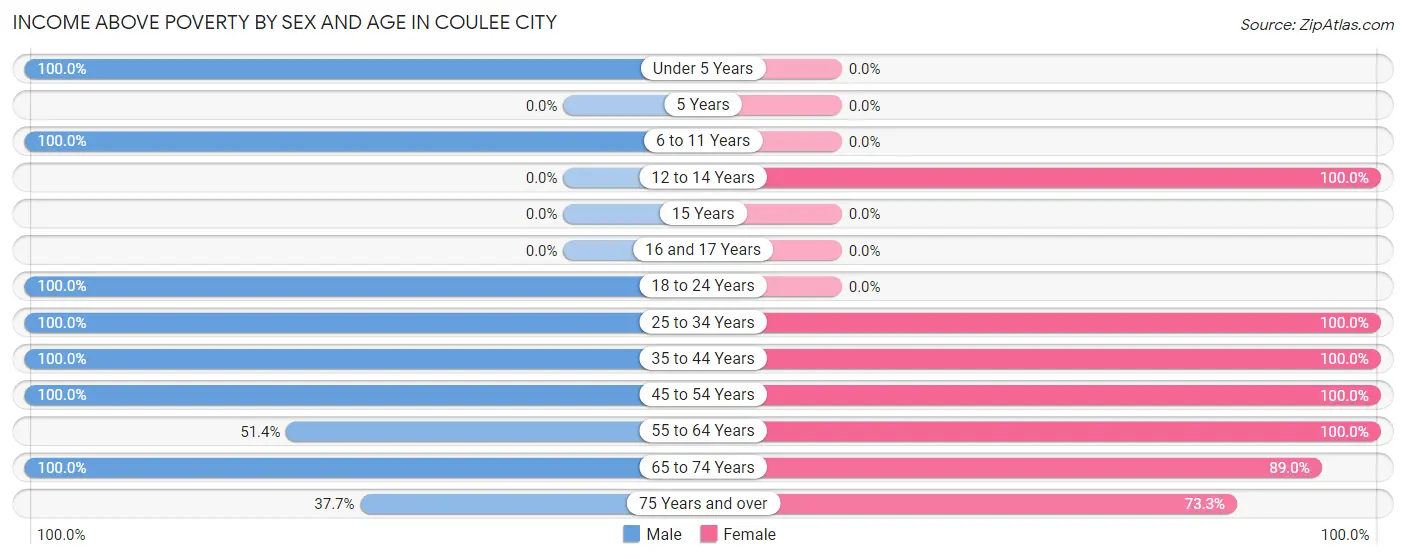
| Age Bracket | Male | Female |
| Under 5 Years | 29 (100.0%) | 0 (0.0%) |
| 5 Years | 0 (0.0%) | 0 (0.0%) |
| 6 to 11 Years | 28 (100.0%) | 0 (0.0%) |
| 12 to 14 Years | 0 (0.0%) | 7 (100.0%) |
| 15 Years | 0 (0.0%) | 0 (0.0%) |
| 16 and 17 Years | 0 (0.0%) | 0 (0.0%) |
| 18 to 24 Years | 13 (100.0%) | 0 (0.0%) |
| 25 to 34 Years | 37 (100.0%) | 22 (100.0%) |
| 35 to 44 Years | 25 (100.0%) | 10 (100.0%) |
| 45 to 54 Years | 26 (100.0%) | 25 (100.0%) |
| 55 to 64 Years | 18 (51.4%) | 17 (100.0%) |
| 65 to 74 Years | 50 (100.0%) | 65 (89.0%) |
| 75 Years and over | 26 (37.7%) | 22 (73.3%) |
| Total | 252 (80.8%) | 168 (88.0%) |
Income Below Poverty Among Married-Couple Families in Coulee City
The poverty statistics for married-couple families in Coulee City show that 6.1% or 8 of the total 130 families live below the poverty line. Families with no children have the highest poverty rate of 8.3%, comprising of 8 families. On the other hand, families with 1 or 2 children have the lowest poverty rate of 0.0%, which includes 0 families.
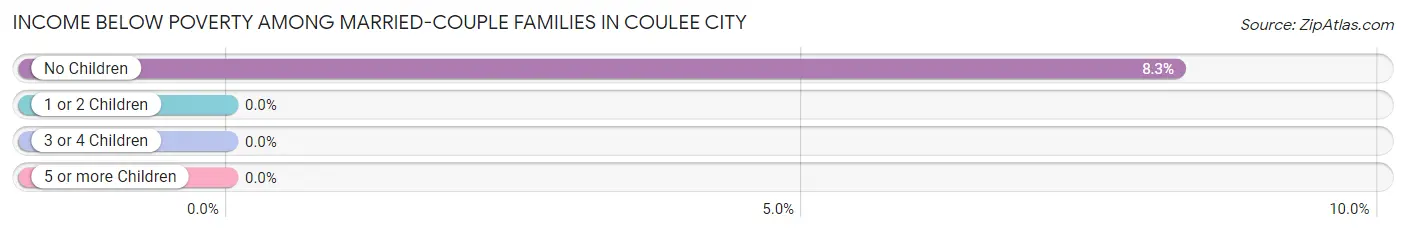
| Children | Above Poverty | Below Poverty |
| No Children | 89 (91.7%) | 8 (8.3%) |
| 1 or 2 Children | 33 (100.0%) | 0 (0.0%) |
| 3 or 4 Children | 0 (0.0%) | 0 (0.0%) |
| 5 or more Children | 0 (0.0%) | 0 (0.0%) |
| Total | 122 (93.9%) | 8 (6.1%) |
Income Below Poverty Among Single-Parent Households in Coulee City
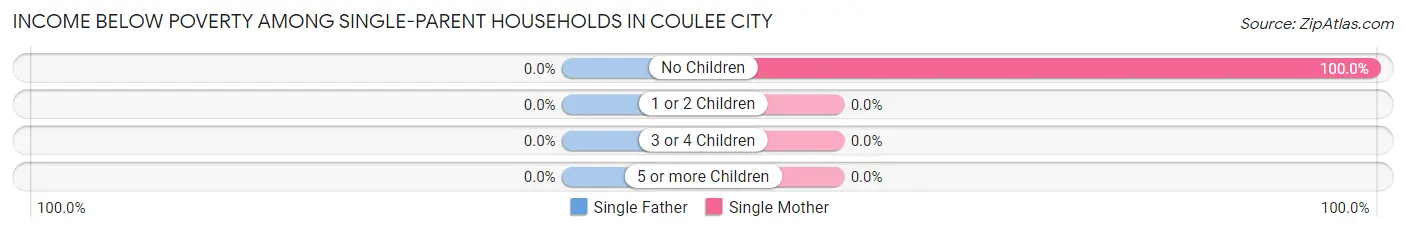
| Children | Single Father | Single Mother |
| No Children | 0 (0.0%) | 8 (100.0%) |
| 1 or 2 Children | 0 (0.0%) | 0 (0.0%) |
| 3 or 4 Children | 0 (0.0%) | 0 (0.0%) |
| 5 or more Children | 0 (0.0%) | 0 (0.0%) |
| Total | 0 (0.0%) | 8 (100.0%) |
Income Below Poverty Among Married-Couple vs Single-Parent Households in Coulee City
The poverty data for Coulee City shows that 8 of the married-couple family households (6.1%) and 8 of the single-parent households (29.6%) are living below the poverty level. Within the married-couple family households, those with no children have the highest poverty rate, with 8 households (8.3%) falling below the poverty line. Among the single-parent households, those with no children have the highest poverty rate, with 8 household (50.0%) living below poverty.
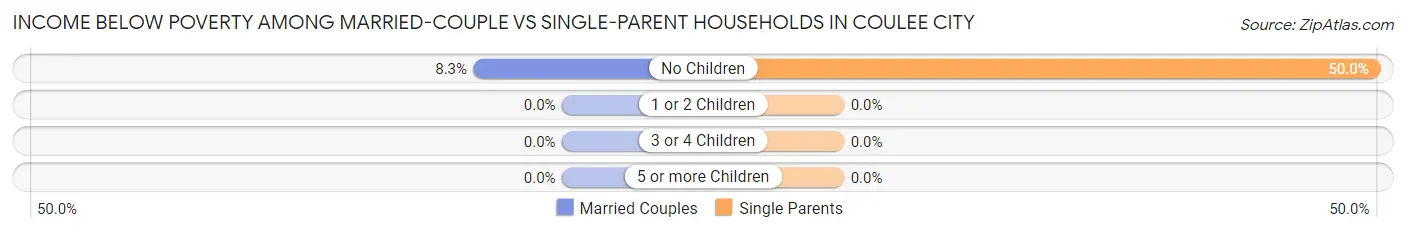
| Children | Married-Couple Families | Single-Parent Households |
| No Children | 8 (8.3%) | 8 (50.0%) |
| 1 or 2 Children | 0 (0.0%) | 0 (0.0%) |
| 3 or 4 Children | 0 (0.0%) | 0 (0.0%) |
| 5 or more Children | 0 (0.0%) | 0 (0.0%) |
| Total | 8 (6.1%) | 8 (29.6%) |
Race in Coulee City
The most populous races in Coulee City are White / Caucasian (448 | 89.1%), Two or more Races (28 | 5.6%), and Black / African American (27 | 5.4%).
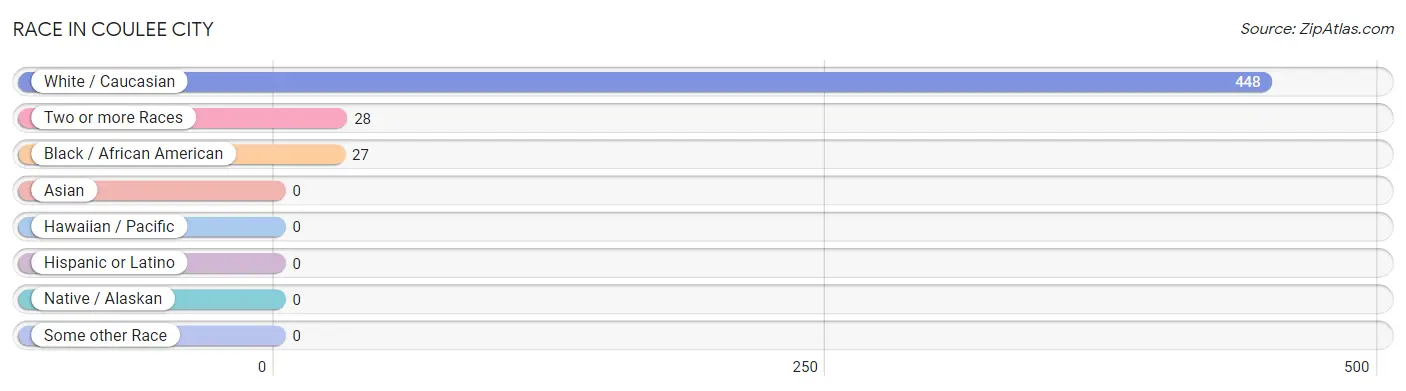
| Race | # Population | % Population |
| Asian | 0 | 0.0% |
| Black / African American | 27 | 5.4% |
| Hawaiian / Pacific | 0 | 0.0% |
| Hispanic or Latino | 0 | 0.0% |
| Native / Alaskan | 0 | 0.0% |
| White / Caucasian | 448 | 89.1% |
| Two or more Races | 28 | 5.6% |
| Some other Race | 0 | 0.0% |
| Total | 503 | 100.0% |
Ancestry in Coulee City
The most populous ancestries reported in Coulee City are German (87 | 17.3%), American (78 | 15.5%), English (58 | 11.5%), Norwegian (32 | 6.4%), and Dutch (29 | 5.8%), together accounting for 56.5% of all Coulee City residents.
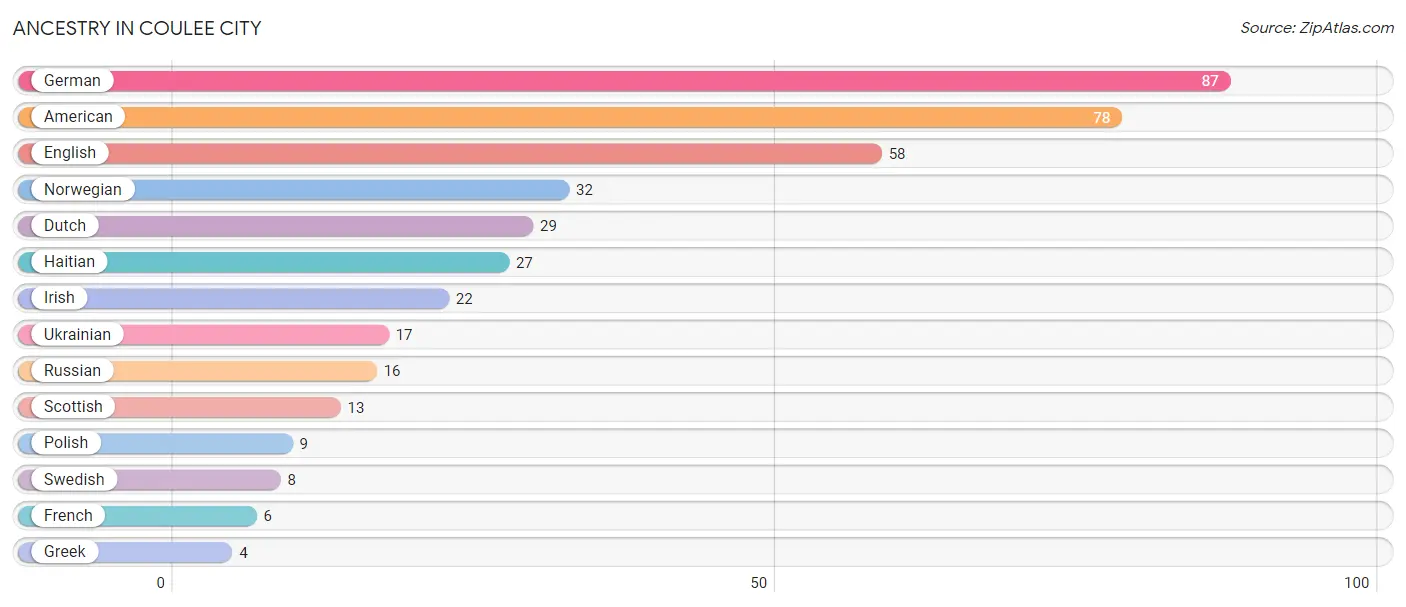
| Ancestry | # Population | % Population |
| American | 78 | 15.5% |
| Dutch | 29 | 5.8% |
| English | 58 | 11.5% |
| French | 6 | 1.2% |
| German | 87 | 17.3% |
| Greek | 4 | 0.8% |
| Haitian | 27 | 5.4% |
| Irish | 22 | 4.4% |
| Norwegian | 32 | 6.4% |
| Polish | 9 | 1.8% |
| Russian | 16 | 3.2% |
| Scottish | 13 | 2.6% |
| Swedish | 8 | 1.6% |
| Ukrainian | 17 | 3.4% | View All 14 Rows |
Immigrants in Coulee City
The most numerous immigrant groups reported in Coulee City came from , and Canada (7 | 1.4%), together accounting for 1.4% of all Coulee City residents.

| Immigration Origin | # Population | % Population |
| Canada | 7 | 1.4% | View All 1 Rows |
Sex and Age in Coulee City
Sex and Age in Coulee City
The most populous age groups in Coulee City are 55 to 59 Years (35 | 11.2%) for men and 70 to 74 Years (38 | 19.9%) for women.
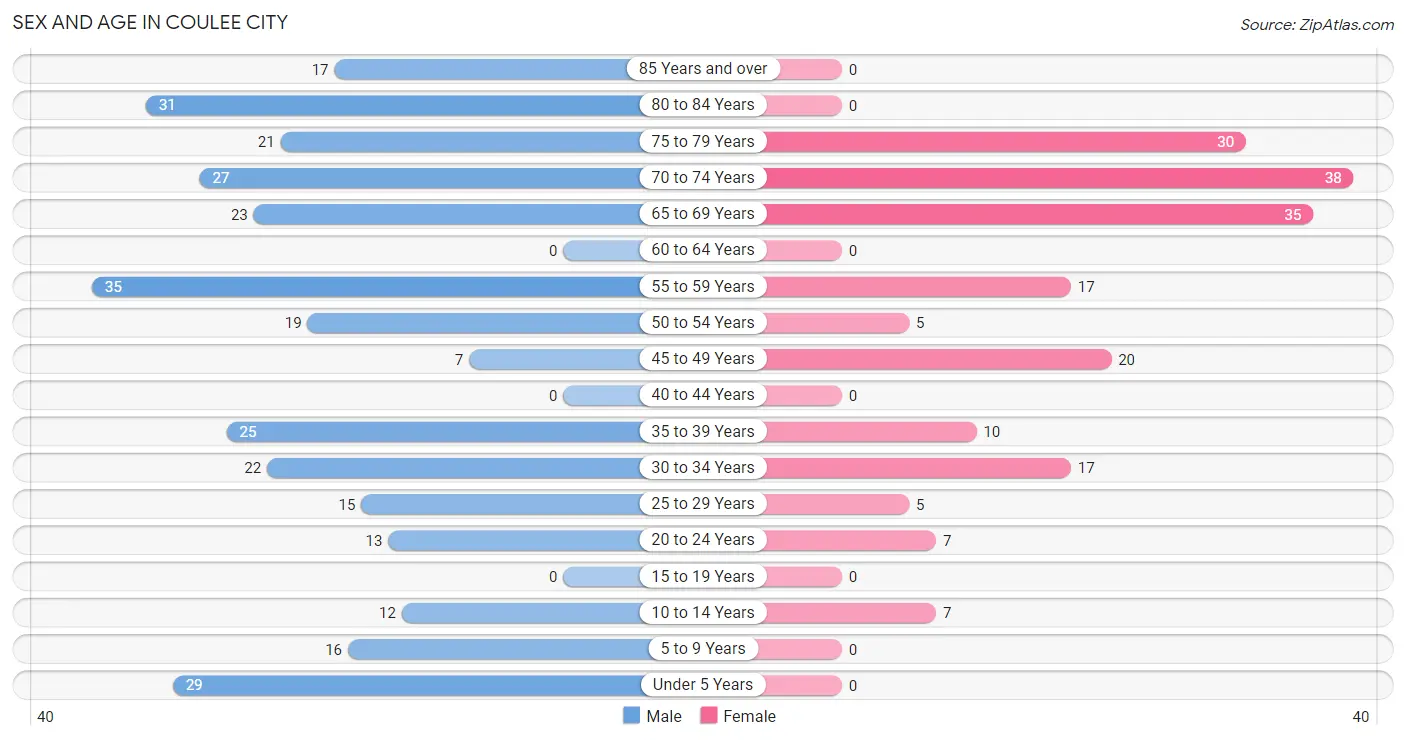
| Age Bracket | Male | Female |
| Under 5 Years | 29 (9.3%) | 0 (0.0%) |
| 5 to 9 Years | 16 (5.1%) | 0 (0.0%) |
| 10 to 14 Years | 12 (3.8%) | 7 (3.7%) |
| 15 to 19 Years | 0 (0.0%) | 0 (0.0%) |
| 20 to 24 Years | 13 (4.2%) | 7 (3.7%) |
| 25 to 29 Years | 15 (4.8%) | 5 (2.6%) |
| 30 to 34 Years | 22 (7.0%) | 17 (8.9%) |
| 35 to 39 Years | 25 (8.0%) | 10 (5.2%) |
| 40 to 44 Years | 0 (0.0%) | 0 (0.0%) |
| 45 to 49 Years | 7 (2.2%) | 20 (10.5%) |
| 50 to 54 Years | 19 (6.1%) | 5 (2.6%) |
| 55 to 59 Years | 35 (11.2%) | 17 (8.9%) |
| 60 to 64 Years | 0 (0.0%) | 0 (0.0%) |
| 65 to 69 Years | 23 (7.4%) | 35 (18.3%) |
| 70 to 74 Years | 27 (8.6%) | 38 (19.9%) |
| 75 to 79 Years | 21 (6.7%) | 30 (15.7%) |
| 80 to 84 Years | 31 (9.9%) | 0 (0.0%) |
| 85 Years and over | 17 (5.4%) | 0 (0.0%) |
| Total | 312 (100.0%) | 191 (100.0%) |
Families and Households in Coulee City
Median Family Size in Coulee City
The median family size in Coulee City is 2.38 persons per family, with married-couple families (130 | 82.8%) accounting for the largest median family size of 2.4 persons per family. On the other hand, single female/mother families (8 | 5.1%) represent the smallest median family size with 2.13 persons per family.
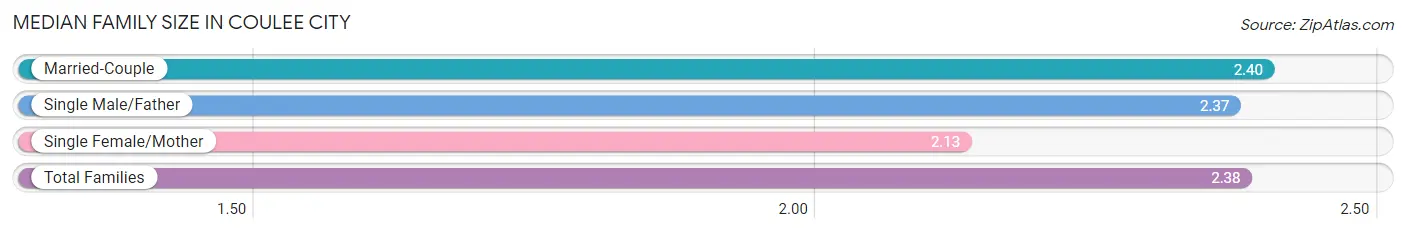
| Family Type | # Families | Family Size |
| Married-Couple | 130 (82.8%) | 2.40 |
| Single Male/Father | 19 (12.1%) | 2.37 |
| Single Female/Mother | 8 (5.1%) | 2.13 |
| Total Families | 157 (100.0%) | 2.38 |
Median Household Size in Coulee City
The median household size in Coulee City is 1.96 persons per household, with married-couple households (130 | 50.6%) accounting for the largest median household size of 2.52 persons per household. non-family households (100 | 38.9%) represent the smallest median household size with 1.13 persons per household.
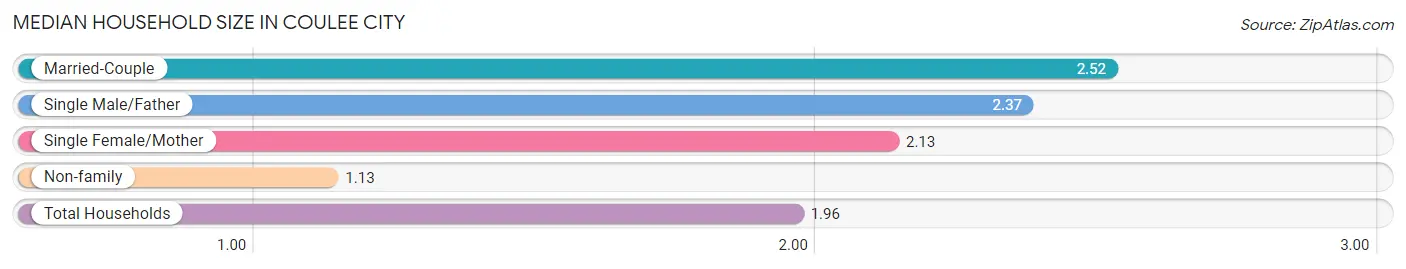
| Household Type | # Households | Household Size |
| Married-Couple | 130 (50.6%) | 2.52 |
| Single Male/Father | 19 (7.4%) | 2.37 |
| Single Female/Mother | 8 (3.1%) | 2.13 |
| Non-family | 100 (38.9%) | 1.13 |
| Total Households | 257 (100.0%) | 1.96 |
Household Size by Marriage Status in Coulee City
Out of a total of 257 households in Coulee City, 157 (61.1%) are family households, while 100 (38.9%) are nonfamily households. The most numerous type of family households are 2-person households, comprising 105, and the most common type of nonfamily households are 1-person households, comprising 87.
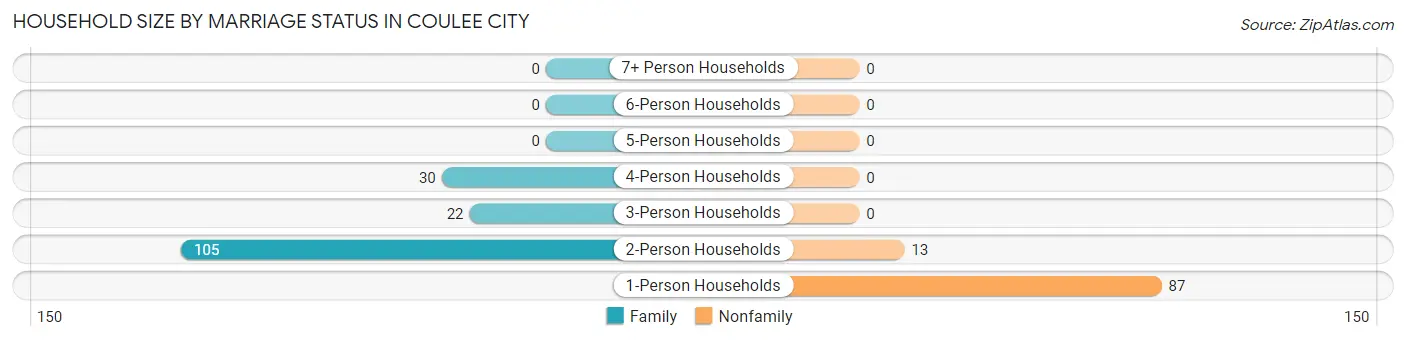
| Household Size | Family Households | Nonfamily Households |
| 1-Person Households | - | 87 (33.9%) |
| 2-Person Households | 105 (40.9%) | 13 (5.1%) |
| 3-Person Households | 22 (8.6%) | 0 (0.0%) |
| 4-Person Households | 30 (11.7%) | 0 (0.0%) |
| 5-Person Households | 0 (0.0%) | 0 (0.0%) |
| 6-Person Households | 0 (0.0%) | 0 (0.0%) |
| 7+ Person Households | 0 (0.0%) | 0 (0.0%) |
| Total | 157 (61.1%) | 100 (38.9%) |
Female Fertility in Coulee City
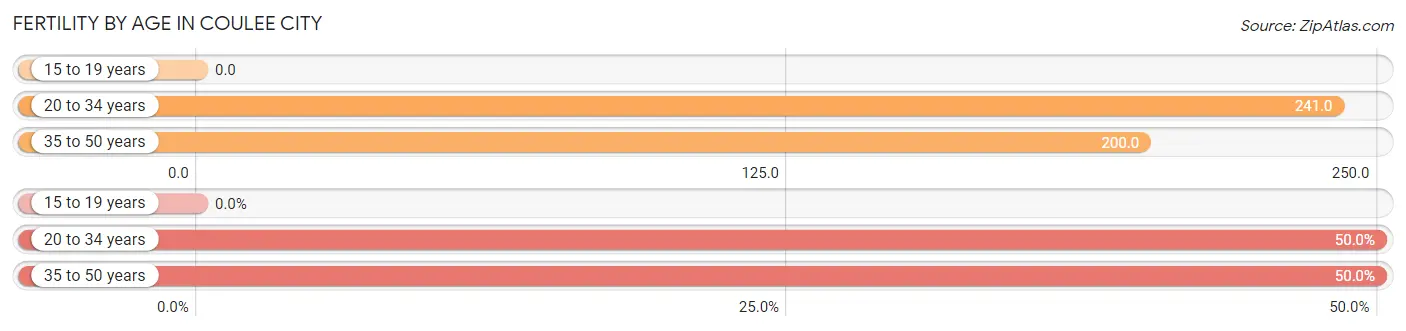
Fertility by Age in Coulee City
Average fertility rate in Coulee City is 219.0 births per 1,000 women. Women in the age bracket of 20 to 34 years have the highest fertility rate with 241.0 births per 1,000 women. Women in the age bracket of 20 to 34 years acount for 50.0% of all women with births.
| Age Bracket | Women with Births | Births / 1,000 Women |
| 15 to 19 years | 0 (0.0%) | 0.0 |
| 20 to 34 years | 7 (50.0%) | 241.0 |
| 35 to 50 years | 7 (50.0%) | 200.0 |
| Total | 14 (100.0%) | 219.0 |
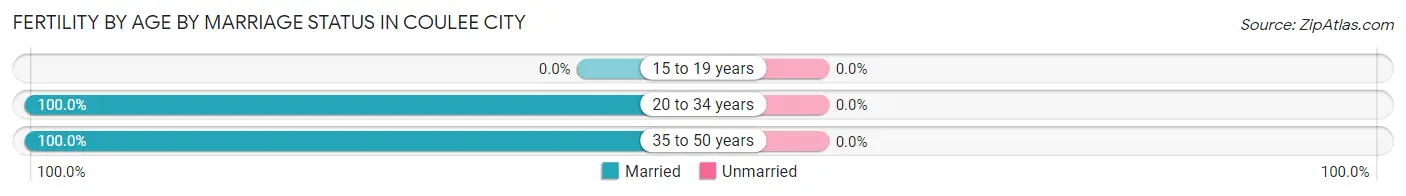
Fertility by Age by Marriage Status in Coulee City
| Age Bracket | Married | Unmarried |
| 15 to 19 years | 0 (0.0%) | 0 (0.0%) |
| 20 to 34 years | 7 (100.0%) | 0 (0.0%) |
| 35 to 50 years | 7 (100.0%) | 0 (0.0%) |
| Total | 14 (100.0%) | 0 (0.0%) |
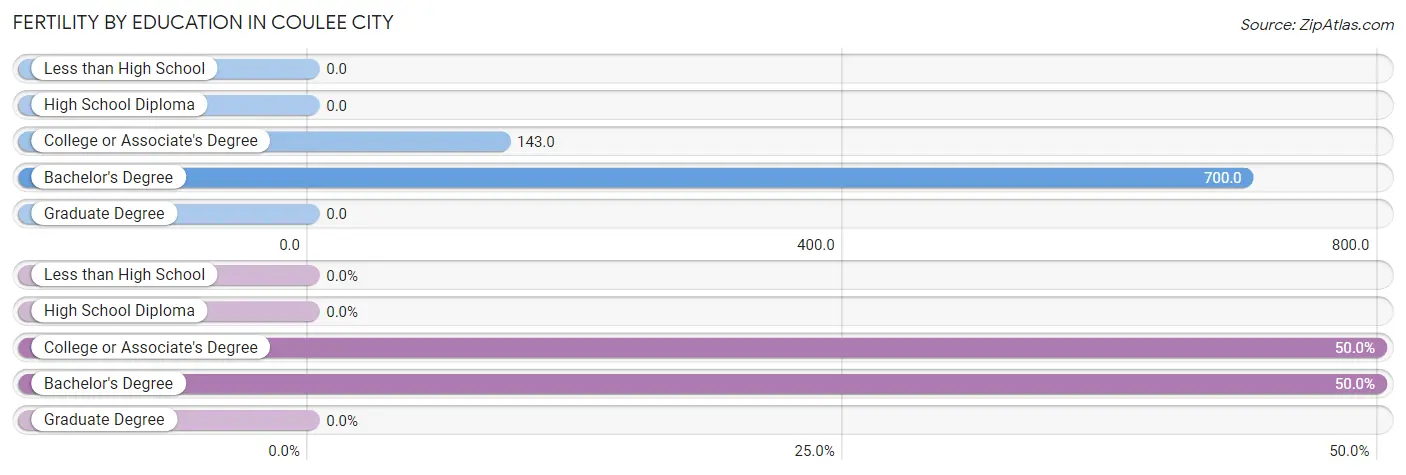
Fertility by Education in Coulee City
| Educational Attainment | Women with Births | Births / 1,000 Women |
| Less than High School | 0 (0.0%) | 0.0 |
| High School Diploma | 0 (0.0%) | 0.0 |
| College or Associate's Degree | 7 (50.0%) | 143.0 |
| Bachelor's Degree | 7 (50.0%) | 700.0 |
| Graduate Degree | 0 (0.0%) | 0.0 |
| Total | 14 (100.0%) | 219.0 |
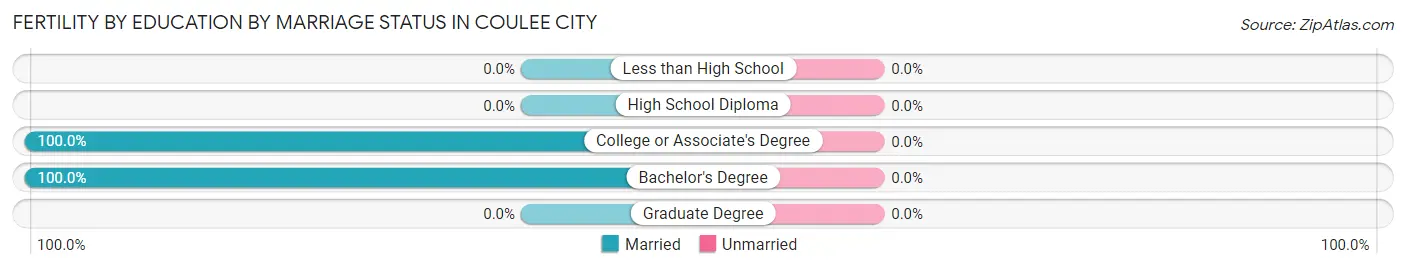
Fertility by Education by Marriage Status in Coulee City
| Educational Attainment | Married | Unmarried |
| Less than High School | 0 (0.0%) | 0 (0.0%) |
| High School Diploma | 0 (0.0%) | 0 (0.0%) |
| College or Associate's Degree | 7 (100.0%) | 0 (0.0%) |
| Bachelor's Degree | 7 (100.0%) | 0 (0.0%) |
| Graduate Degree | 0 (0.0%) | 0 (0.0%) |
| Total | 14 (100.0%) | 0 (0.0%) |
Employment Characteristics in Coulee City
Employment by Class of Employer in Coulee City
Among the 156 employed individuals in Coulee City, private company employees (84 | 53.8%), not-for-profit organizations (20 | 12.8%), and state government employees (15 | 9.6%) make up the most common classes of employment.
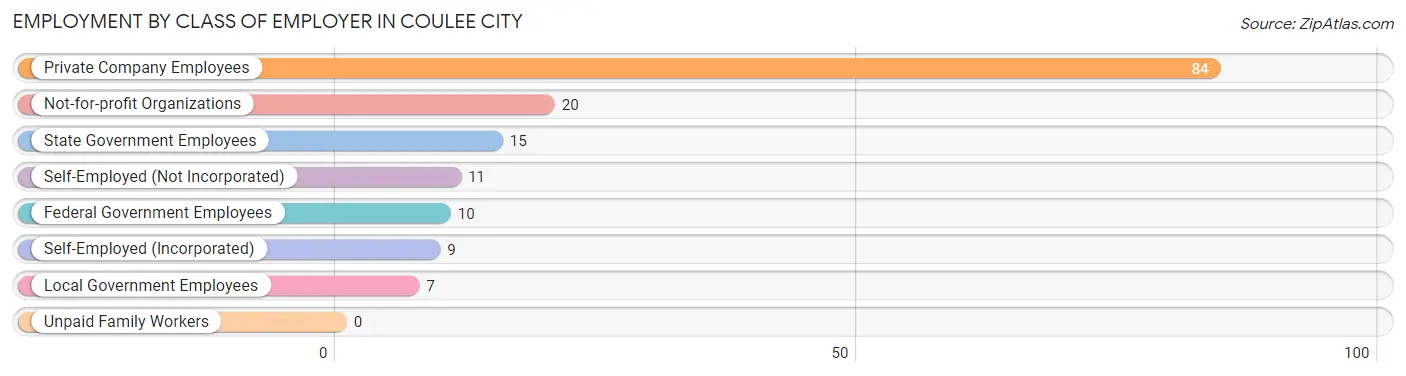
| Employer Class | # Employees | % Employees |
| Private Company Employees | 84 | 53.8% |
| Self-Employed (Incorporated) | 9 | 5.8% |
| Self-Employed (Not Incorporated) | 11 | 7.0% |
| Not-for-profit Organizations | 20 | 12.8% |
| Local Government Employees | 7 | 4.5% |
| State Government Employees | 15 | 9.6% |
| Federal Government Employees | 10 | 6.4% |
| Unpaid Family Workers | 0 | 0.0% |
| Total | 156 | 100.0% |
Employment Status by Age in Coulee City
According to the labor force statistics for Coulee City, out of the total population over 16 years of age (439), 38.7% or 170 individuals are in the labor force, with 8.2% or 14 of them unemployed. The age group with the highest labor force participation rate is 20 to 24 years, with 100.0% or 20 individuals in the labor force. Within the labor force, the 55 to 59 years age range has the highest percentage of unemployed individuals, with 36.0% or 9 of them being unemployed.
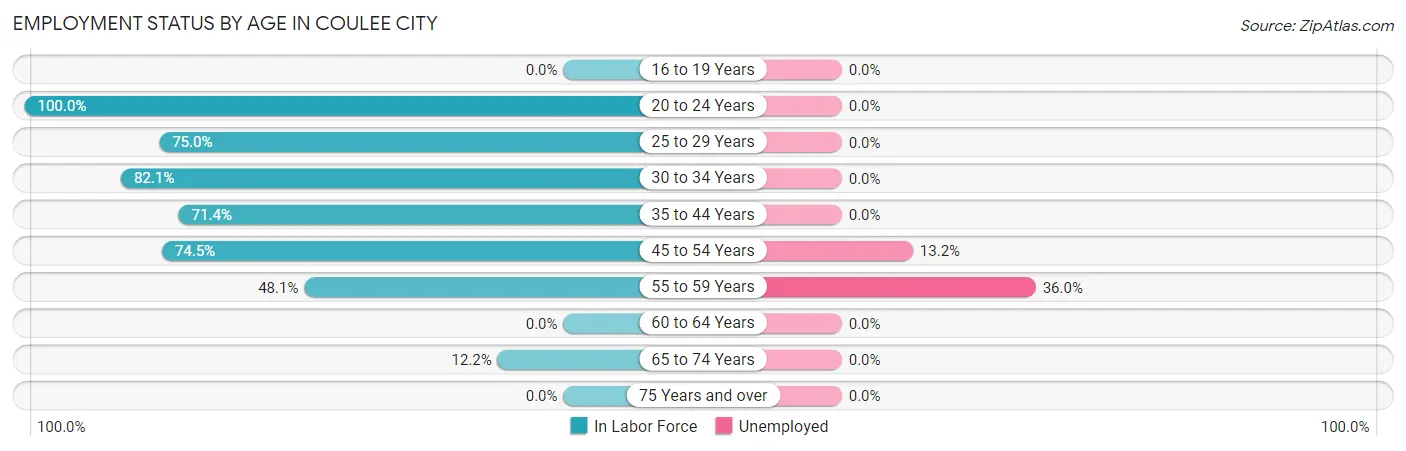
| Age Bracket | In Labor Force | Unemployed |
| 16 to 19 Years | 0 (0.0%) | 0 (0.0%) |
| 20 to 24 Years | 20 (100.0%) | 0 (0.0%) |
| 25 to 29 Years | 15 (75.0%) | 0 (0.0%) |
| 30 to 34 Years | 32 (82.1%) | 0 (0.0%) |
| 35 to 44 Years | 25 (71.4%) | 0 (0.0%) |
| 45 to 54 Years | 38 (74.5%) | 5 (13.2%) |
| 55 to 59 Years | 25 (48.1%) | 9 (36.0%) |
| 60 to 64 Years | 0 (0.0%) | 0 (0.0%) |
| 65 to 74 Years | 15 (12.2%) | 0 (0.0%) |
| 75 Years and over | 0 (0.0%) | 0 (0.0%) |
| Total | 170 (38.7%) | 14 (8.2%) |
Employment Status by Educational Attainment in Coulee City
According to labor force statistics for Coulee City, 68.5% of individuals (135) out of the total population between 25 and 64 years of age (197) are in the labor force, with 10.4% or 14 of them being unemployed. The group with the highest labor force participation rate are those with the educational attainment of high school diploma, with 73.7% or 42 individuals in the labor force. Within the labor force, individuals with high school diploma education have the highest percentage of unemployment, with 21.4% or 9 of them being unemployed.
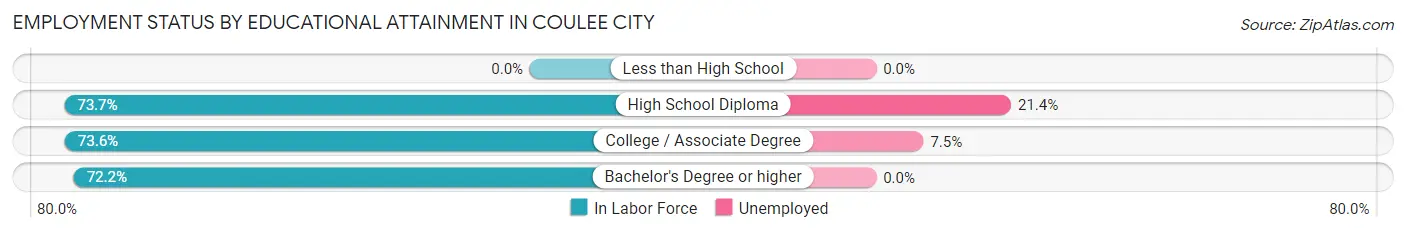
| Educational Attainment | In Labor Force | Unemployed |
| Less than High School | 0 (0.0%) | 0 (0.0%) |
| High School Diploma | 42 (73.7%) | 12 (21.4%) |
| College / Associate Degree | 67 (73.6%) | 7 (7.5%) |
| Bachelor's Degree or higher | 26 (72.2%) | 0 (0.0%) |
| Total | 135 (68.5%) | 20 (10.4%) |
Employment Occupations by Sex in Coulee City
Management, Business, Science and Arts Occupations
The most common Management, Business, Science and Arts occupations in Coulee City are Management (12 | 7.7%), Computers, Engineering & Science (8 | 5.1%), and Computers & Mathematics (8 | 5.1%).
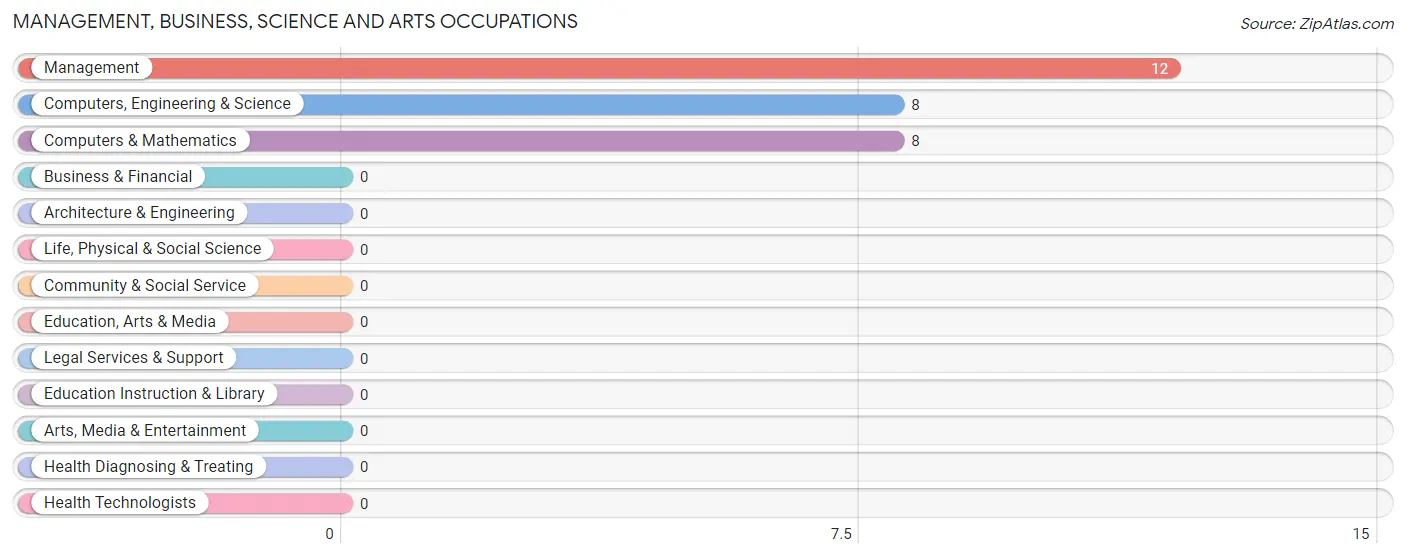
Management, Business, Science and Arts Occupations by Sex
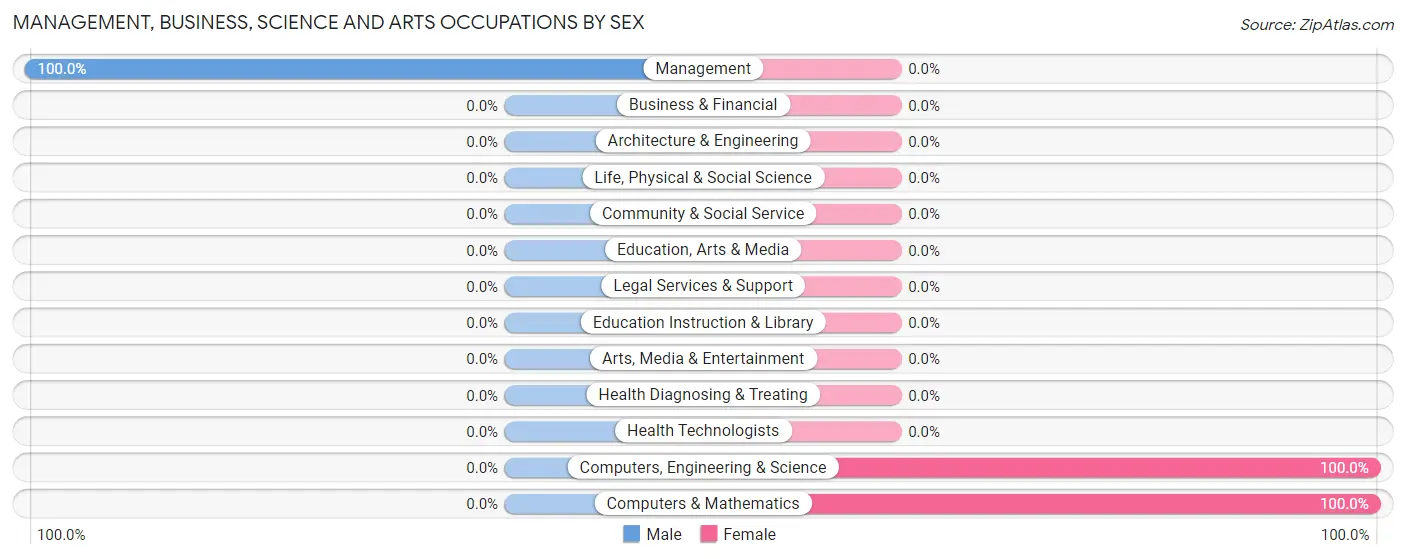
| Occupation | Male | Female |
| Management | 12 (100.0%) | 0 (0.0%) |
| Business & Financial | 0 (0.0%) | 0 (0.0%) |
| Computers, Engineering & Science | 0 (0.0%) | 8 (100.0%) |
| Computers & Mathematics | 0 (0.0%) | 8 (100.0%) |
| Architecture & Engineering | 0 (0.0%) | 0 (0.0%) |
| Life, Physical & Social Science | 0 (0.0%) | 0 (0.0%) |
| Community & Social Service | 0 (0.0%) | 0 (0.0%) |
| Education, Arts & Media | 0 (0.0%) | 0 (0.0%) |
| Legal Services & Support | 0 (0.0%) | 0 (0.0%) |
| Education Instruction & Library | 0 (0.0%) | 0 (0.0%) |
| Arts, Media & Entertainment | 0 (0.0%) | 0 (0.0%) |
| Health Diagnosing & Treating | 0 (0.0%) | 0 (0.0%) |
| Health Technologists | 0 (0.0%) | 0 (0.0%) |
| Total (Category) | 12 (60.0%) | 8 (40.0%) |
| Total (Overall) | 96 (61.5%) | 60 (38.5%) |
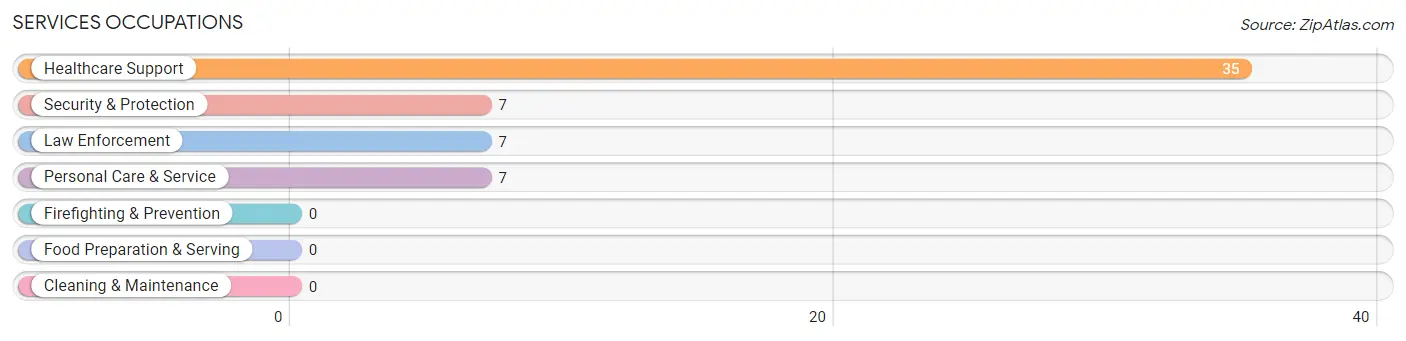
Services Occupations
The most common Services occupations in Coulee City are Healthcare Support (35 | 22.4%), Security & Protection (7 | 4.5%), Law Enforcement (7 | 4.5%), and Personal Care & Service (7 | 4.5%).
Services Occupations by Sex
Within the Services occupations in Coulee City, the most male-oriented occupations are Security & Protection (100.0%), and Law Enforcement (100.0%), while the most female-oriented occupations are Healthcare Support (100.0%), and Personal Care & Service (100.0%).
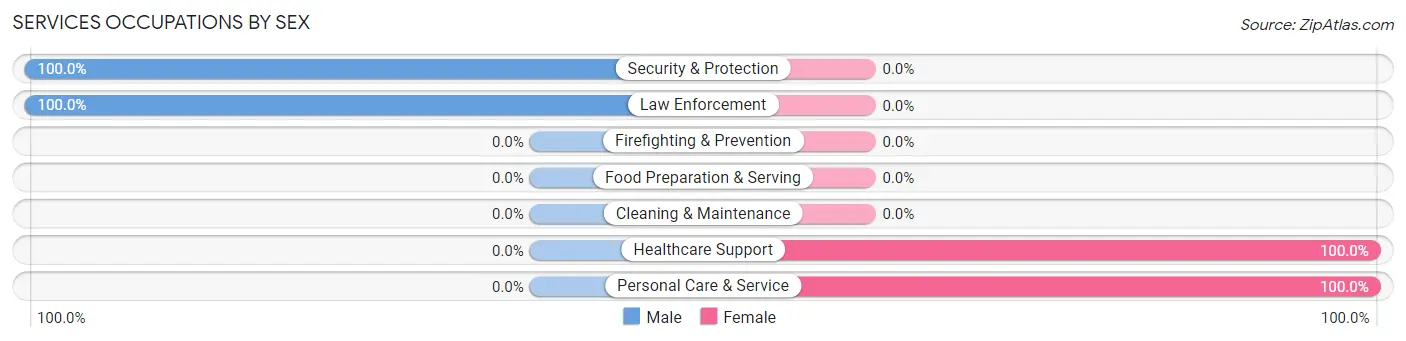
| Occupation | Male | Female |
| Healthcare Support | 0 (0.0%) | 35 (100.0%) |
| Security & Protection | 7 (100.0%) | 0 (0.0%) |
| Firefighting & Prevention | 0 (0.0%) | 0 (0.0%) |
| Law Enforcement | 7 (100.0%) | 0 (0.0%) |
| Food Preparation & Serving | 0 (0.0%) | 0 (0.0%) |
| Cleaning & Maintenance | 0 (0.0%) | 0 (0.0%) |
| Personal Care & Service | 0 (0.0%) | 7 (100.0%) |
| Total (Category) | 7 (14.3%) | 42 (85.7%) |
| Total (Overall) | 96 (61.5%) | 60 (38.5%) |
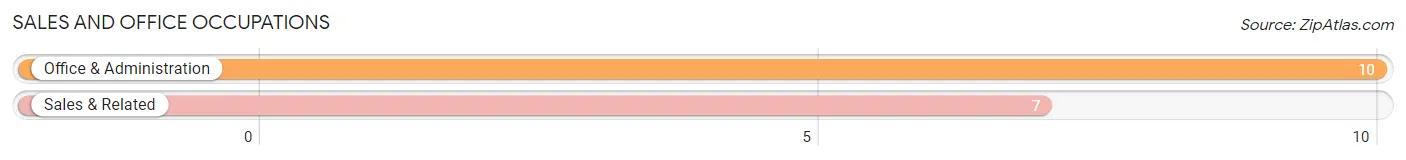
Sales and Office Occupations
The most common Sales and Office occupations in Coulee City are Office & Administration (10 | 6.4%), and Sales & Related (7 | 4.5%).
Sales and Office Occupations by Sex
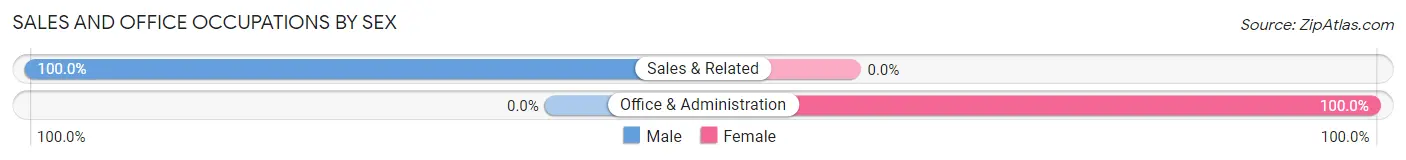
| Occupation | Male | Female |
| Sales & Related | 7 (100.0%) | 0 (0.0%) |
| Office & Administration | 0 (0.0%) | 10 (100.0%) |
| Total (Category) | 7 (41.2%) | 10 (58.8%) |
| Total (Overall) | 96 (61.5%) | 60 (38.5%) |
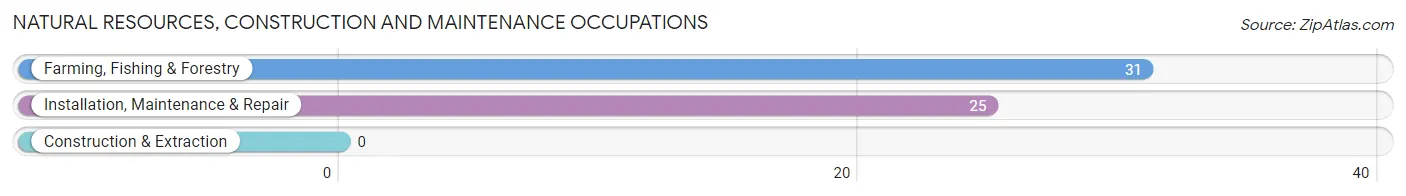
Natural Resources, Construction and Maintenance Occupations
The most common Natural Resources, Construction and Maintenance occupations in Coulee City are Farming, Fishing & Forestry (31 | 19.9%), and Installation, Maintenance & Repair (25 | 16.0%).
Natural Resources, Construction and Maintenance Occupations by Sex
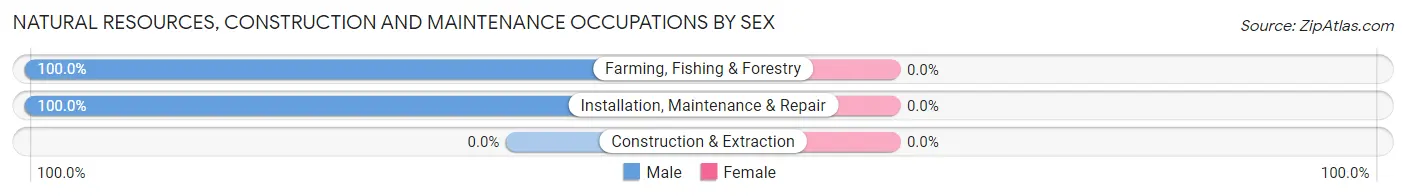
| Occupation | Male | Female |
| Farming, Fishing & Forestry | 31 (100.0%) | 0 (0.0%) |
| Construction & Extraction | 0 (0.0%) | 0 (0.0%) |
| Installation, Maintenance & Repair | 25 (100.0%) | 0 (0.0%) |
| Total (Category) | 56 (100.0%) | 0 (0.0%) |
| Total (Overall) | 96 (61.5%) | 60 (38.5%) |
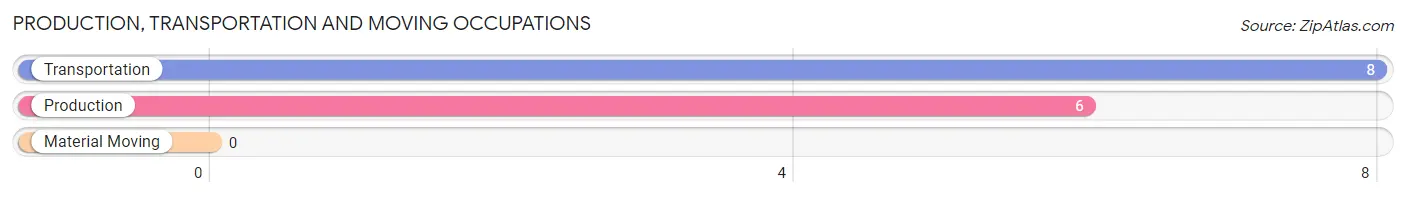
Production, Transportation and Moving Occupations
The most common Production, Transportation and Moving occupations in Coulee City are Transportation (8 | 5.1%), and Production (6 | 3.8%).
Production, Transportation and Moving Occupations by Sex
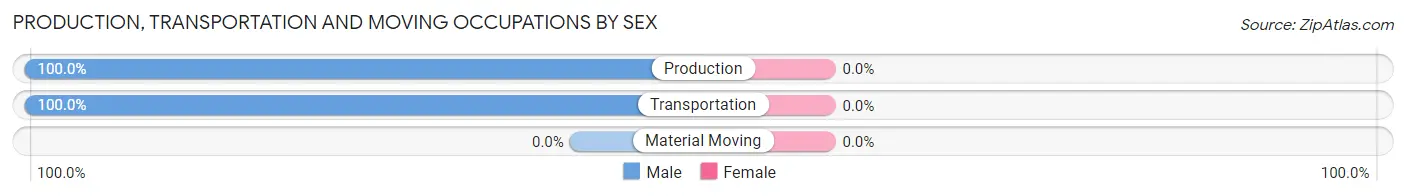
| Occupation | Male | Female |
| Production | 6 (100.0%) | 0 (0.0%) |
| Transportation | 8 (100.0%) | 0 (0.0%) |
| Material Moving | 0 (0.0%) | 0 (0.0%) |
| Total (Category) | 14 (100.0%) | 0 (0.0%) |
| Total (Overall) | 96 (61.5%) | 60 (38.5%) |
Employment Industries by Sex in Coulee City
Employment Industries in Coulee City
The major employment industries in Coulee City include Health Care & Social Assistance (50 | 32.1%), Agriculture, Fishing & Hunting (35 | 22.4%), Construction (17 | 10.9%), Retail Trade (17 | 10.9%), and Transportation & Warehousing (10 | 6.4%).
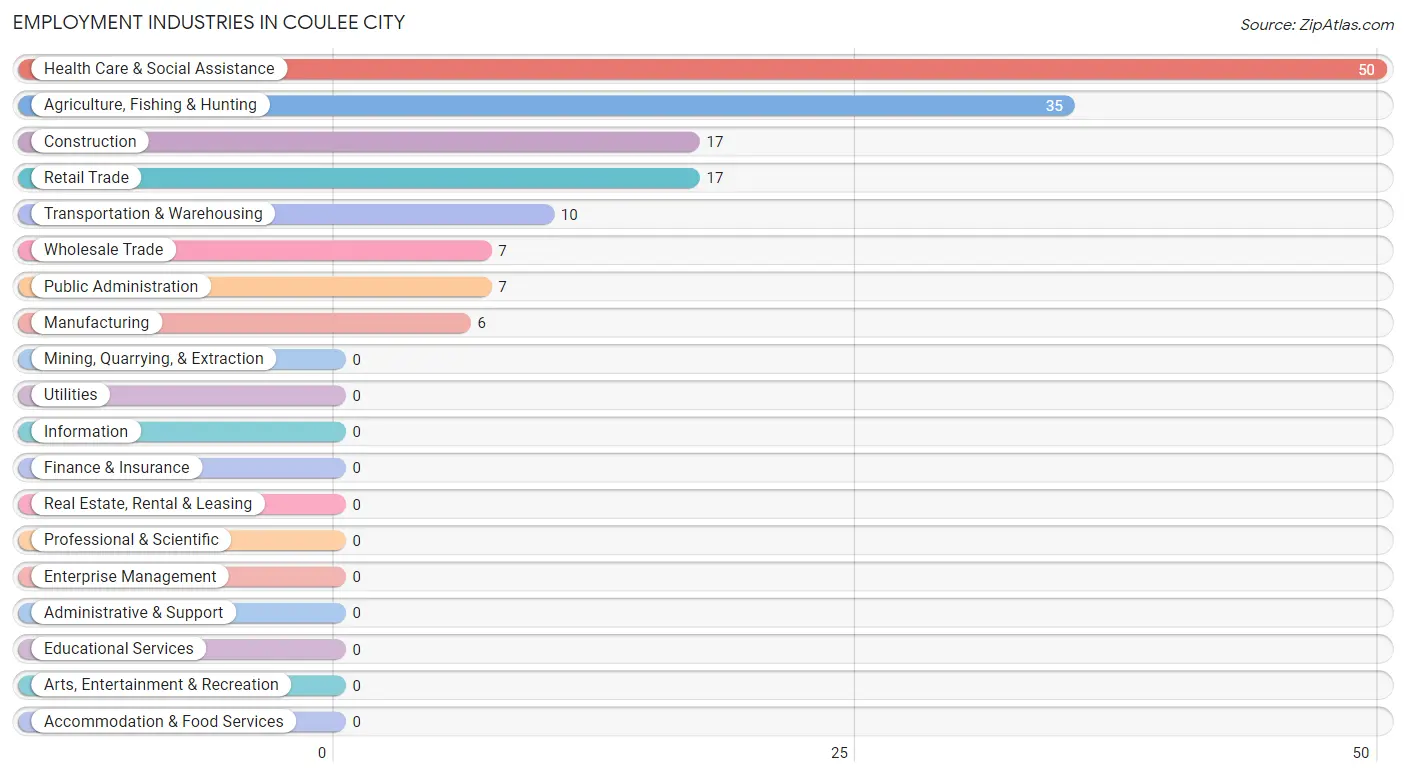
Employment Industries by Sex in Coulee City
The Coulee City industries that see more men than women are Agriculture, Fishing & Hunting (100.0%), Construction (100.0%), and Manufacturing (100.0%), whereas the industries that tend to have a higher number of women are Transportation & Warehousing (100.0%), and Health Care & Social Assistance (100.0%).
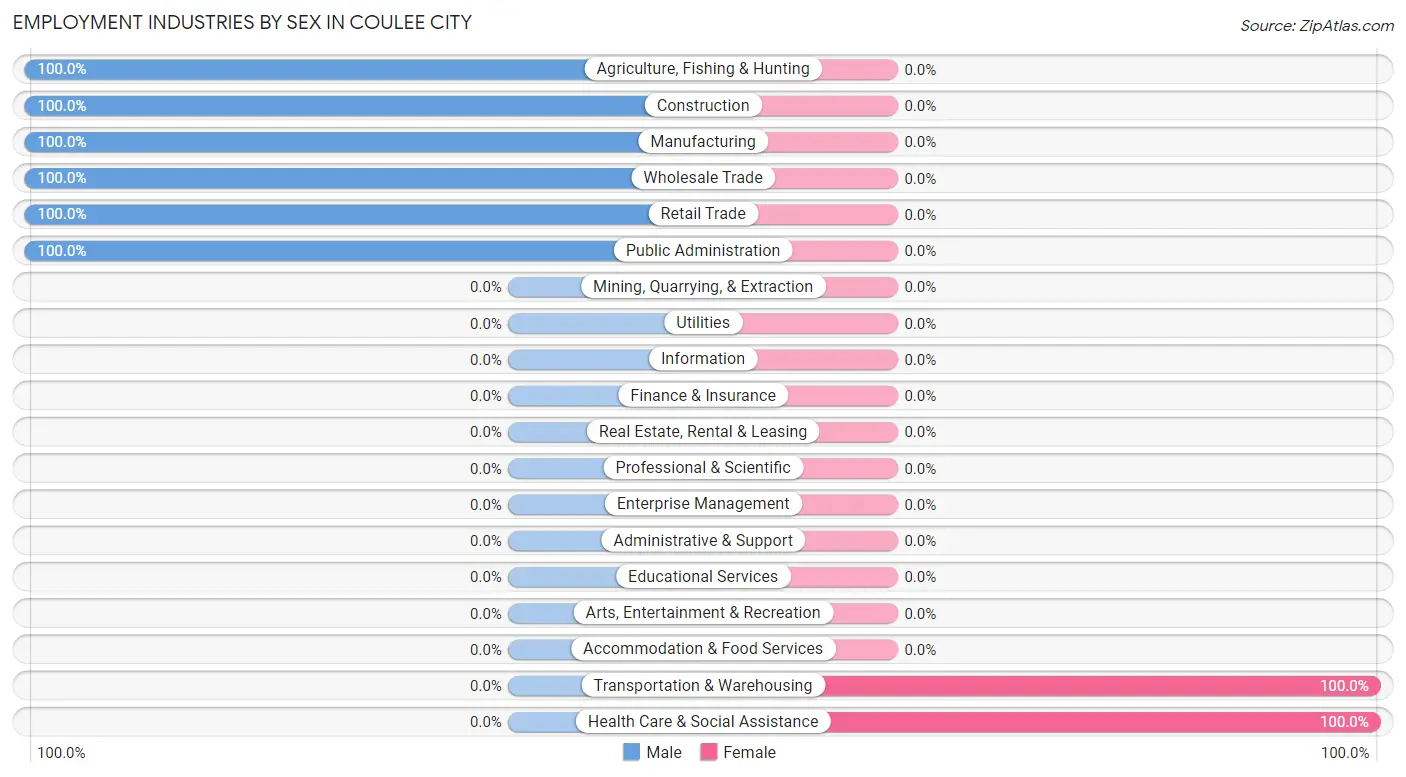
| Industry | Male | Female |
| Agriculture, Fishing & Hunting | 35 (100.0%) | 0 (0.0%) |
| Mining, Quarrying, & Extraction | 0 (0.0%) | 0 (0.0%) |
| Construction | 17 (100.0%) | 0 (0.0%) |
| Manufacturing | 6 (100.0%) | 0 (0.0%) |
| Wholesale Trade | 7 (100.0%) | 0 (0.0%) |
| Retail Trade | 17 (100.0%) | 0 (0.0%) |
| Transportation & Warehousing | 0 (0.0%) | 10 (100.0%) |
| Utilities | 0 (0.0%) | 0 (0.0%) |
| Information | 0 (0.0%) | 0 (0.0%) |
| Finance & Insurance | 0 (0.0%) | 0 (0.0%) |
| Real Estate, Rental & Leasing | 0 (0.0%) | 0 (0.0%) |
| Professional & Scientific | 0 (0.0%) | 0 (0.0%) |
| Enterprise Management | 0 (0.0%) | 0 (0.0%) |
| Administrative & Support | 0 (0.0%) | 0 (0.0%) |
| Educational Services | 0 (0.0%) | 0 (0.0%) |
| Health Care & Social Assistance | 0 (0.0%) | 50 (100.0%) |
| Arts, Entertainment & Recreation | 0 (0.0%) | 0 (0.0%) |
| Accommodation & Food Services | 0 (0.0%) | 0 (0.0%) |
| Public Administration | 7 (100.0%) | 0 (0.0%) |
| Total | 96 (61.5%) | 60 (38.5%) |
Education in Coulee City
School Enrollment in Coulee City
The most common levels of schooling among the 35 students in Coulee City are middle school (19 | 54.3%), and elementary school (16 | 45.7%).
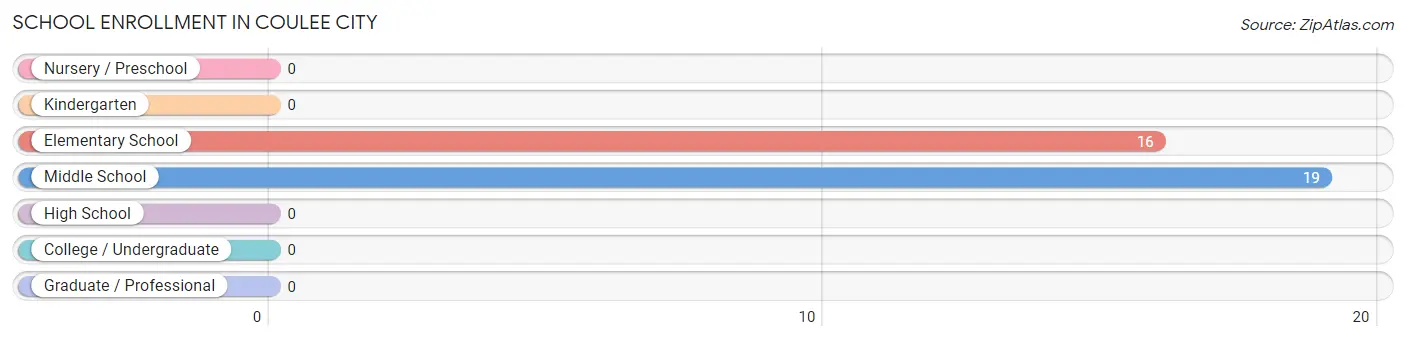
| School Level | # Students | % Students |
| Nursery / Preschool | 0 | 0.0% |
| Kindergarten | 0 | 0.0% |
| Elementary School | 16 | 45.7% |
| Middle School | 19 | 54.3% |
| High School | 0 | 0.0% |
| College / Undergraduate | 0 | 0.0% |
| Graduate / Professional | 0 | 0.0% |
| Total | 35 | 100.0% |
School Enrollment by Age by Funding Source in Coulee City
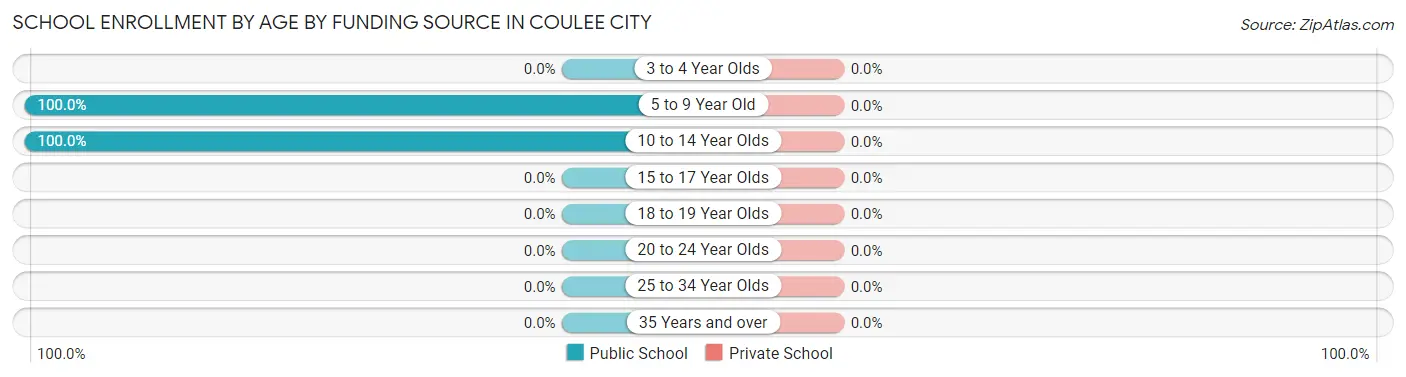
| Age Bracket | Public School | Private School |
| 3 to 4 Year Olds | 0 (0.0%) | 0 (0.0%) |
| 5 to 9 Year Old | 16 (100.0%) | 0 (0.0%) |
| 10 to 14 Year Olds | 19 (100.0%) | 0 (0.0%) |
| 15 to 17 Year Olds | 0 (0.0%) | 0 (0.0%) |
| 18 to 19 Year Olds | 0 (0.0%) | 0 (0.0%) |
| 20 to 24 Year Olds | 0 (0.0%) | 0 (0.0%) |
| 25 to 34 Year Olds | 0 (0.0%) | 0 (0.0%) |
| 35 Years and over | 0 (0.0%) | 0 (0.0%) |
| Total | 35 (100.0%) | 0 (0.0%) |
Educational Attainment by Field of Study in Coulee City
Education (13 | 25.0%), arts & humanities (10 | 19.2%), computers & mathematics (8 | 15.4%), liberal arts & history (7 | 13.5%), and communications (7 | 13.5%) are the most common fields of study among 52 individuals in Coulee City who have obtained a bachelor's degree or higher.
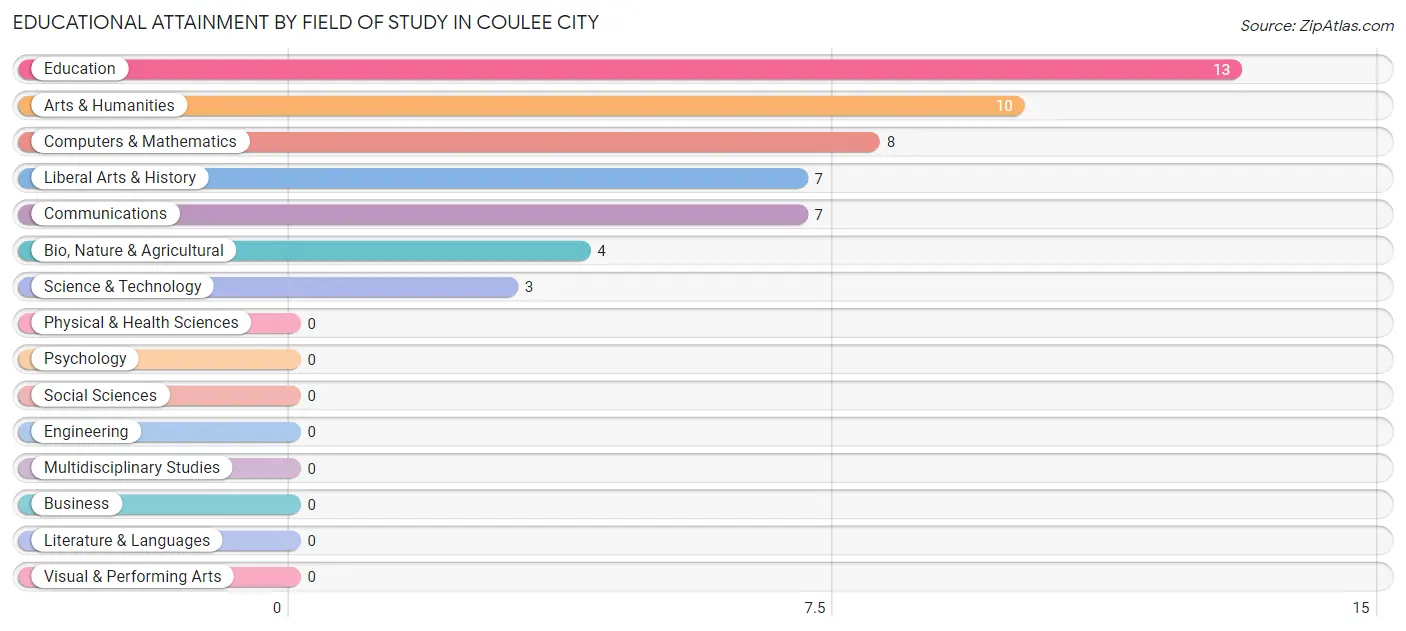
| Field of Study | # Graduates | % Graduates |
| Computers & Mathematics | 8 | 15.4% |
| Bio, Nature & Agricultural | 4 | 7.7% |
| Physical & Health Sciences | 0 | 0.0% |
| Psychology | 0 | 0.0% |
| Social Sciences | 0 | 0.0% |
| Engineering | 0 | 0.0% |
| Multidisciplinary Studies | 0 | 0.0% |
| Science & Technology | 3 | 5.8% |
| Business | 0 | 0.0% |
| Education | 13 | 25.0% |
| Literature & Languages | 0 | 0.0% |
| Liberal Arts & History | 7 | 13.5% |
| Visual & Performing Arts | 0 | 0.0% |
| Communications | 7 | 13.5% |
| Arts & Humanities | 10 | 19.2% |
| Total | 52 | 100.0% |
Transportation & Commute in Coulee City
Vehicle Availability by Sex in Coulee City
The most prevalent vehicle ownership categories in Coulee City are males with 2 vehicles (51, accounting for 53.1%) and females with 2 vehicles (37, making up 85.0%).
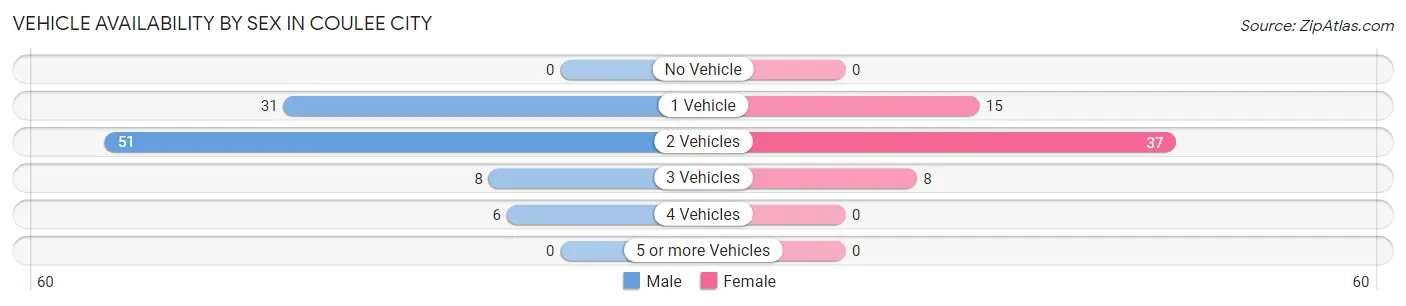
| Vehicles Available | Male | Female |
| No Vehicle | 0 (0.0%) | 0 (0.0%) |
| 1 Vehicle | 31 (32.3%) | 15 (25.0%) |
| 2 Vehicles | 51 (53.1%) | 37 (61.7%) |
| 3 Vehicles | 8 (8.3%) | 8 (13.3%) |
| 4 Vehicles | 6 (6.2%) | 0 (0.0%) |
| 5 or more Vehicles | 0 (0.0%) | 0 (0.0%) |
| Total | 96 (100.0%) | 60 (100.0%) |
Commute Time in Coulee City
The most frequently occuring commute durations in Coulee City are 5 to 9 minutes (38 commuters, 25.5%), 30 to 34 minutes (30 commuters, 20.1%), and less than 5 minutes (26 commuters, 17.4%).
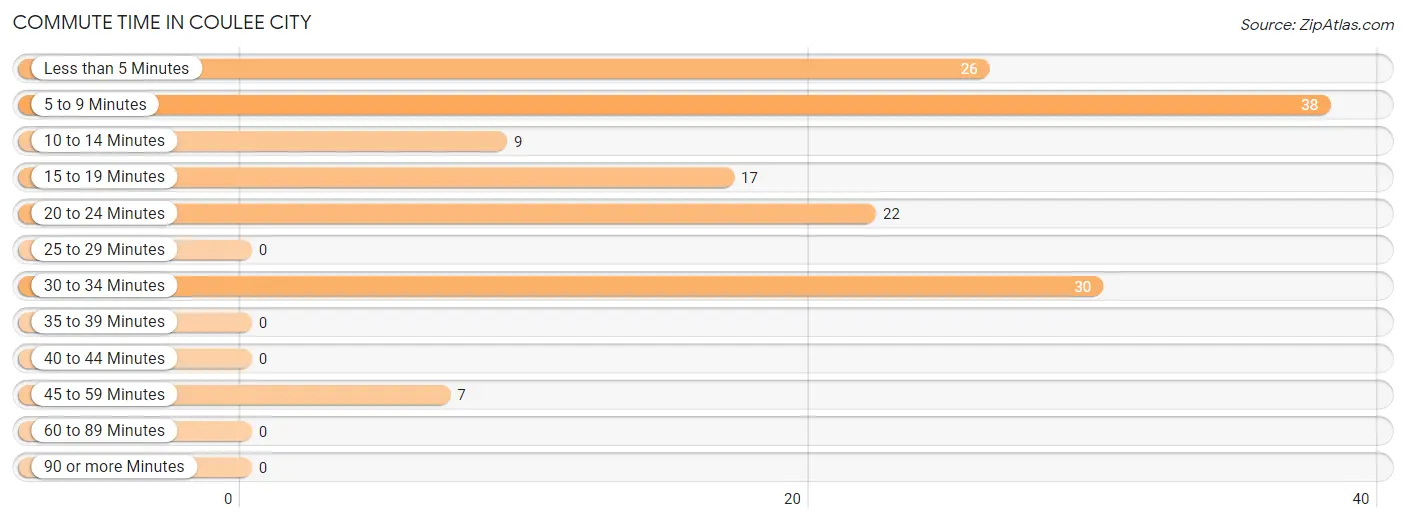
| Commute Time | # Commuters | % Commuters |
| Less than 5 Minutes | 26 | 17.4% |
| 5 to 9 Minutes | 38 | 25.5% |
| 10 to 14 Minutes | 9 | 6.0% |
| 15 to 19 Minutes | 17 | 11.4% |
| 20 to 24 Minutes | 22 | 14.8% |
| 25 to 29 Minutes | 0 | 0.0% |
| 30 to 34 Minutes | 30 | 20.1% |
| 35 to 39 Minutes | 0 | 0.0% |
| 40 to 44 Minutes | 0 | 0.0% |
| 45 to 59 Minutes | 7 | 4.7% |
| 60 to 89 Minutes | 0 | 0.0% |
| 90 or more Minutes | 0 | 0.0% |
Commute Time by Sex in Coulee City
The most common commute times in Coulee City are less than 5 minutes (26 commuters, 27.1%) for males and 30 to 34 minutes (30 commuters, 56.6%) for females.
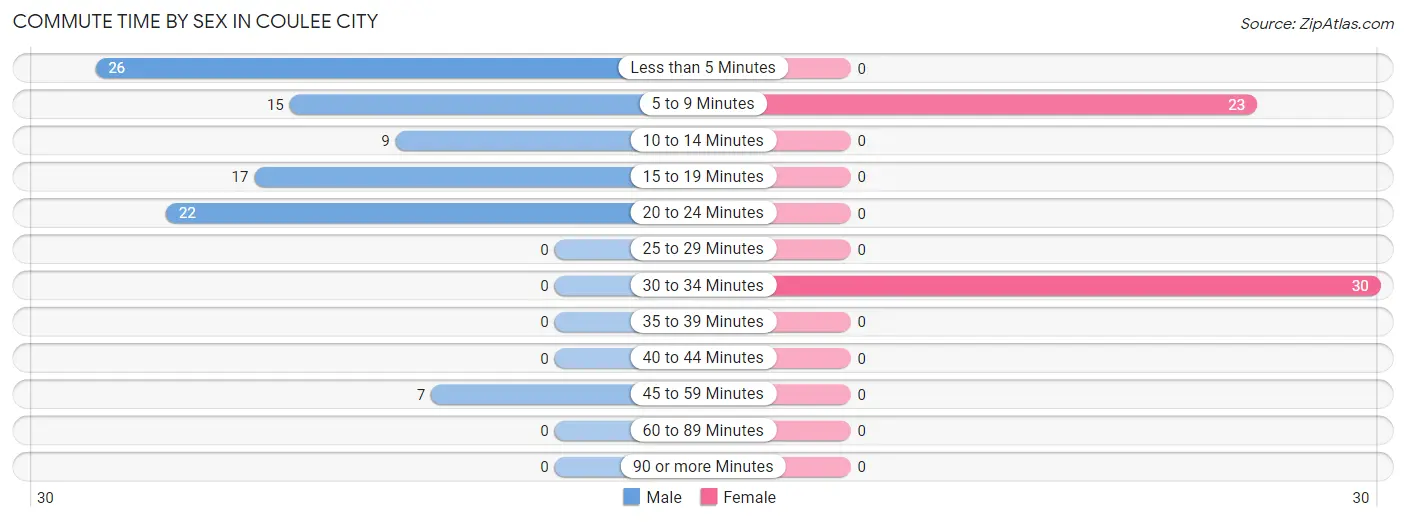
| Commute Time | Male | Female |
| Less than 5 Minutes | 26 (27.1%) | 0 (0.0%) |
| 5 to 9 Minutes | 15 (15.6%) | 23 (43.4%) |
| 10 to 14 Minutes | 9 (9.4%) | 0 (0.0%) |
| 15 to 19 Minutes | 17 (17.7%) | 0 (0.0%) |
| 20 to 24 Minutes | 22 (22.9%) | 0 (0.0%) |
| 25 to 29 Minutes | 0 (0.0%) | 0 (0.0%) |
| 30 to 34 Minutes | 0 (0.0%) | 30 (56.6%) |
| 35 to 39 Minutes | 0 (0.0%) | 0 (0.0%) |
| 40 to 44 Minutes | 0 (0.0%) | 0 (0.0%) |
| 45 to 59 Minutes | 7 (7.3%) | 0 (0.0%) |
| 60 to 89 Minutes | 0 (0.0%) | 0 (0.0%) |
| 90 or more Minutes | 0 (0.0%) | 0 (0.0%) |
Time of Departure to Work by Sex in Coulee City
The most frequent times of departure to work in Coulee City are 6:00 AM to 6:29 AM (69, 71.9%) for males and 7:00 AM to 7:29 AM (20, 37.7%) for females.
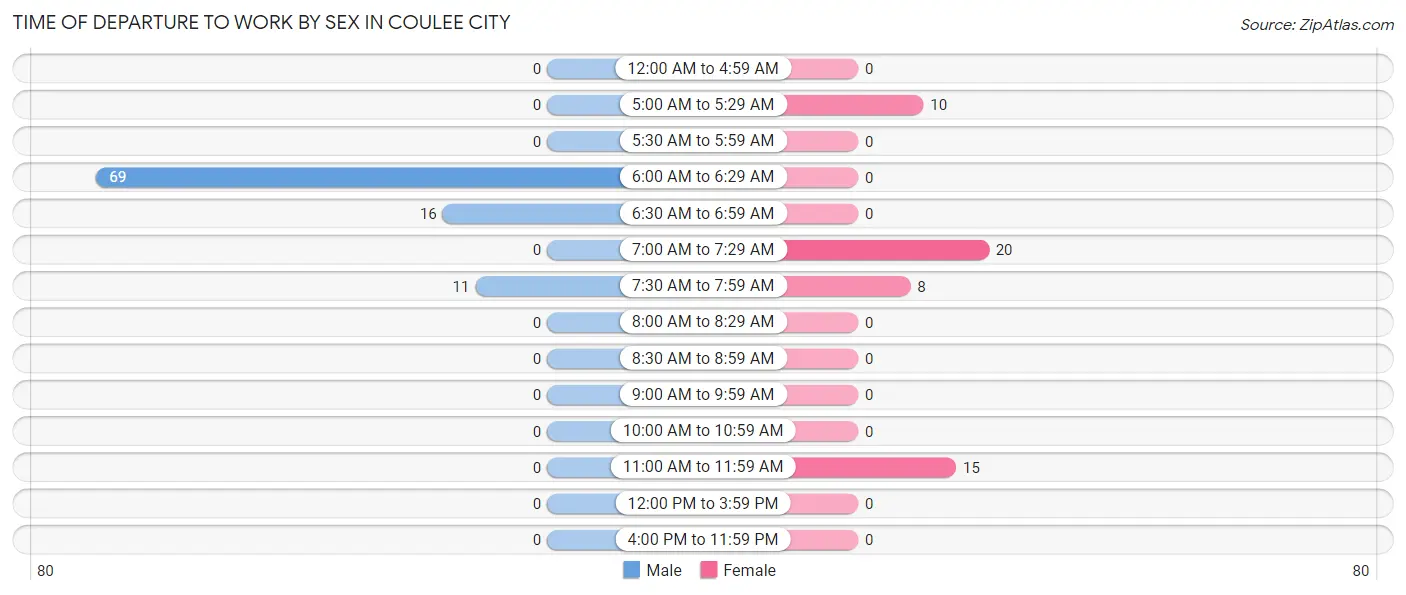
| Time of Departure | Male | Female |
| 12:00 AM to 4:59 AM | 0 (0.0%) | 0 (0.0%) |
| 5:00 AM to 5:29 AM | 0 (0.0%) | 10 (18.9%) |
| 5:30 AM to 5:59 AM | 0 (0.0%) | 0 (0.0%) |
| 6:00 AM to 6:29 AM | 69 (71.9%) | 0 (0.0%) |
| 6:30 AM to 6:59 AM | 16 (16.7%) | 0 (0.0%) |
| 7:00 AM to 7:29 AM | 0 (0.0%) | 20 (37.7%) |
| 7:30 AM to 7:59 AM | 11 (11.5%) | 8 (15.1%) |
| 8:00 AM to 8:29 AM | 0 (0.0%) | 0 (0.0%) |
| 8:30 AM to 8:59 AM | 0 (0.0%) | 0 (0.0%) |
| 9:00 AM to 9:59 AM | 0 (0.0%) | 0 (0.0%) |
| 10:00 AM to 10:59 AM | 0 (0.0%) | 0 (0.0%) |
| 11:00 AM to 11:59 AM | 0 (0.0%) | 15 (28.3%) |
| 12:00 PM to 3:59 PM | 0 (0.0%) | 0 (0.0%) |
| 4:00 PM to 11:59 PM | 0 (0.0%) | 0 (0.0%) |
| Total | 96 (100.0%) | 53 (100.0%) |
Housing Occupancy in Coulee City
Occupancy by Ownership in Coulee City
Of the total 257 dwellings in Coulee City, owner-occupied units account for 207 (80.5%), while renter-occupied units make up 50 (19.5%).
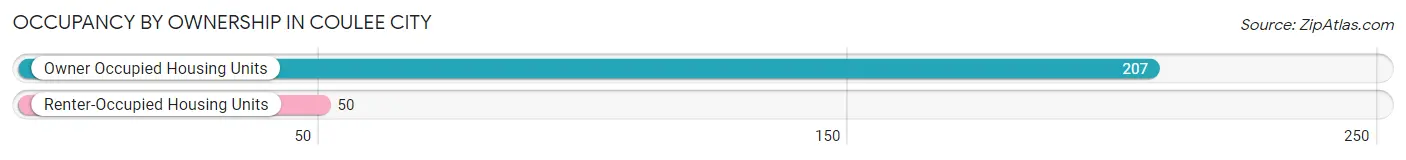
| Occupancy | # Housing Units | % Housing Units |
| Owner Occupied Housing Units | 207 | 80.5% |
| Renter-Occupied Housing Units | 50 | 19.5% |
| Total Occupied Housing Units | 257 | 100.0% |
Occupancy by Household Size in Coulee City
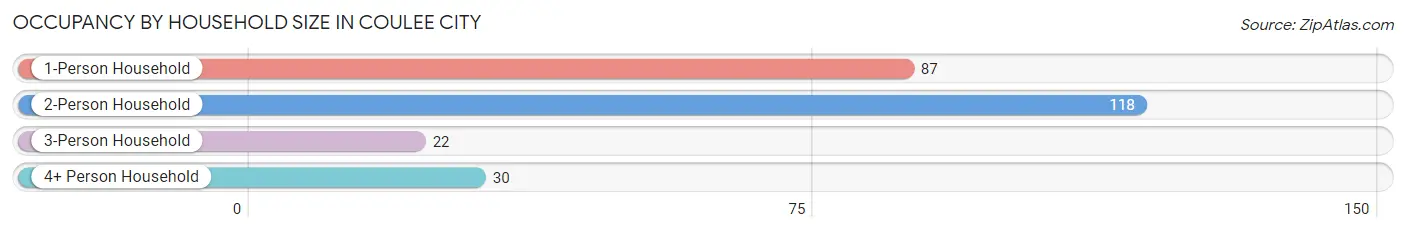
| Household Size | # Housing Units | % Housing Units |
| 1-Person Household | 87 | 33.9% |
| 2-Person Household | 118 | 45.9% |
| 3-Person Household | 22 | 8.6% |
| 4+ Person Household | 30 | 11.7% |
| Total Housing Units | 257 | 100.0% |
Occupancy by Ownership by Household Size in Coulee City
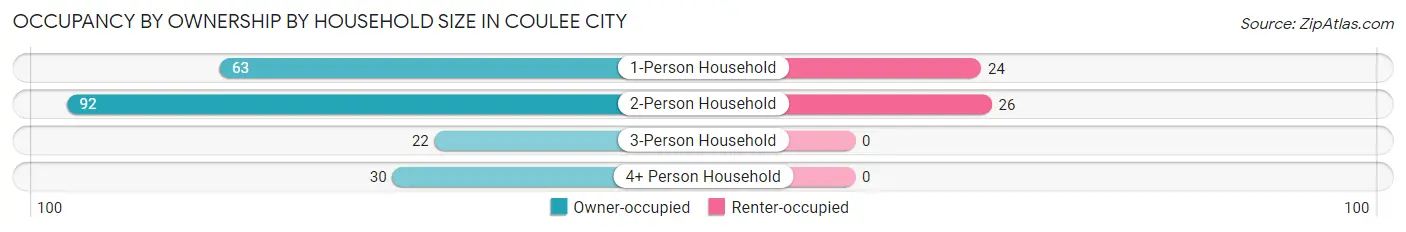
| Household Size | Owner-occupied | Renter-occupied |
| 1-Person Household | 63 (72.4%) | 24 (27.6%) |
| 2-Person Household | 92 (78.0%) | 26 (22.0%) |
| 3-Person Household | 22 (100.0%) | 0 (0.0%) |
| 4+ Person Household | 30 (100.0%) | 0 (0.0%) |
| Total Housing Units | 207 (80.5%) | 50 (19.5%) |
Occupancy by Educational Attainment in Coulee City
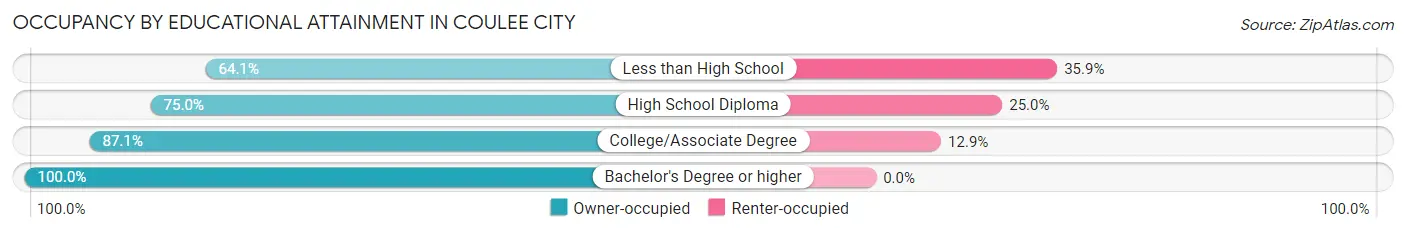
| Household Size | Owner-occupied | Renter-occupied |
| Less than High School | 25 (64.1%) | 14 (35.9%) |
| High School Diploma | 57 (75.0%) | 19 (25.0%) |
| College/Associate Degree | 115 (87.1%) | 17 (12.9%) |
| Bachelor's Degree or higher | 10 (100.0%) | 0 (0.0%) |
Occupancy by Age of Householder in Coulee City
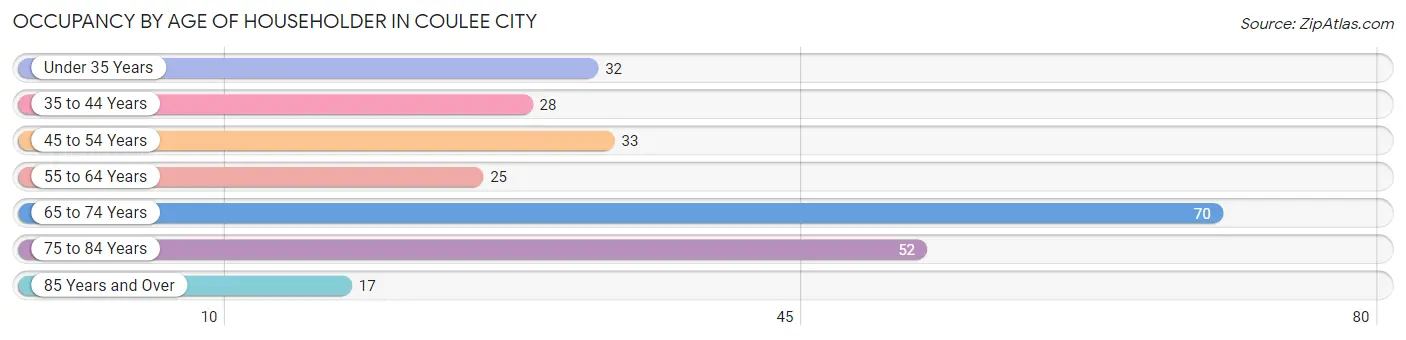
| Age Bracket | # Households | % Households |
| Under 35 Years | 32 | 12.4% |
| 35 to 44 Years | 28 | 10.9% |
| 45 to 54 Years | 33 | 12.8% |
| 55 to 64 Years | 25 | 9.7% |
| 65 to 74 Years | 70 | 27.2% |
| 75 to 84 Years | 52 | 20.2% |
| 85 Years and Over | 17 | 6.6% |
| Total | 257 | 100.0% |
Housing Finances in Coulee City
Median Income by Occupancy in Coulee City
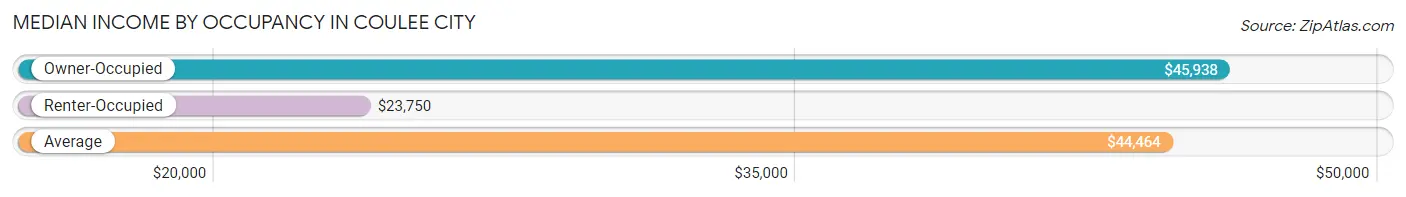
| Occupancy Type | # Households | Median Income |
| Owner-Occupied | 207 (80.5%) | $45,938 |
| Renter-Occupied | 50 (19.5%) | $23,750 |
| Average | 257 (100.0%) | $44,464 |
Occupancy by Householder Income Bracket in Coulee City
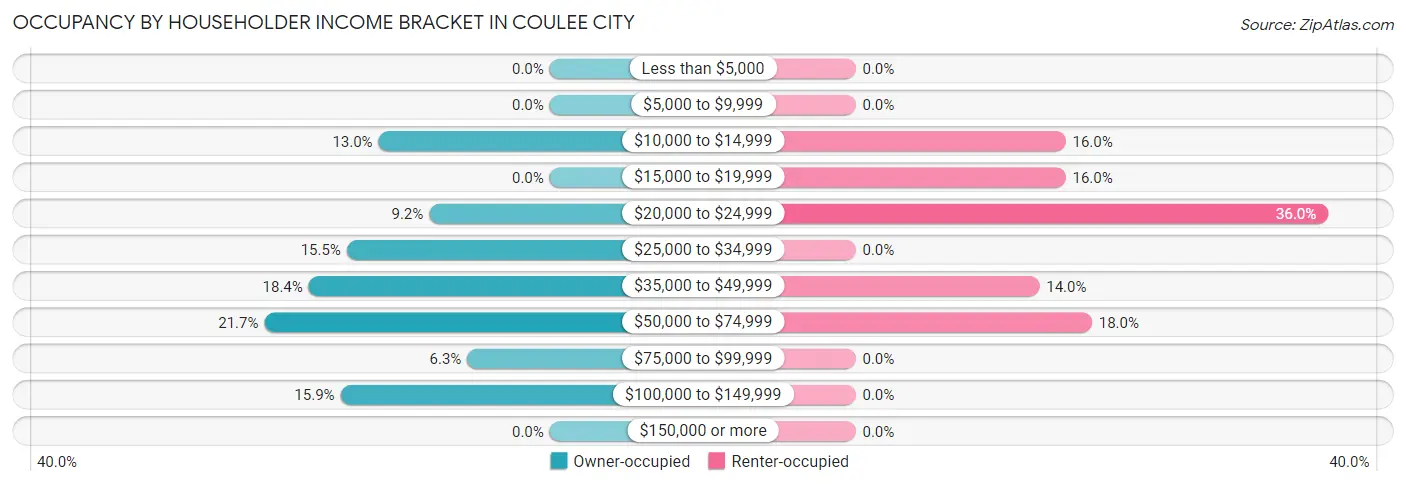
| Income Bracket | Owner-occupied | Renter-occupied |
| Less than $5,000 | 0 (0.0%) | 0 (0.0%) |
| $5,000 to $9,999 | 0 (0.0%) | 0 (0.0%) |
| $10,000 to $14,999 | 27 (13.0%) | 8 (16.0%) |
| $15,000 to $19,999 | 0 (0.0%) | 8 (16.0%) |
| $20,000 to $24,999 | 19 (9.2%) | 18 (36.0%) |
| $25,000 to $34,999 | 32 (15.5%) | 0 (0.0%) |
| $35,000 to $49,999 | 38 (18.4%) | 7 (14.0%) |
| $50,000 to $74,999 | 45 (21.7%) | 9 (18.0%) |
| $75,000 to $99,999 | 13 (6.3%) | 0 (0.0%) |
| $100,000 to $149,999 | 33 (15.9%) | 0 (0.0%) |
| $150,000 or more | 0 (0.0%) | 0 (0.0%) |
| Total | 207 (100.0%) | 50 (100.0%) |
Monthly Housing Cost Tiers in Coulee City
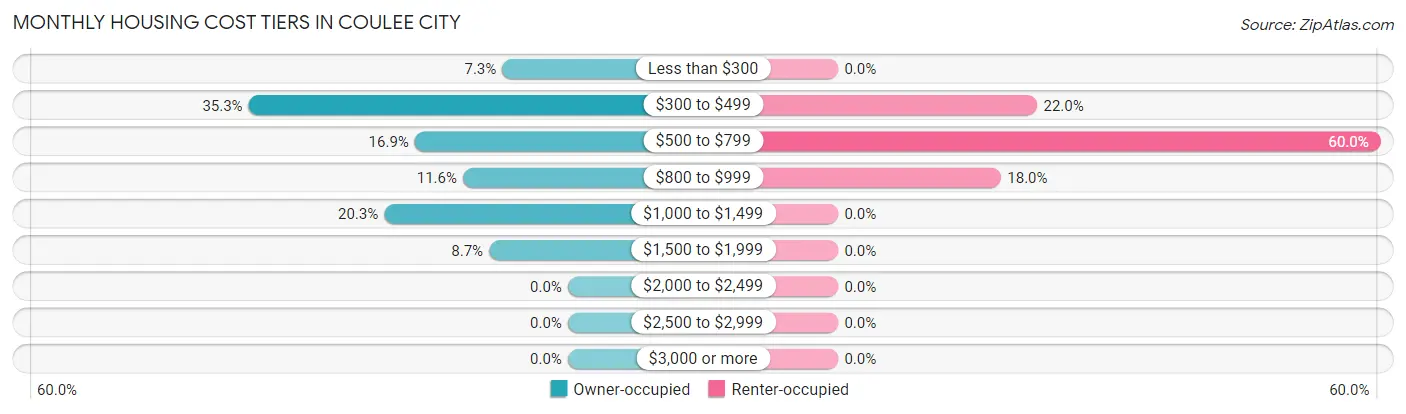
| Monthly Cost | Owner-occupied | Renter-occupied |
| Less than $300 | 15 (7.2%) | 0 (0.0%) |
| $300 to $499 | 73 (35.3%) | 11 (22.0%) |
| $500 to $799 | 35 (16.9%) | 30 (60.0%) |
| $800 to $999 | 24 (11.6%) | 9 (18.0%) |
| $1,000 to $1,499 | 42 (20.3%) | 0 (0.0%) |
| $1,500 to $1,999 | 18 (8.7%) | 0 (0.0%) |
| $2,000 to $2,499 | 0 (0.0%) | 0 (0.0%) |
| $2,500 to $2,999 | 0 (0.0%) | 0 (0.0%) |
| $3,000 or more | 0 (0.0%) | 0 (0.0%) |
| Total | 207 (100.0%) | 50 (100.0%) |
Physical Housing Characteristics in Coulee City
Housing Structures in Coulee City
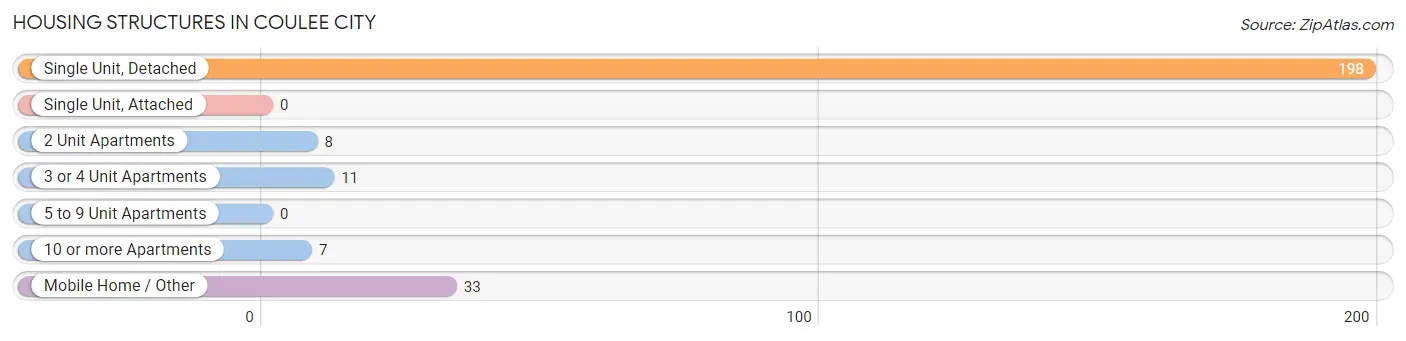
| Structure Type | # Housing Units | % Housing Units |
| Single Unit, Detached | 198 | 77.0% |
| Single Unit, Attached | 0 | 0.0% |
| 2 Unit Apartments | 8 | 3.1% |
| 3 or 4 Unit Apartments | 11 | 4.3% |
| 5 to 9 Unit Apartments | 0 | 0.0% |
| 10 or more Apartments | 7 | 2.7% |
| Mobile Home / Other | 33 | 12.8% |
| Total | 257 | 100.0% |
Housing Structures by Occupancy in Coulee City
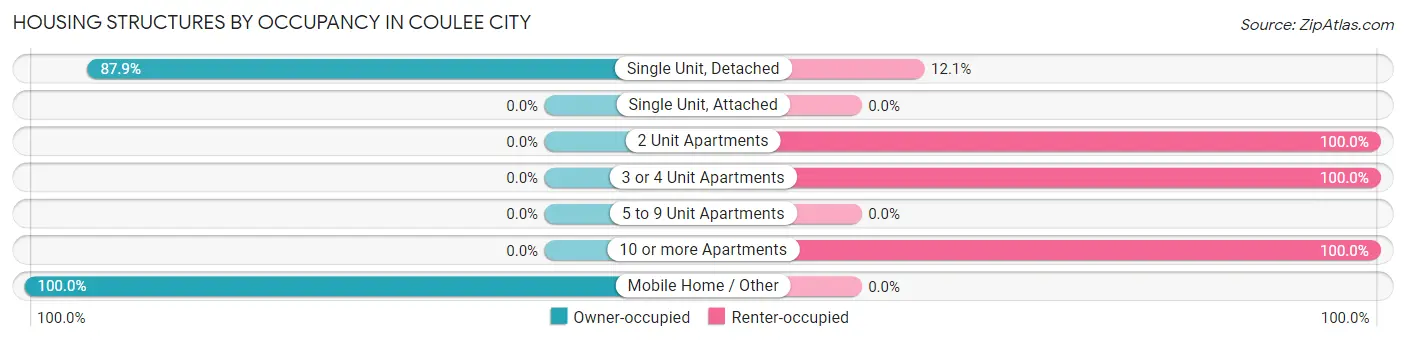
| Structure Type | Owner-occupied | Renter-occupied |
| Single Unit, Detached | 174 (87.9%) | 24 (12.1%) |
| Single Unit, Attached | 0 (0.0%) | 0 (0.0%) |
| 2 Unit Apartments | 0 (0.0%) | 8 (100.0%) |
| 3 or 4 Unit Apartments | 0 (0.0%) | 11 (100.0%) |
| 5 to 9 Unit Apartments | 0 (0.0%) | 0 (0.0%) |
| 10 or more Apartments | 0 (0.0%) | 7 (100.0%) |
| Mobile Home / Other | 33 (100.0%) | 0 (0.0%) |
| Total | 207 (80.5%) | 50 (19.5%) |
Housing Structures by Number of Rooms in Coulee City
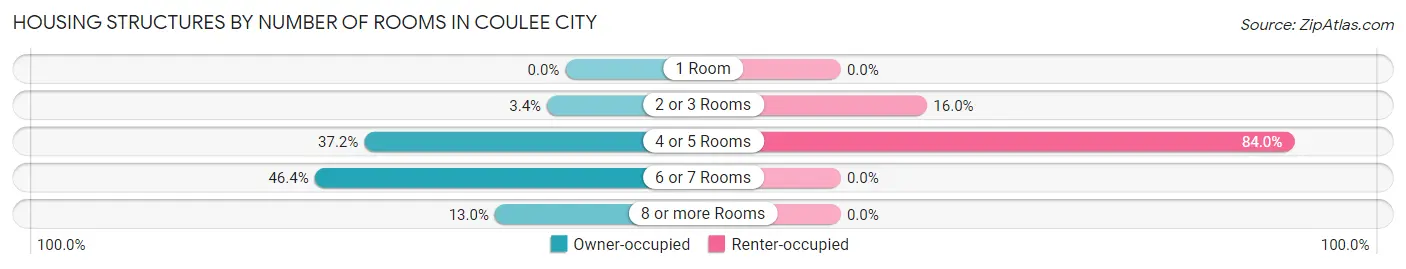
| Number of Rooms | Owner-occupied | Renter-occupied |
| 1 Room | 0 (0.0%) | 0 (0.0%) |
| 2 or 3 Rooms | 7 (3.4%) | 8 (16.0%) |
| 4 or 5 Rooms | 77 (37.2%) | 42 (84.0%) |
| 6 or 7 Rooms | 96 (46.4%) | 0 (0.0%) |
| 8 or more Rooms | 27 (13.0%) | 0 (0.0%) |
| Total | 207 (100.0%) | 50 (100.0%) |
Housing Structure by Heating Type in Coulee City
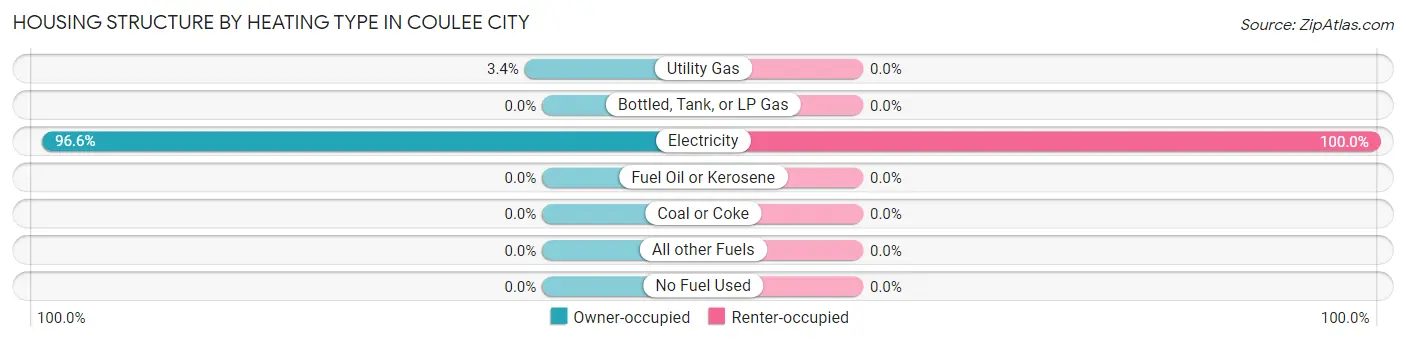
| Heating Type | Owner-occupied | Renter-occupied |
| Utility Gas | 7 (3.4%) | 0 (0.0%) |
| Bottled, Tank, or LP Gas | 0 (0.0%) | 0 (0.0%) |
| Electricity | 200 (96.6%) | 50 (100.0%) |
| Fuel Oil or Kerosene | 0 (0.0%) | 0 (0.0%) |
| Coal or Coke | 0 (0.0%) | 0 (0.0%) |
| All other Fuels | 0 (0.0%) | 0 (0.0%) |
| No Fuel Used | 0 (0.0%) | 0 (0.0%) |
| Total | 207 (100.0%) | 50 (100.0%) |
Household Vehicle Usage in Coulee City
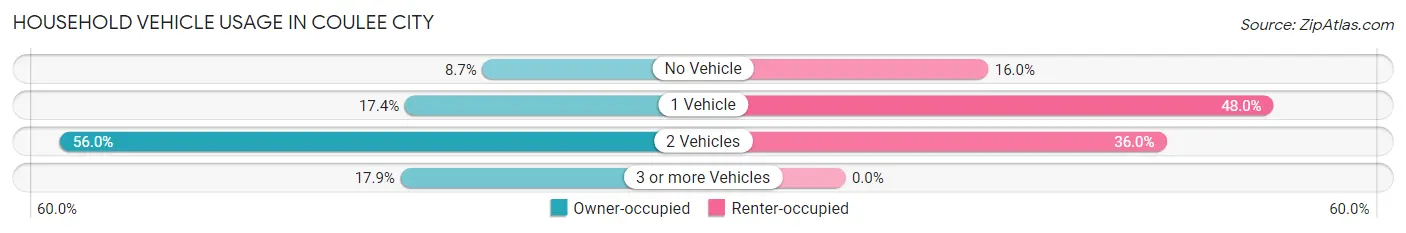
| Vehicles per Household | Owner-occupied | Renter-occupied |
| No Vehicle | 18 (8.7%) | 8 (16.0%) |
| 1 Vehicle | 36 (17.4%) | 24 (48.0%) |
| 2 Vehicles | 116 (56.0%) | 18 (36.0%) |
| 3 or more Vehicles | 37 (17.9%) | 0 (0.0%) |
| Total | 207 (100.0%) | 50 (100.0%) |
Real Estate & Mortgages in Coulee City
Real Estate and Mortgage Overview in Coulee City
| Characteristic | Without Mortgage | With Mortgage |
| Housing Units | 88 | 119 |
| Median Property Value | $118,100 | $140,200 |
| Median Household Income | $24,000 | $0 |
| Monthly Housing Costs | $402 | $0 |
| Real Estate Taxes | $888 | $0 |
Property Value by Mortgage Status in Coulee City
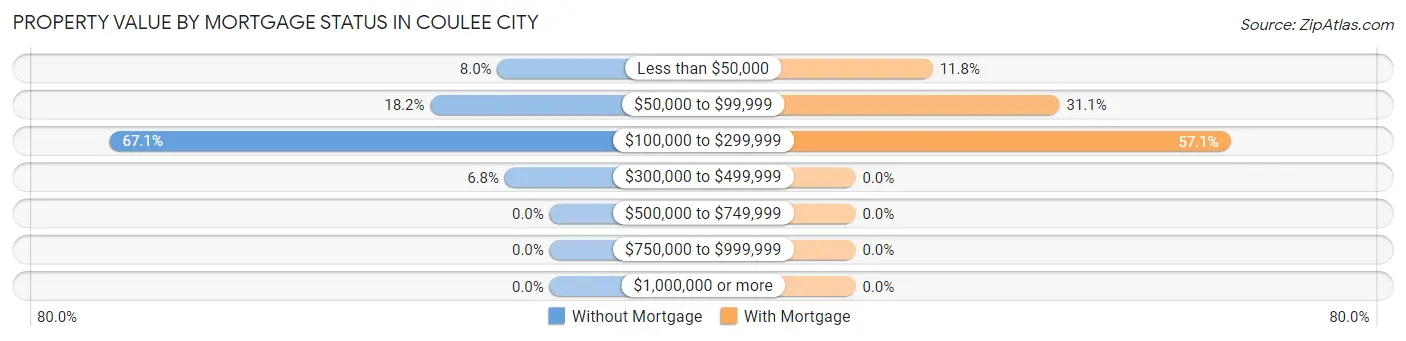
| Property Value | Without Mortgage | With Mortgage |
| Less than $50,000 | 7 (8.0%) | 14 (11.8%) |
| $50,000 to $99,999 | 16 (18.2%) | 37 (31.1%) |
| $100,000 to $299,999 | 59 (67.0%) | 68 (57.1%) |
| $300,000 to $499,999 | 6 (6.8%) | 0 (0.0%) |
| $500,000 to $749,999 | 0 (0.0%) | 0 (0.0%) |
| $750,000 to $999,999 | 0 (0.0%) | 0 (0.0%) |
| $1,000,000 or more | 0 (0.0%) | 0 (0.0%) |
| Total | 88 (100.0%) | 119 (100.0%) |
Household Income by Mortgage Status in Coulee City
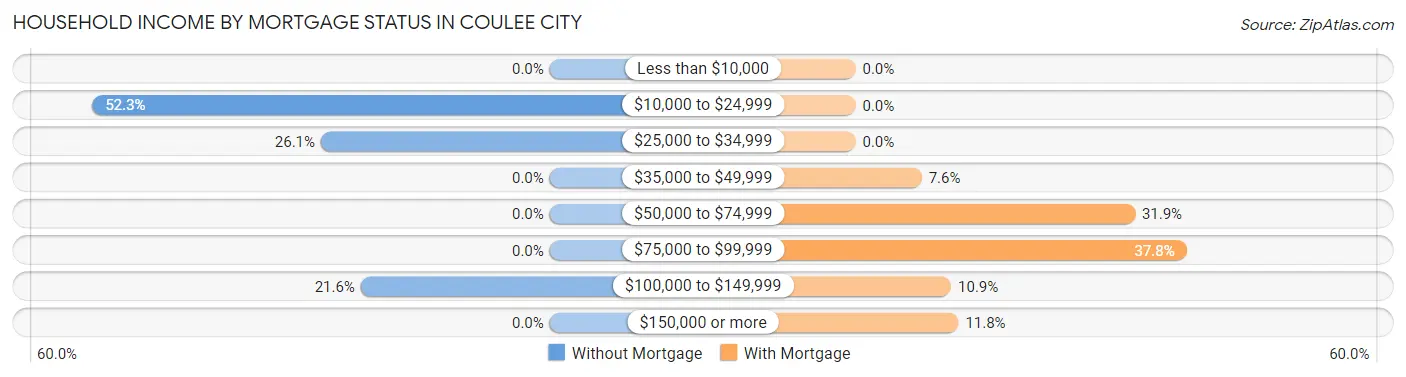
| Household Income | Without Mortgage | With Mortgage |
| Less than $10,000 | 0 (0.0%) | 0 (0.0%) |
| $10,000 to $24,999 | 46 (52.3%) | 0 (0.0%) |
| $25,000 to $34,999 | 23 (26.1%) | 0 (0.0%) |
| $35,000 to $49,999 | 0 (0.0%) | 9 (7.6%) |
| $50,000 to $74,999 | 0 (0.0%) | 38 (31.9%) |
| $75,000 to $99,999 | 0 (0.0%) | 45 (37.8%) |
| $100,000 to $149,999 | 19 (21.6%) | 13 (10.9%) |
| $150,000 or more | 0 (0.0%) | 14 (11.8%) |
| Total | 88 (100.0%) | 119 (100.0%) |
Property Value to Household Income Ratio in Coulee City
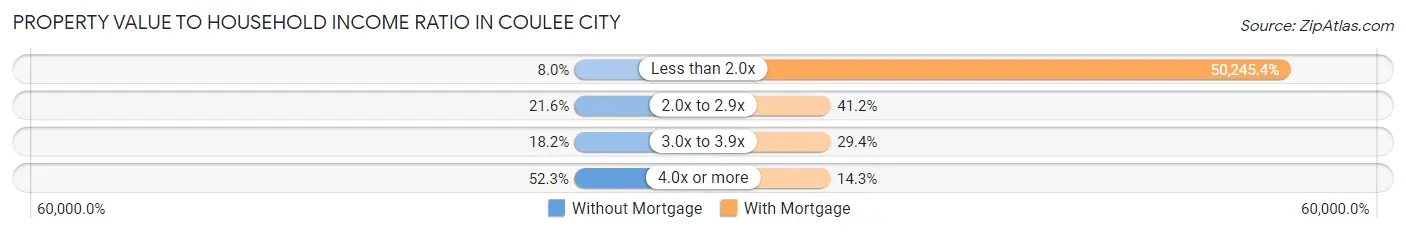
| Value-to-Income Ratio | Without Mortgage | With Mortgage |
| Less than 2.0x | 7 (8.0%) | 59,792 (50,245.4%) |
| 2.0x to 2.9x | 19 (21.6%) | 49 (41.2%) |
| 3.0x to 3.9x | 16 (18.2%) | 35 (29.4%) |
| 4.0x or more | 46 (52.3%) | 17 (14.3%) |
| Total | 88 (100.0%) | 119 (100.0%) |
Real Estate Taxes by Mortgage Status in Coulee City
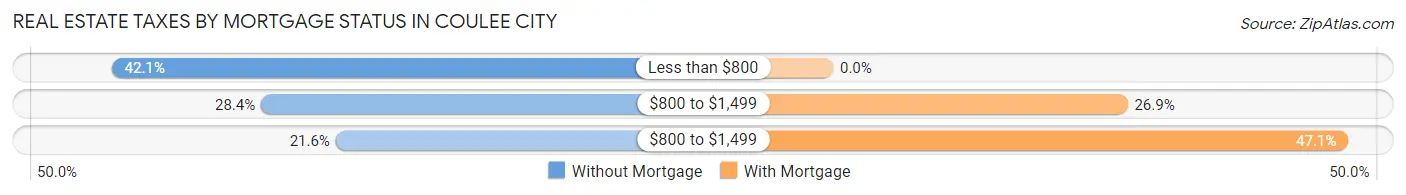
| Property Taxes | Without Mortgage | With Mortgage |
| Less than $800 | 37 (42.0%) | 0 (0.0%) |
| $800 to $1,499 | 25 (28.4%) | 32 (26.9%) |
| $800 to $1,499 | 19 (21.6%) | 56 (47.1%) |
| Total | 88 (100.0%) | 119 (100.0%) |
Health & Disability in Coulee City
Health Insurance Coverage by Age in Coulee City
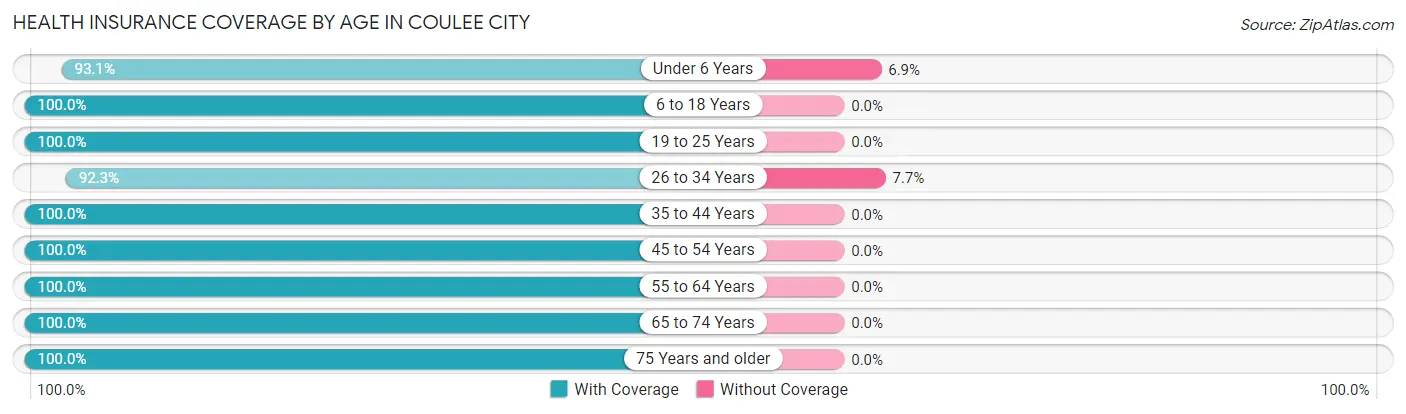
| Age Bracket | With Coverage | Without Coverage |
| Under 6 Years | 27 (93.1%) | 2 (6.9%) |
| 6 to 18 Years | 35 (100.0%) | 0 (0.0%) |
| 19 to 25 Years | 27 (100.0%) | 0 (0.0%) |
| 26 to 34 Years | 48 (92.3%) | 4 (7.7%) |
| 35 to 44 Years | 35 (100.0%) | 0 (0.0%) |
| 45 to 54 Years | 51 (100.0%) | 0 (0.0%) |
| 55 to 64 Years | 52 (100.0%) | 0 (0.0%) |
| 65 to 74 Years | 123 (100.0%) | 0 (0.0%) |
| 75 Years and older | 99 (100.0%) | 0 (0.0%) |
| Total | 497 (98.8%) | 6 (1.2%) |
Health Insurance Coverage by Citizenship Status in Coulee City
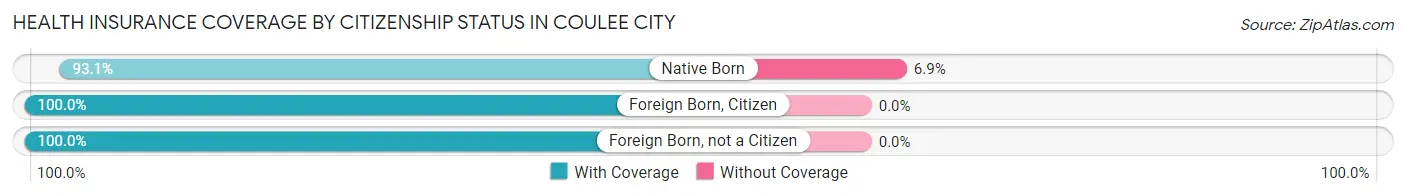
| Citizenship Status | With Coverage | Without Coverage |
| Native Born | 27 (93.1%) | 2 (6.9%) |
| Foreign Born, Citizen | 35 (100.0%) | 0 (0.0%) |
| Foreign Born, not a Citizen | 27 (100.0%) | 0 (0.0%) |
Health Insurance Coverage by Household Income in Coulee City
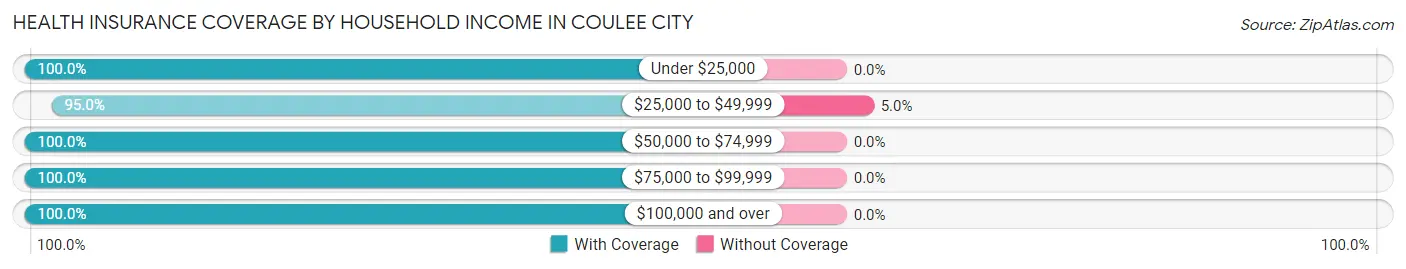
| Household Income | With Coverage | Without Coverage |
| Under $25,000 | 117 (100.0%) | 0 (0.0%) |
| $25,000 to $49,999 | 113 (95.0%) | 6 (5.0%) |
| $50,000 to $74,999 | 129 (100.0%) | 0 (0.0%) |
| $75,000 to $99,999 | 42 (100.0%) | 0 (0.0%) |
| $100,000 and over | 96 (100.0%) | 0 (0.0%) |
Public vs Private Health Insurance Coverage by Age in Coulee City
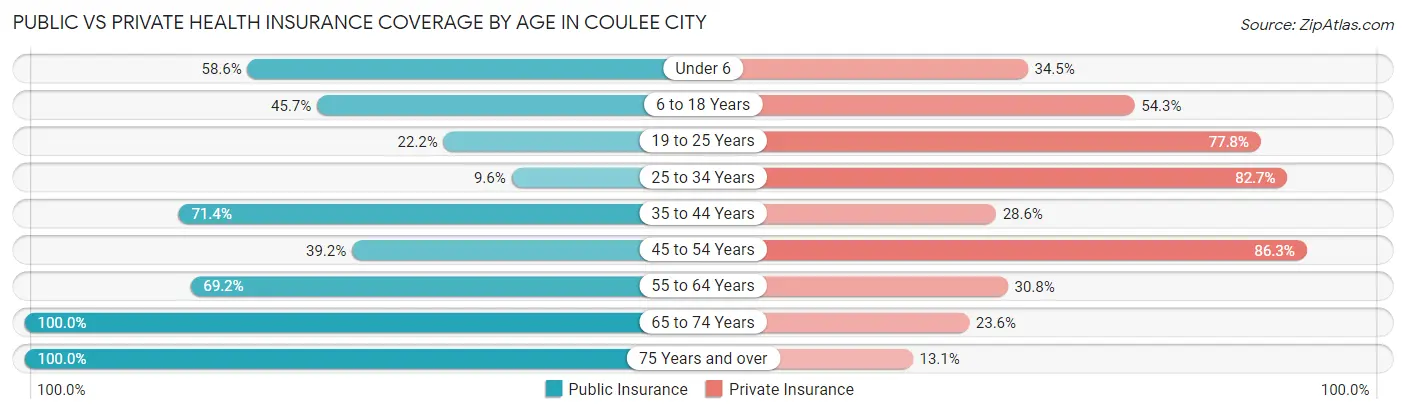
| Age Bracket | Public Insurance | Private Insurance |
| Under 6 | 17 (58.6%) | 10 (34.5%) |
| 6 to 18 Years | 16 (45.7%) | 19 (54.3%) |
| 19 to 25 Years | 6 (22.2%) | 21 (77.8%) |
| 25 to 34 Years | 5 (9.6%) | 43 (82.7%) |
| 35 to 44 Years | 25 (71.4%) | 10 (28.6%) |
| 45 to 54 Years | 20 (39.2%) | 44 (86.3%) |
| 55 to 64 Years | 36 (69.2%) | 16 (30.8%) |
| 65 to 74 Years | 123 (100.0%) | 29 (23.6%) |
| 75 Years and over | 99 (100.0%) | 13 (13.1%) |
| Total | 347 (69.0%) | 205 (40.8%) |
Disability Status by Sex by Age in Coulee City
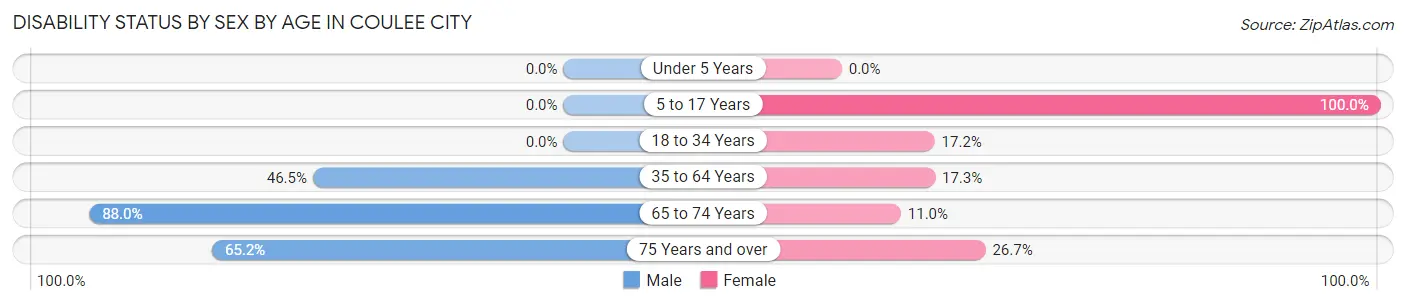
| Age Bracket | Male | Female |
| Under 5 Years | 0 (0.0%) | 0 (0.0%) |
| 5 to 17 Years | 0 (0.0%) | 7 (100.0%) |
| 18 to 34 Years | 0 (0.0%) | 5 (17.2%) |
| 35 to 64 Years | 40 (46.5%) | 9 (17.3%) |
| 65 to 74 Years | 44 (88.0%) | 8 (11.0%) |
| 75 Years and over | 45 (65.2%) | 8 (26.7%) |
Disability Class by Sex by Age in Coulee City
Disability Class: Hearing Difficulty
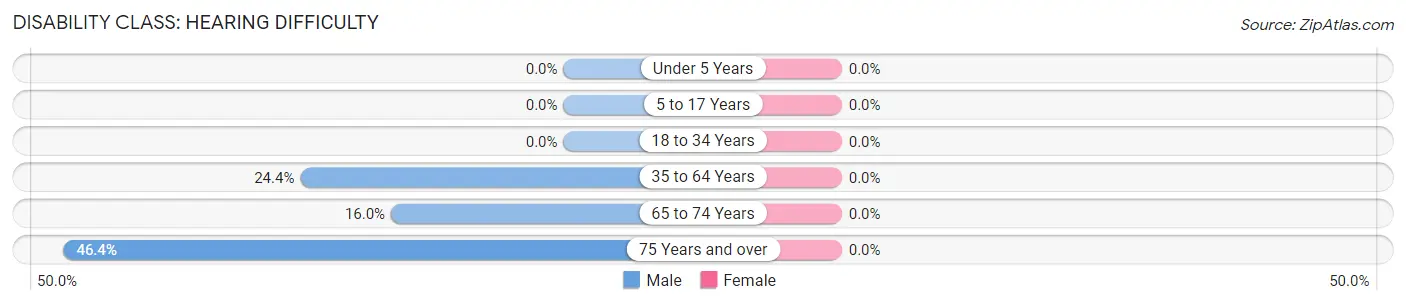
| Age Bracket | Male | Female |
| Under 5 Years | 0 (0.0%) | 0 (0.0%) |
| 5 to 17 Years | 0 (0.0%) | 0 (0.0%) |
| 18 to 34 Years | 0 (0.0%) | 0 (0.0%) |
| 35 to 64 Years | 21 (24.4%) | 0 (0.0%) |
| 65 to 74 Years | 8 (16.0%) | 0 (0.0%) |
| 75 Years and over | 32 (46.4%) | 0 (0.0%) |
Disability Class: Vision Difficulty
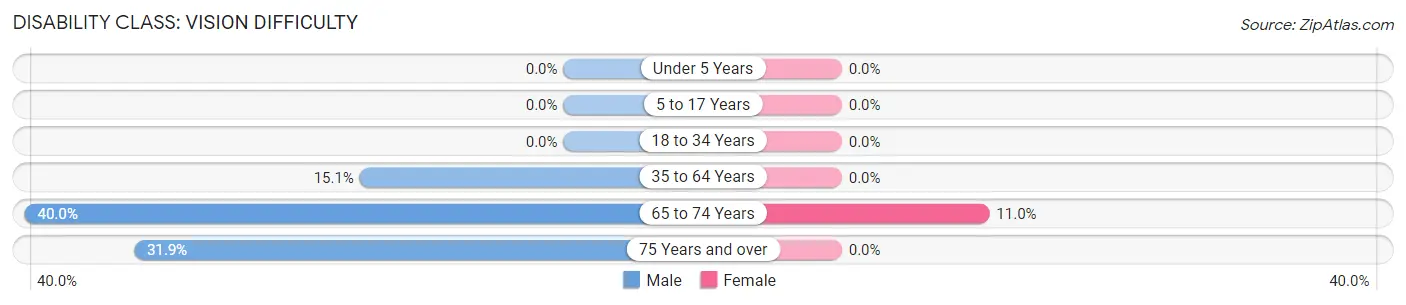
| Age Bracket | Male | Female |
| Under 5 Years | 0 (0.0%) | 0 (0.0%) |
| 5 to 17 Years | 0 (0.0%) | 0 (0.0%) |
| 18 to 34 Years | 0 (0.0%) | 0 (0.0%) |
| 35 to 64 Years | 13 (15.1%) | 0 (0.0%) |
| 65 to 74 Years | 20 (40.0%) | 8 (11.0%) |
| 75 Years and over | 22 (31.9%) | 0 (0.0%) |
Disability Class: Cognitive Difficulty
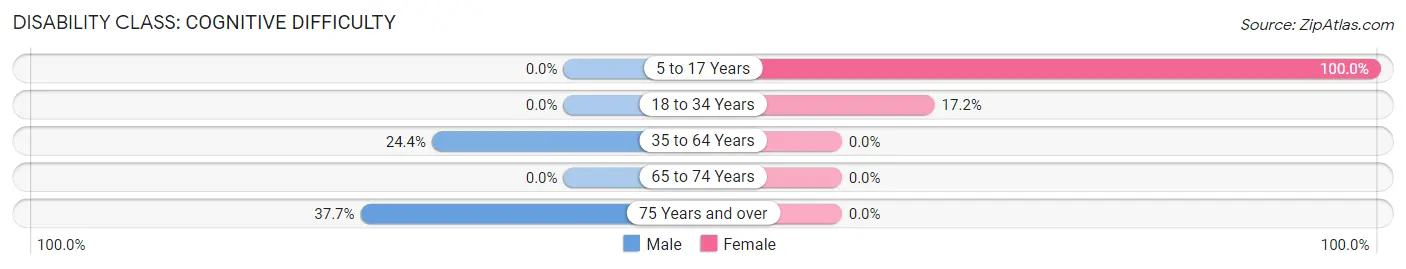
| Age Bracket | Male | Female |
| 5 to 17 Years | 0 (0.0%) | 7 (100.0%) |
| 18 to 34 Years | 0 (0.0%) | 5 (17.2%) |
| 35 to 64 Years | 21 (24.4%) | 0 (0.0%) |
| 65 to 74 Years | 0 (0.0%) | 0 (0.0%) |
| 75 Years and over | 26 (37.7%) | 0 (0.0%) |
Disability Class: Ambulatory Difficulty
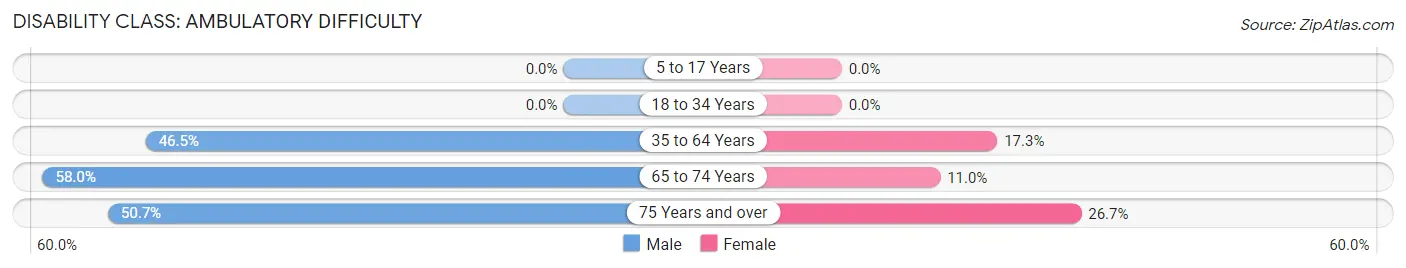
| Age Bracket | Male | Female |
| 5 to 17 Years | 0 (0.0%) | 0 (0.0%) |
| 18 to 34 Years | 0 (0.0%) | 0 (0.0%) |
| 35 to 64 Years | 40 (46.5%) | 9 (17.3%) |
| 65 to 74 Years | 29 (58.0%) | 8 (11.0%) |
| 75 Years and over | 35 (50.7%) | 8 (26.7%) |
Disability Class: Self-Care Difficulty
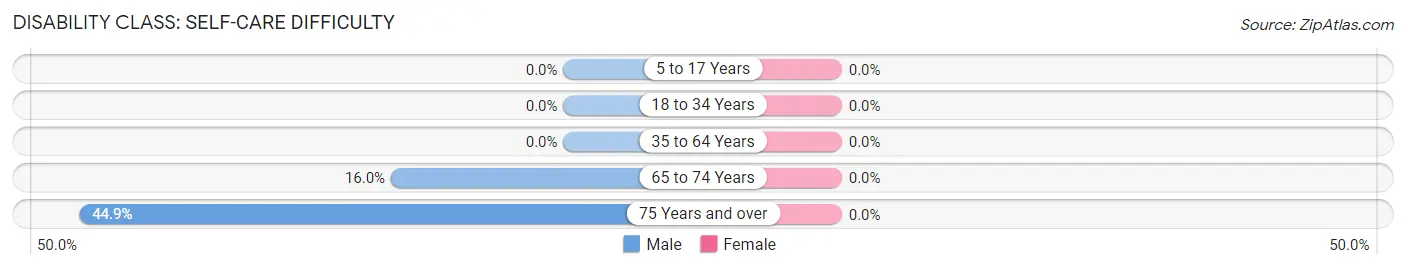
| Age Bracket | Male | Female |
| 5 to 17 Years | 0 (0.0%) | 0 (0.0%) |
| 18 to 34 Years | 0 (0.0%) | 0 (0.0%) |
| 35 to 64 Years | 0 (0.0%) | 0 (0.0%) |
| 65 to 74 Years | 8 (16.0%) | 0 (0.0%) |
| 75 Years and over | 31 (44.9%) | 0 (0.0%) |
Technology Access in Coulee City
Computing Device Access in Coulee City
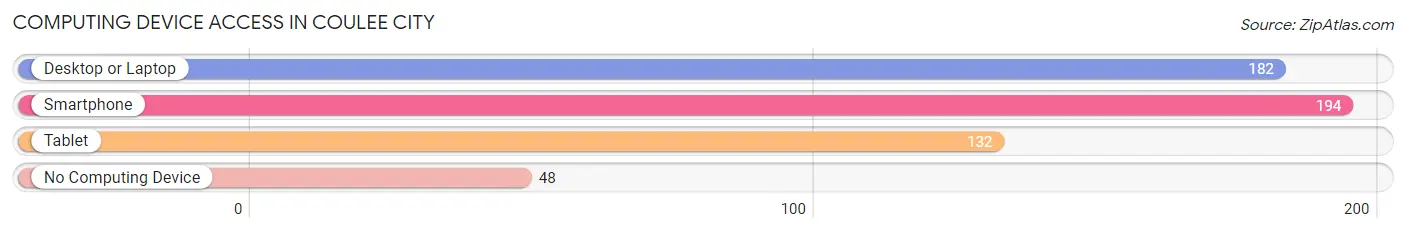
| Device Type | # Households | % Households |
| Desktop or Laptop | 182 | 70.8% |
| Smartphone | 194 | 75.5% |
| Tablet | 132 | 51.4% |
| No Computing Device | 48 | 18.7% |
| Total | 257 | 100.0% |
Internet Access in Coulee City
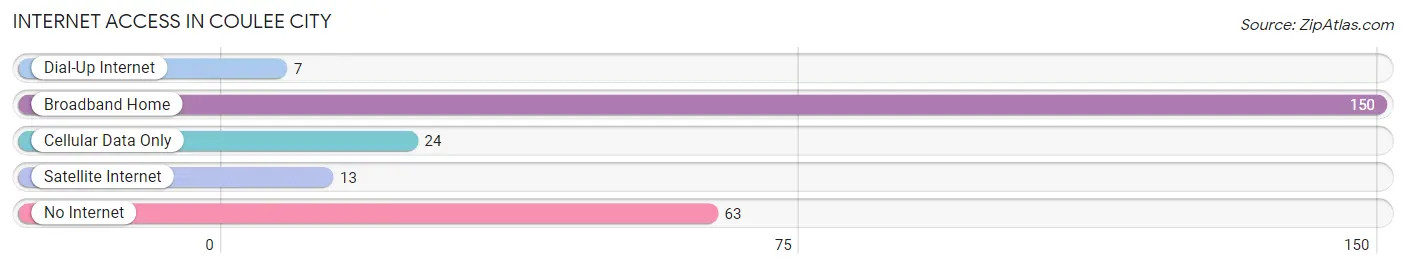
| Internet Type | # Households | % Households |
| Dial-Up Internet | 7 | 2.7% |
| Broadband Home | 150 | 58.4% |
| Cellular Data Only | 24 | 9.3% |
| Satellite Internet | 13 | 5.1% |
| No Internet | 63 | 24.5% |
| Total | 257 | 100.0% |
Coulee City Summary
Coulee City is a small town located in the Grant County of Washington State. It is situated on the banks of the Columbia River, near the Grand Coulee Dam. The town has a population of around 500 people and is known for its rural charm and scenic beauty.
History
Coulee City was founded in 1892 by a group of settlers from the Midwest. The town was originally called "Coulee City" because of its location near the Grand Coulee Dam. The town was incorporated in 1909 and has remained a small, rural community ever since.
The town was originally a farming community, but in the early 1900s, the Grand Coulee Dam was built, bringing electricity and irrigation to the area. This allowed the town to become a hub for the agricultural industry in the region.
In the 1950s, the town began to experience a population boom as people moved to the area to take advantage of the new jobs created by the dam. The population peaked in the 1960s and has since declined slightly.
Geography
Coulee City is located in the Grant County of Washington State. It is situated on the banks of the Columbia River, near the Grand Coulee Dam. The town is surrounded by rolling hills and is located in a semi-arid climate. The average annual temperature is around 50 degrees Fahrenheit.
The town is located in the Columbia Basin, which is a large area of land that was formed by the Missoula Floods. The area is known for its unique geology and is home to a variety of wildlife.
Economy
Coulee City is a small, rural community with a population of around 500 people. The town is primarily supported by the agricultural industry, which is centered around the Grand Coulee Dam. The dam provides irrigation and electricity to the area, which has allowed the town to become a hub for the agricultural industry in the region.
The town also has a small tourism industry, as it is a popular destination for outdoor activities such as fishing, camping, and hiking. The town also has a few small businesses, such as restaurants, stores, and a gas station.
Demographics
As of the 2010 census, the population of Coulee City was 498 people. The racial makeup of the town was 95.2% White, 0.2% African American, 0.4% Native American, 0.2% Asian, 0.2% Pacific Islander, and 3.8% from other races. The median household income was $37,500 and the median age was 44.
Conclusion
Coulee City is a small, rural town located in the Grant County of Washington State. It is situated on the banks of the Columbia River, near the Grand Coulee Dam. The town has a population of around 500 people and is known for its rural charm and scenic beauty. The town is primarily supported by the agricultural industry, which is centered around the Grand Coulee Dam. The town also has a small tourism industry, as it is a popular destination for outdoor activities such as fishing, camping, and hiking. The town has a diverse population and a median household income of $37,500.
Common Questions
What is Per Capita Income in Coulee City?
Per Capita income in Coulee City is $25,666.
What is the Median Family Income in Coulee City?
Median Family Income in Coulee City is $47,454.
What is the Median Household income in Coulee City?
Median Household Income in Coulee City is $44,464.
What is Income or Wage Gap in Coulee City?
Income or Wage Gap in Coulee City is 12.3%.
Women in Coulee City earn 87.7 cents for every dollar earned by a man.
What is Inequality or Gini Index in Coulee City?
Inequality or Gini Index in Coulee City is 0.37.
What is the Total Population of Coulee City?
Total Population of Coulee City is 503.
What is the Total Male Population of Coulee City?
Total Male Population of Coulee City is 312.
What is the Total Female Population of Coulee City?
Total Female Population of Coulee City is 191.
What is the Ratio of Males per 100 Females in Coulee City?
There are 163.35 Males per 100 Females in Coulee City.
What is the Ratio of Females per 100 Males in Coulee City?
There are 61.22 Females per 100 Males in Coulee City.
What is the Median Population Age in Coulee City?
Median Population Age in Coulee City is 56.7 Years.
What is the Average Family Size in Coulee City
Average Family Size in Coulee City is 2.4 People.
What is the Average Household Size in Coulee City
Average Household Size in Coulee City is 2.0 People.
How Large is the Labor Force in Coulee City?
There are 170 People in the Labor Forcein in Coulee City.
What is the Percentage of People in the Labor Force in Coulee City?
38.7% of People are in the Labor Force in Coulee City.
What is the Unemployment Rate in Coulee City?
Unemployment Rate in Coulee City is 8.2%.