Zip Codes with the Highest Percentage of Population Employed in Security & Protection in Bellingham, WA
RELATED REPORTS & OPTIONS
Security & Protection
Bellingham
Compare Zip Codes
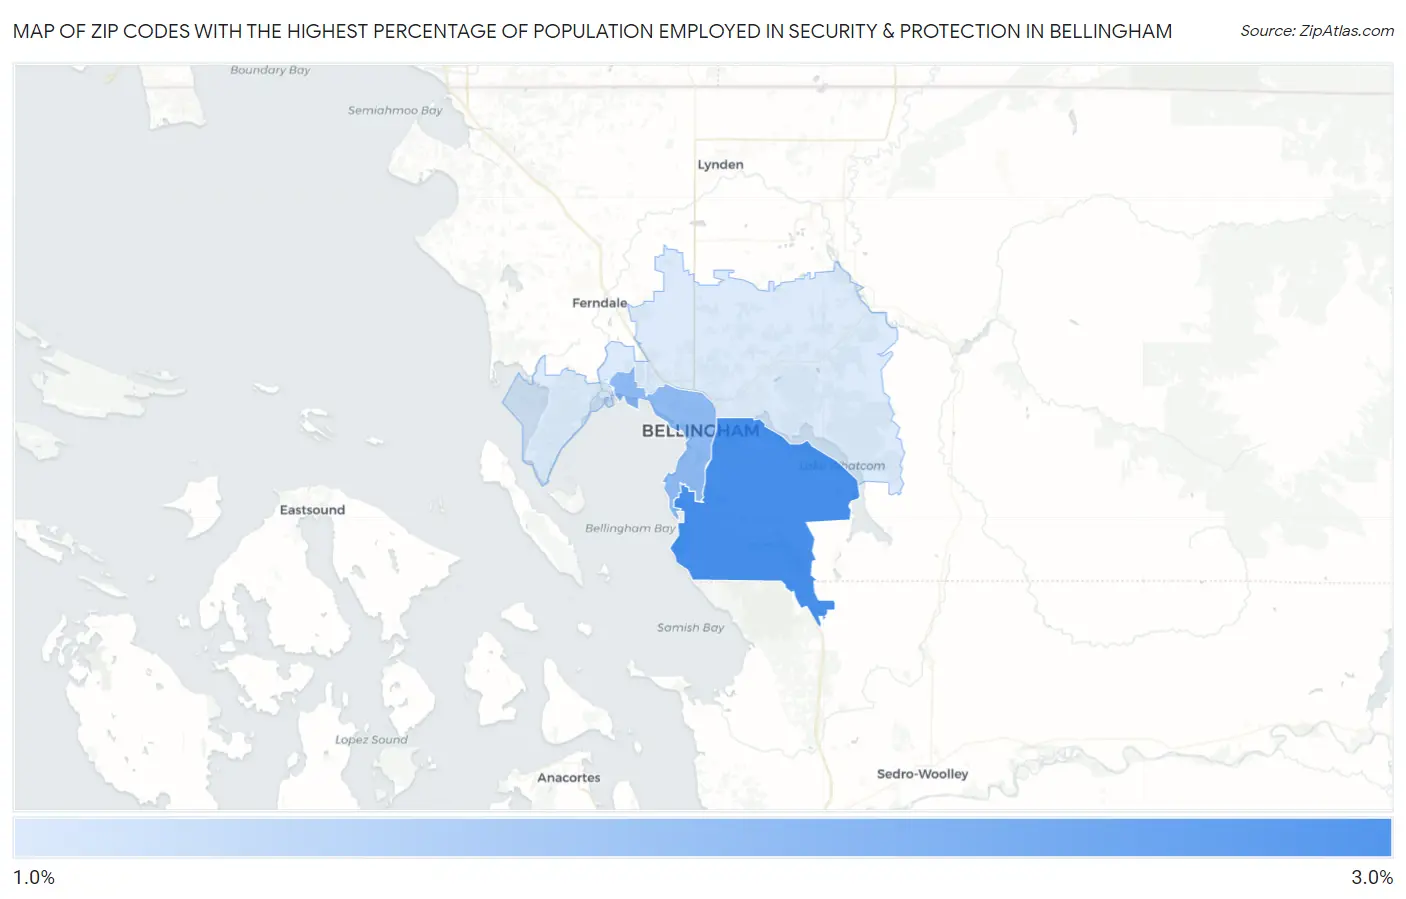
Map of Zip Codes with the Highest Percentage of Population Employed in Security & Protection in Bellingham
1.5%
2.6%
Zip Codes with the Highest Percentage of Population Employed in Security & Protection in Bellingham, WA
| Zip Code | % Employed | vs State | vs National | |
| 1. | 98229 | 2.6% | 1.8%(+0.771)#156 | 2.1%(+0.436)#9,079 |
| 2. | 98225 | 2.1% | 1.8%(+0.258)#218 | 2.1%(-0.077)#12,105 |
| 3. | 98226 | 1.5% | 1.8%(-0.308)#309 | 2.1%(-0.643)#16,151 |
1
Common Questions
What are the Top Zip Codes with the Highest Percentage of Population Employed in Security & Protection in Bellingham, WA?
Top Zip Codes with the Highest Percentage of Population Employed in Security & Protection in Bellingham, WA are:
What zip code has the Highest Percentage of Population Employed in Security & Protection in Bellingham, WA?
98229 has the Highest Percentage of Population Employed in Security & Protection in Bellingham, WA with 2.6%.
What is the Percentage of Population Employed in Security & Protection in Bellingham, WA?
Percentage of Population Employed in Security & Protection in Bellingham is 1.7%.
What is the Percentage of Population Employed in Security & Protection in Washington?
Percentage of Population Employed in Security & Protection in Washington is 1.8%.
What is the Percentage of Population Employed in Security & Protection in the United States?
Percentage of Population Employed in Security & Protection in the United States is 2.1%.