Arlington Heights, WA Map & Demographics
Arlington Heights Map
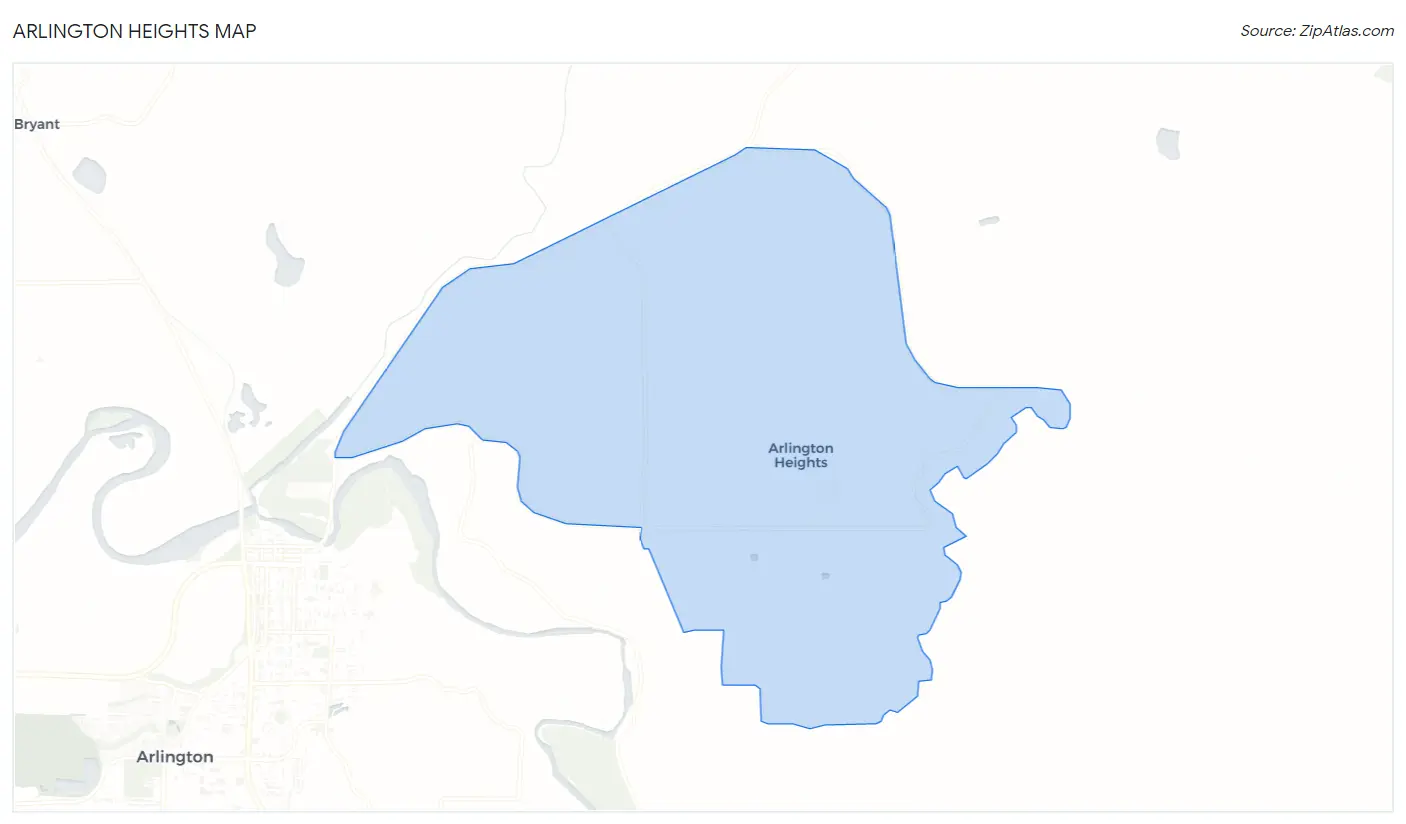
Arlington Heights Overview
$43,647
PER CAPITA INCOME
$135,381
AVG FAMILY INCOME
$108,690
AVG HOUSEHOLD INCOME
48.1%
WAGE / INCOME GAP [ % ]
51.9¢/ $1
WAGE / INCOME GAP [ $ ]
0.37
INEQUALITY / GINI INDEX
3,122
TOTAL POPULATION
1,245
MALE POPULATION
1,877
FEMALE POPULATION
66.33
MALES / 100 FEMALES
150.76
FEMALES / 100 MALES
46.5
MEDIAN AGE
3.3
AVG FAMILY SIZE
2.8
AVG HOUSEHOLD SIZE
1,381
LABOR FORCE [ PEOPLE ]
49.9%
PERCENT IN LABOR FORCE
2.9%
UNEMPLOYMENT RATE
Income in Arlington Heights
Income Overview in Arlington Heights
Per Capita Income in Arlington Heights is $43,647, while median incomes of families and households are $135,381 and $108,690 respectively.
| Characteristic | Number | Measure |
| Per Capita Income | 3,122 | $43,647 |
| Median Family Income | 804 | $135,381 |
| Mean Family Income | 804 | $149,862 |
| Median Household Income | 1,118 | $108,690 |
| Mean Household Income | 1,118 | $121,032 |
| Income Deficit | 804 | $0 |
| Wage / Income Gap (%) | 3,122 | 48.10% |
| Wage / Income Gap ($) | 3,122 | 51.90¢ per $1 |
| Gini / Inequality Index | 3,122 | 0.37 |
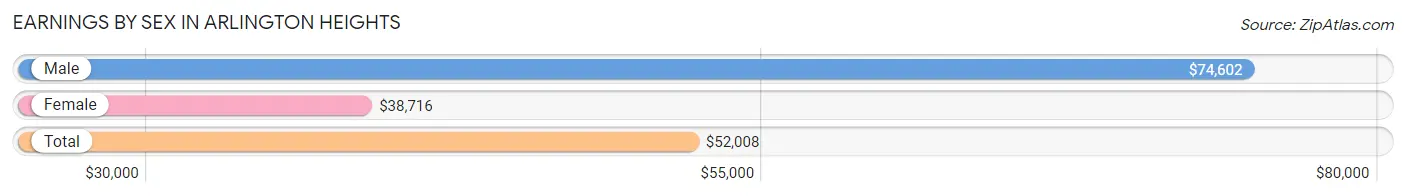
Earnings by Sex in Arlington Heights
Average Earnings in Arlington Heights are $52,008, $74,602 for men and $38,716 for women, a difference of 48.1%.
| Sex | Number | Average Earnings |
| Male | 711 (48.1%) | $74,602 |
| Female | 766 (51.9%) | $38,716 |
| Total | 1,477 (100.0%) | $52,008 |
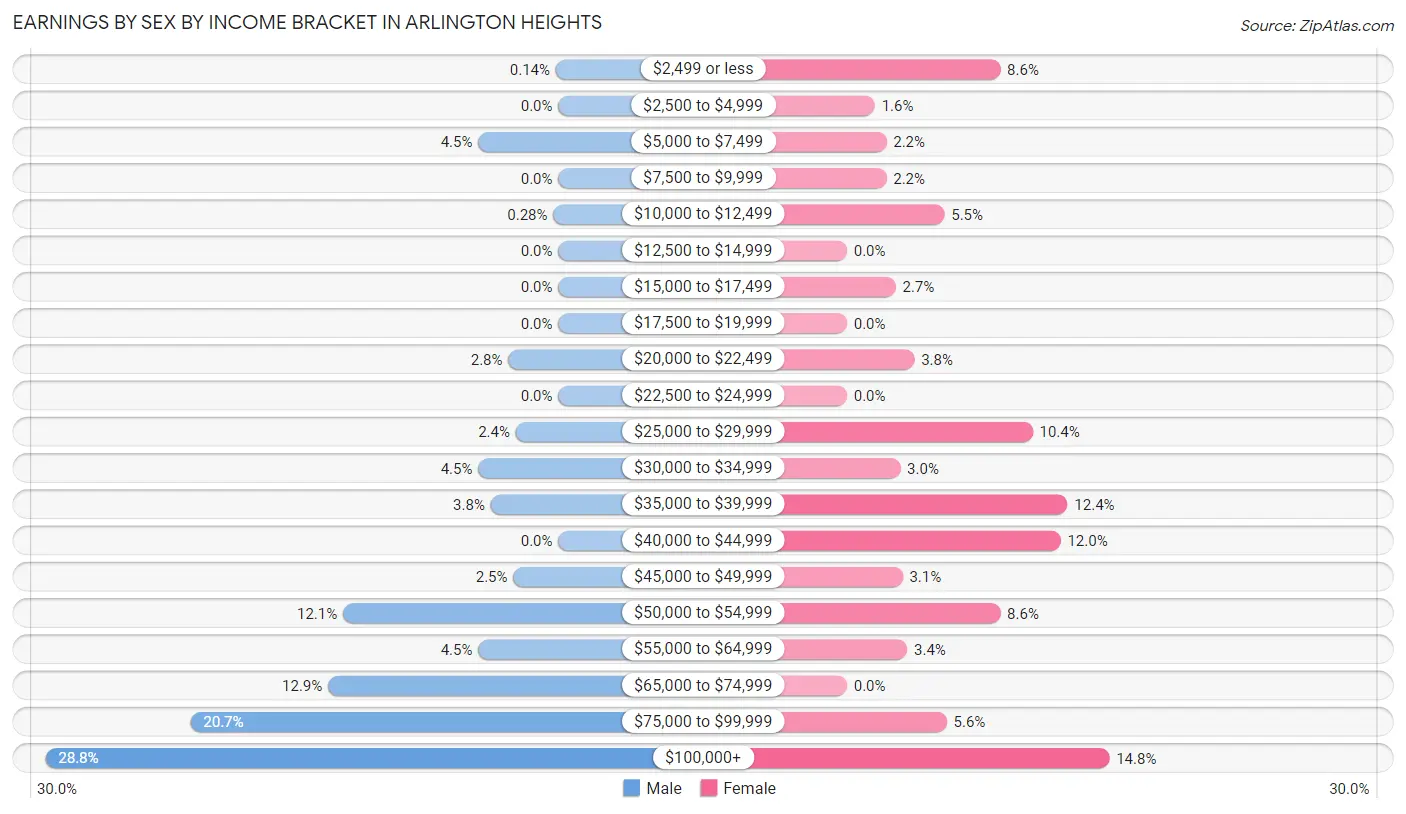
Earnings by Sex by Income Bracket in Arlington Heights
The most common earnings brackets in Arlington Heights are $100,000+ for men (205 | 28.8%) and $100,000+ for women (113 | 14.7%).
| Income | Male | Female |
| $2,499 or less | 1 (0.1%) | 66 (8.6%) |
| $2,500 to $4,999 | 0 (0.0%) | 12 (1.6%) |
| $5,000 to $7,499 | 32 (4.5%) | 17 (2.2%) |
| $7,500 to $9,999 | 0 (0.0%) | 17 (2.2%) |
| $10,000 to $12,499 | 2 (0.3%) | 42 (5.5%) |
| $12,500 to $14,999 | 0 (0.0%) | 0 (0.0%) |
| $15,000 to $17,499 | 0 (0.0%) | 21 (2.7%) |
| $17,500 to $19,999 | 0 (0.0%) | 0 (0.0%) |
| $20,000 to $22,499 | 20 (2.8%) | 29 (3.8%) |
| $22,500 to $24,999 | 0 (0.0%) | 0 (0.0%) |
| $25,000 to $29,999 | 17 (2.4%) | 80 (10.4%) |
| $30,000 to $34,999 | 32 (4.5%) | 23 (3.0%) |
| $35,000 to $39,999 | 27 (3.8%) | 95 (12.4%) |
| $40,000 to $44,999 | 0 (0.0%) | 92 (12.0%) |
| $45,000 to $49,999 | 18 (2.5%) | 24 (3.1%) |
| $50,000 to $54,999 | 86 (12.1%) | 66 (8.6%) |
| $55,000 to $64,999 | 32 (4.5%) | 26 (3.4%) |
| $65,000 to $74,999 | 92 (12.9%) | 0 (0.0%) |
| $75,000 to $99,999 | 147 (20.7%) | 43 (5.6%) |
| $100,000+ | 205 (28.8%) | 113 (14.7%) |
| Total | 711 (100.0%) | 766 (100.0%) |
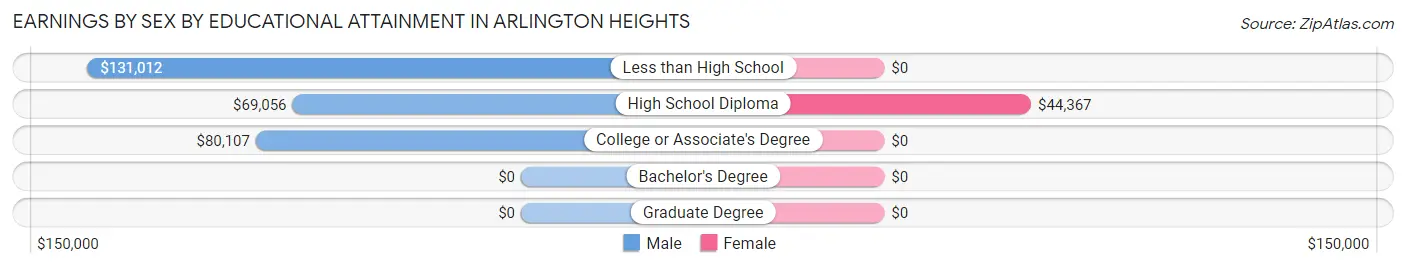
Earnings by Sex by Educational Attainment in Arlington Heights
Average earnings in Arlington Heights are $74,602 for men and $44,049 for women, a difference of 40.9%. Men with an educational attainment of less than high school enjoy the highest average annual earnings of $131,012, while those with high school diploma education earn the least with $69,056. Women with an educational attainment of high school diploma earn the most with the average annual earnings of $44,367, while those with high school diploma education have the smallest earnings of $44,367.
| Educational Attainment | Male Income | Female Income |
| Less than High School | $131,012 | $0 |
| High School Diploma | $69,056 | $44,367 |
| College or Associate's Degree | $80,107 | $0 |
| Bachelor's Degree | - | - |
| Graduate Degree | - | - |
| Total | $74,602 | $44,049 |
Family Income in Arlington Heights
Family Income Brackets in Arlington Heights
According to the Arlington Heights family income data, there are 215 families falling into the $100,000 to $149,999 income range, which is the most common income bracket and makes up 26.7% of all families.
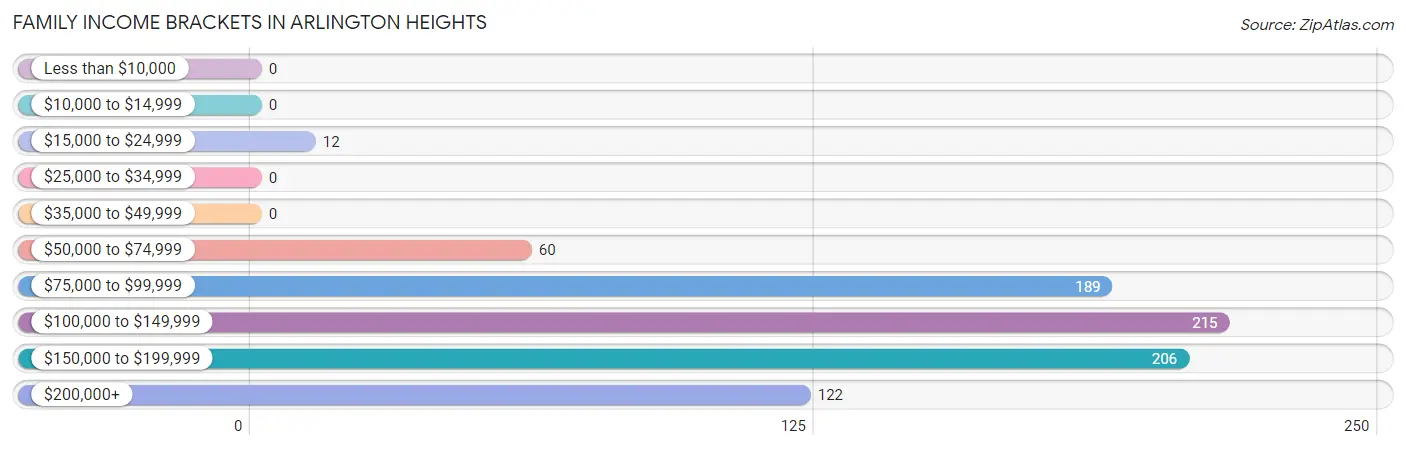
| Income Bracket | # Families | % Families |
| Less than $10,000 | 0 | 0.0% |
| $10,000 to $14,999 | 0 | 0.0% |
| $15,000 to $24,999 | 12 | 1.5% |
| $25,000 to $34,999 | 0 | 0.0% |
| $35,000 to $49,999 | 0 | 0.0% |
| $50,000 to $74,999 | 60 | 7.5% |
| $75,000 to $99,999 | 189 | 23.5% |
| $100,000 to $149,999 | 215 | 26.7% |
| $150,000 to $199,999 | 206 | 25.6% |
| $200,000+ | 122 | 15.2% |
Family Income by Famaliy Size in Arlington Heights
4-person families (315 | 39.2%) account for the highest median family income in Arlington Heights with $159,509 per family, while 2-person families (264 | 32.8%) have the highest median income of $47,178 per family member.
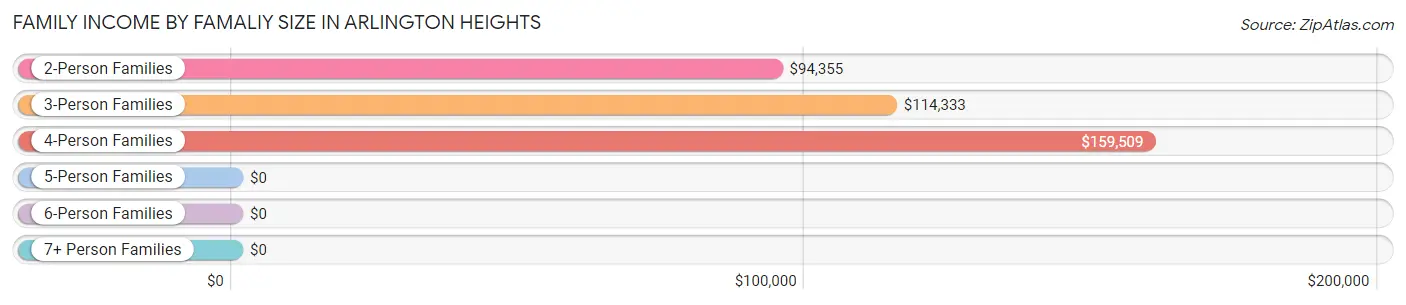
| Income Bracket | # Families | Median Income |
| 2-Person Families | 264 (32.8%) | $94,355 |
| 3-Person Families | 174 (21.6%) | $114,333 |
| 4-Person Families | 315 (39.2%) | $159,509 |
| 5-Person Families | 22 (2.7%) | $0 |
| 6-Person Families | 29 (3.6%) | $0 |
| 7+ Person Families | 0 (0.0%) | $0 |
| Total | 804 (100.0%) | $135,381 |
Family Income by Number of Earners in Arlington Heights
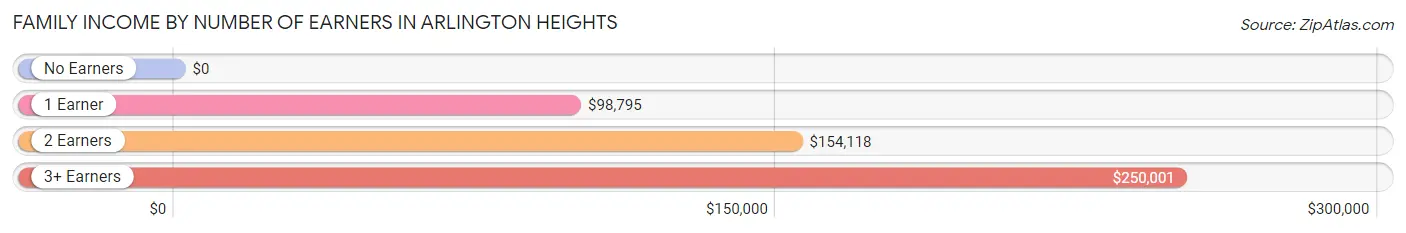
| Number of Earners | # Families | Median Income |
| No Earners | 89 (11.1%) | $0 |
| 1 Earner | 217 (27.0%) | $98,795 |
| 2 Earners | 368 (45.8%) | $154,118 |
| 3+ Earners | 130 (16.2%) | $250,001 |
| Total | 804 (100.0%) | $135,381 |
Household Income in Arlington Heights
Household Income Brackets in Arlington Heights
With 271 households falling in the category, the $100,000 to $149,999 income range is the most frequent in Arlington Heights, accounting for 24.2% of all households.
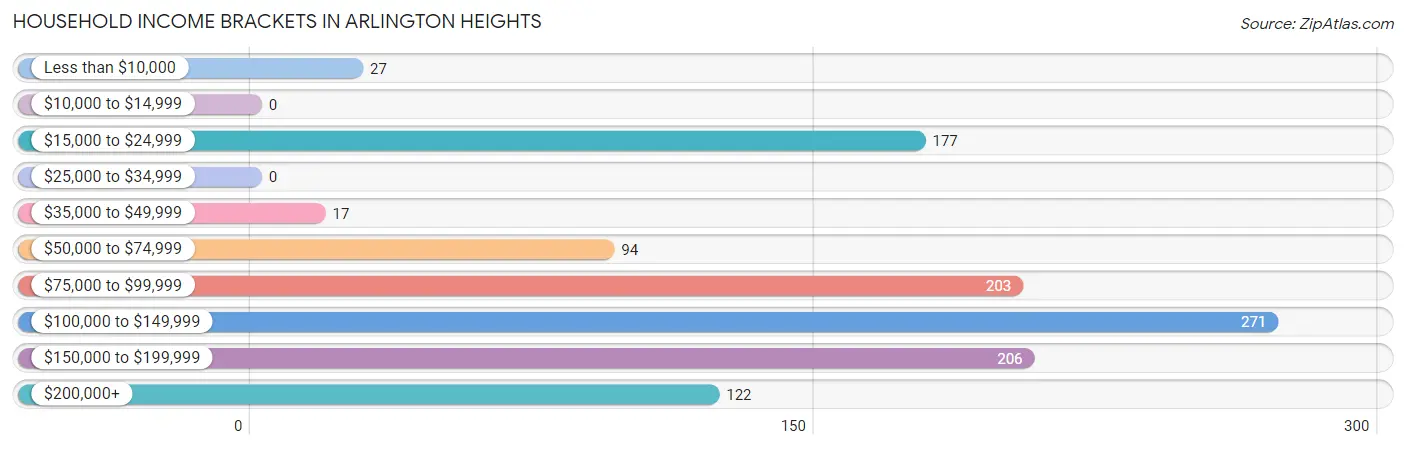
| Income Bracket | # Households | % Households |
| Less than $10,000 | 27 | 2.4% |
| $10,000 to $14,999 | 0 | 0.0% |
| $15,000 to $24,999 | 177 | 15.8% |
| $25,000 to $34,999 | 0 | 0.0% |
| $35,000 to $49,999 | 17 | 1.5% |
| $50,000 to $74,999 | 94 | 8.4% |
| $75,000 to $99,999 | 203 | 18.2% |
| $100,000 to $149,999 | 271 | 24.2% |
| $150,000 to $199,999 | 206 | 18.4% |
| $200,000+ | 122 | 10.9% |
Household Income by Householder Age in Arlington Heights
The median household income in Arlington Heights is $108,690, with the highest median household income of $157,753 found in the 45 to 64 years age bracket for the primary householder. A total of 531 households (47.5%) fall into this category.
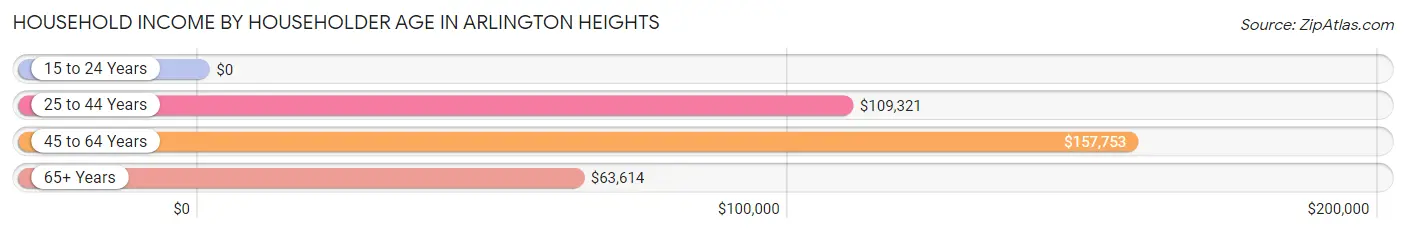
| Income Bracket | # Households | Median Income |
| 15 to 24 Years | 0 (0.0%) | $0 |
| 25 to 44 Years | 148 (13.2%) | $109,321 |
| 45 to 64 Years | 531 (47.5%) | $157,753 |
| 65+ Years | 439 (39.3%) | $63,614 |
| Total | 1,118 (100.0%) | $108,690 |
Poverty in Arlington Heights
Income Below Poverty by Sex and Age in Arlington Heights
With 1.0% poverty level for males and 3.1% for females among the residents of Arlington Heights, 65 to 74 year old males and 55 to 64 year old females are the most vulnerable to poverty, with 12 males (11.7%) and 27 females (10.7%) in their respective age groups living below the poverty level.
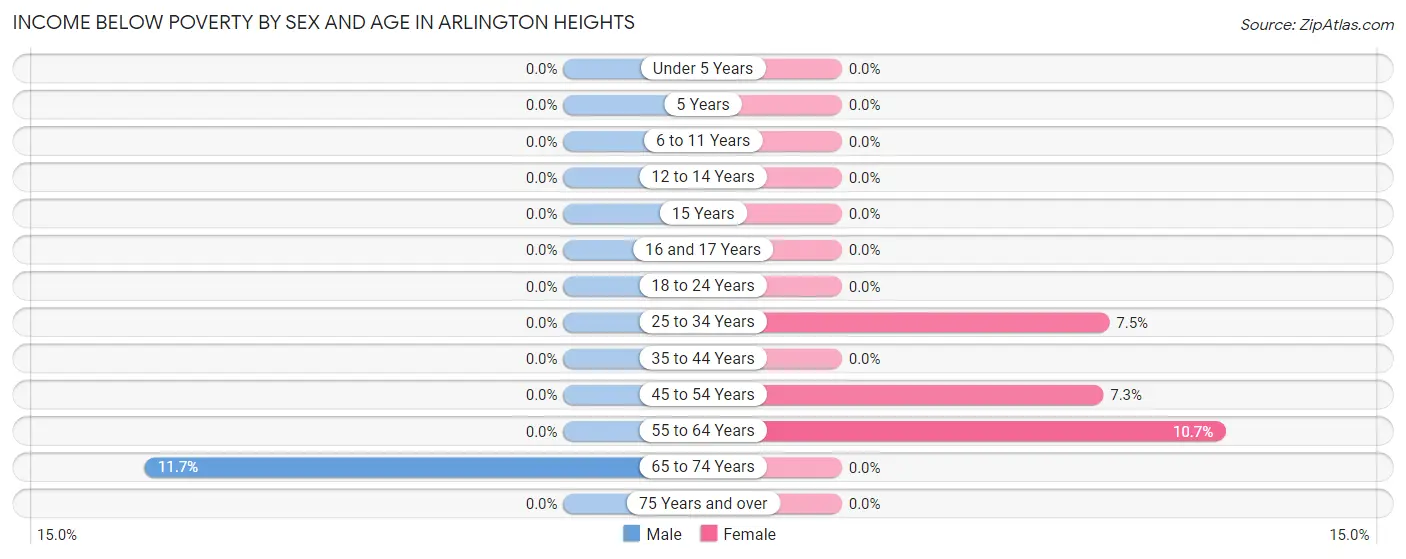
| Age Bracket | Male | Female |
| Under 5 Years | 0 (0.0%) | 0 (0.0%) |
| 5 Years | 0 (0.0%) | 0 (0.0%) |
| 6 to 11 Years | 0 (0.0%) | 0 (0.0%) |
| 12 to 14 Years | 0 (0.0%) | 0 (0.0%) |
| 15 Years | 0 (0.0%) | 0 (0.0%) |
| 16 and 17 Years | 0 (0.0%) | 0 (0.0%) |
| 18 to 24 Years | 0 (0.0%) | 0 (0.0%) |
| 25 to 34 Years | 0 (0.0%) | 14 (7.4%) |
| 35 to 44 Years | 0 (0.0%) | 0 (0.0%) |
| 45 to 54 Years | 0 (0.0%) | 15 (7.3%) |
| 55 to 64 Years | 0 (0.0%) | 27 (10.7%) |
| 65 to 74 Years | 12 (11.7%) | 0 (0.0%) |
| 75 Years and over | 0 (0.0%) | 0 (0.0%) |
| Total | 12 (1.0%) | 56 (3.1%) |
Income Above Poverty by Sex and Age in Arlington Heights
According to the poverty statistics in Arlington Heights, males aged 5 years and females aged under 5 years are the age groups that are most secure financially, with 100.0% of males and 100.0% of females in these age groups living above the poverty line.
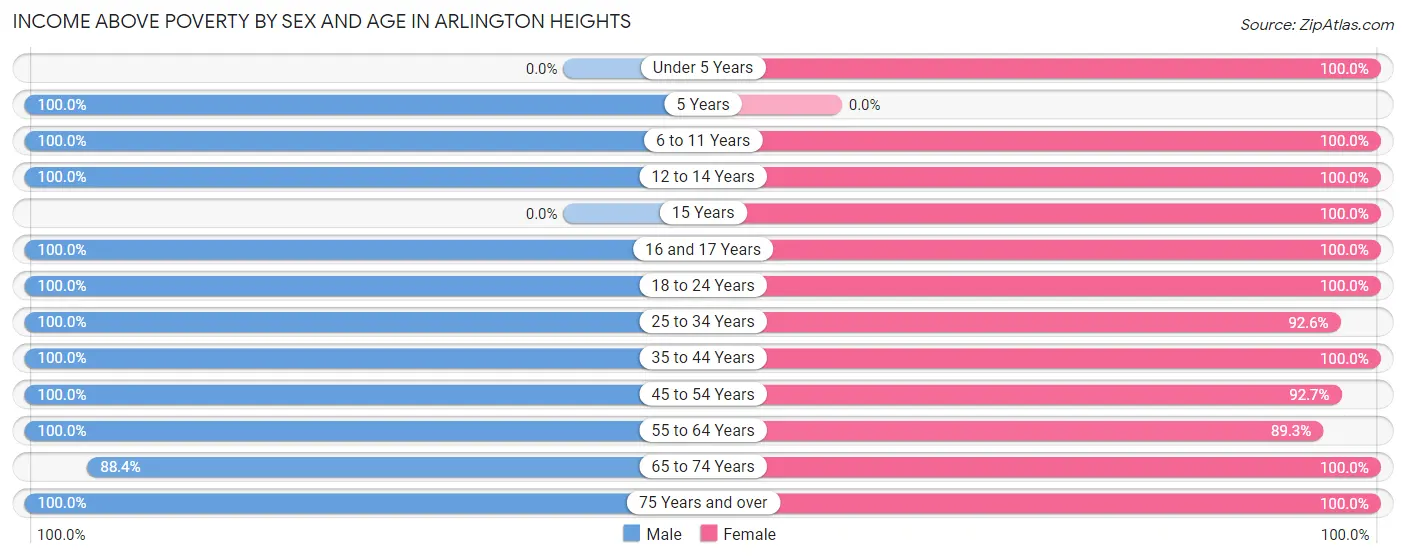
| Age Bracket | Male | Female |
| Under 5 Years | 0 (0.0%) | 44 (100.0%) |
| 5 Years | 22 (100.0%) | 0 (0.0%) |
| 6 to 11 Years | 75 (100.0%) | 71 (100.0%) |
| 12 to 14 Years | 17 (100.0%) | 29 (100.0%) |
| 15 Years | 0 (0.0%) | 27 (100.0%) |
| 16 and 17 Years | 86 (100.0%) | 227 (100.0%) |
| 18 to 24 Years | 92 (100.0%) | 112 (100.0%) |
| 25 to 34 Years | 105 (100.0%) | 174 (92.5%) |
| 35 to 44 Years | 113 (100.0%) | 179 (100.0%) |
| 45 to 54 Years | 302 (100.0%) | 191 (92.7%) |
| 55 to 64 Years | 176 (100.0%) | 226 (89.3%) |
| 65 to 74 Years | 91 (88.3%) | 155 (100.0%) |
| 75 Years and over | 145 (100.0%) | 325 (100.0%) |
| Total | 1,224 (99.0%) | 1,760 (96.9%) |
Income Below Poverty Among Married-Couple Families in Arlington Heights
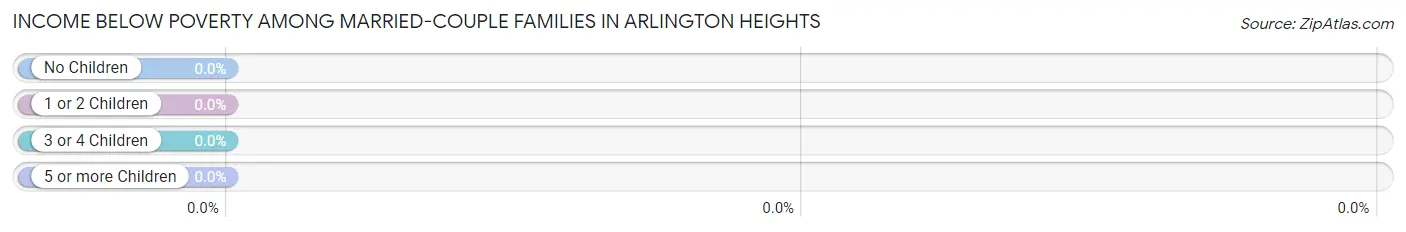
| Children | Above Poverty | Below Poverty |
| No Children | 349 (100.0%) | 0 (0.0%) |
| 1 or 2 Children | 291 (100.0%) | 0 (0.0%) |
| 3 or 4 Children | 29 (100.0%) | 0 (0.0%) |
| 5 or more Children | 0 (0.0%) | 0 (0.0%) |
| Total | 669 (100.0%) | 0 (0.0%) |
Income Below Poverty Among Single-Parent Households in Arlington Heights
| Children | Single Father | Single Mother |
| No Children | 0 (0.0%) | 0 (0.0%) |
| 1 or 2 Children | 0 (0.0%) | 0 (0.0%) |
| 3 or 4 Children | 0 (0.0%) | 0 (0.0%) |
| 5 or more Children | 0 (0.0%) | 0 (0.0%) |
| Total | 0 (0.0%) | 0 (0.0%) |
Income Below Poverty Among Married-Couple vs Single-Parent Households in Arlington Heights
| Children | Married-Couple Families | Single-Parent Households |
| No Children | 0 (0.0%) | 0 (0.0%) |
| 1 or 2 Children | 0 (0.0%) | 0 (0.0%) |
| 3 or 4 Children | 0 (0.0%) | 0 (0.0%) |
| 5 or more Children | 0 (0.0%) | 0 (0.0%) |
| Total | 0 (0.0%) | 0 (0.0%) |
Race in Arlington Heights
The most populous races in Arlington Heights are White / Caucasian (2,841 | 91.0%), Hispanic or Latino (184 | 5.9%), and Some other Race (105 | 3.4%).
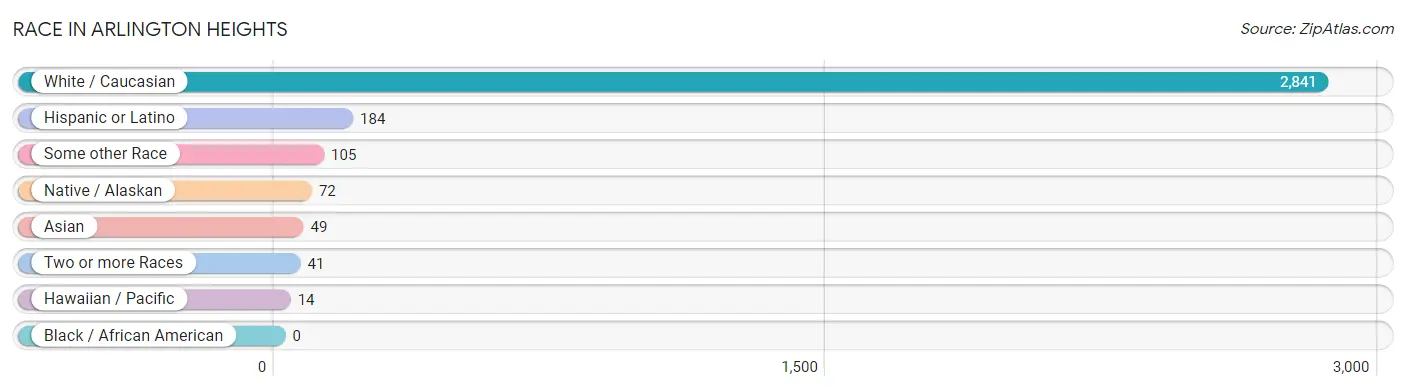
| Race | # Population | % Population |
| Asian | 49 | 1.6% |
| Black / African American | 0 | 0.0% |
| Hawaiian / Pacific | 14 | 0.4% |
| Hispanic or Latino | 184 | 5.9% |
| Native / Alaskan | 72 | 2.3% |
| White / Caucasian | 2,841 | 91.0% |
| Two or more Races | 41 | 1.3% |
| Some other Race | 105 | 3.4% |
| Total | 3,122 | 100.0% |
Ancestry in Arlington Heights
The most populous ancestries reported in Arlington Heights are Irish (539 | 17.3%), Norwegian (478 | 15.3%), German (460 | 14.7%), English (429 | 13.7%), and Swedish (250 | 8.0%), together accounting for 69.0% of all Arlington Heights residents.
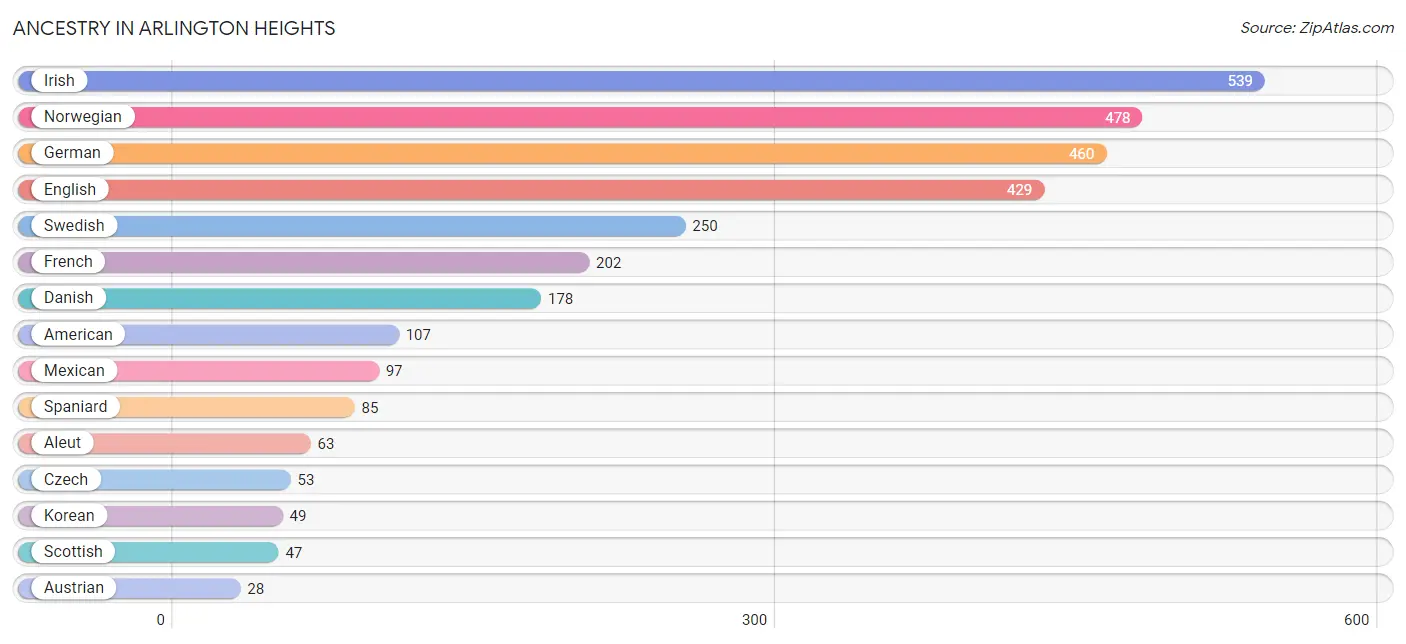
| Ancestry | # Population | % Population |
| Aleut | 63 | 2.0% |
| American | 107 | 3.4% |
| Austrian | 28 | 0.9% |
| Cherokee | 10 | 0.3% |
| Czech | 53 | 1.7% |
| Danish | 178 | 5.7% |
| English | 429 | 13.7% |
| Finnish | 24 | 0.8% |
| French | 202 | 6.5% |
| French Canadian | 15 | 0.5% |
| German | 460 | 14.7% |
| Irish | 539 | 17.3% |
| Korean | 49 | 1.6% |
| Mexican | 97 | 3.1% |
| Norwegian | 478 | 15.3% |
| Puget Sound Salish | 9 | 0.3% |
| Scandinavian | 24 | 0.8% |
| Scottish | 47 | 1.5% |
| Spaniard | 85 | 2.7% |
| Spanish | 2 | 0.1% |
| Swedish | 250 | 8.0% |
| Welsh | 18 | 0.6% | View All 22 Rows |
Immigrants in Arlington Heights
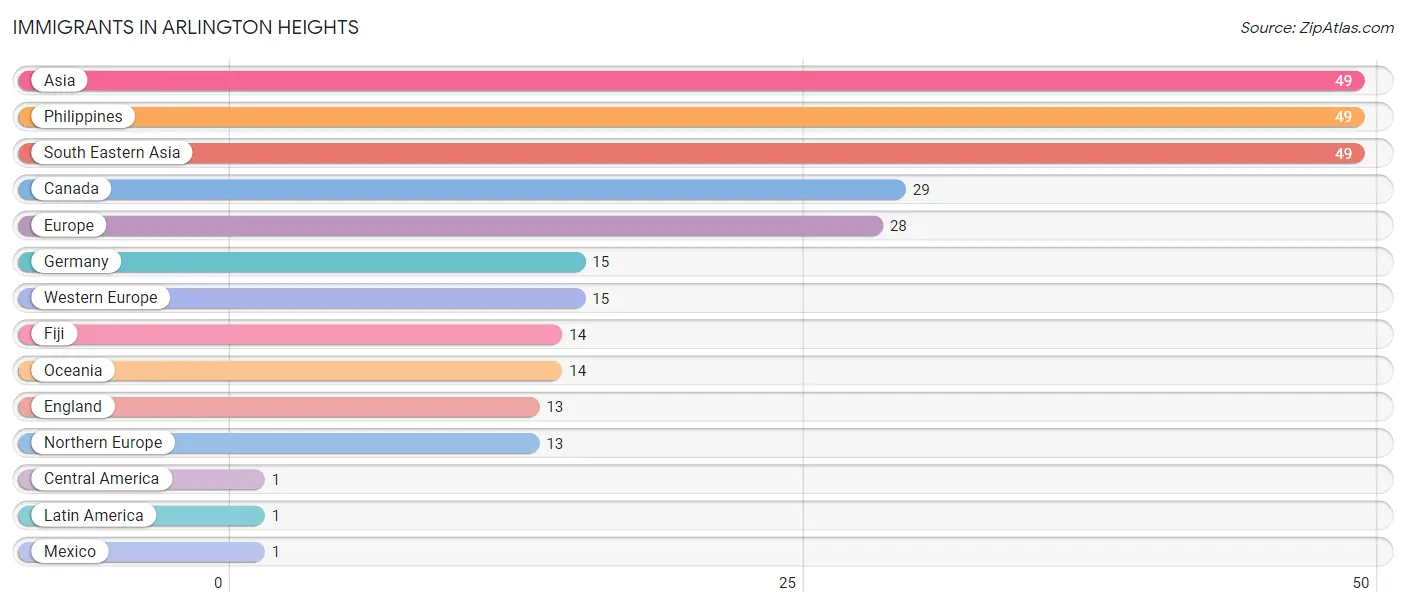
The most numerous immigrant groups reported in Arlington Heights came from Asia (49 | 1.6%), Philippines (49 | 1.6%), South Eastern Asia (49 | 1.6%), Canada (29 | 0.9%), and Europe (28 | 0.9%), together accounting for 6.5% of all Arlington Heights residents.
| Immigration Origin | # Population | % Population |
| Asia | 49 | 1.6% |
| Canada | 29 | 0.9% |
| Central America | 1 | 0.0% |
| England | 13 | 0.4% |
| Europe | 28 | 0.9% |
| Fiji | 14 | 0.4% |
| Germany | 15 | 0.5% |
| Latin America | 1 | 0.0% |
| Mexico | 1 | 0.0% |
| Northern Europe | 13 | 0.4% |
| Oceania | 14 | 0.4% |
| Philippines | 49 | 1.6% |
| South Eastern Asia | 49 | 1.6% |
| Western Europe | 15 | 0.5% | View All 14 Rows |
Sex and Age in Arlington Heights
Sex and Age in Arlington Heights
The most populous age groups in Arlington Heights are 50 to 54 Years (152 | 12.2%) for men and 15 to 19 Years (282 | 15.0%) for women.
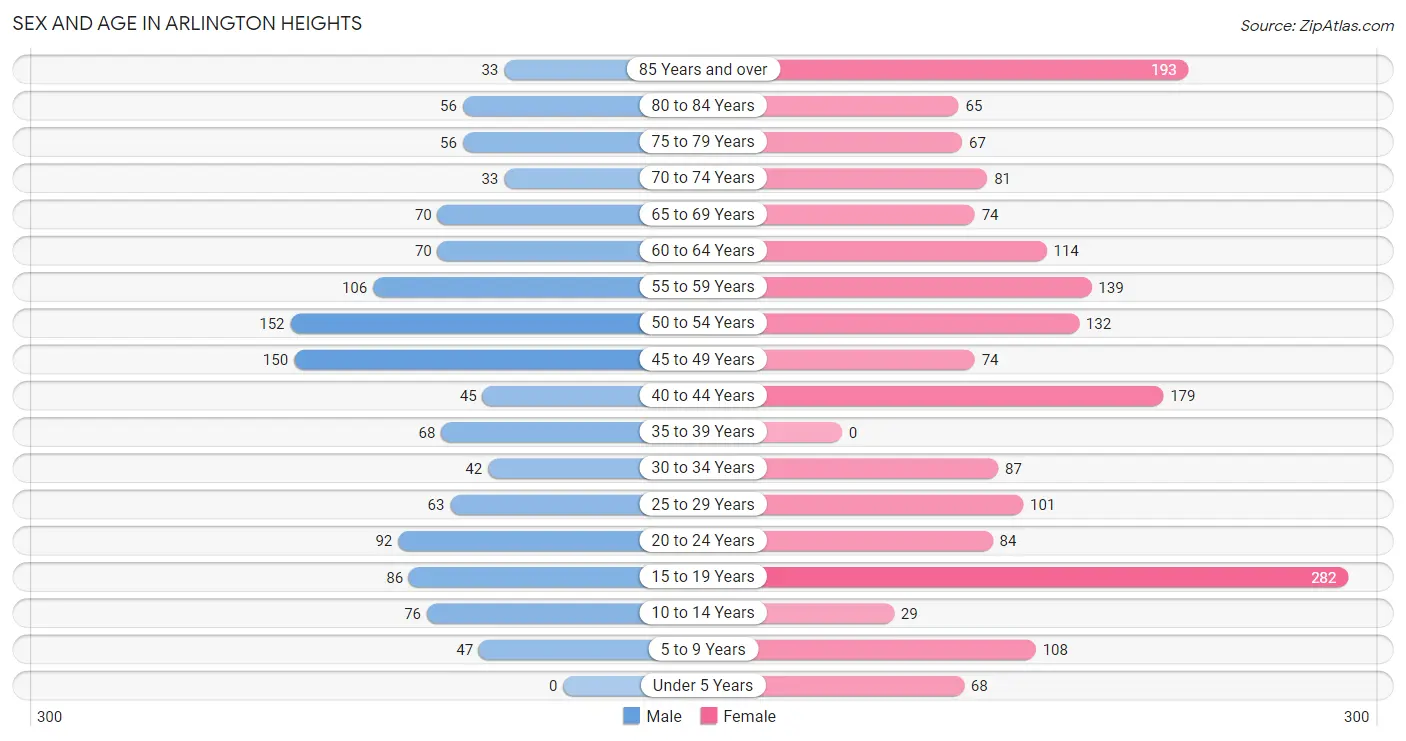
| Age Bracket | Male | Female |
| Under 5 Years | 0 (0.0%) | 68 (3.6%) |
| 5 to 9 Years | 47 (3.8%) | 108 (5.8%) |
| 10 to 14 Years | 76 (6.1%) | 29 (1.5%) |
| 15 to 19 Years | 86 (6.9%) | 282 (15.0%) |
| 20 to 24 Years | 92 (7.4%) | 84 (4.5%) |
| 25 to 29 Years | 63 (5.1%) | 101 (5.4%) |
| 30 to 34 Years | 42 (3.4%) | 87 (4.6%) |
| 35 to 39 Years | 68 (5.5%) | 0 (0.0%) |
| 40 to 44 Years | 45 (3.6%) | 179 (9.5%) |
| 45 to 49 Years | 150 (12.0%) | 74 (3.9%) |
| 50 to 54 Years | 152 (12.2%) | 132 (7.0%) |
| 55 to 59 Years | 106 (8.5%) | 139 (7.4%) |
| 60 to 64 Years | 70 (5.6%) | 114 (6.1%) |
| 65 to 69 Years | 70 (5.6%) | 74 (3.9%) |
| 70 to 74 Years | 33 (2.6%) | 81 (4.3%) |
| 75 to 79 Years | 56 (4.5%) | 67 (3.6%) |
| 80 to 84 Years | 56 (4.5%) | 65 (3.5%) |
| 85 Years and over | 33 (2.6%) | 193 (10.3%) |
| Total | 1,245 (100.0%) | 1,877 (100.0%) |
Families and Households in Arlington Heights
Median Family Size in Arlington Heights
The median family size in Arlington Heights is 3.29 persons per family, with married-couple families (669 | 83.2%) accounting for the largest median family size of 3.31 persons per family. On the other hand, single male/father families (25 | 3.1%) represent the smallest median family size with 2.88 persons per family.
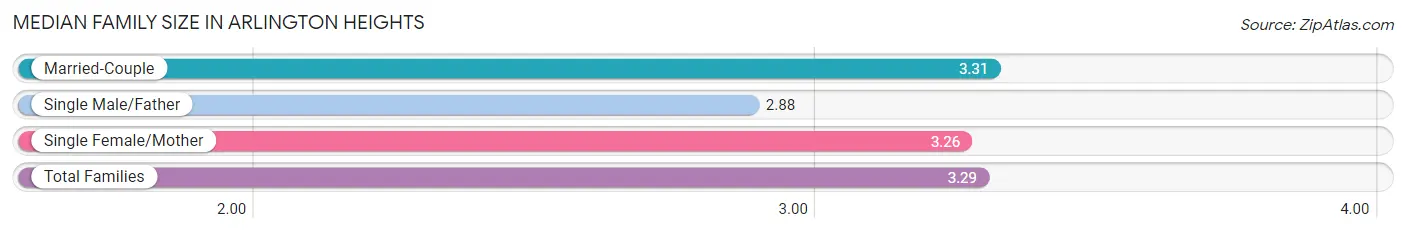
| Family Type | # Families | Family Size |
| Married-Couple | 669 (83.2%) | 3.31 |
| Single Male/Father | 25 (3.1%) | 2.88 |
| Single Female/Mother | 110 (13.7%) | 3.26 |
| Total Families | 804 (100.0%) | 3.29 |
Median Household Size in Arlington Heights
The median household size in Arlington Heights is 2.79 persons per household, with single male/father households (25 | 2.2%) accounting for the largest median household size of 4.8 persons per household. non-family households (314 | 28.1%) represent the smallest median household size with 1.29 persons per household.
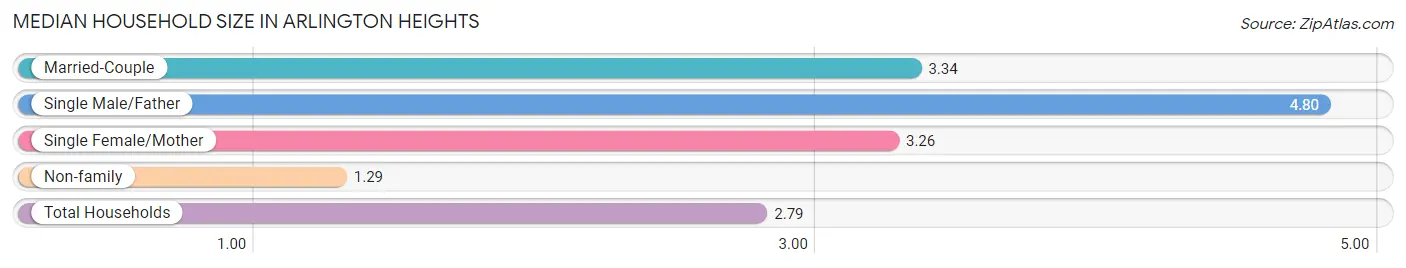
| Household Type | # Households | Household Size |
| Married-Couple | 669 (59.8%) | 3.34 |
| Single Male/Father | 25 (2.2%) | 4.80 |
| Single Female/Mother | 110 (9.8%) | 3.26 |
| Non-family | 314 (28.1%) | 1.29 |
| Total Households | 1,118 (100.0%) | 2.79 |
Household Size by Marriage Status in Arlington Heights
Out of a total of 1,118 households in Arlington Heights, 804 (71.9%) are family households, while 314 (28.1%) are nonfamily households. The most numerous type of family households are 4-person households, comprising 346, and the most common type of nonfamily households are 1-person households, comprising 269.
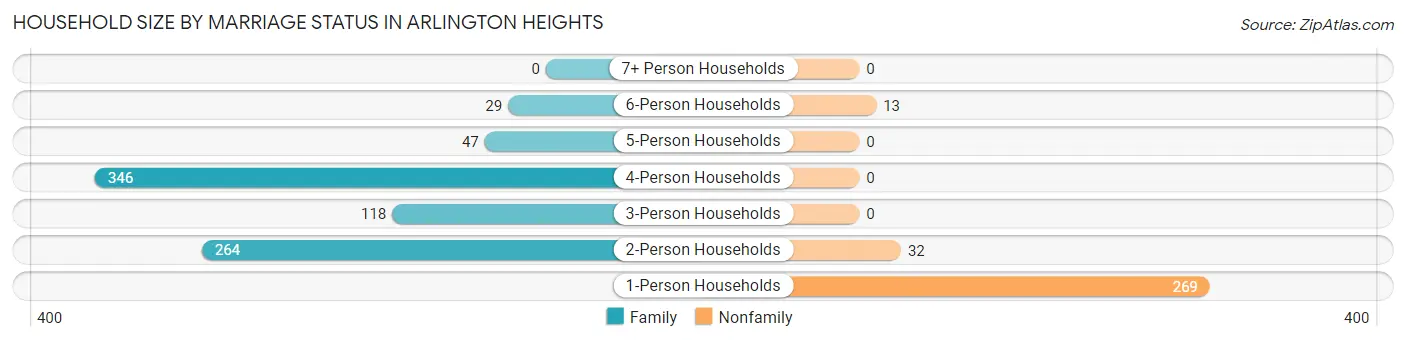
| Household Size | Family Households | Nonfamily Households |
| 1-Person Households | - | 269 (24.1%) |
| 2-Person Households | 264 (23.6%) | 32 (2.9%) |
| 3-Person Households | 118 (10.5%) | 0 (0.0%) |
| 4-Person Households | 346 (30.9%) | 0 (0.0%) |
| 5-Person Households | 47 (4.2%) | 0 (0.0%) |
| 6-Person Households | 29 (2.6%) | 13 (1.2%) |
| 7+ Person Households | 0 (0.0%) | 0 (0.0%) |
| Total | 804 (71.9%) | 314 (28.1%) |
Female Fertility in Arlington Heights
Fertility by Age in Arlington Heights
Average fertility rate in Arlington Heights is 48.0 births per 1,000 women. Women in the age bracket of 35 to 50 years have the highest fertility rate with 125.0 births per 1,000 women. Women in the age bracket of 35 to 50 years acount for 100.0% of all women with births.
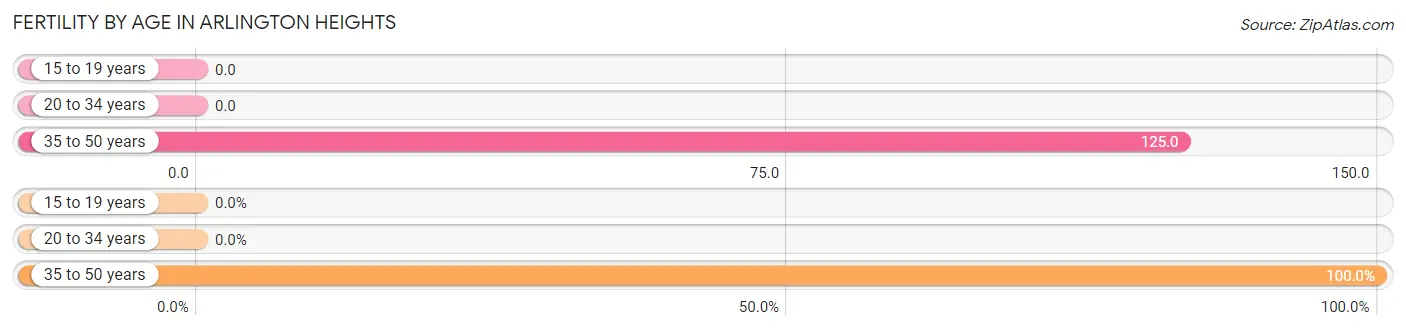
| Age Bracket | Women with Births | Births / 1,000 Women |
| 15 to 19 years | 0 (0.0%) | 0.0 |
| 20 to 34 years | 0 (0.0%) | 0.0 |
| 35 to 50 years | 43 (100.0%) | 125.0 |
| Total | 43 (100.0%) | 48.0 |
Fertility by Age by Marriage Status in Arlington Heights
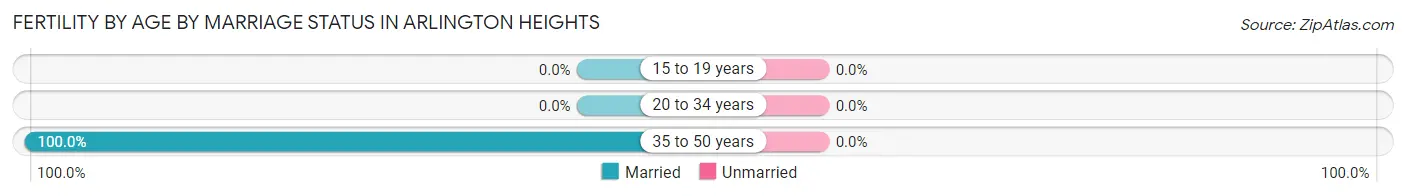
| Age Bracket | Married | Unmarried |
| 15 to 19 years | 0 (0.0%) | 0 (0.0%) |
| 20 to 34 years | 0 (0.0%) | 0 (0.0%) |
| 35 to 50 years | 43 (100.0%) | 0 (0.0%) |
| Total | 43 (100.0%) | 0 (0.0%) |
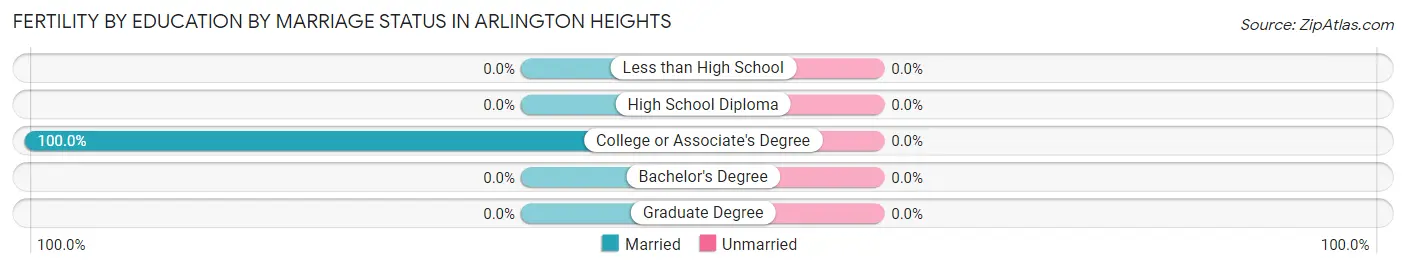
Fertility by Education in Arlington Heights
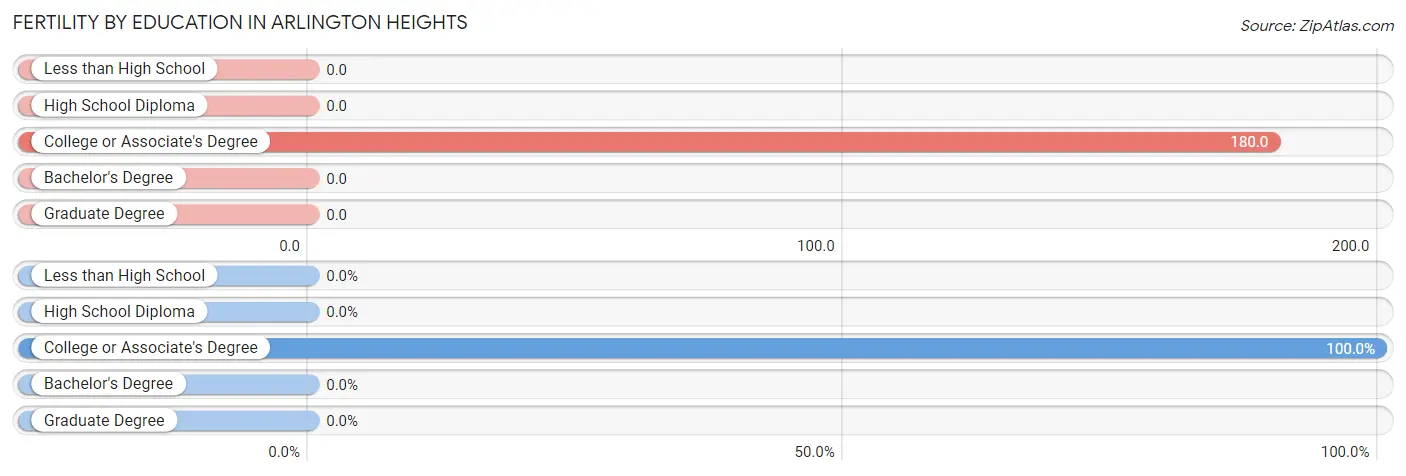
| Educational Attainment | Women with Births | Births / 1,000 Women |
| Less than High School | 0 (0.0%) | 0.0 |
| High School Diploma | 0 (0.0%) | 0.0 |
| College or Associate's Degree | 43 (100.0%) | 180.0 |
| Bachelor's Degree | 0 (0.0%) | 0.0 |
| Graduate Degree | 0 (0.0%) | 0.0 |
| Total | 43 (100.0%) | 48.0 |
Fertility by Education by Marriage Status in Arlington Heights
| Educational Attainment | Married | Unmarried |
| Less than High School | 0 (0.0%) | 0 (0.0%) |
| High School Diploma | 0 (0.0%) | 0 (0.0%) |
| College or Associate's Degree | 43 (100.0%) | 0 (0.0%) |
| Bachelor's Degree | 0 (0.0%) | 0 (0.0%) |
| Graduate Degree | 0 (0.0%) | 0 (0.0%) |
| Total | 43 (100.0%) | 0 (0.0%) |
Employment Characteristics in Arlington Heights
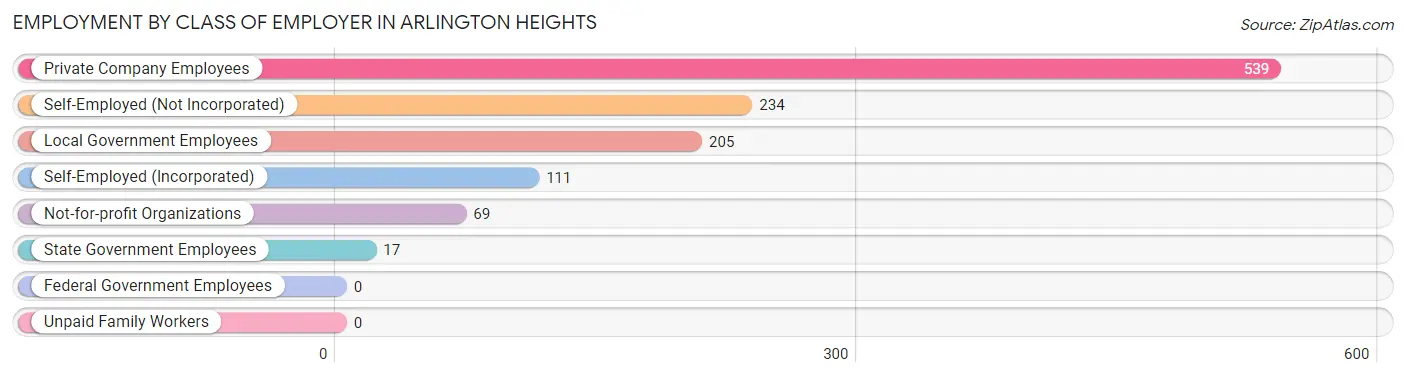
Employment by Class of Employer in Arlington Heights
Among the 1,175 employed individuals in Arlington Heights, private company employees (539 | 45.9%), self-employed (not incorporated) (234 | 19.9%), and local government employees (205 | 17.4%) make up the most common classes of employment.
| Employer Class | # Employees | % Employees |
| Private Company Employees | 539 | 45.9% |
| Self-Employed (Incorporated) | 111 | 9.5% |
| Self-Employed (Not Incorporated) | 234 | 19.9% |
| Not-for-profit Organizations | 69 | 5.9% |
| Local Government Employees | 205 | 17.4% |
| State Government Employees | 17 | 1.5% |
| Federal Government Employees | 0 | 0.0% |
| Unpaid Family Workers | 0 | 0.0% |
| Total | 1,175 | 100.0% |
Employment Status by Age in Arlington Heights
According to the labor force statistics for Arlington Heights, out of the total population over 16 years of age (2,767), 49.9% or 1,381 individuals are in the labor force, with 2.9% or 40 of them unemployed. The age group with the highest labor force participation rate is 55 to 59 years, with 93.9% or 230 individuals in the labor force. Within the labor force, the 20 to 24 years age range has the highest percentage of unemployed individuals, with 31.0% or 26 of them being unemployed.
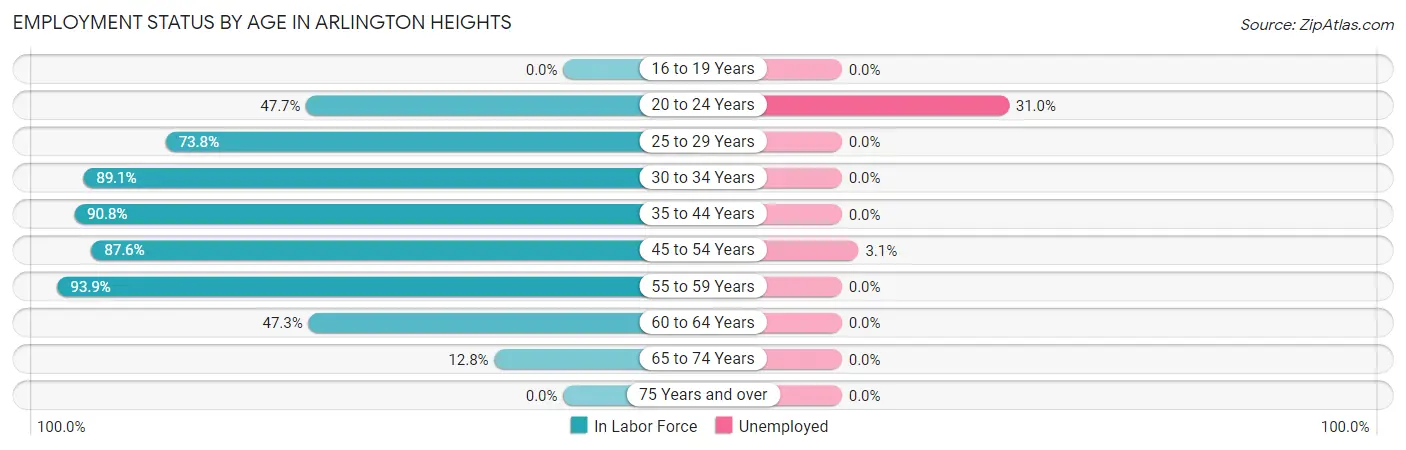
| Age Bracket | In Labor Force | Unemployed |
| 16 to 19 Years | 0 (0.0%) | 0 (0.0%) |
| 20 to 24 Years | 84 (47.7%) | 26 (31.0%) |
| 25 to 29 Years | 121 (73.8%) | 0 (0.0%) |
| 30 to 34 Years | 115 (89.1%) | 0 (0.0%) |
| 35 to 44 Years | 265 (90.8%) | 0 (0.0%) |
| 45 to 54 Years | 445 (87.6%) | 14 (3.1%) |
| 55 to 59 Years | 230 (93.9%) | 0 (0.0%) |
| 60 to 64 Years | 87 (47.3%) | 0 (0.0%) |
| 65 to 74 Years | 33 (12.8%) | 0 (0.0%) |
| 75 Years and over | 0 (0.0%) | 0 (0.0%) |
| Total | 1,381 (49.9%) | 40 (2.9%) |
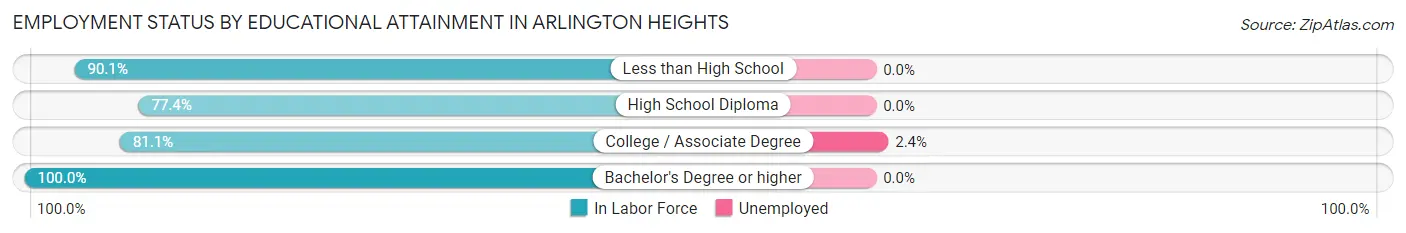
Employment Status by Educational Attainment in Arlington Heights
According to labor force statistics for Arlington Heights, 83.0% of individuals (1,263) out of the total population between 25 and 64 years of age (1,522) are in the labor force, with 1.1% or 14 of them being unemployed. The group with the highest labor force participation rate are those with the educational attainment of bachelor's degree or higher, with 100.0% or 174 individuals in the labor force. Within the labor force, individuals with college / associate degree education have the highest percentage of unemployment, with 2.4% or 14 of them being unemployed.
| Educational Attainment | In Labor Force | Unemployed |
| Less than High School | 137 (90.1%) | 0 (0.0%) |
| High School Diploma | 377 (77.4%) | 0 (0.0%) |
| College / Associate Degree | 575 (81.1%) | 17 (2.4%) |
| Bachelor's Degree or higher | 174 (100.0%) | 0 (0.0%) |
| Total | 1,263 (83.0%) | 17 (1.1%) |
Employment Occupations by Sex in Arlington Heights
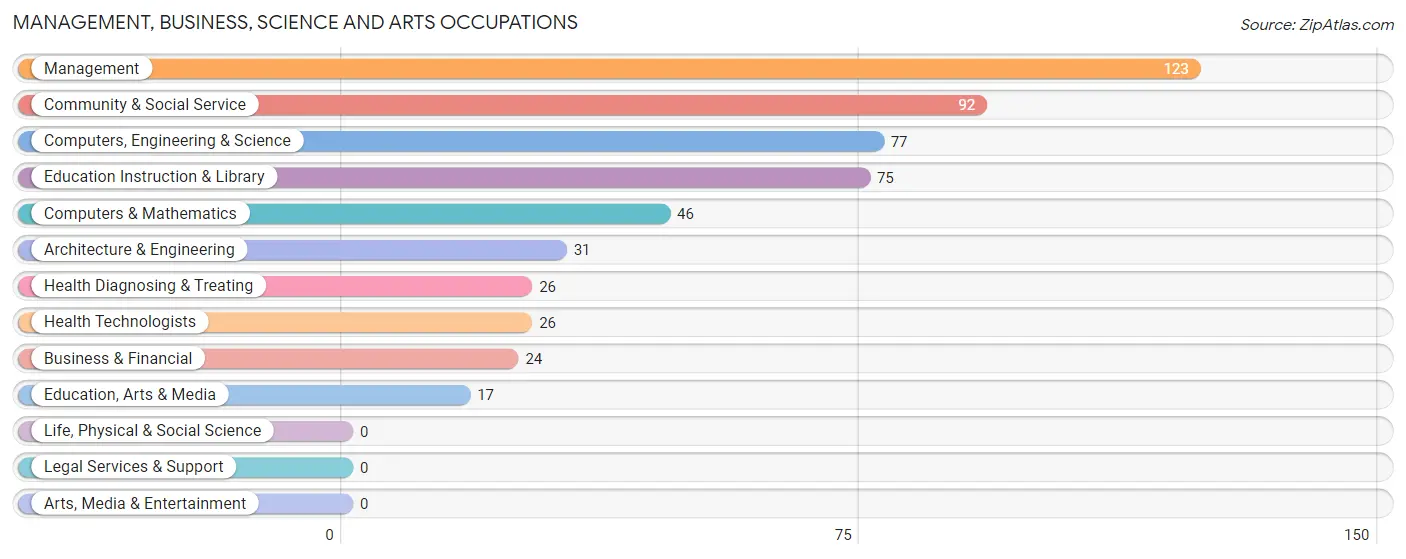
Management, Business, Science and Arts Occupations
The most common Management, Business, Science and Arts occupations in Arlington Heights are Management (123 | 9.2%), Community & Social Service (92 | 6.9%), Computers, Engineering & Science (77 | 5.8%), Education Instruction & Library (75 | 5.6%), and Computers & Mathematics (46 | 3.4%).
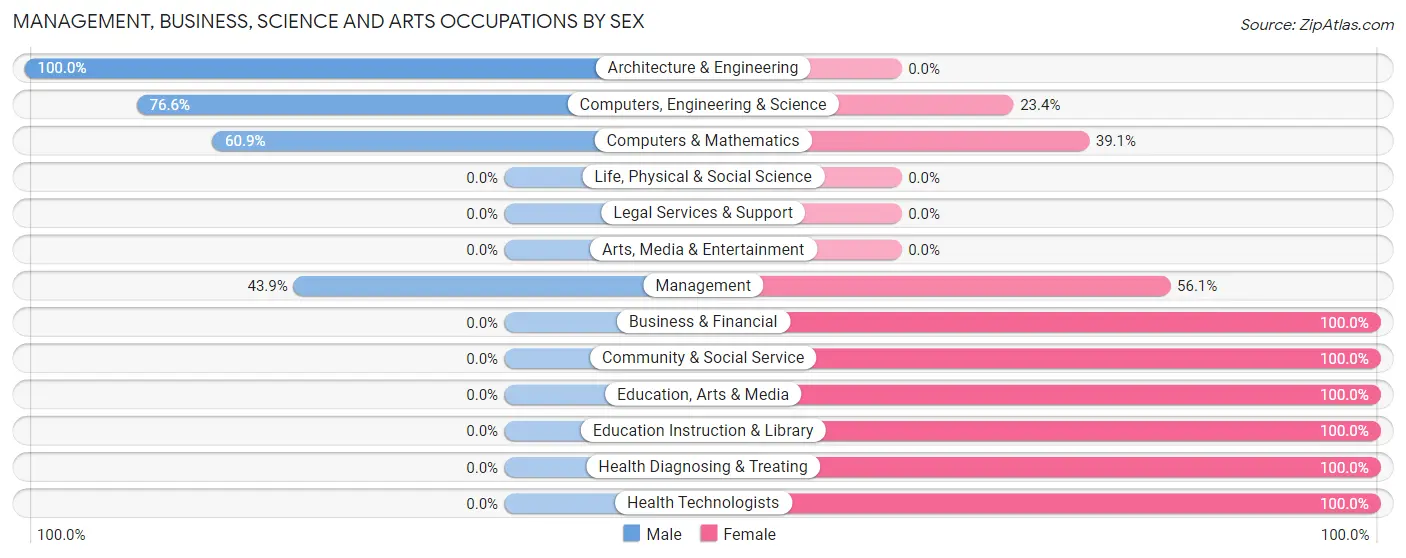
Management, Business, Science and Arts Occupations by Sex
Within the Management, Business, Science and Arts occupations in Arlington Heights, the most male-oriented occupations are Architecture & Engineering (100.0%), Computers, Engineering & Science (76.6%), and Computers & Mathematics (60.9%), while the most female-oriented occupations are Business & Financial (100.0%), Community & Social Service (100.0%), and Education, Arts & Media (100.0%).
| Occupation | Male | Female |
| Management | 54 (43.9%) | 69 (56.1%) |
| Business & Financial | 0 (0.0%) | 24 (100.0%) |
| Computers, Engineering & Science | 59 (76.6%) | 18 (23.4%) |
| Computers & Mathematics | 28 (60.9%) | 18 (39.1%) |
| Architecture & Engineering | 31 (100.0%) | 0 (0.0%) |
| Life, Physical & Social Science | 0 (0.0%) | 0 (0.0%) |
| Community & Social Service | 0 (0.0%) | 92 (100.0%) |
| Education, Arts & Media | 0 (0.0%) | 17 (100.0%) |
| Legal Services & Support | 0 (0.0%) | 0 (0.0%) |
| Education Instruction & Library | 0 (0.0%) | 75 (100.0%) |
| Arts, Media & Entertainment | 0 (0.0%) | 0 (0.0%) |
| Health Diagnosing & Treating | 0 (0.0%) | 26 (100.0%) |
| Health Technologists | 0 (0.0%) | 26 (100.0%) |
| Total (Category) | 113 (33.0%) | 229 (67.0%) |
| Total (Overall) | 694 (51.8%) | 646 (48.2%) |
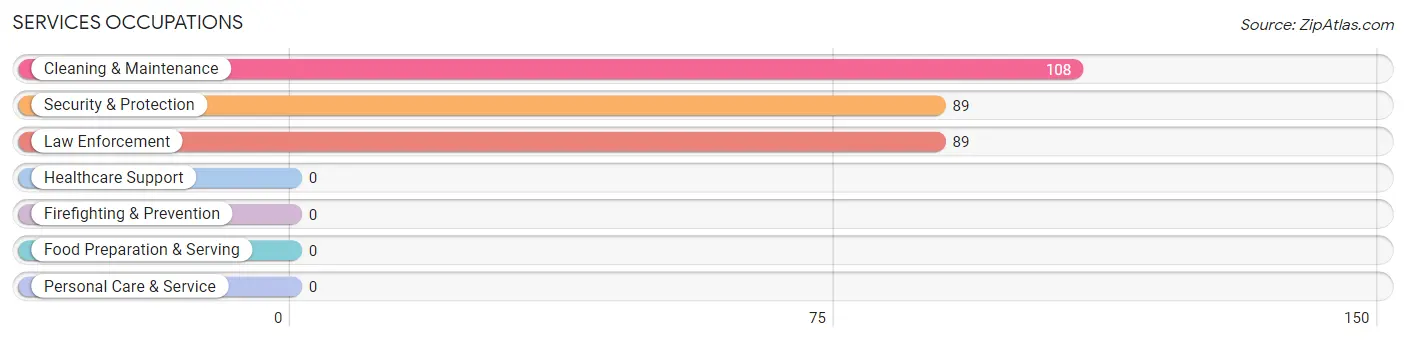
Services Occupations
The most common Services occupations in Arlington Heights are Cleaning & Maintenance (108 | 8.1%), Security & Protection (89 | 6.6%), and Law Enforcement (89 | 6.6%).
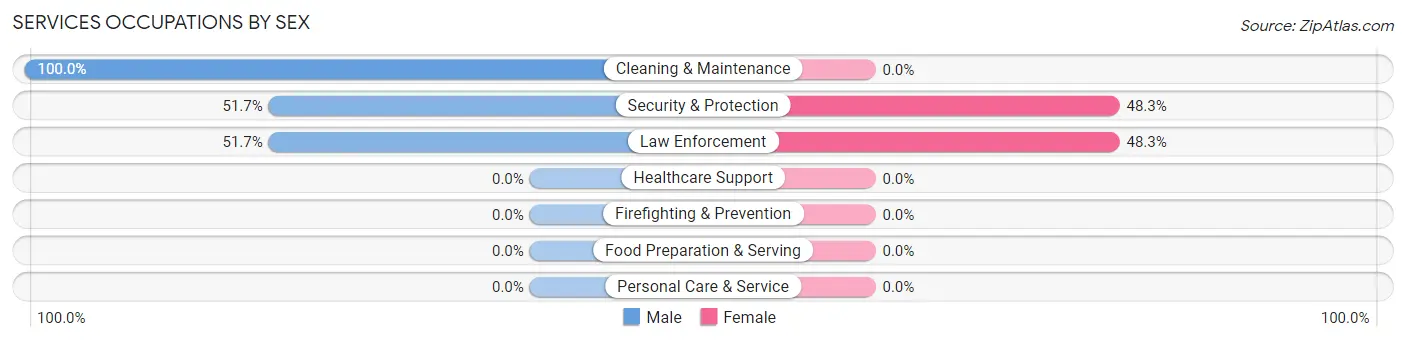
Services Occupations by Sex
Within the Services occupations in Arlington Heights, the most male-oriented occupations are Cleaning & Maintenance (100.0%), Security & Protection (51.7%), and Law Enforcement (51.7%), while the most female-oriented occupations are Security & Protection (48.3%), and Law Enforcement (48.3%).
| Occupation | Male | Female |
| Healthcare Support | 0 (0.0%) | 0 (0.0%) |
| Security & Protection | 46 (51.7%) | 43 (48.3%) |
| Firefighting & Prevention | 0 (0.0%) | 0 (0.0%) |
| Law Enforcement | 46 (51.7%) | 43 (48.3%) |
| Food Preparation & Serving | 0 (0.0%) | 0 (0.0%) |
| Cleaning & Maintenance | 108 (100.0%) | 0 (0.0%) |
| Personal Care & Service | 0 (0.0%) | 0 (0.0%) |
| Total (Category) | 154 (78.2%) | 43 (21.8%) |
| Total (Overall) | 694 (51.8%) | 646 (48.2%) |
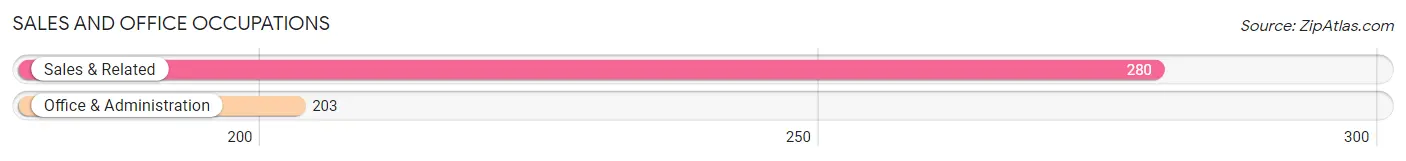
Sales and Office Occupations
The most common Sales and Office occupations in Arlington Heights are Sales & Related (280 | 20.9%), and Office & Administration (203 | 15.1%).
Sales and Office Occupations by Sex
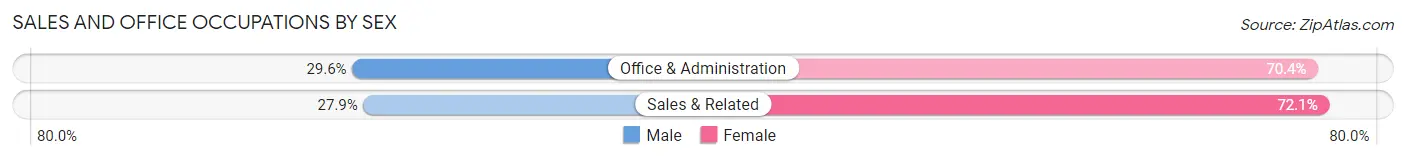
| Occupation | Male | Female |
| Sales & Related | 78 (27.9%) | 202 (72.1%) |
| Office & Administration | 60 (29.6%) | 143 (70.4%) |
| Total (Category) | 138 (28.6%) | 345 (71.4%) |
| Total (Overall) | 694 (51.8%) | 646 (48.2%) |
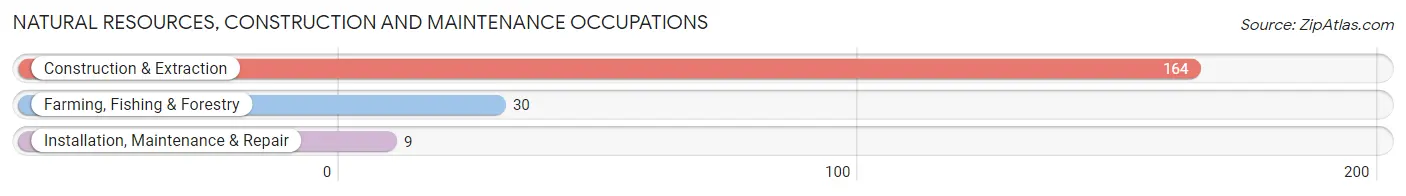
Natural Resources, Construction and Maintenance Occupations
The most common Natural Resources, Construction and Maintenance occupations in Arlington Heights are Construction & Extraction (164 | 12.2%), Farming, Fishing & Forestry (30 | 2.2%), and Installation, Maintenance & Repair (9 | 0.7%).
Natural Resources, Construction and Maintenance Occupations by Sex
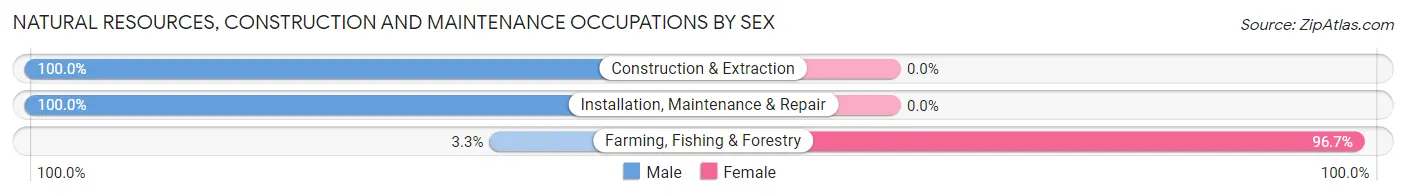
| Occupation | Male | Female |
| Farming, Fishing & Forestry | 1 (3.3%) | 29 (96.7%) |
| Construction & Extraction | 164 (100.0%) | 0 (0.0%) |
| Installation, Maintenance & Repair | 9 (100.0%) | 0 (0.0%) |
| Total (Category) | 174 (85.7%) | 29 (14.3%) |
| Total (Overall) | 694 (51.8%) | 646 (48.2%) |
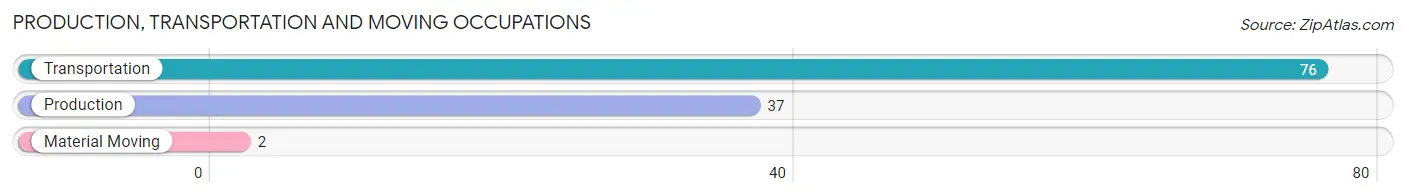
Production, Transportation and Moving Occupations
The most common Production, Transportation and Moving occupations in Arlington Heights are Transportation (76 | 5.7%), Production (37 | 2.8%), and Material Moving (2 | 0.2%).
Production, Transportation and Moving Occupations by Sex
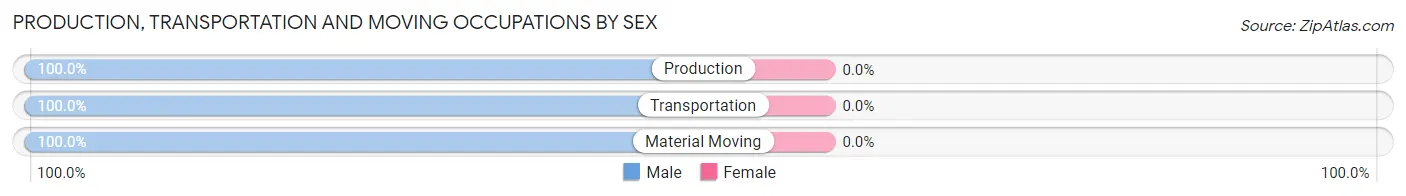
| Occupation | Male | Female |
| Production | 37 (100.0%) | 0 (0.0%) |
| Transportation | 76 (100.0%) | 0 (0.0%) |
| Material Moving | 2 (100.0%) | 0 (0.0%) |
| Total (Category) | 115 (100.0%) | 0 (0.0%) |
| Total (Overall) | 694 (51.8%) | 646 (48.2%) |
Employment Industries by Sex in Arlington Heights
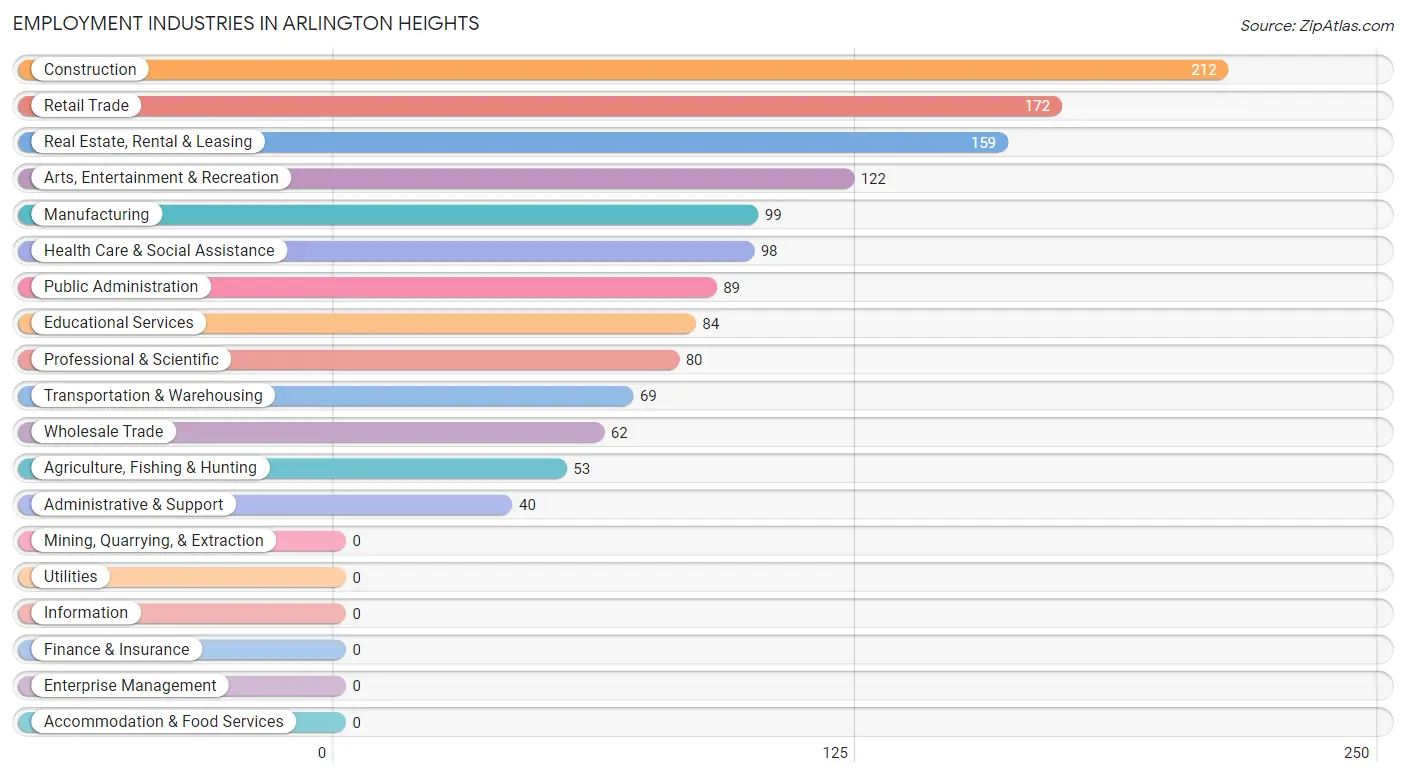
Employment Industries in Arlington Heights
The major employment industries in Arlington Heights include Construction (212 | 15.8%), Retail Trade (172 | 12.8%), Real Estate, Rental & Leasing (159 | 11.9%), Arts, Entertainment & Recreation (122 | 9.1%), and Manufacturing (99 | 7.4%).
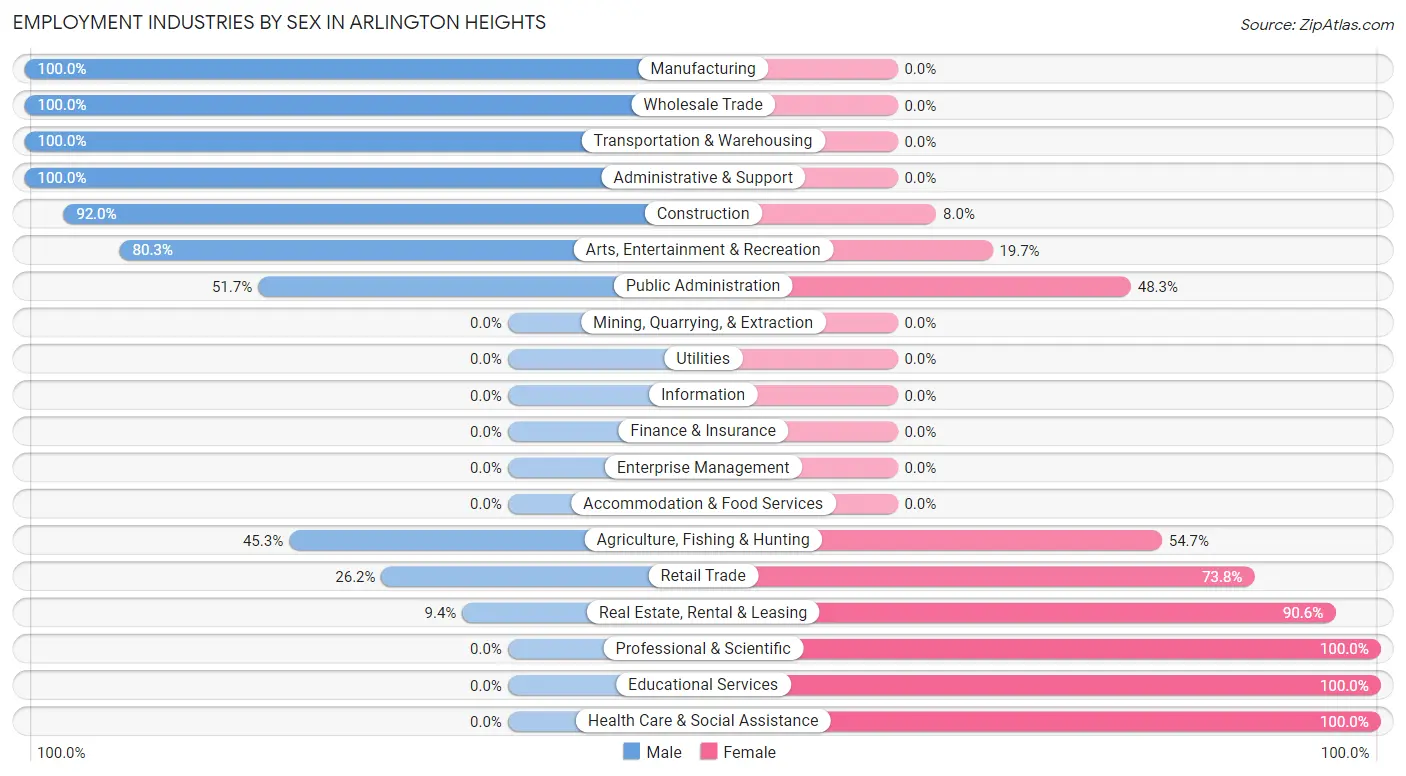
Employment Industries by Sex in Arlington Heights
The Arlington Heights industries that see more men than women are Manufacturing (100.0%), Wholesale Trade (100.0%), and Transportation & Warehousing (100.0%), whereas the industries that tend to have a higher number of women are Professional & Scientific (100.0%), Educational Services (100.0%), and Health Care & Social Assistance (100.0%).
| Industry | Male | Female |
| Agriculture, Fishing & Hunting | 24 (45.3%) | 29 (54.7%) |
| Mining, Quarrying, & Extraction | 0 (0.0%) | 0 (0.0%) |
| Construction | 195 (92.0%) | 17 (8.0%) |
| Manufacturing | 99 (100.0%) | 0 (0.0%) |
| Wholesale Trade | 62 (100.0%) | 0 (0.0%) |
| Retail Trade | 45 (26.2%) | 127 (73.8%) |
| Transportation & Warehousing | 69 (100.0%) | 0 (0.0%) |
| Utilities | 0 (0.0%) | 0 (0.0%) |
| Information | 0 (0.0%) | 0 (0.0%) |
| Finance & Insurance | 0 (0.0%) | 0 (0.0%) |
| Real Estate, Rental & Leasing | 15 (9.4%) | 144 (90.6%) |
| Professional & Scientific | 0 (0.0%) | 80 (100.0%) |
| Enterprise Management | 0 (0.0%) | 0 (0.0%) |
| Administrative & Support | 40 (100.0%) | 0 (0.0%) |
| Educational Services | 0 (0.0%) | 84 (100.0%) |
| Health Care & Social Assistance | 0 (0.0%) | 98 (100.0%) |
| Arts, Entertainment & Recreation | 98 (80.3%) | 24 (19.7%) |
| Accommodation & Food Services | 0 (0.0%) | 0 (0.0%) |
| Public Administration | 46 (51.7%) | 43 (48.3%) |
| Total | 694 (51.8%) | 646 (48.2%) |
Education in Arlington Heights
School Enrollment in Arlington Heights
The most common levels of schooling among the 768 students in Arlington Heights are high school (478 | 62.2%), elementary school (121 | 15.8%), and middle school (50 | 6.5%).
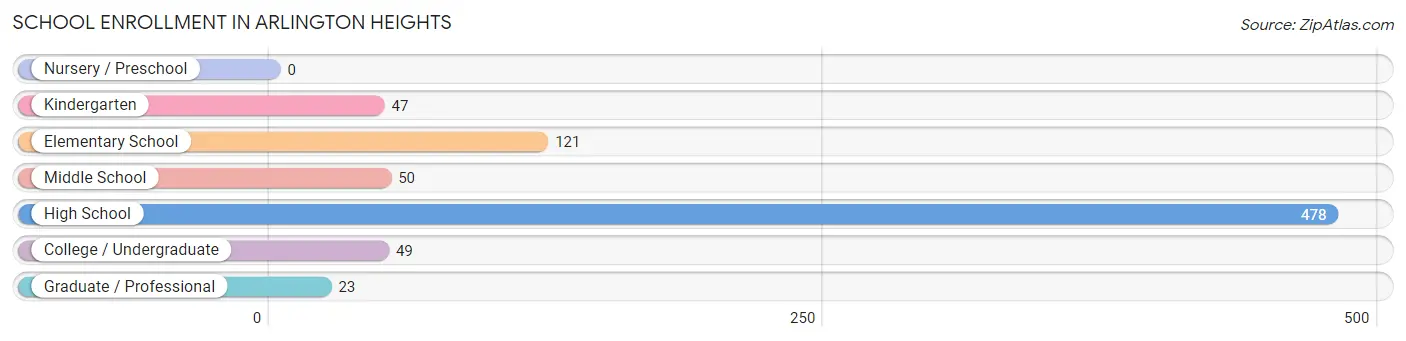
| School Level | # Students | % Students |
| Nursery / Preschool | 0 | 0.0% |
| Kindergarten | 47 | 6.1% |
| Elementary School | 121 | 15.8% |
| Middle School | 50 | 6.5% |
| High School | 478 | 62.2% |
| College / Undergraduate | 49 | 6.4% |
| Graduate / Professional | 23 | 3.0% |
| Total | 768 | 100.0% |
School Enrollment by Age by Funding Source in Arlington Heights
Out of a total of 768 students who are enrolled in schools in Arlington Heights, 48 (6.3%) attend a private institution, while the remaining 720 (93.7%) are enrolled in public schools. The age group of 25 to 34 year olds has the highest likelihood of being enrolled in private schools, with 23 (57.5% in the age bracket) enrolled. Conversely, the age group of 10 to 14 year olds has the lowest likelihood of being enrolled in a private school, with 105 (100.0% in the age bracket) attending a public institution.
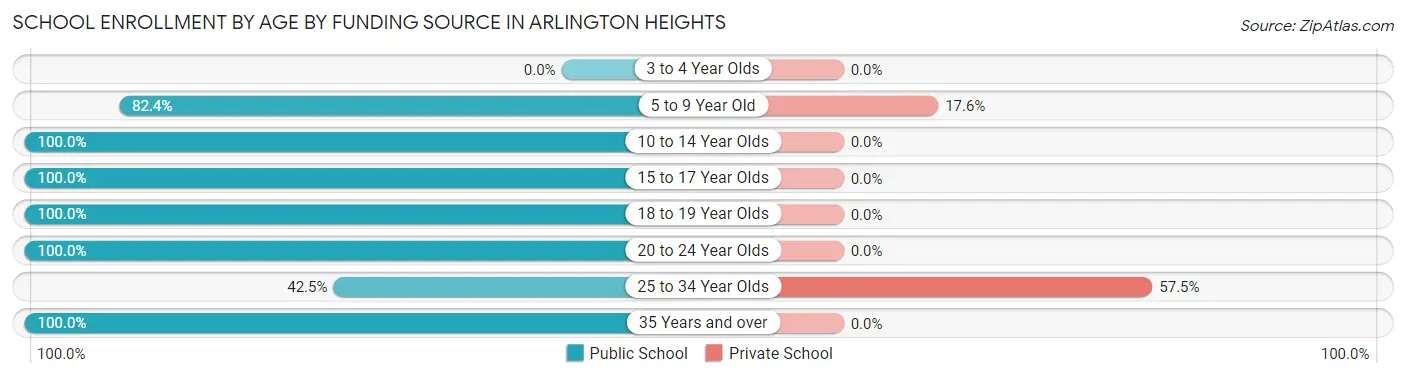
| Age Bracket | Public School | Private School |
| 3 to 4 Year Olds | 0 (0.0%) | 0 (0.0%) |
| 5 to 9 Year Old | 117 (82.4%) | 25 (17.6%) |
| 10 to 14 Year Olds | 105 (100.0%) | 0 (0.0%) |
| 15 to 17 Year Olds | 340 (100.0%) | 0 (0.0%) |
| 18 to 19 Year Olds | 28 (100.0%) | 0 (0.0%) |
| 20 to 24 Year Olds | 92 (100.0%) | 0 (0.0%) |
| 25 to 34 Year Olds | 17 (42.5%) | 23 (57.5%) |
| 35 Years and over | 21 (100.0%) | 0 (0.0%) |
| Total | 720 (93.8%) | 48 (6.3%) |
Educational Attainment by Field of Study in Arlington Heights
Business (87 | 31.3%), visual & performing arts (53 | 19.1%), literature & languages (43 | 15.5%), education (28 | 10.1%), and engineering (27 | 9.7%) are the most common fields of study among 278 individuals in Arlington Heights who have obtained a bachelor's degree or higher.
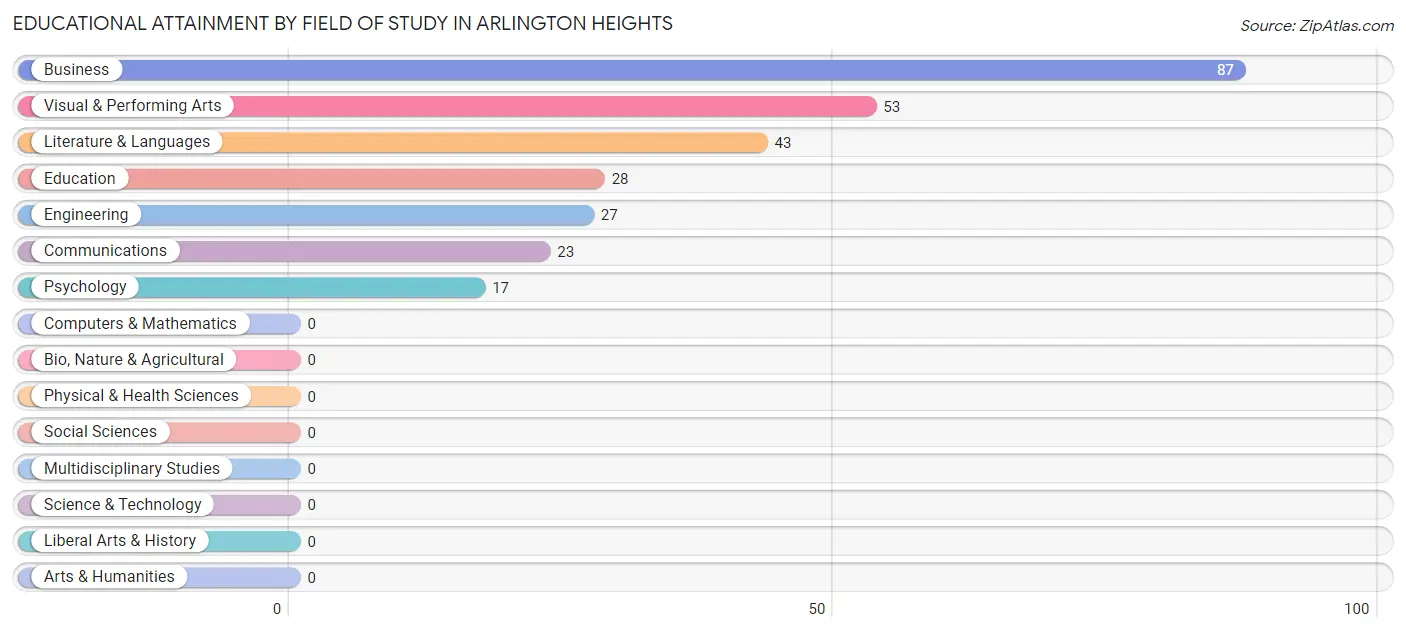
| Field of Study | # Graduates | % Graduates |
| Computers & Mathematics | 0 | 0.0% |
| Bio, Nature & Agricultural | 0 | 0.0% |
| Physical & Health Sciences | 0 | 0.0% |
| Psychology | 17 | 6.1% |
| Social Sciences | 0 | 0.0% |
| Engineering | 27 | 9.7% |
| Multidisciplinary Studies | 0 | 0.0% |
| Science & Technology | 0 | 0.0% |
| Business | 87 | 31.3% |
| Education | 28 | 10.1% |
| Literature & Languages | 43 | 15.5% |
| Liberal Arts & History | 0 | 0.0% |
| Visual & Performing Arts | 53 | 19.1% |
| Communications | 23 | 8.3% |
| Arts & Humanities | 0 | 0.0% |
| Total | 278 | 100.0% |
Transportation & Commute in Arlington Heights
Vehicle Availability by Sex in Arlington Heights
The most prevalent vehicle ownership categories in Arlington Heights are males with 3 vehicles (326, accounting for 49.0%) and females with 3 vehicles (125, making up 64.4%).
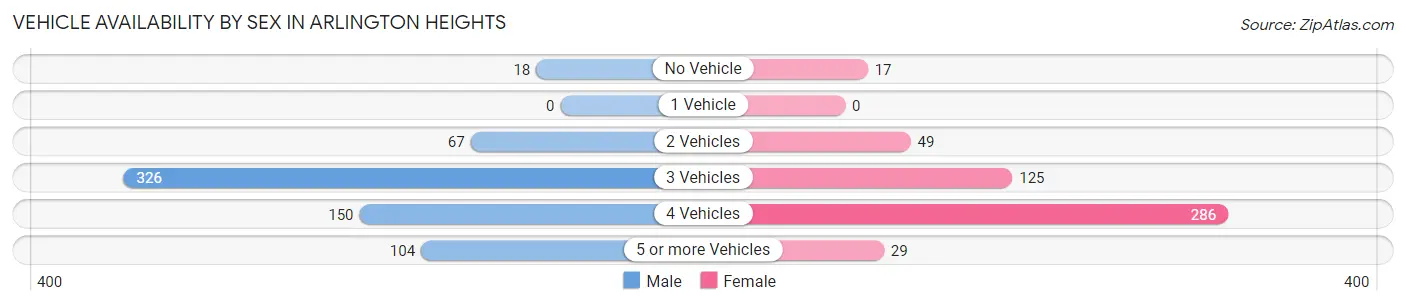
| Vehicles Available | Male | Female |
| No Vehicle | 18 (2.7%) | 17 (3.4%) |
| 1 Vehicle | 0 (0.0%) | 0 (0.0%) |
| 2 Vehicles | 67 (10.1%) | 49 (9.7%) |
| 3 Vehicles | 326 (49.0%) | 125 (24.7%) |
| 4 Vehicles | 150 (22.6%) | 286 (56.5%) |
| 5 or more Vehicles | 104 (15.6%) | 29 (5.7%) |
| Total | 665 (100.0%) | 506 (100.0%) |
Commute Time in Arlington Heights
The most frequently occuring commute durations in Arlington Heights are 35 to 39 minutes (198 commuters, 20.1%), 45 to 59 minutes (182 commuters, 18.5%), and 20 to 24 minutes (148 commuters, 15.0%).
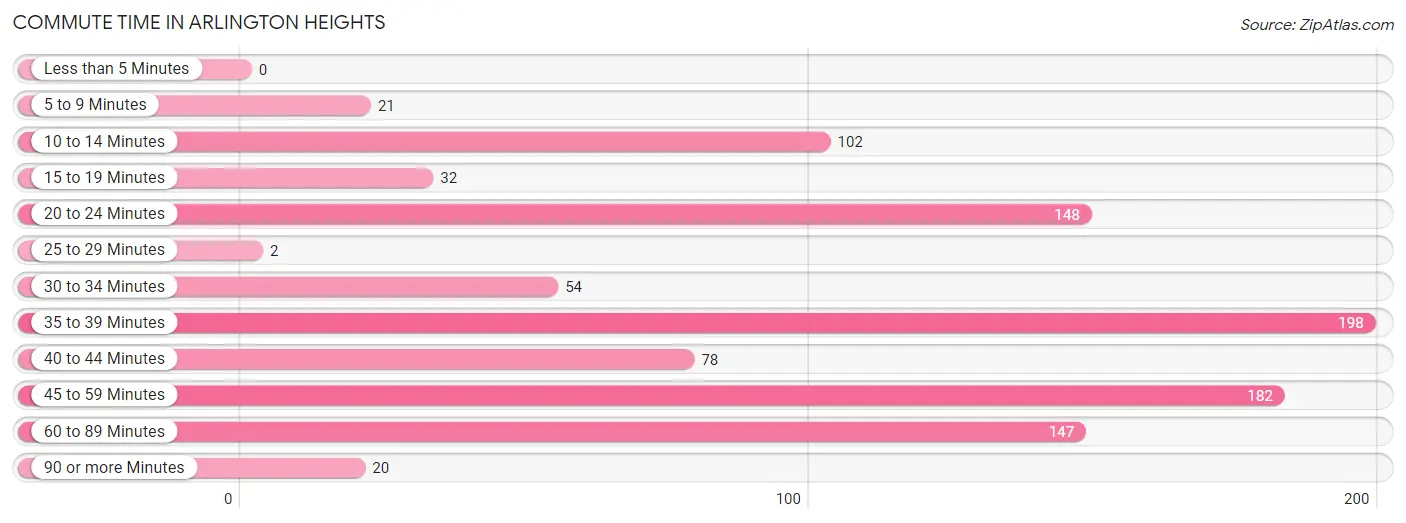
| Commute Time | # Commuters | % Commuters |
| Less than 5 Minutes | 0 | 0.0% |
| 5 to 9 Minutes | 21 | 2.1% |
| 10 to 14 Minutes | 102 | 10.4% |
| 15 to 19 Minutes | 32 | 3.3% |
| 20 to 24 Minutes | 148 | 15.0% |
| 25 to 29 Minutes | 2 | 0.2% |
| 30 to 34 Minutes | 54 | 5.5% |
| 35 to 39 Minutes | 198 | 20.1% |
| 40 to 44 Minutes | 78 | 7.9% |
| 45 to 59 Minutes | 182 | 18.5% |
| 60 to 89 Minutes | 147 | 14.9% |
| 90 or more Minutes | 20 | 2.0% |
Commute Time by Sex in Arlington Heights
The most common commute times in Arlington Heights are 60 to 89 minutes (147 commuters, 22.0%) for males and 35 to 39 minutes (92 commuters, 29.1%) for females.
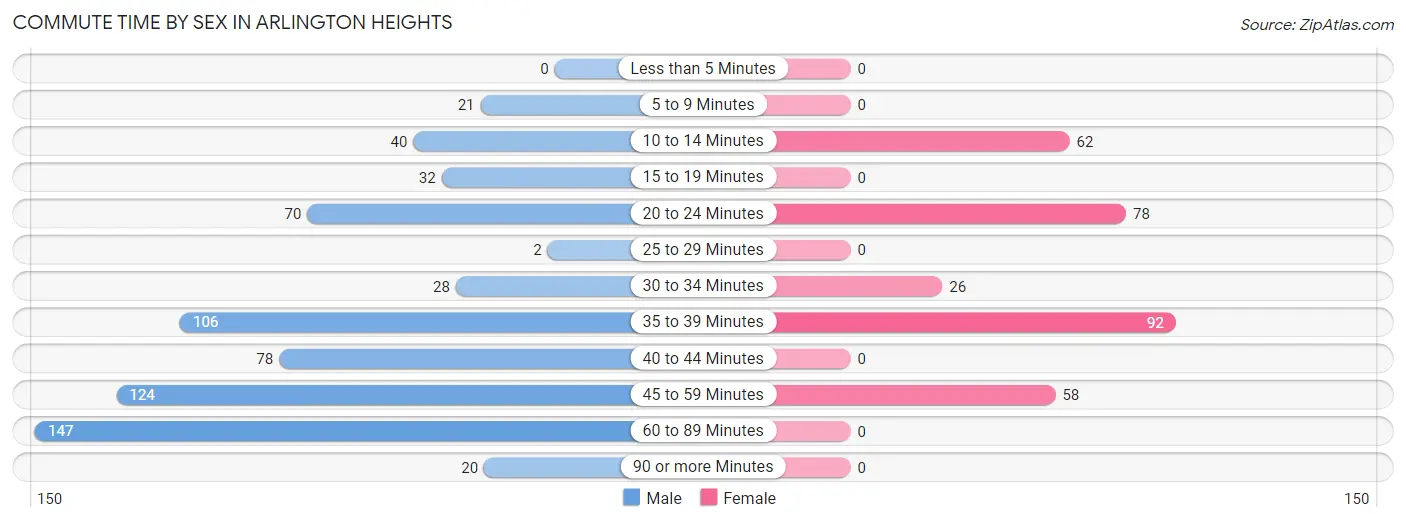
| Commute Time | Male | Female |
| Less than 5 Minutes | 0 (0.0%) | 0 (0.0%) |
| 5 to 9 Minutes | 21 (3.1%) | 0 (0.0%) |
| 10 to 14 Minutes | 40 (6.0%) | 62 (19.6%) |
| 15 to 19 Minutes | 32 (4.8%) | 0 (0.0%) |
| 20 to 24 Minutes | 70 (10.5%) | 78 (24.7%) |
| 25 to 29 Minutes | 2 (0.3%) | 0 (0.0%) |
| 30 to 34 Minutes | 28 (4.2%) | 26 (8.2%) |
| 35 to 39 Minutes | 106 (15.9%) | 92 (29.1%) |
| 40 to 44 Minutes | 78 (11.7%) | 0 (0.0%) |
| 45 to 59 Minutes | 124 (18.6%) | 58 (18.3%) |
| 60 to 89 Minutes | 147 (22.0%) | 0 (0.0%) |
| 90 or more Minutes | 20 (3.0%) | 0 (0.0%) |
Time of Departure to Work by Sex in Arlington Heights
The most frequent times of departure to work in Arlington Heights are 6:00 AM to 6:29 AM (190, 28.4%) for males and 6:30 AM to 6:59 AM (99, 31.3%) for females.
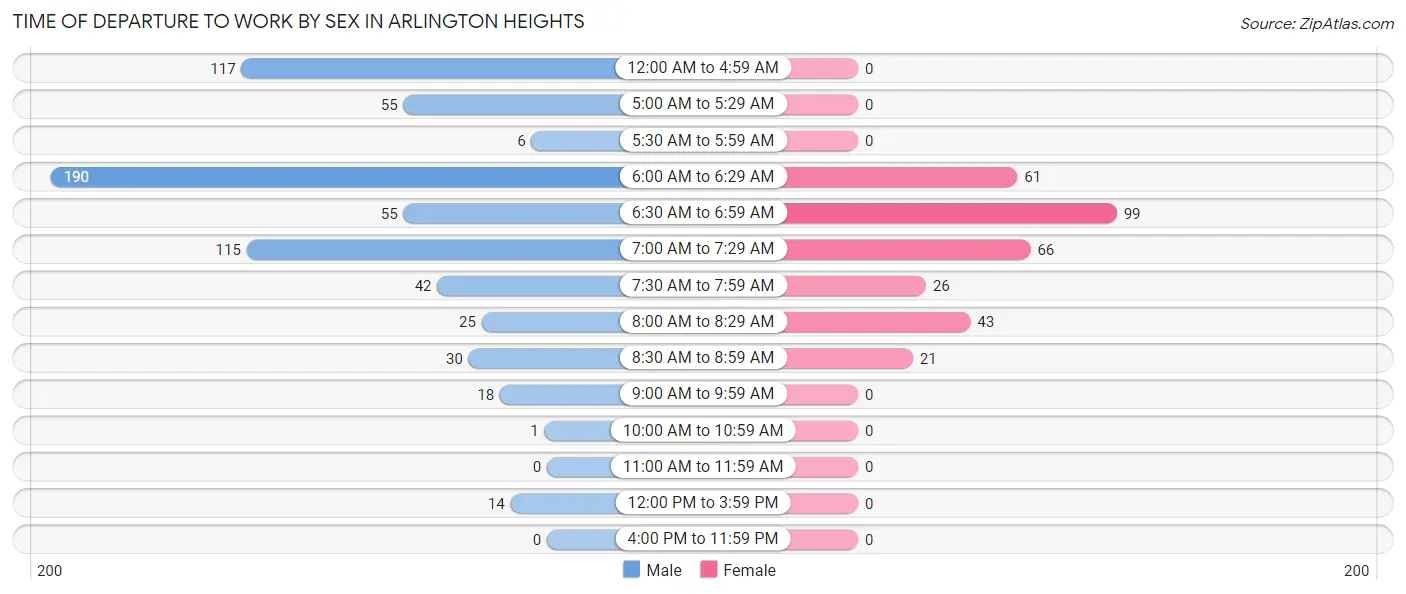
| Time of Departure | Male | Female |
| 12:00 AM to 4:59 AM | 117 (17.5%) | 0 (0.0%) |
| 5:00 AM to 5:29 AM | 55 (8.2%) | 0 (0.0%) |
| 5:30 AM to 5:59 AM | 6 (0.9%) | 0 (0.0%) |
| 6:00 AM to 6:29 AM | 190 (28.4%) | 61 (19.3%) |
| 6:30 AM to 6:59 AM | 55 (8.2%) | 99 (31.3%) |
| 7:00 AM to 7:29 AM | 115 (17.2%) | 66 (20.9%) |
| 7:30 AM to 7:59 AM | 42 (6.3%) | 26 (8.2%) |
| 8:00 AM to 8:29 AM | 25 (3.7%) | 43 (13.6%) |
| 8:30 AM to 8:59 AM | 30 (4.5%) | 21 (6.7%) |
| 9:00 AM to 9:59 AM | 18 (2.7%) | 0 (0.0%) |
| 10:00 AM to 10:59 AM | 1 (0.2%) | 0 (0.0%) |
| 11:00 AM to 11:59 AM | 0 (0.0%) | 0 (0.0%) |
| 12:00 PM to 3:59 PM | 14 (2.1%) | 0 (0.0%) |
| 4:00 PM to 11:59 PM | 0 (0.0%) | 0 (0.0%) |
| Total | 668 (100.0%) | 316 (100.0%) |
Housing Occupancy in Arlington Heights
Occupancy by Ownership in Arlington Heights
Of the total 1,118 dwellings in Arlington Heights, owner-occupied units account for 953 (85.2%), while renter-occupied units make up 165 (14.8%).
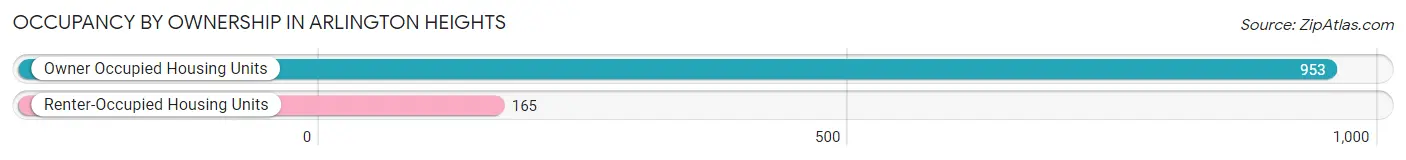
| Occupancy | # Housing Units | % Housing Units |
| Owner Occupied Housing Units | 953 | 85.2% |
| Renter-Occupied Housing Units | 165 | 14.8% |
| Total Occupied Housing Units | 1,118 | 100.0% |
Occupancy by Household Size in Arlington Heights
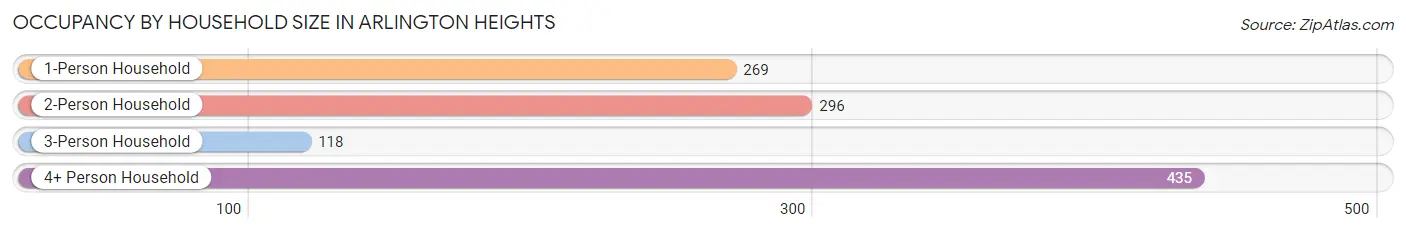
| Household Size | # Housing Units | % Housing Units |
| 1-Person Household | 269 | 24.1% |
| 2-Person Household | 296 | 26.5% |
| 3-Person Household | 118 | 10.5% |
| 4+ Person Household | 435 | 38.9% |
| Total Housing Units | 1,118 | 100.0% |
Occupancy by Ownership by Household Size in Arlington Heights
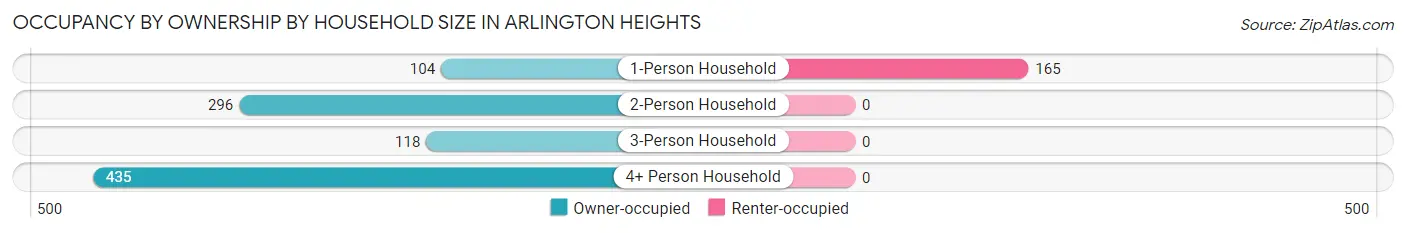
| Household Size | Owner-occupied | Renter-occupied |
| 1-Person Household | 104 (38.7%) | 165 (61.3%) |
| 2-Person Household | 296 (100.0%) | 0 (0.0%) |
| 3-Person Household | 118 (100.0%) | 0 (0.0%) |
| 4+ Person Household | 435 (100.0%) | 0 (0.0%) |
| Total Housing Units | 953 (85.2%) | 165 (14.8%) |
Occupancy by Educational Attainment in Arlington Heights
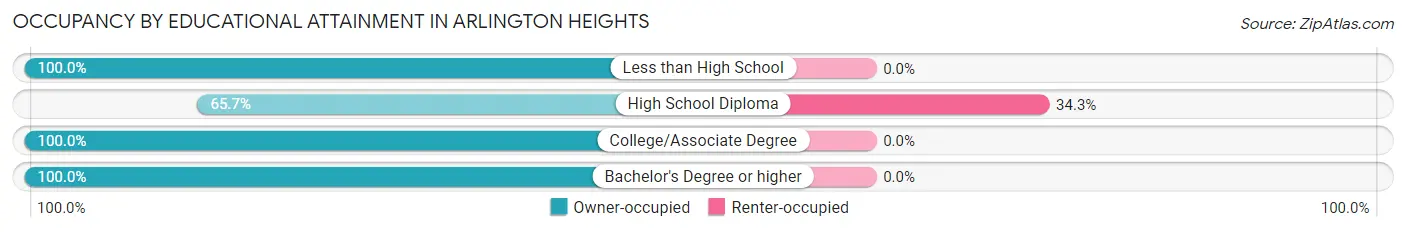
| Household Size | Owner-occupied | Renter-occupied |
| Less than High School | 99 (100.0%) | 0 (0.0%) |
| High School Diploma | 316 (65.7%) | 165 (34.3%) |
| College/Associate Degree | 414 (100.0%) | 0 (0.0%) |
| Bachelor's Degree or higher | 124 (100.0%) | 0 (0.0%) |
Occupancy by Age of Householder in Arlington Heights
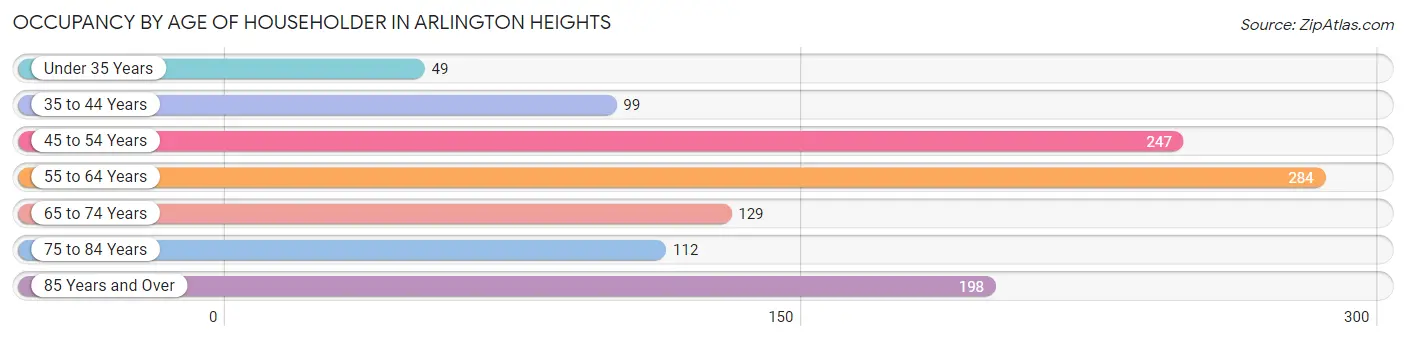
| Age Bracket | # Households | % Households |
| Under 35 Years | 49 | 4.4% |
| 35 to 44 Years | 99 | 8.9% |
| 45 to 54 Years | 247 | 22.1% |
| 55 to 64 Years | 284 | 25.4% |
| 65 to 74 Years | 129 | 11.5% |
| 75 to 84 Years | 112 | 10.0% |
| 85 Years and Over | 198 | 17.7% |
| Total | 1,118 | 100.0% |
Housing Finances in Arlington Heights
Median Income by Occupancy in Arlington Heights
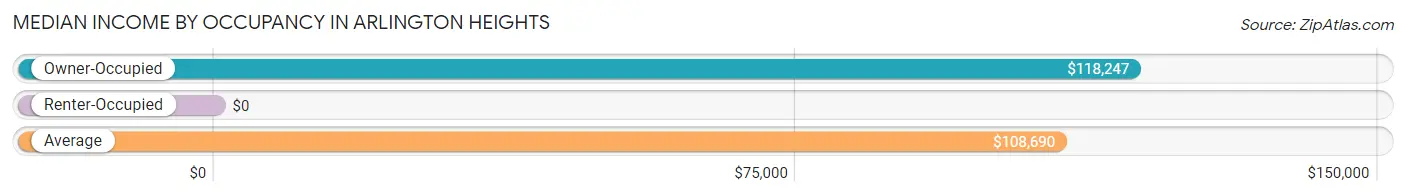
| Occupancy Type | # Households | Median Income |
| Owner-Occupied | 953 (85.2%) | $118,247 |
| Renter-Occupied | 165 (14.8%) | $0 |
| Average | 1,118 (100.0%) | $108,690 |
Occupancy by Householder Income Bracket in Arlington Heights
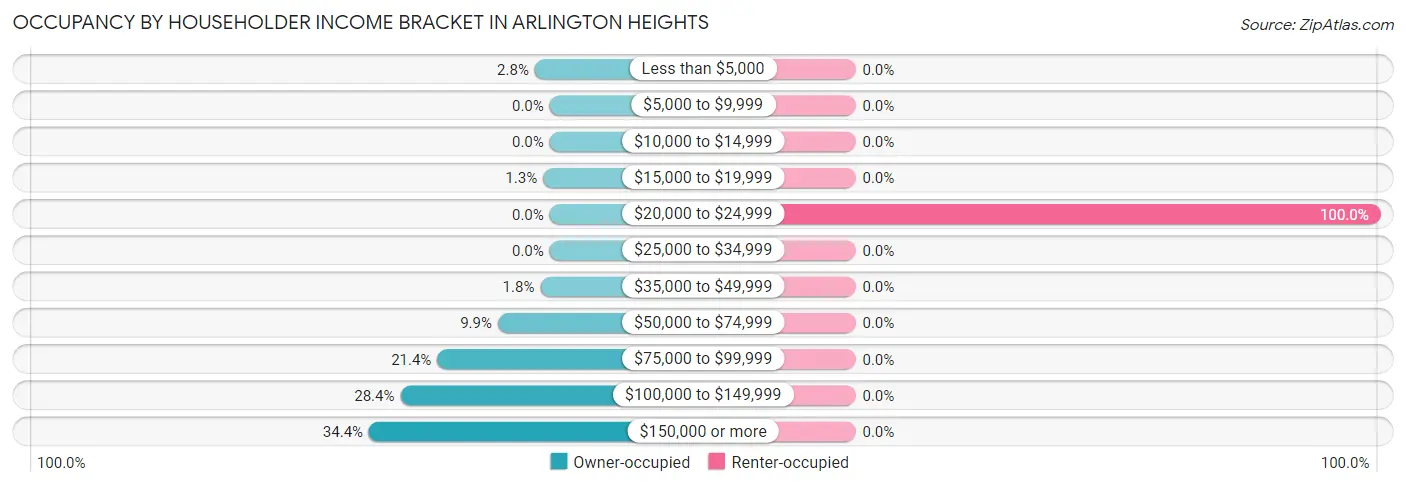
| Income Bracket | Owner-occupied | Renter-occupied |
| Less than $5,000 | 27 (2.8%) | 0 (0.0%) |
| $5,000 to $9,999 | 0 (0.0%) | 0 (0.0%) |
| $10,000 to $14,999 | 0 (0.0%) | 0 (0.0%) |
| $15,000 to $19,999 | 12 (1.3%) | 0 (0.0%) |
| $20,000 to $24,999 | 0 (0.0%) | 165 (100.0%) |
| $25,000 to $34,999 | 0 (0.0%) | 0 (0.0%) |
| $35,000 to $49,999 | 17 (1.8%) | 0 (0.0%) |
| $50,000 to $74,999 | 94 (9.9%) | 0 (0.0%) |
| $75,000 to $99,999 | 204 (21.4%) | 0 (0.0%) |
| $100,000 to $149,999 | 271 (28.4%) | 0 (0.0%) |
| $150,000 or more | 328 (34.4%) | 0 (0.0%) |
| Total | 953 (100.0%) | 165 (100.0%) |
Monthly Housing Cost Tiers in Arlington Heights
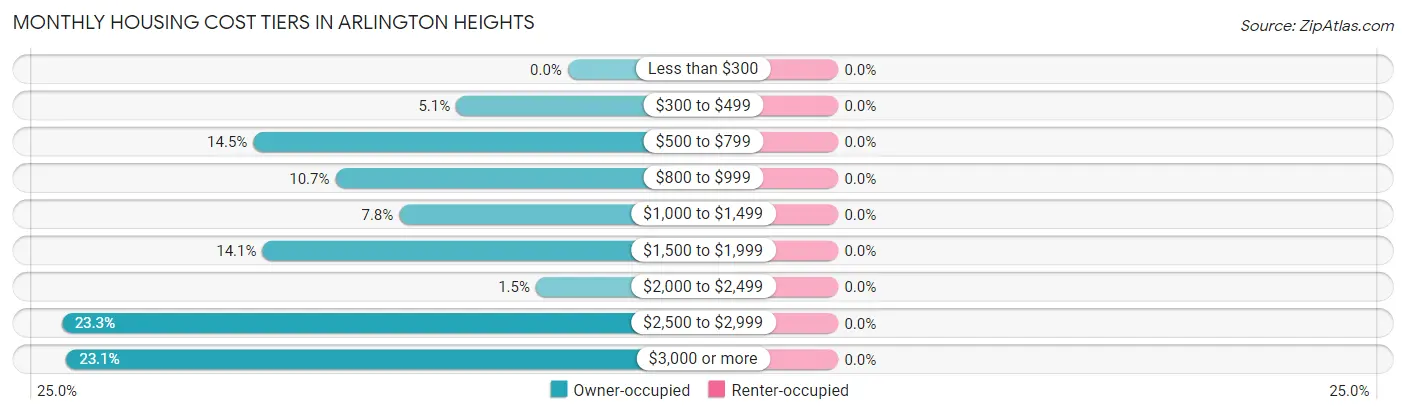
| Monthly Cost | Owner-occupied | Renter-occupied |
| Less than $300 | 0 (0.0%) | 0 (0.0%) |
| $300 to $499 | 49 (5.1%) | 0 (0.0%) |
| $500 to $799 | 138 (14.5%) | 0 (0.0%) |
| $800 to $999 | 102 (10.7%) | 0 (0.0%) |
| $1,000 to $1,499 | 74 (7.8%) | 0 (0.0%) |
| $1,500 to $1,999 | 134 (14.1%) | 0 (0.0%) |
| $2,000 to $2,499 | 14 (1.5%) | 0 (0.0%) |
| $2,500 to $2,999 | 222 (23.3%) | 0 (0.0%) |
| $3,000 or more | 220 (23.1%) | 0 (0.0%) |
| Total | 953 (100.0%) | 165 (100.0%) |
Physical Housing Characteristics in Arlington Heights
Housing Structures in Arlington Heights
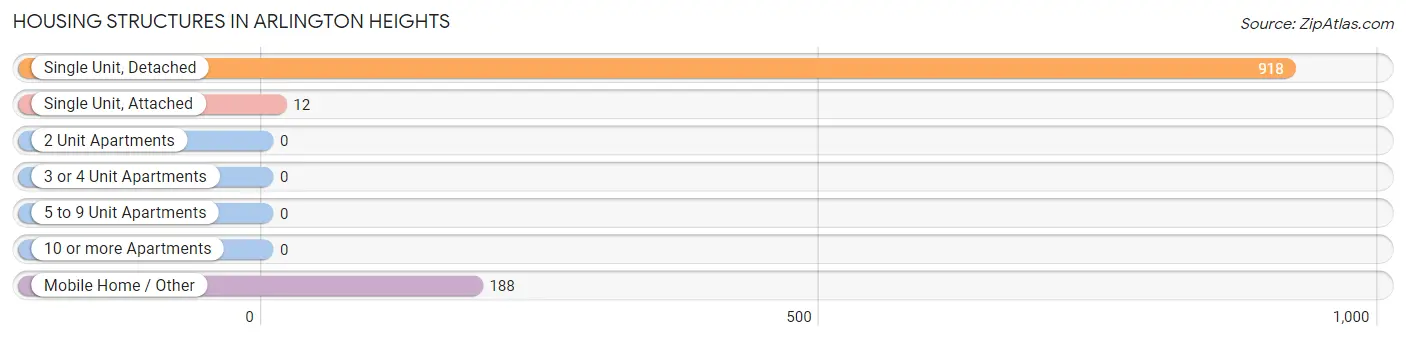
| Structure Type | # Housing Units | % Housing Units |
| Single Unit, Detached | 918 | 82.1% |
| Single Unit, Attached | 12 | 1.1% |
| 2 Unit Apartments | 0 | 0.0% |
| 3 or 4 Unit Apartments | 0 | 0.0% |
| 5 to 9 Unit Apartments | 0 | 0.0% |
| 10 or more Apartments | 0 | 0.0% |
| Mobile Home / Other | 188 | 16.8% |
| Total | 1,118 | 100.0% |
Housing Structures by Occupancy in Arlington Heights
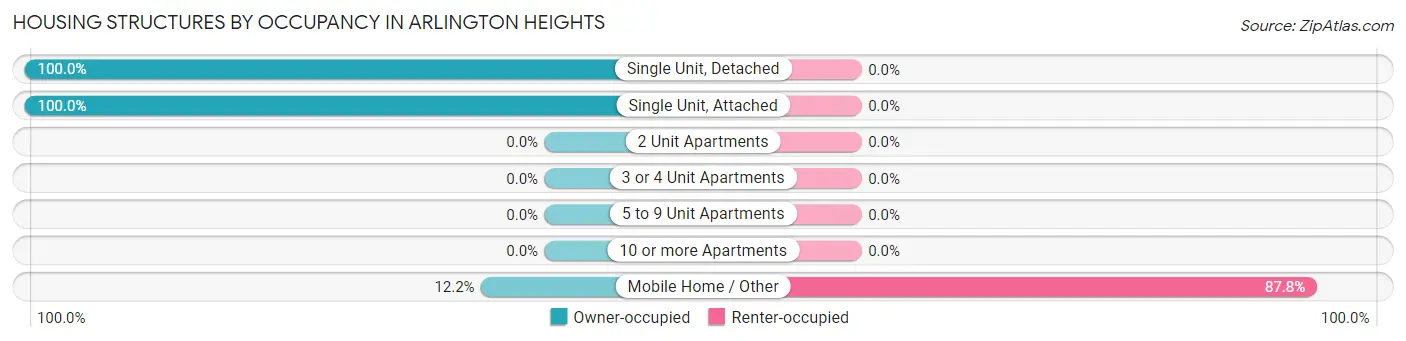
| Structure Type | Owner-occupied | Renter-occupied |
| Single Unit, Detached | 918 (100.0%) | 0 (0.0%) |
| Single Unit, Attached | 12 (100.0%) | 0 (0.0%) |
| 2 Unit Apartments | 0 (0.0%) | 0 (0.0%) |
| 3 or 4 Unit Apartments | 0 (0.0%) | 0 (0.0%) |
| 5 to 9 Unit Apartments | 0 (0.0%) | 0 (0.0%) |
| 10 or more Apartments | 0 (0.0%) | 0 (0.0%) |
| Mobile Home / Other | 23 (12.2%) | 165 (87.8%) |
| Total | 953 (85.2%) | 165 (14.8%) |
Housing Structures by Number of Rooms in Arlington Heights
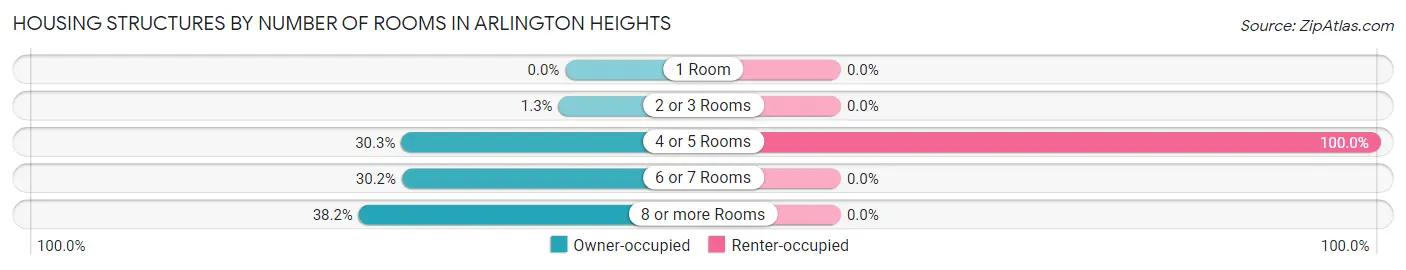
| Number of Rooms | Owner-occupied | Renter-occupied |
| 1 Room | 0 (0.0%) | 0 (0.0%) |
| 2 or 3 Rooms | 12 (1.3%) | 0 (0.0%) |
| 4 or 5 Rooms | 289 (30.3%) | 165 (100.0%) |
| 6 or 7 Rooms | 288 (30.2%) | 0 (0.0%) |
| 8 or more Rooms | 364 (38.2%) | 0 (0.0%) |
| Total | 953 (100.0%) | 165 (100.0%) |
Housing Structure by Heating Type in Arlington Heights
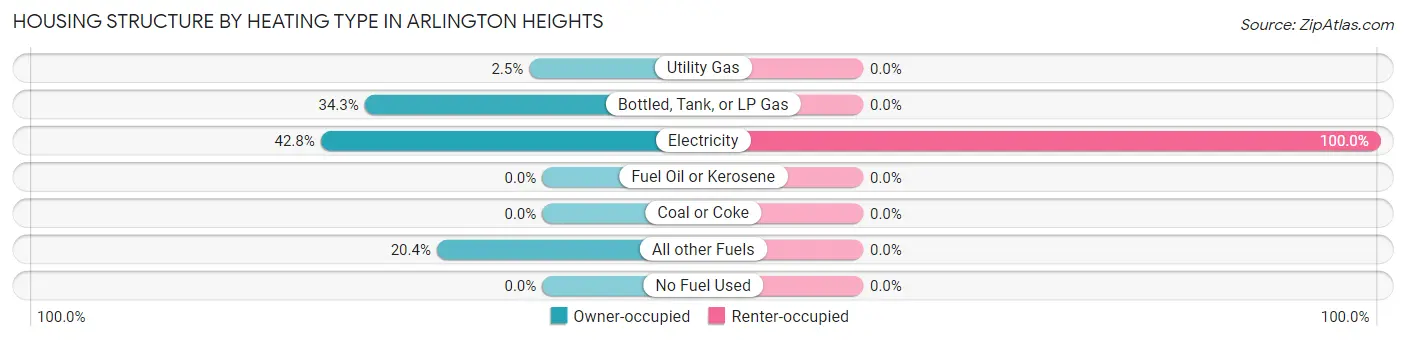
| Heating Type | Owner-occupied | Renter-occupied |
| Utility Gas | 24 (2.5%) | 0 (0.0%) |
| Bottled, Tank, or LP Gas | 327 (34.3%) | 0 (0.0%) |
| Electricity | 408 (42.8%) | 165 (100.0%) |
| Fuel Oil or Kerosene | 0 (0.0%) | 0 (0.0%) |
| Coal or Coke | 0 (0.0%) | 0 (0.0%) |
| All other Fuels | 194 (20.4%) | 0 (0.0%) |
| No Fuel Used | 0 (0.0%) | 0 (0.0%) |
| Total | 953 (100.0%) | 165 (100.0%) |
Household Vehicle Usage in Arlington Heights
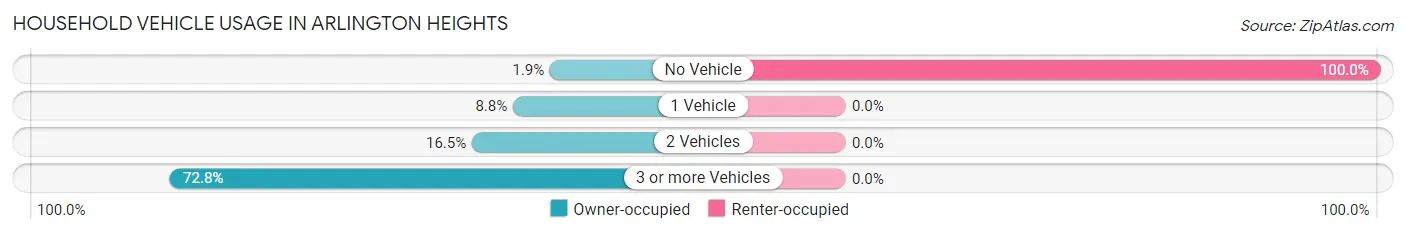
| Vehicles per Household | Owner-occupied | Renter-occupied |
| No Vehicle | 18 (1.9%) | 165 (100.0%) |
| 1 Vehicle | 84 (8.8%) | 0 (0.0%) |
| 2 Vehicles | 157 (16.5%) | 0 (0.0%) |
| 3 or more Vehicles | 694 (72.8%) | 0 (0.0%) |
| Total | 953 (100.0%) | 165 (100.0%) |
Real Estate & Mortgages in Arlington Heights
Real Estate and Mortgage Overview in Arlington Heights
| Characteristic | Without Mortgage | With Mortgage |
| Housing Units | 326 | 627 |
| Median Property Value | $555,600 | $692,100 |
| Median Household Income | $82,051 | $297 |
| Monthly Housing Costs | $779 | $220 |
| Real Estate Taxes | $5,162 | $12 |
Property Value by Mortgage Status in Arlington Heights
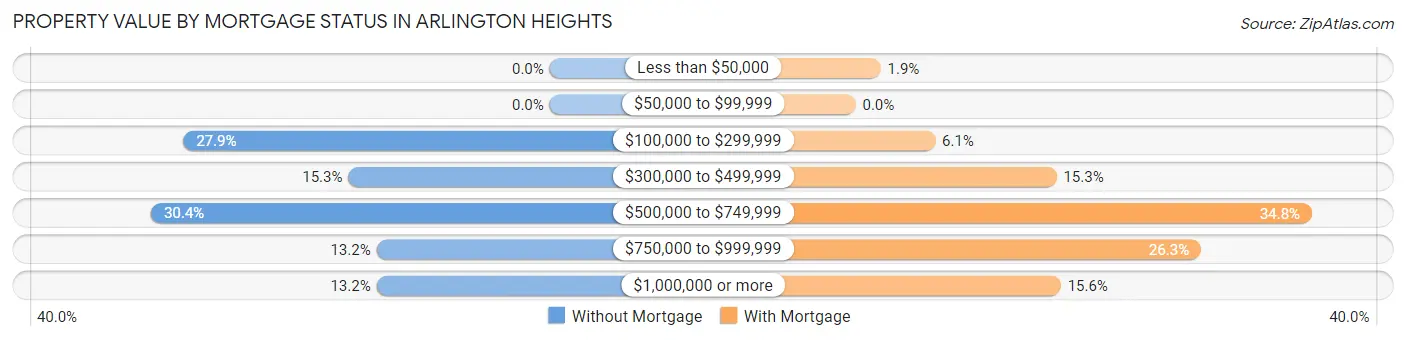
| Property Value | Without Mortgage | With Mortgage |
| Less than $50,000 | 0 (0.0%) | 12 (1.9%) |
| $50,000 to $99,999 | 0 (0.0%) | 0 (0.0%) |
| $100,000 to $299,999 | 91 (27.9%) | 38 (6.1%) |
| $300,000 to $499,999 | 50 (15.3%) | 96 (15.3%) |
| $500,000 to $749,999 | 99 (30.4%) | 218 (34.8%) |
| $750,000 to $999,999 | 43 (13.2%) | 165 (26.3%) |
| $1,000,000 or more | 43 (13.2%) | 98 (15.6%) |
| Total | 326 (100.0%) | 627 (100.0%) |
Household Income by Mortgage Status in Arlington Heights
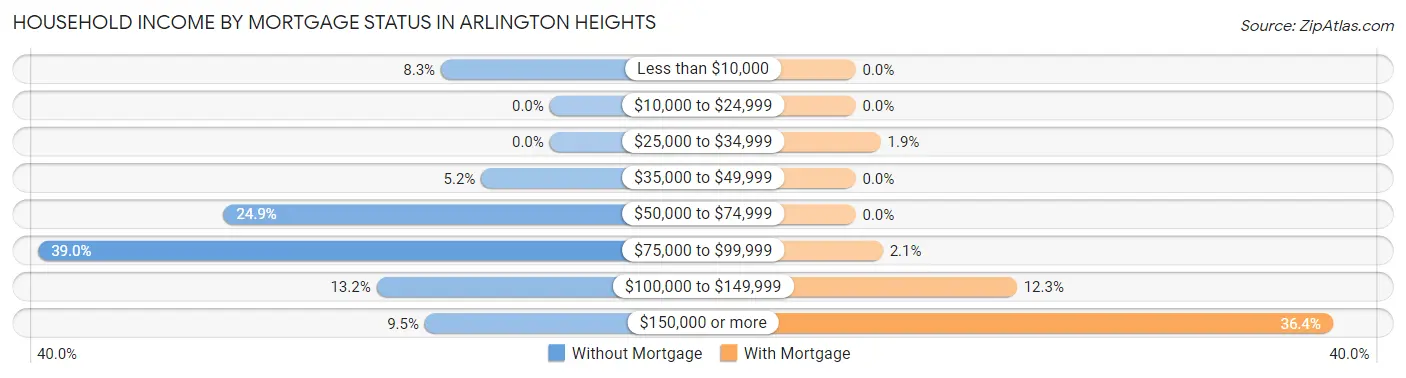
| Household Income | Without Mortgage | With Mortgage |
| Less than $10,000 | 27 (8.3%) | 0 (0.0%) |
| $10,000 to $24,999 | 0 (0.0%) | 0 (0.0%) |
| $25,000 to $34,999 | 0 (0.0%) | 12 (1.9%) |
| $35,000 to $49,999 | 17 (5.2%) | 0 (0.0%) |
| $50,000 to $74,999 | 81 (24.8%) | 0 (0.0%) |
| $75,000 to $99,999 | 127 (39.0%) | 13 (2.1%) |
| $100,000 to $149,999 | 43 (13.2%) | 77 (12.3%) |
| $150,000 or more | 31 (9.5%) | 228 (36.4%) |
| Total | 326 (100.0%) | 627 (100.0%) |
Property Value to Household Income Ratio in Arlington Heights
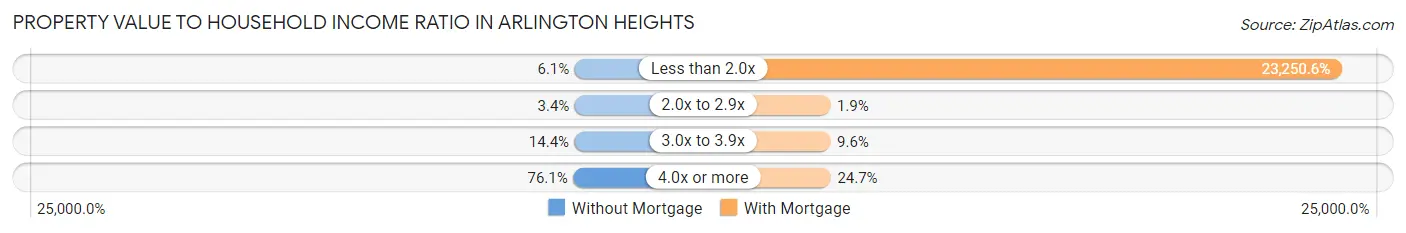
| Value-to-Income Ratio | Without Mortgage | With Mortgage |
| Less than 2.0x | 20 (6.1%) | 145,781 (23,250.6%) |
| 2.0x to 2.9x | 11 (3.4%) | 12 (1.9%) |
| 3.0x to 3.9x | 47 (14.4%) | 60 (9.6%) |
| 4.0x or more | 248 (76.1%) | 155 (24.7%) |
| Total | 326 (100.0%) | 627 (100.0%) |
Real Estate Taxes by Mortgage Status in Arlington Heights
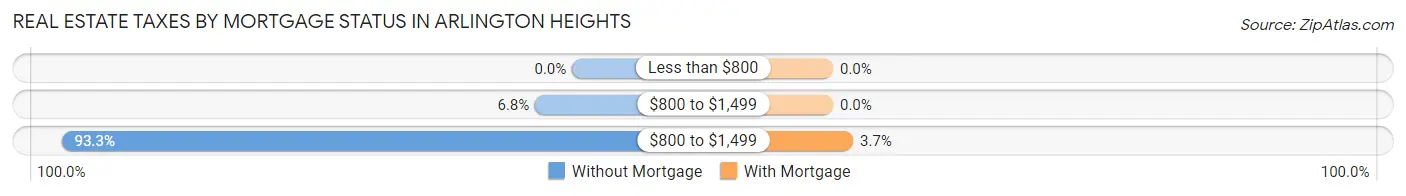
| Property Taxes | Without Mortgage | With Mortgage |
| Less than $800 | 0 (0.0%) | 0 (0.0%) |
| $800 to $1,499 | 22 (6.8%) | 0 (0.0%) |
| $800 to $1,499 | 304 (93.2%) | 23 (3.7%) |
| Total | 326 (100.0%) | 627 (100.0%) |
Health & Disability in Arlington Heights
Health Insurance Coverage by Age in Arlington Heights
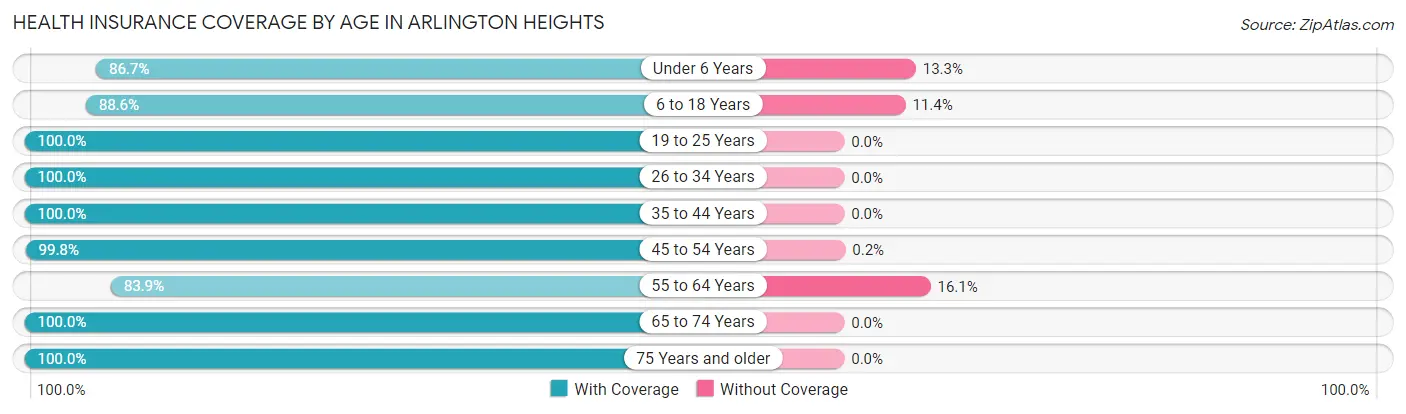
| Age Bracket | With Coverage | Without Coverage |
| Under 6 Years | 78 (86.7%) | 12 (13.3%) |
| 6 to 18 Years | 512 (88.6%) | 66 (11.4%) |
| 19 to 25 Years | 250 (100.0%) | 0 (0.0%) |
| 26 to 34 Years | 247 (100.0%) | 0 (0.0%) |
| 35 to 44 Years | 292 (100.0%) | 0 (0.0%) |
| 45 to 54 Years | 507 (99.8%) | 1 (0.2%) |
| 55 to 64 Years | 360 (83.9%) | 69 (16.1%) |
| 65 to 74 Years | 258 (100.0%) | 0 (0.0%) |
| 75 Years and older | 470 (100.0%) | 0 (0.0%) |
| Total | 2,974 (95.3%) | 148 (4.7%) |
Health Insurance Coverage by Citizenship Status in Arlington Heights
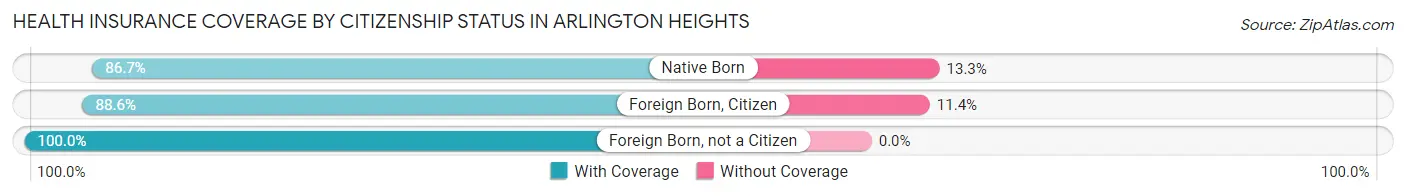
| Citizenship Status | With Coverage | Without Coverage |
| Native Born | 78 (86.7%) | 12 (13.3%) |
| Foreign Born, Citizen | 512 (88.6%) | 66 (11.4%) |
| Foreign Born, not a Citizen | 250 (100.0%) | 0 (0.0%) |
Health Insurance Coverage by Household Income in Arlington Heights
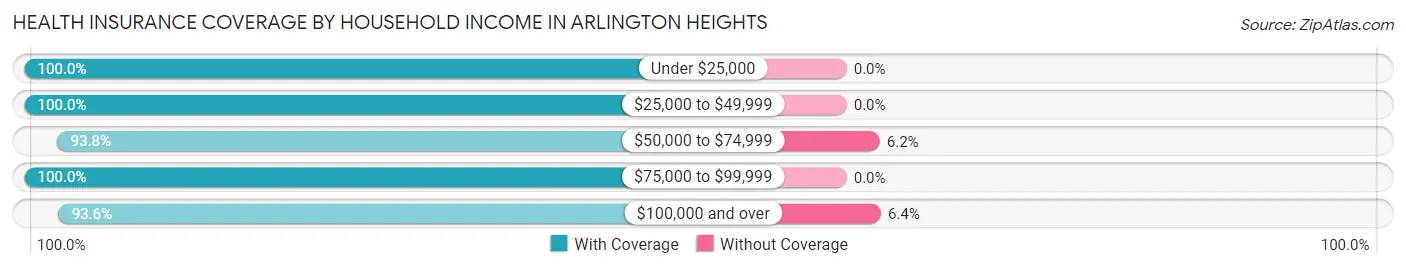
| Household Income | With Coverage | Without Coverage |
| Under $25,000 | 218 (100.0%) | 0 (0.0%) |
| $25,000 to $49,999 | 17 (100.0%) | 0 (0.0%) |
| $50,000 to $74,999 | 182 (93.8%) | 12 (6.2%) |
| $75,000 to $99,999 | 580 (100.0%) | 0 (0.0%) |
| $100,000 and over | 1,973 (93.6%) | 135 (6.4%) |
Public vs Private Health Insurance Coverage by Age in Arlington Heights
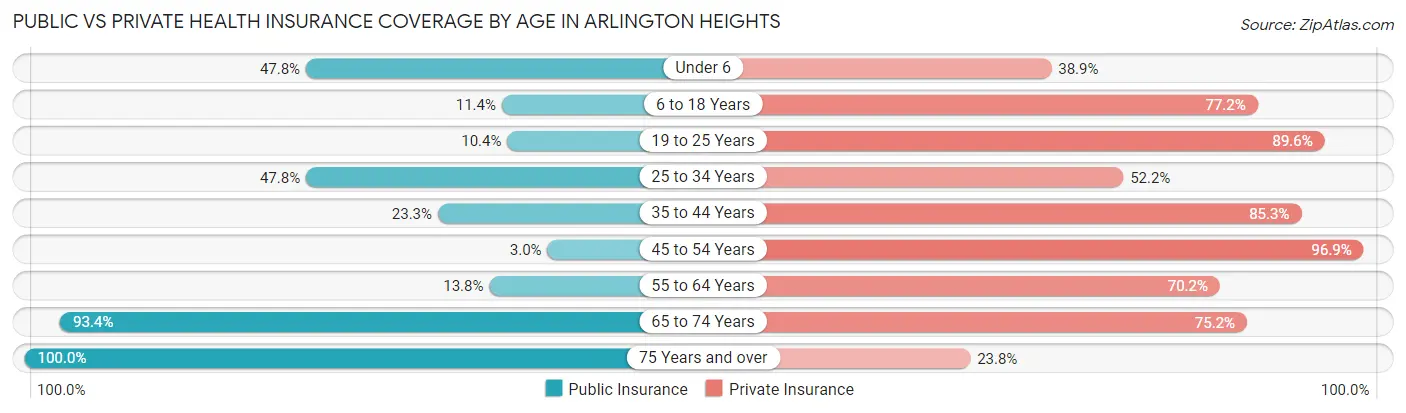
| Age Bracket | Public Insurance | Private Insurance |
| Under 6 | 43 (47.8%) | 35 (38.9%) |
| 6 to 18 Years | 66 (11.4%) | 446 (77.2%) |
| 19 to 25 Years | 26 (10.4%) | 224 (89.6%) |
| 25 to 34 Years | 118 (47.8%) | 129 (52.2%) |
| 35 to 44 Years | 68 (23.3%) | 249 (85.3%) |
| 45 to 54 Years | 15 (2.9%) | 492 (96.9%) |
| 55 to 64 Years | 59 (13.8%) | 301 (70.2%) |
| 65 to 74 Years | 241 (93.4%) | 194 (75.2%) |
| 75 Years and over | 470 (100.0%) | 112 (23.8%) |
| Total | 1,106 (35.4%) | 2,182 (69.9%) |
Disability Status by Sex by Age in Arlington Heights
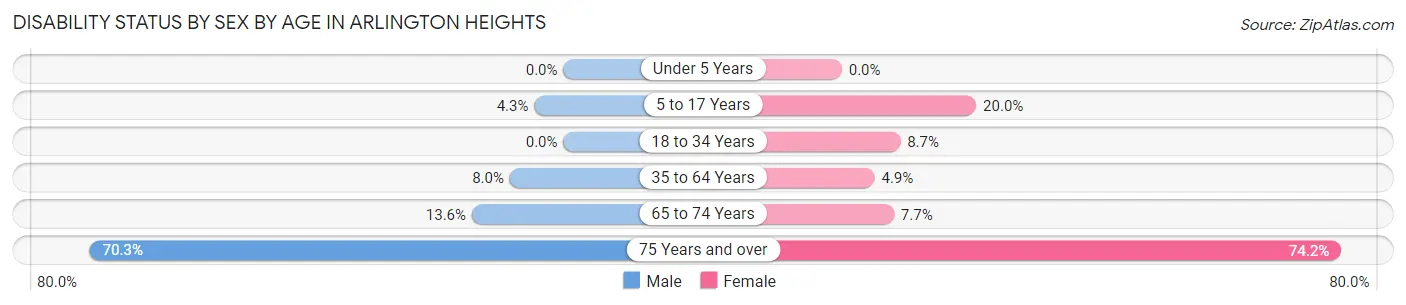
| Age Bracket | Male | Female |
| Under 5 Years | 0 (0.0%) | 0 (0.0%) |
| 5 to 17 Years | 9 (4.3%) | 78 (20.0%) |
| 18 to 34 Years | 0 (0.0%) | 26 (8.7%) |
| 35 to 64 Years | 47 (8.0%) | 31 (4.9%) |
| 65 to 74 Years | 14 (13.6%) | 12 (7.7%) |
| 75 Years and over | 102 (70.3%) | 241 (74.2%) |
Disability Class by Sex by Age in Arlington Heights
Disability Class: Hearing Difficulty
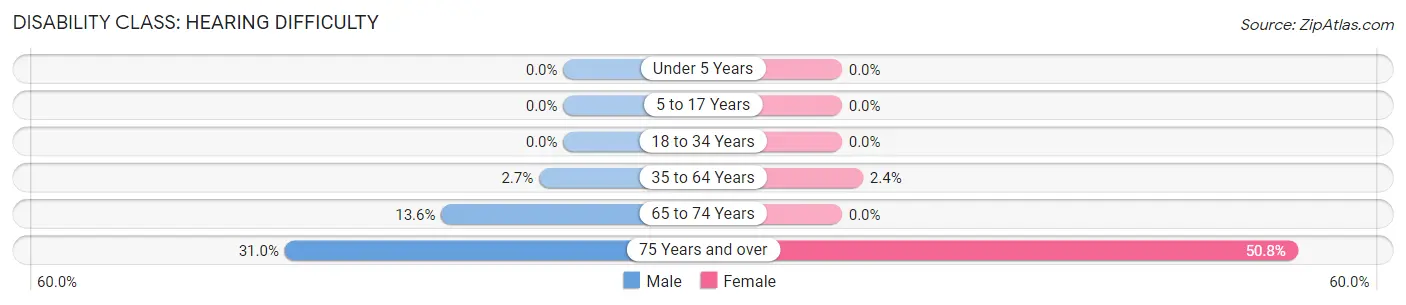
| Age Bracket | Male | Female |
| Under 5 Years | 0 (0.0%) | 0 (0.0%) |
| 5 to 17 Years | 0 (0.0%) | 0 (0.0%) |
| 18 to 34 Years | 0 (0.0%) | 0 (0.0%) |
| 35 to 64 Years | 16 (2.7%) | 15 (2.4%) |
| 65 to 74 Years | 14 (13.6%) | 0 (0.0%) |
| 75 Years and over | 45 (31.0%) | 165 (50.8%) |
Disability Class: Vision Difficulty
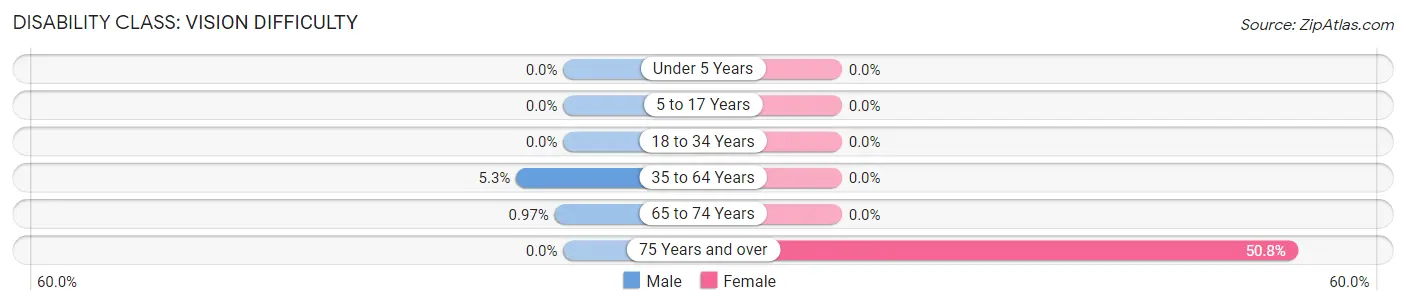
| Age Bracket | Male | Female |
| Under 5 Years | 0 (0.0%) | 0 (0.0%) |
| 5 to 17 Years | 0 (0.0%) | 0 (0.0%) |
| 18 to 34 Years | 0 (0.0%) | 0 (0.0%) |
| 35 to 64 Years | 31 (5.2%) | 0 (0.0%) |
| 65 to 74 Years | 1 (1.0%) | 0 (0.0%) |
| 75 Years and over | 0 (0.0%) | 165 (50.8%) |
Disability Class: Cognitive Difficulty
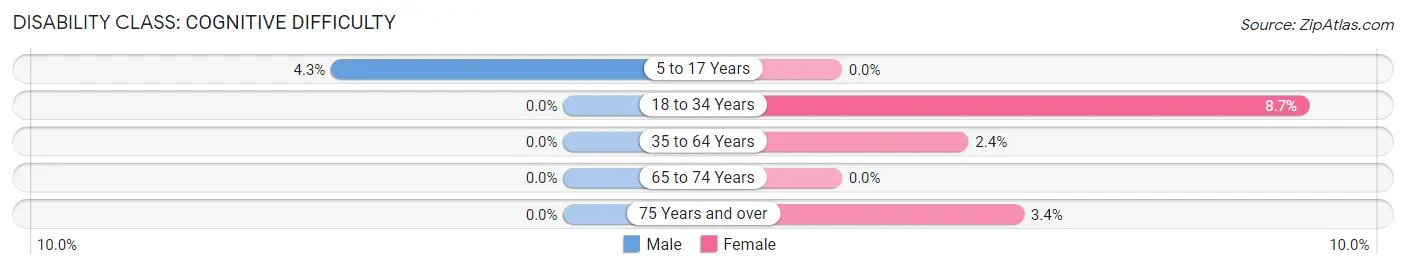
| Age Bracket | Male | Female |
| 5 to 17 Years | 9 (4.3%) | 0 (0.0%) |
| 18 to 34 Years | 0 (0.0%) | 26 (8.7%) |
| 35 to 64 Years | 0 (0.0%) | 15 (2.4%) |
| 65 to 74 Years | 0 (0.0%) | 0 (0.0%) |
| 75 Years and over | 0 (0.0%) | 11 (3.4%) |
Disability Class: Ambulatory Difficulty
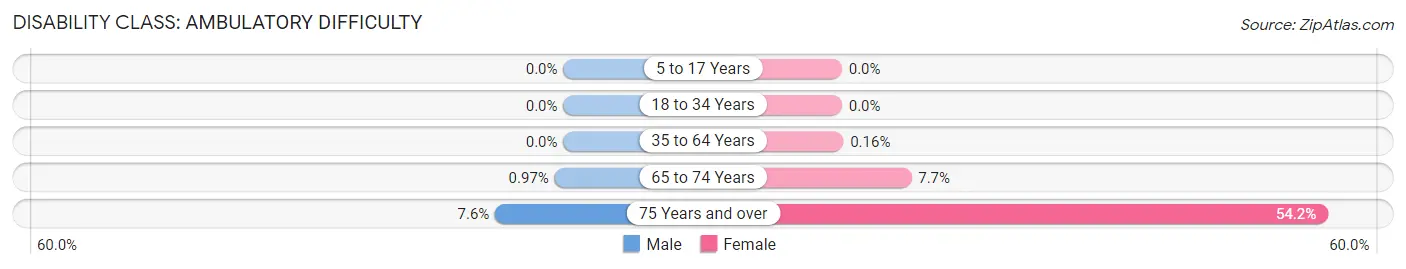
| Age Bracket | Male | Female |
| 5 to 17 Years | 0 (0.0%) | 0 (0.0%) |
| 18 to 34 Years | 0 (0.0%) | 0 (0.0%) |
| 35 to 64 Years | 0 (0.0%) | 1 (0.2%) |
| 65 to 74 Years | 1 (1.0%) | 12 (7.7%) |
| 75 Years and over | 11 (7.6%) | 176 (54.1%) |
Disability Class: Self-Care Difficulty
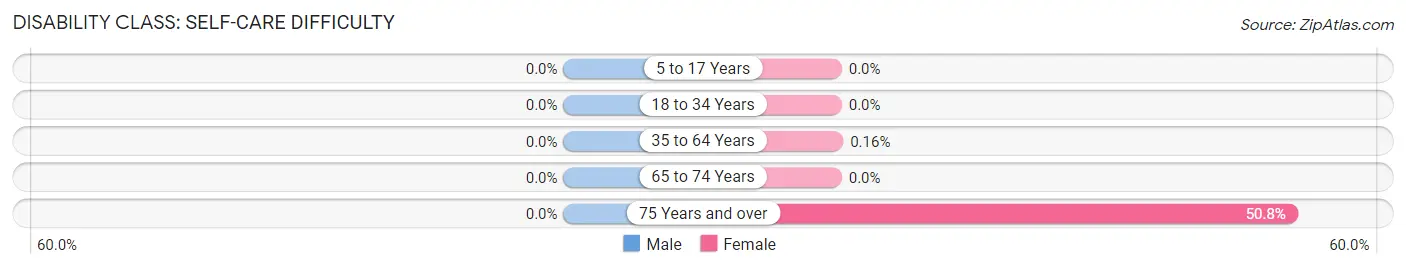
| Age Bracket | Male | Female |
| 5 to 17 Years | 0 (0.0%) | 0 (0.0%) |
| 18 to 34 Years | 0 (0.0%) | 0 (0.0%) |
| 35 to 64 Years | 0 (0.0%) | 1 (0.2%) |
| 65 to 74 Years | 0 (0.0%) | 0 (0.0%) |
| 75 Years and over | 0 (0.0%) | 165 (50.8%) |
Technology Access in Arlington Heights
Computing Device Access in Arlington Heights
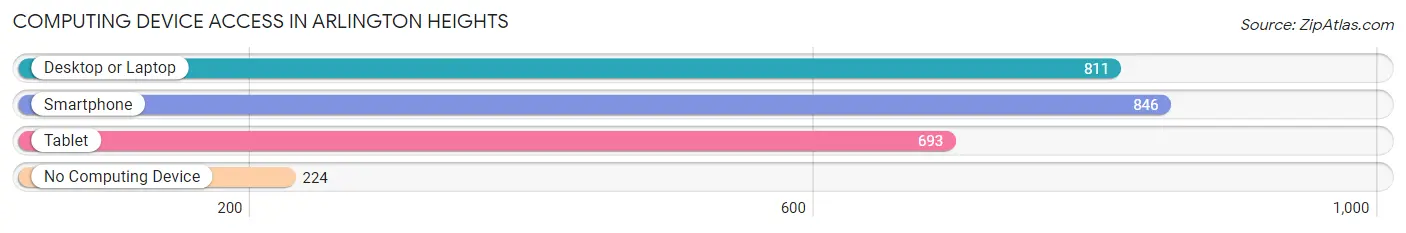
| Device Type | # Households | % Households |
| Desktop or Laptop | 811 | 72.5% |
| Smartphone | 846 | 75.7% |
| Tablet | 693 | 62.0% |
| No Computing Device | 224 | 20.0% |
| Total | 1,118 | 100.0% |
Internet Access in Arlington Heights
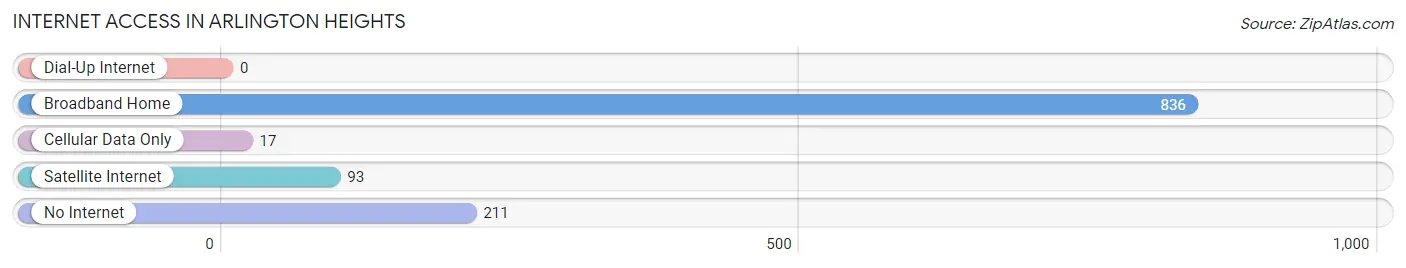
| Internet Type | # Households | % Households |
| Dial-Up Internet | 0 | 0.0% |
| Broadband Home | 836 | 74.8% |
| Cellular Data Only | 17 | 1.5% |
| Satellite Internet | 93 | 8.3% |
| No Internet | 211 | 18.9% |
| Total | 1,118 | 100.0% |
Arlington Heights Summary
Arlington Heights is a small unincorporated community located in Snohomish County, Washington, United States. It is situated in the Cascade foothills, approximately 25 miles northeast of Seattle. The population of Arlington Heights was estimated to be 1,845 in 2019.
History
Arlington Heights was first settled in the late 1800s by homesteaders who were attracted to the area by its abundant natural resources. The first post office was established in 1891 and the town was officially incorporated in 1910. The town was named after the nearby Arlington Heights, a prominent hill in the area.
The town grew steadily throughout the early 20th century, and by the 1950s it had become a popular destination for tourists and outdoor enthusiasts. The town was also home to a number of small businesses, including a sawmill, a general store, and a dairy.
Geography
Arlington Heights is located in the Cascade foothills, approximately 25 miles northeast of Seattle. The town is situated at an elevation of approximately 500 feet above sea level. The town is surrounded by lush forests and rolling hills, and is home to a number of small lakes and streams.
The climate in Arlington Heights is mild and temperate, with warm summers and cool winters. The average annual temperature is approximately 50 degrees Fahrenheit. The average annual precipitation is approximately 40 inches.
Economy
The economy of Arlington Heights is largely based on tourism and outdoor recreation. The town is home to a number of small businesses, including restaurants, retail stores, and lodging establishments. The town is also home to a number of small farms and ranches.
The town is also home to a number of manufacturing and industrial businesses, including a sawmill, a lumber mill, and a concrete plant. The town is also home to a number of small technology companies.
Demographics
As of 2019, the population of Arlington Heights was estimated to be 1,845. The racial makeup of the town was 91.3% White, 2.2% Hispanic or Latino, 1.7% Asian, 0.7% African American, 0.3% Native American, and 4.1% other.
The median household income in Arlington Heights was estimated to be $63,917 in 2019. The median home value was estimated to be $360,000 in 2019. The median age of the population was estimated to be 44.7 years in 2019.
Conclusion
Arlington Heights is a small unincorporated community located in Snohomish County, Washington, United States. It is situated in the Cascade foothills, approximately 25 miles northeast of Seattle. The population of Arlington Heights was estimated to be 1,845 in 2019. The town is surrounded by lush forests and rolling hills, and is home to a number of small lakes and streams. The economy of Arlington Heights is largely based on tourism and outdoor recreation, and the town is home to a number of small businesses, manufacturing and industrial businesses, and technology companies. The racial makeup of the town was 91.3% White, 2.2% Hispanic or Latino, 1.7% Asian, 0.7% African American, 0.3% Native American, and 4.1% other. The median household income in Arlington Heights was estimated to be $63,917 in 2019.
Common Questions
What is Per Capita Income in Arlington Heights?
Per Capita income in Arlington Heights is $43,647.
What is the Median Family Income in Arlington Heights?
Median Family Income in Arlington Heights is $135,381.
What is the Median Household income in Arlington Heights?
Median Household Income in Arlington Heights is $108,690.
What is Income or Wage Gap in Arlington Heights?
Income or Wage Gap in Arlington Heights is 48.1%.
Women in Arlington Heights earn 51.9 cents for every dollar earned by a man.
What is Inequality or Gini Index in Arlington Heights?
Inequality or Gini Index in Arlington Heights is 0.37.
What is the Total Population of Arlington Heights?
Total Population of Arlington Heights is 3,122.
What is the Total Male Population of Arlington Heights?
Total Male Population of Arlington Heights is 1,245.
What is the Total Female Population of Arlington Heights?
Total Female Population of Arlington Heights is 1,877.
What is the Ratio of Males per 100 Females in Arlington Heights?
There are 66.33 Males per 100 Females in Arlington Heights.
What is the Ratio of Females per 100 Males in Arlington Heights?
There are 150.76 Females per 100 Males in Arlington Heights.
What is the Median Population Age in Arlington Heights?
Median Population Age in Arlington Heights is 46.5 Years.
What is the Average Family Size in Arlington Heights
Average Family Size in Arlington Heights is 3.3 People.
What is the Average Household Size in Arlington Heights
Average Household Size in Arlington Heights is 2.8 People.
How Large is the Labor Force in Arlington Heights?
There are 1,381 People in the Labor Forcein in Arlington Heights.
What is the Percentage of People in the Labor Force in Arlington Heights?
49.9% of People are in the Labor Force in Arlington Heights.
What is the Unemployment Rate in Arlington Heights?
Unemployment Rate in Arlington Heights is 2.9%.