Naselle, WA Map & Demographics
Naselle Map
Naselle Overview
$22,935
PER CAPITA INCOME
$57,052
AVG FAMILY INCOME
$56,188
AVG HOUSEHOLD INCOME
47.9%
WAGE / INCOME GAP [ % ]
52.1¢/ $1
WAGE / INCOME GAP [ $ ]
0.34
INEQUALITY / GINI INDEX
629
TOTAL POPULATION
402
MALE POPULATION
227
FEMALE POPULATION
177.09
MALES / 100 FEMALES
56.47
FEMALES / 100 MALES
36.9
MEDIAN AGE
3.1
AVG FAMILY SIZE
2.5
AVG HOUSEHOLD SIZE
327
LABOR FORCE [ PEOPLE ]
67.8%
PERCENT IN LABOR FORCE
Naselle Zip Codes
Naselle Area Codes
Income in Naselle
Income Overview in Naselle
Per Capita Income in Naselle is $22,935, while median incomes of families and households are $57,052 and $56,188 respectively.
| Characteristic | Number | Measure |
| Per Capita Income | 629 | $22,935 |
| Median Family Income | 173 | $57,052 |
| Mean Family Income | 173 | $74,816 |
| Median Household Income | 249 | $56,188 |
| Mean Household Income | 249 | $59,817 |
| Income Deficit | 173 | $0 |
| Wage / Income Gap (%) | 629 | 47.91% |
| Wage / Income Gap ($) | 629 | 52.09¢ per $1 |
| Gini / Inequality Index | 629 | 0.34 |
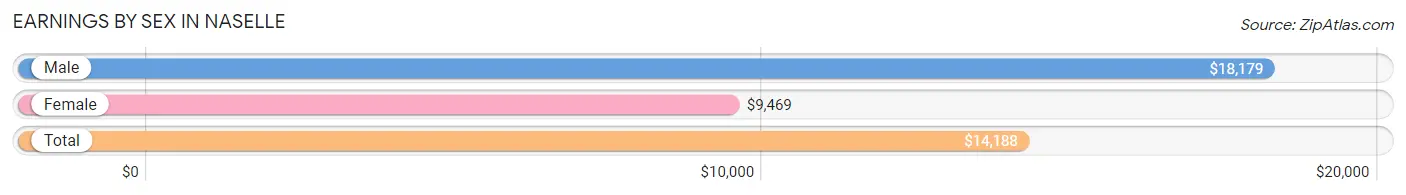
Earnings by Sex in Naselle
Average Earnings in Naselle are $14,188, $18,179 for men and $9,469 for women, a difference of 47.9%.
| Sex | Number | Average Earnings |
| Male | 270 (72.8%) | $18,179 |
| Female | 101 (27.2%) | $9,469 |
| Total | 371 (100.0%) | $14,188 |
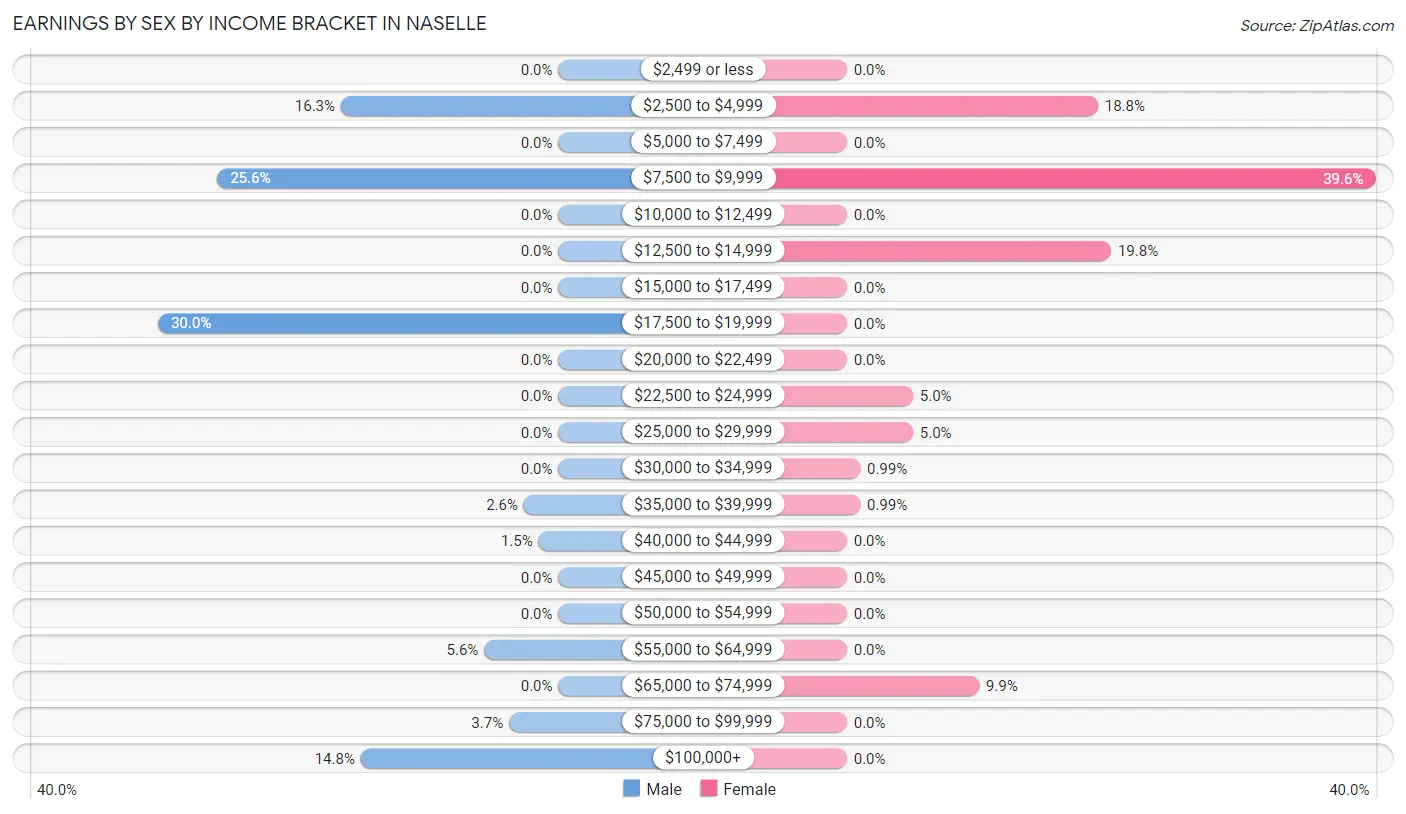
Earnings by Sex by Income Bracket in Naselle
The most common earnings brackets in Naselle are $17,500 to $19,999 for men (81 | 30.0%) and $7,500 to $9,999 for women (40 | 39.6%).
| Income | Male | Female |
| $2,499 or less | 0 (0.0%) | 0 (0.0%) |
| $2,500 to $4,999 | 44 (16.3%) | 19 (18.8%) |
| $5,000 to $7,499 | 0 (0.0%) | 0 (0.0%) |
| $7,500 to $9,999 | 69 (25.6%) | 40 (39.6%) |
| $10,000 to $12,499 | 0 (0.0%) | 0 (0.0%) |
| $12,500 to $14,999 | 0 (0.0%) | 20 (19.8%) |
| $15,000 to $17,499 | 0 (0.0%) | 0 (0.0%) |
| $17,500 to $19,999 | 81 (30.0%) | 0 (0.0%) |
| $20,000 to $22,499 | 0 (0.0%) | 0 (0.0%) |
| $22,500 to $24,999 | 0 (0.0%) | 5 (5.0%) |
| $25,000 to $29,999 | 0 (0.0%) | 5 (5.0%) |
| $30,000 to $34,999 | 0 (0.0%) | 1 (1.0%) |
| $35,000 to $39,999 | 7 (2.6%) | 1 (1.0%) |
| $40,000 to $44,999 | 4 (1.5%) | 0 (0.0%) |
| $45,000 to $49,999 | 0 (0.0%) | 0 (0.0%) |
| $50,000 to $54,999 | 0 (0.0%) | 0 (0.0%) |
| $55,000 to $64,999 | 15 (5.6%) | 0 (0.0%) |
| $65,000 to $74,999 | 0 (0.0%) | 10 (9.9%) |
| $75,000 to $99,999 | 10 (3.7%) | 0 (0.0%) |
| $100,000+ | 40 (14.8%) | 0 (0.0%) |
| Total | 270 (100.0%) | 101 (100.0%) |
Earnings by Sex by Educational Attainment in Naselle
| Educational Attainment | Male Income | Female Income |
| Less than High School | - | - |
| High School Diploma | - | - |
| College or Associate's Degree | - | - |
| Bachelor's Degree | - | - |
| Graduate Degree | - | - |
| Total | - | - |
Family Income in Naselle
Family Income Brackets in Naselle
According to the Naselle family income data, there are 92 families falling into the $50,000 to $74,999 income range, which is the most common income bracket and makes up 53.2% of all families.
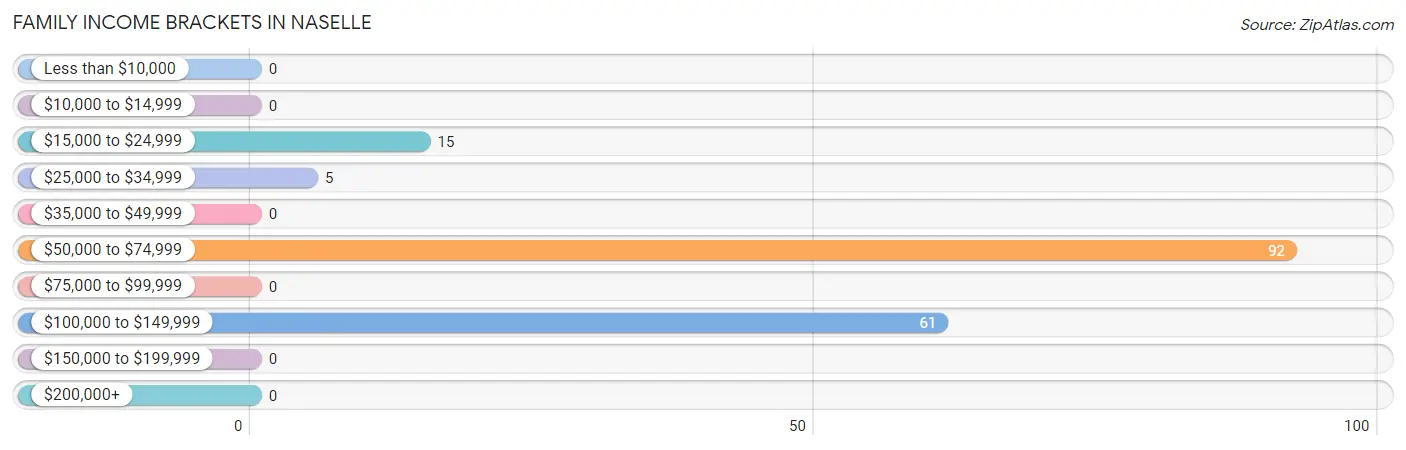
| Income Bracket | # Families | % Families |
| Less than $10,000 | 0 | 0.0% |
| $10,000 to $14,999 | 0 | 0.0% |
| $15,000 to $24,999 | 15 | 8.7% |
| $25,000 to $34,999 | 5 | 2.9% |
| $35,000 to $49,999 | 0 | 0.0% |
| $50,000 to $74,999 | 92 | 53.2% |
| $75,000 to $99,999 | 0 | 0.0% |
| $100,000 to $149,999 | 61 | 35.3% |
| $150,000 to $199,999 | 0 | 0.0% |
| $200,000+ | 0 | 0.0% |
Family Income by Famaliy Size in Naselle
5-person families (43 | 24.9%) account for the highest median family income in Naselle with $107,292 per family, while 5-person families (43 | 24.9%) have the highest median income of $21,458 per family member.
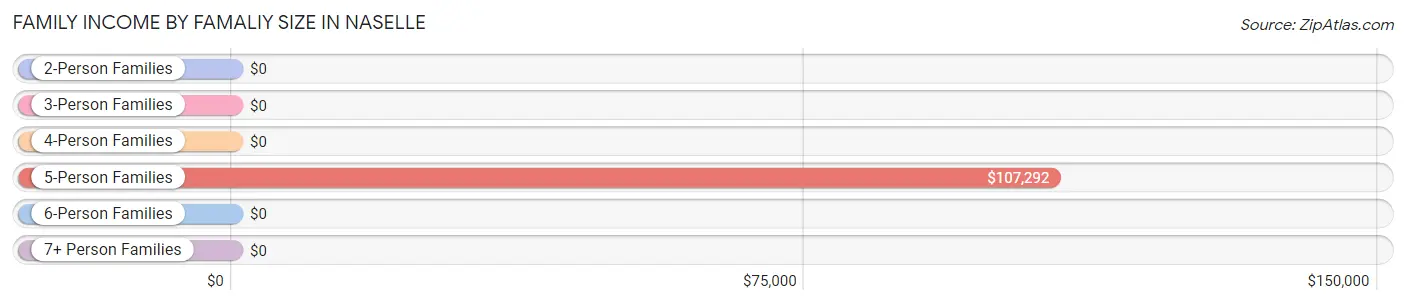
| Income Bracket | # Families | Median Income |
| 2-Person Families | 42 (24.3%) | $0 |
| 3-Person Families | 0 (0.0%) | $0 |
| 4-Person Families | 81 (46.8%) | $0 |
| 5-Person Families | 43 (24.9%) | $107,292 |
| 6-Person Families | 6 (3.5%) | $0 |
| 7+ Person Families | 1 (0.6%) | $0 |
| Total | 173 (100.0%) | $57,052 |
Family Income by Number of Earners in Naselle
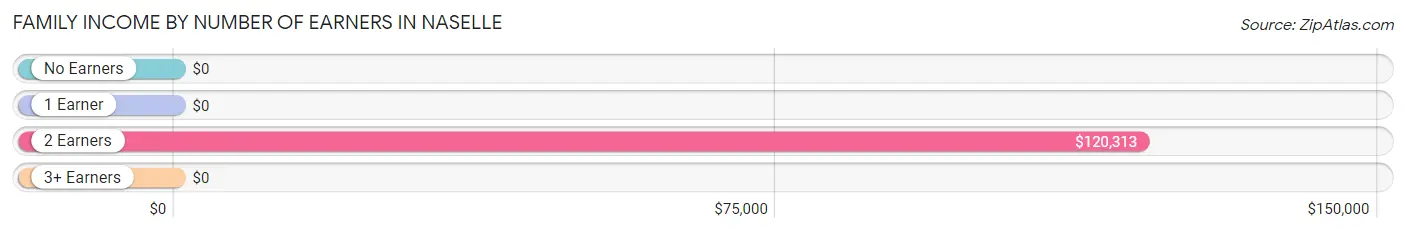
| Number of Earners | # Families | Median Income |
| No Earners | 0 (0.0%) | $0 |
| 1 Earner | 40 (23.1%) | $0 |
| 2 Earners | 51 (29.5%) | $120,313 |
| 3+ Earners | 82 (47.4%) | $0 |
| Total | 173 (100.0%) | $57,052 |
Household Income in Naselle
Household Income Brackets in Naselle
With 111 households falling in the category, the $50,000 to $74,999 income range is the most frequent in Naselle, accounting for 44.6% of all households.
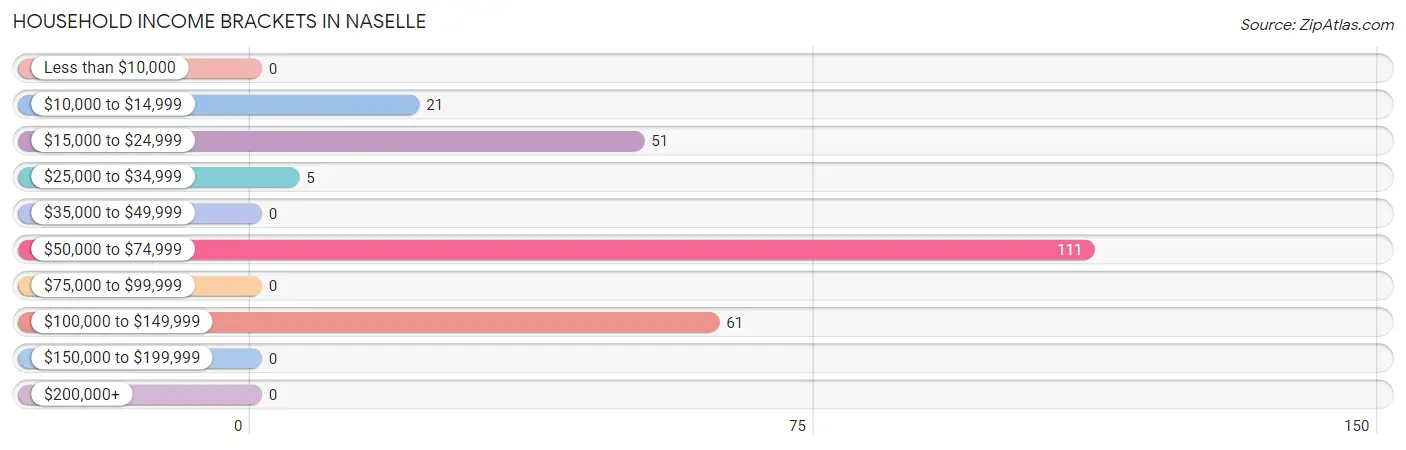
| Income Bracket | # Households | % Households |
| Less than $10,000 | 0 | 0.0% |
| $10,000 to $14,999 | 21 | 8.4% |
| $15,000 to $24,999 | 51 | 20.5% |
| $25,000 to $34,999 | 5 | 2.0% |
| $35,000 to $49,999 | 0 | 0.0% |
| $50,000 to $74,999 | 111 | 44.6% |
| $75,000 to $99,999 | 0 | 0.0% |
| $100,000 to $149,999 | 61 | 24.5% |
| $150,000 to $199,999 | 0 | 0.0% |
| $200,000+ | 0 | 0.0% |
Household Income by Householder Age in Naselle
The median household income in Naselle is $56,188, with the highest median household income of $106,597 found in the 25 to 44 years age bracket for the primary householder. A total of 55 households (22.1%) fall into this category.
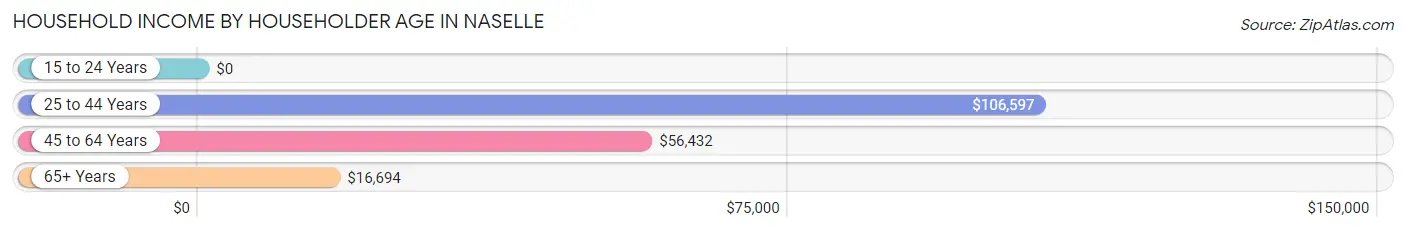
| Income Bracket | # Households | Median Income |
| 15 to 24 Years | 0 (0.0%) | $0 |
| 25 to 44 Years | 55 (22.1%) | $106,597 |
| 45 to 64 Years | 118 (47.4%) | $56,432 |
| 65+ Years | 76 (30.5%) | $16,694 |
| Total | 249 (100.0%) | $56,188 |
Poverty in Naselle
Income Below Poverty by Sex and Age in Naselle
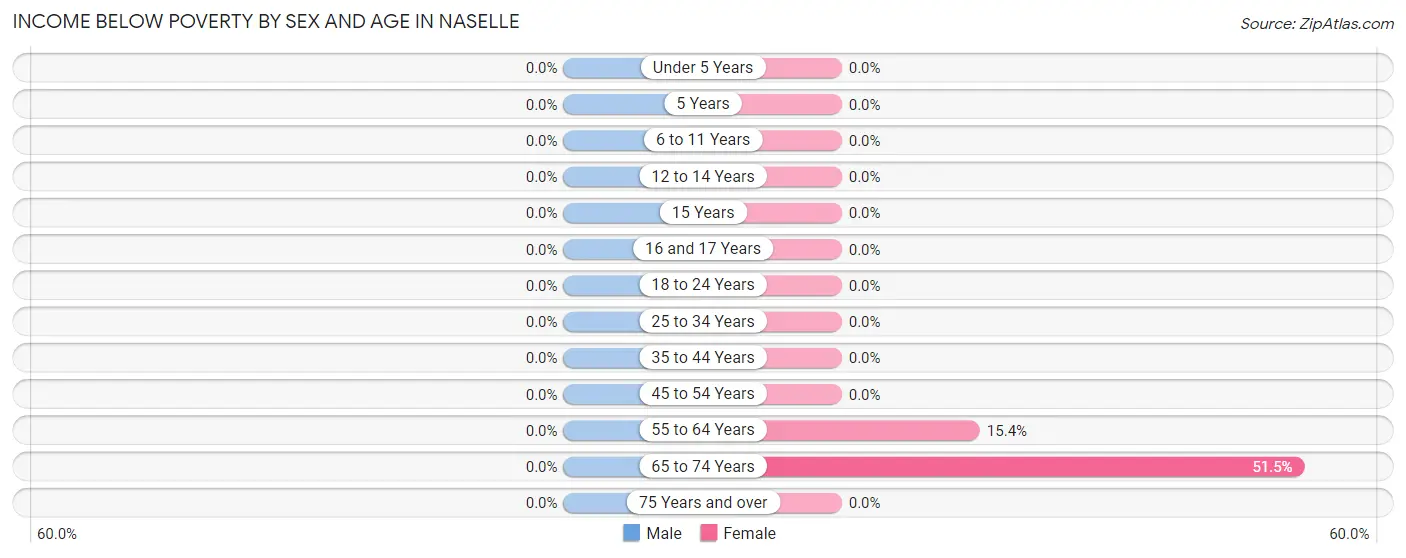
| Age Bracket | Male | Female |
| Under 5 Years | 0 (0.0%) | 0 (0.0%) |
| 5 Years | 0 (0.0%) | 0 (0.0%) |
| 6 to 11 Years | 0 (0.0%) | 0 (0.0%) |
| 12 to 14 Years | 0 (0.0%) | 0 (0.0%) |
| 15 Years | 0 (0.0%) | 0 (0.0%) |
| 16 and 17 Years | 0 (0.0%) | 0 (0.0%) |
| 18 to 24 Years | 0 (0.0%) | 0 (0.0%) |
| 25 to 34 Years | 0 (0.0%) | 0 (0.0%) |
| 35 to 44 Years | 0 (0.0%) | 0 (0.0%) |
| 45 to 54 Years | 0 (0.0%) | 0 (0.0%) |
| 55 to 64 Years | 0 (0.0%) | 4 (15.4%) |
| 65 to 74 Years | 0 (0.0%) | 17 (51.5%) |
| 75 Years and over | 0 (0.0%) | 0 (0.0%) |
| Total | 0 (0.0%) | 21 (9.2%) |
Income Above Poverty by Sex and Age in Naselle
According to the poverty statistics in Naselle, males aged under 5 years and females aged 6 to 11 years are the age groups that are most secure financially, with 100.0% of males and 100.0% of females in these age groups living above the poverty line.
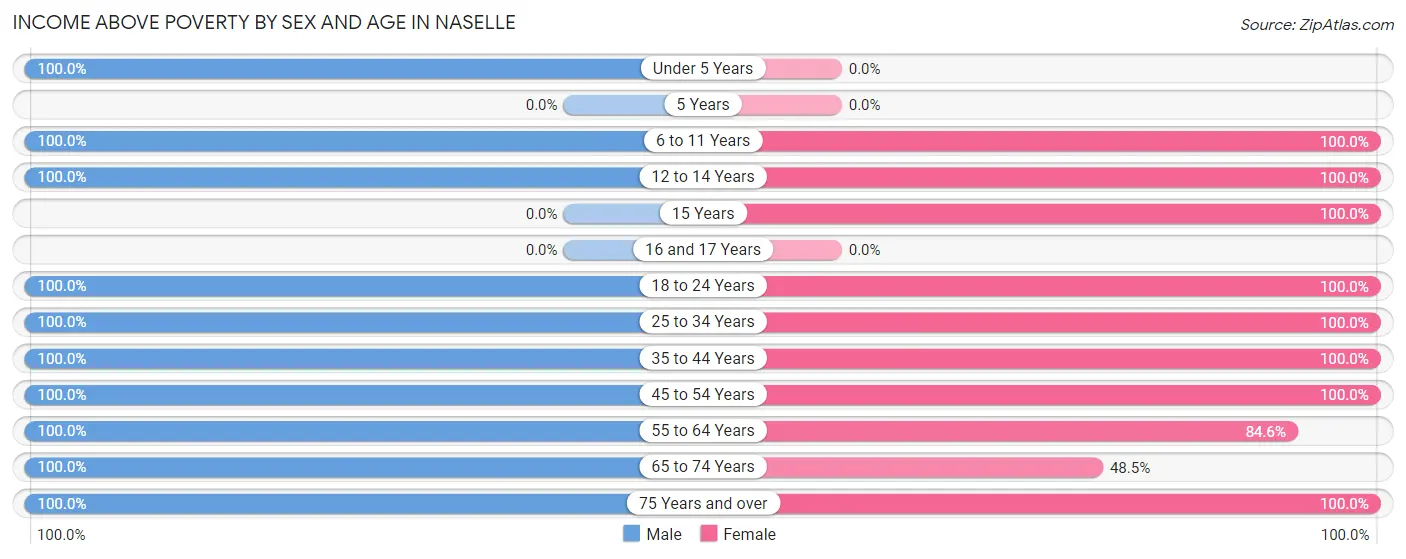
| Age Bracket | Male | Female |
| Under 5 Years | 16 (100.0%) | 0 (0.0%) |
| 5 Years | 0 (0.0%) | 0 (0.0%) |
| 6 to 11 Years | 12 (100.0%) | 41 (100.0%) |
| 12 to 14 Years | 60 (100.0%) | 17 (100.0%) |
| 15 Years | 0 (0.0%) | 1 (100.0%) |
| 16 and 17 Years | 0 (0.0%) | 0 (0.0%) |
| 18 to 24 Years | 113 (100.0%) | 2 (100.0%) |
| 25 to 34 Years | 6 (100.0%) | 27 (100.0%) |
| 35 to 44 Years | 52 (100.0%) | 26 (100.0%) |
| 45 to 54 Years | 90 (100.0%) | 39 (100.0%) |
| 55 to 64 Years | 25 (100.0%) | 22 (84.6%) |
| 65 to 74 Years | 24 (100.0%) | 16 (48.5%) |
| 75 Years and over | 4 (100.0%) | 15 (100.0%) |
| Total | 402 (100.0%) | 206 (90.7%) |
Income Below Poverty Among Married-Couple Families in Naselle
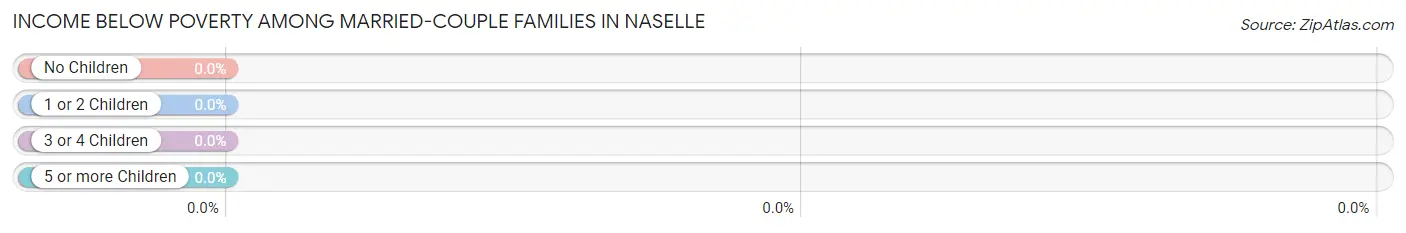
| Children | Above Poverty | Below Poverty |
| No Children | 42 (100.0%) | 0 (0.0%) |
| 1 or 2 Children | 0 (0.0%) | 0 (0.0%) |
| 3 or 4 Children | 50 (100.0%) | 0 (0.0%) |
| 5 or more Children | 0 (0.0%) | 0 (0.0%) |
| Total | 92 (100.0%) | 0 (0.0%) |
Income Below Poverty Among Single-Parent Households in Naselle
| Children | Single Father | Single Mother |
| No Children | 0 (0.0%) | 0 (0.0%) |
| 1 or 2 Children | 0 (0.0%) | 0 (0.0%) |
| 3 or 4 Children | 0 (0.0%) | 0 (0.0%) |
| 5 or more Children | 0 (0.0%) | 0 (0.0%) |
| Total | 0 (0.0%) | 0 (0.0%) |
Income Below Poverty Among Married-Couple vs Single-Parent Households in Naselle
| Children | Married-Couple Families | Single-Parent Households |
| No Children | 0 (0.0%) | 0 (0.0%) |
| 1 or 2 Children | 0 (0.0%) | 0 (0.0%) |
| 3 or 4 Children | 0 (0.0%) | 0 (0.0%) |
| 5 or more Children | 0 (0.0%) | 0 (0.0%) |
| Total | 0 (0.0%) | 0 (0.0%) |
Race in Naselle
The most populous races in Naselle are White / Caucasian (586 | 93.2%), Asian (29 | 4.6%), and Hispanic or Latino (14 | 2.2%).
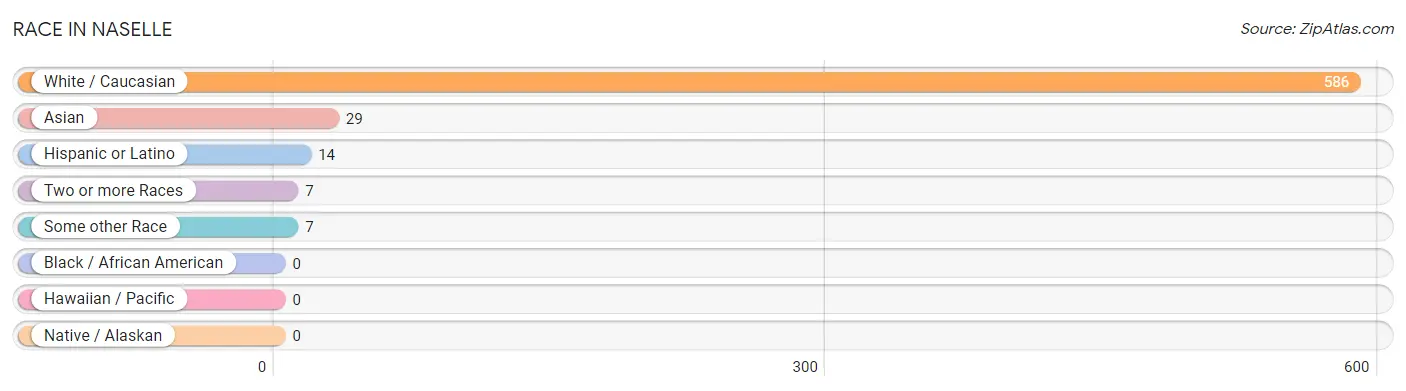
| Race | # Population | % Population |
| Asian | 29 | 4.6% |
| Black / African American | 0 | 0.0% |
| Hawaiian / Pacific | 0 | 0.0% |
| Hispanic or Latino | 14 | 2.2% |
| Native / Alaskan | 0 | 0.0% |
| White / Caucasian | 586 | 93.2% |
| Two or more Races | 7 | 1.1% |
| Some other Race | 7 | 1.1% |
| Total | 629 | 100.0% |
Ancestry in Naselle
The most populous ancestries reported in Naselle are German (98 | 15.6%), Irish (77 | 12.2%), Welsh (38 | 6.0%), Norwegian (30 | 4.8%), and Bhutanese (29 | 4.6%), together accounting for 43.2% of all Naselle residents.
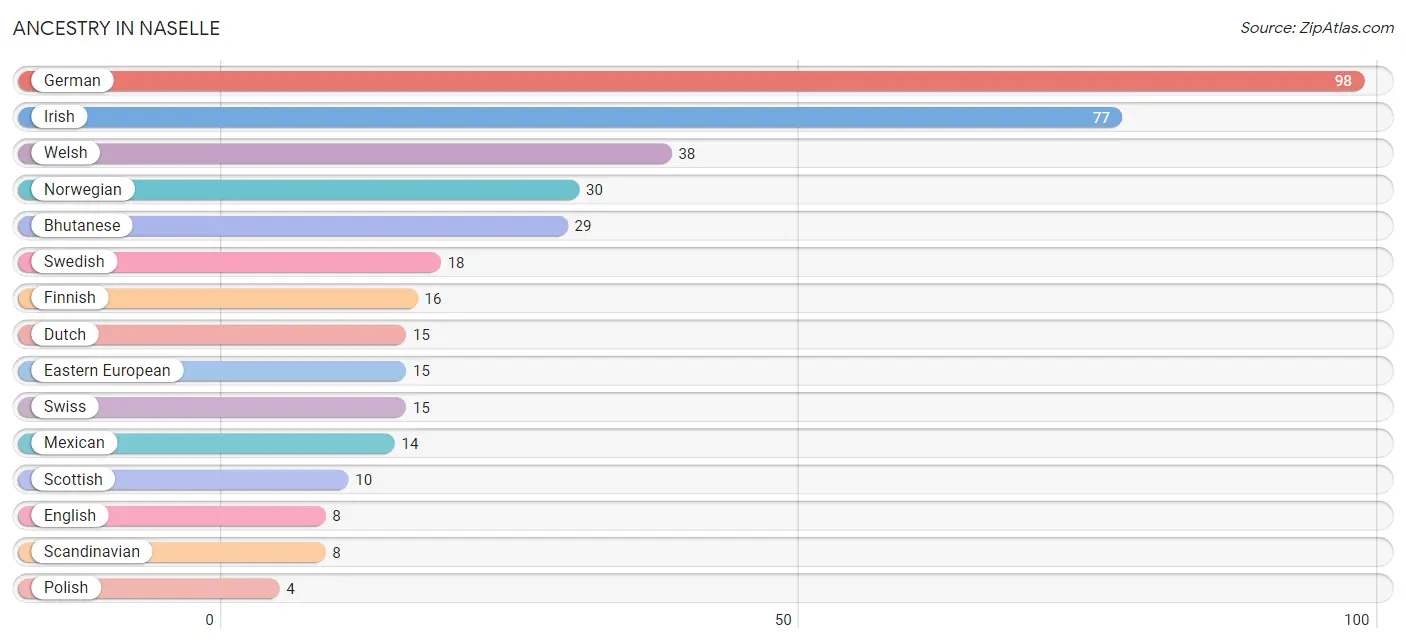
| Ancestry | # Population | % Population |
| Bhutanese | 29 | 4.6% |
| Dutch | 15 | 2.4% |
| Eastern European | 15 | 2.4% |
| English | 8 | 1.3% |
| Finnish | 16 | 2.5% |
| German | 98 | 15.6% |
| Irish | 77 | 12.2% |
| Mexican | 14 | 2.2% |
| Norwegian | 30 | 4.8% |
| Polish | 4 | 0.6% |
| Scandinavian | 8 | 1.3% |
| Scottish | 10 | 1.6% |
| Slovak | 4 | 0.6% |
| Swedish | 18 | 2.9% |
| Swiss | 15 | 2.4% |
| Welsh | 38 | 6.0% | View All 16 Rows |
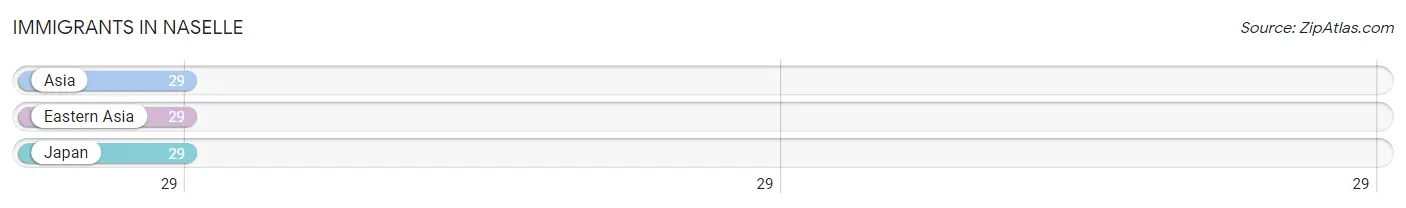
Immigrants in Naselle
The most numerous immigrant groups reported in Naselle came from Asia (29 | 4.6%), Eastern Asia (29 | 4.6%), and Japan (29 | 4.6%), together accounting for 13.8% of all Naselle residents.
| Immigration Origin | # Population | % Population |
| Asia | 29 | 4.6% |
| Eastern Asia | 29 | 4.6% |
| Japan | 29 | 4.6% | View All 3 Rows |
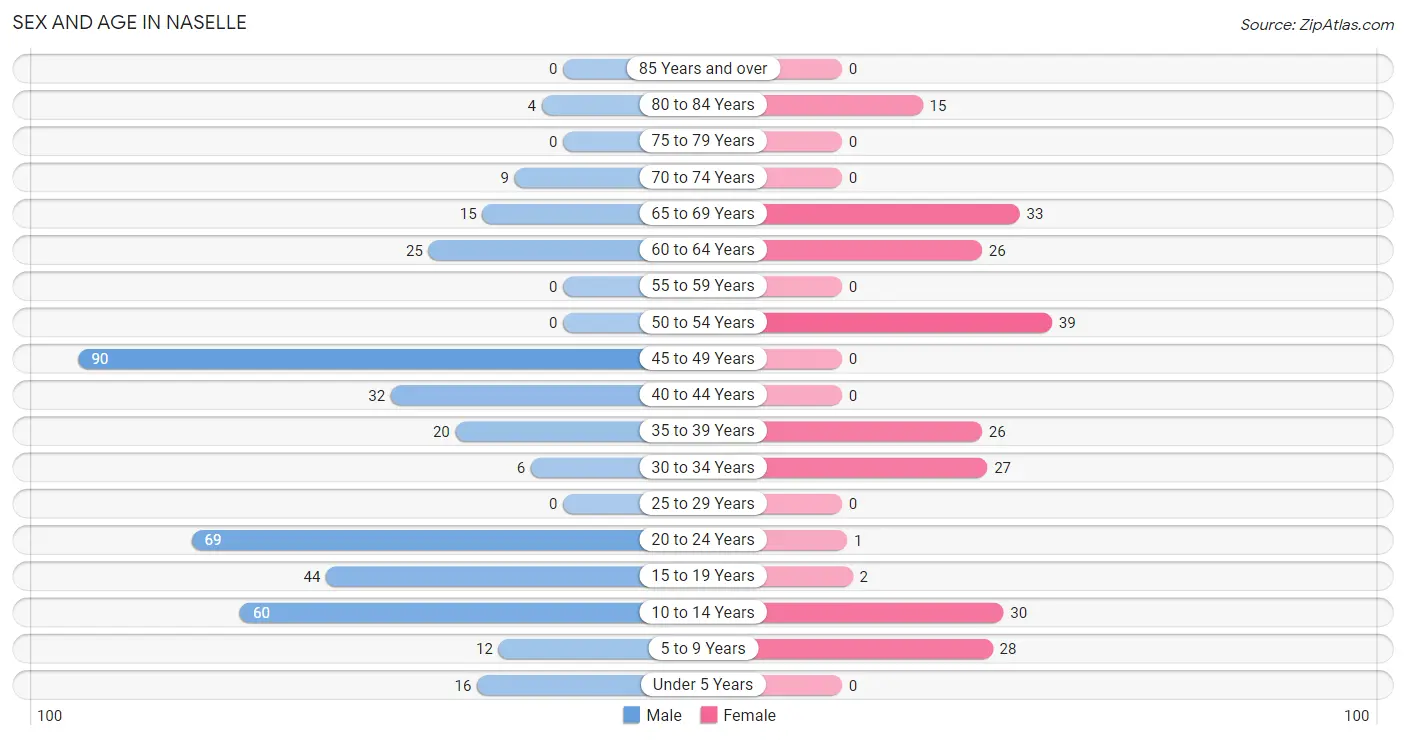
Sex and Age in Naselle
Sex and Age in Naselle
The most populous age groups in Naselle are 45 to 49 Years (90 | 22.4%) for men and 50 to 54 Years (39 | 17.2%) for women.
| Age Bracket | Male | Female |
| Under 5 Years | 16 (4.0%) | 0 (0.0%) |
| 5 to 9 Years | 12 (3.0%) | 28 (12.3%) |
| 10 to 14 Years | 60 (14.9%) | 30 (13.2%) |
| 15 to 19 Years | 44 (11.0%) | 2 (0.9%) |
| 20 to 24 Years | 69 (17.2%) | 1 (0.4%) |
| 25 to 29 Years | 0 (0.0%) | 0 (0.0%) |
| 30 to 34 Years | 6 (1.5%) | 27 (11.9%) |
| 35 to 39 Years | 20 (5.0%) | 26 (11.5%) |
| 40 to 44 Years | 32 (8.0%) | 0 (0.0%) |
| 45 to 49 Years | 90 (22.4%) | 0 (0.0%) |
| 50 to 54 Years | 0 (0.0%) | 39 (17.2%) |
| 55 to 59 Years | 0 (0.0%) | 0 (0.0%) |
| 60 to 64 Years | 25 (6.2%) | 26 (11.5%) |
| 65 to 69 Years | 15 (3.7%) | 33 (14.5%) |
| 70 to 74 Years | 9 (2.2%) | 0 (0.0%) |
| 75 to 79 Years | 0 (0.0%) | 0 (0.0%) |
| 80 to 84 Years | 4 (1.0%) | 15 (6.6%) |
| 85 Years and over | 0 (0.0%) | 0 (0.0%) |
| Total | 402 (100.0%) | 227 (100.0%) |
Families and Households in Naselle
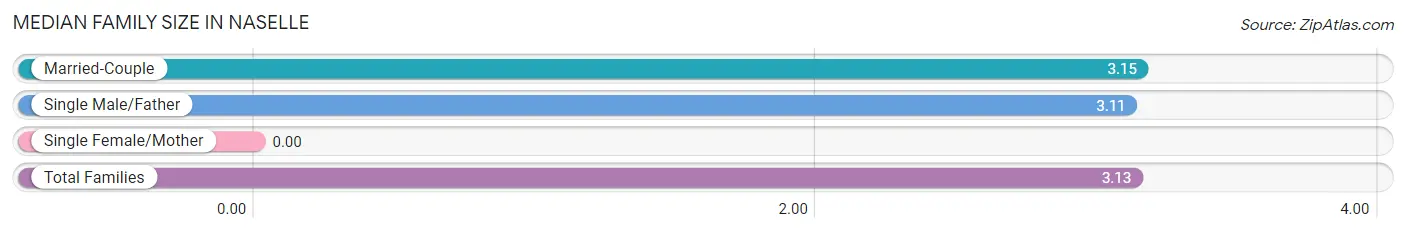
Median Family Size in Naselle
| Family Type | # Families | Family Size |
| Married-Couple | 92 (53.2%) | 3.15 |
| Single Male/Father | 81 (46.8%) | 3.11 |
| Single Female/Mother | 0 (0.0%) | - |
| Total Families | 173 (100.0%) | 3.13 |
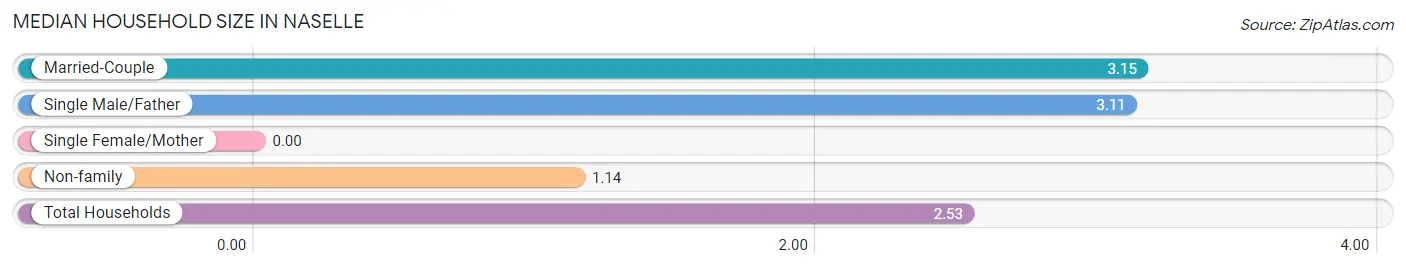
Median Household Size in Naselle
| Household Type | # Households | Household Size |
| Married-Couple | 92 (36.9%) | 3.15 |
| Single Male/Father | 81 (32.5%) | 3.11 |
| Single Female/Mother | 0 (0.0%) | - |
| Non-family | 76 (30.5%) | 1.14 |
| Total Households | 249 (100.0%) | 2.53 |
Household Size by Marriage Status in Naselle
Out of a total of 249 households in Naselle, 173 (69.5%) are family households, while 76 (30.5%) are nonfamily households. The most numerous type of family households are 4-person households, comprising 81, and the most common type of nonfamily households are 1-person households, comprising 61.
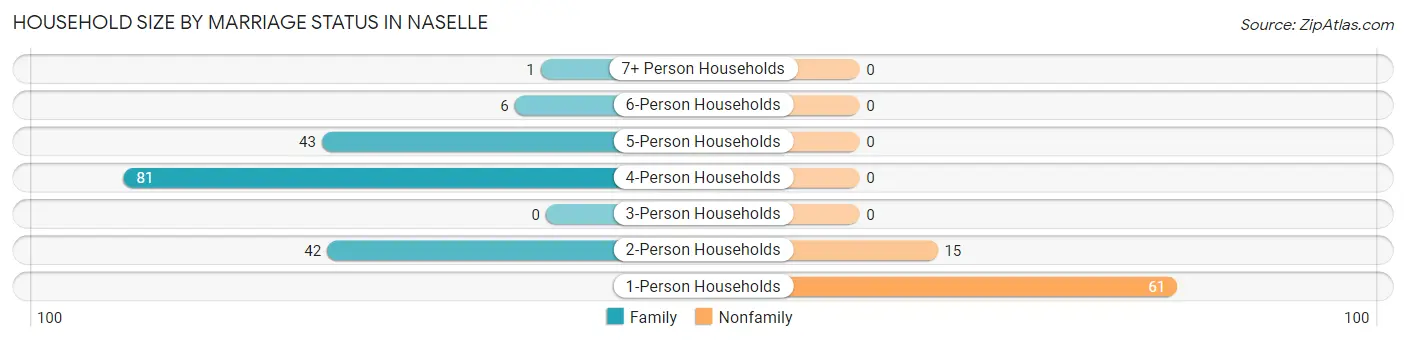
| Household Size | Family Households | Nonfamily Households |
| 1-Person Households | - | 61 (24.5%) |
| 2-Person Households | 42 (16.9%) | 15 (6.0%) |
| 3-Person Households | 0 (0.0%) | 0 (0.0%) |
| 4-Person Households | 81 (32.5%) | 0 (0.0%) |
| 5-Person Households | 43 (17.3%) | 0 (0.0%) |
| 6-Person Households | 6 (2.4%) | 0 (0.0%) |
| 7+ Person Households | 1 (0.4%) | 0 (0.0%) |
| Total | 173 (69.5%) | 76 (30.5%) |
Female Fertility in Naselle
Fertility by Age in Naselle
| Age Bracket | Women with Births | Births / 1,000 Women |
| 15 to 19 years | 0 (0.0%) | 0.0 |
| 20 to 34 years | 0 (0.0%) | 0.0 |
| 35 to 50 years | 0 (0.0%) | 0.0 |
| Total | 0 (0.0%) | 0.0 |
Fertility by Age by Marriage Status in Naselle
| Age Bracket | Married | Unmarried |
| 15 to 19 years | 0 (0.0%) | 0 (0.0%) |
| 20 to 34 years | 0 (0.0%) | 0 (0.0%) |
| 35 to 50 years | 0 (0.0%) | 0 (0.0%) |
| Total | 0 (0.0%) | 0 (0.0%) |
Fertility by Education in Naselle
| Educational Attainment | Women with Births | Births / 1,000 Women |
| Less than High School | 0 (0.0%) | 0.0 |
| High School Diploma | 0 (0.0%) | 0.0 |
| College or Associate's Degree | 0 (0.0%) | 0.0 |
| Bachelor's Degree | 0 (0.0%) | 0.0 |
| Graduate Degree | 0 (0.0%) | 0.0 |
| Total | 0 (0.0%) | 0.0 |
Fertility by Education by Marriage Status in Naselle
| Educational Attainment | Married | Unmarried |
| Less than High School | 0 (0.0%) | 0 (0.0%) |
| High School Diploma | 0 (0.0%) | 0 (0.0%) |
| College or Associate's Degree | 0 (0.0%) | 0 (0.0%) |
| Bachelor's Degree | 0 (0.0%) | 0 (0.0%) |
| Graduate Degree | 0 (0.0%) | 0 (0.0%) |
| Total | 0 (0.0%) | 0 (0.0%) |
Employment Characteristics in Naselle
Employment by Class of Employer in Naselle
Among the 327 employed individuals in Naselle, not-for-profit organizations (127 | 38.8%), private company employees (85 | 26.0%), and local government employees (49 | 15.0%) make up the most common classes of employment.
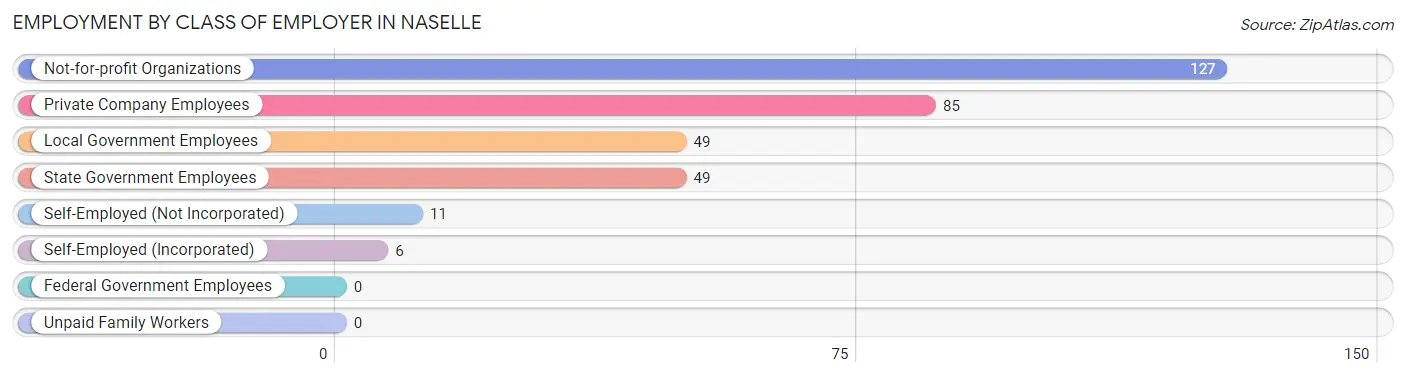
| Employer Class | # Employees | % Employees |
| Private Company Employees | 85 | 26.0% |
| Self-Employed (Incorporated) | 6 | 1.8% |
| Self-Employed (Not Incorporated) | 11 | 3.4% |
| Not-for-profit Organizations | 127 | 38.8% |
| Local Government Employees | 49 | 15.0% |
| State Government Employees | 49 | 15.0% |
| Federal Government Employees | 0 | 0.0% |
| Unpaid Family Workers | 0 | 0.0% |
| Total | 327 | 100.0% |
Employment Status by Age in Naselle
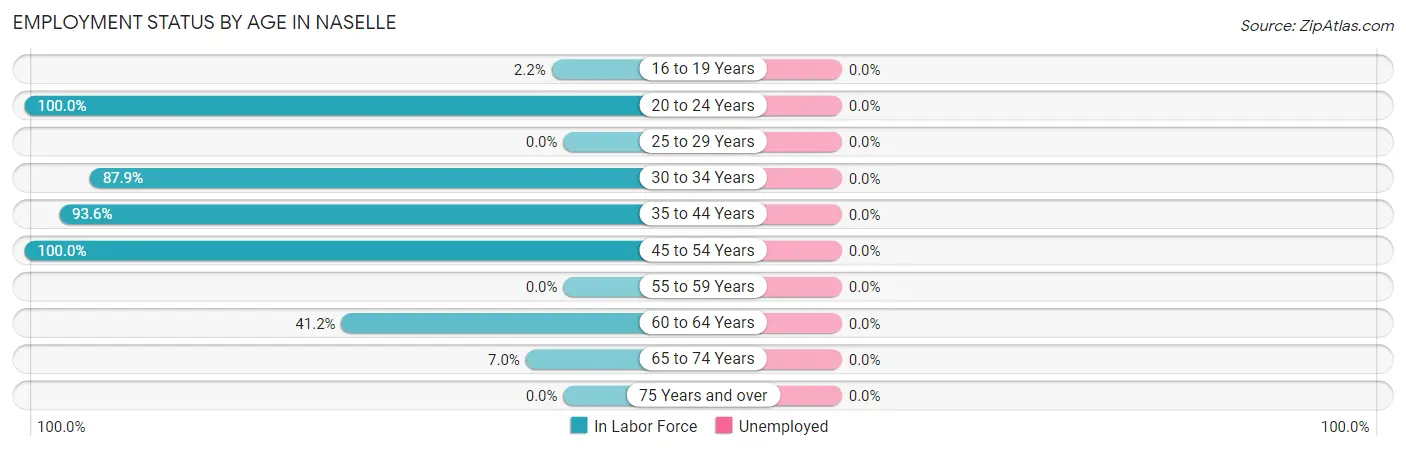
| Age Bracket | In Labor Force | Unemployed |
| 16 to 19 Years | 1 (2.2%) | 0 (0.0%) |
| 20 to 24 Years | 70 (100.0%) | 0 (0.0%) |
| 25 to 29 Years | 0 (0.0%) | 0 (0.0%) |
| 30 to 34 Years | 29 (87.9%) | 0 (0.0%) |
| 35 to 44 Years | 73 (93.6%) | 0 (0.0%) |
| 45 to 54 Years | 129 (100.0%) | 0 (0.0%) |
| 55 to 59 Years | 0 (0.0%) | 0 (0.0%) |
| 60 to 64 Years | 21 (41.2%) | 0 (0.0%) |
| 65 to 74 Years | 4 (7.0%) | 0 (0.0%) |
| 75 Years and over | 0 (0.0%) | 0 (0.0%) |
| Total | 327 (67.8%) | 0 (0.0%) |
Employment Status by Educational Attainment in Naselle
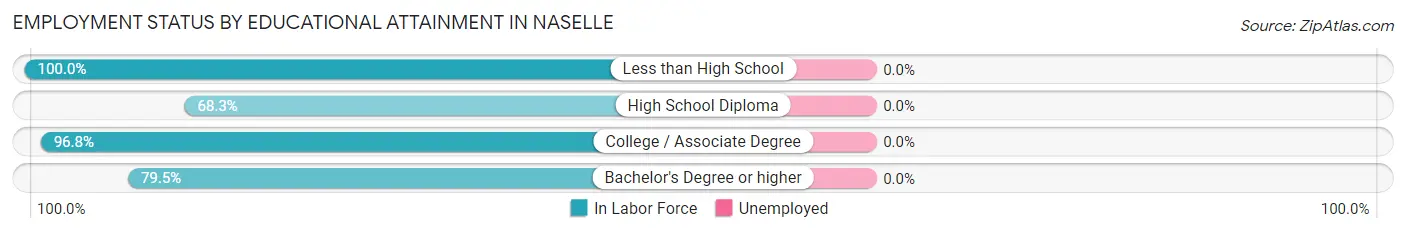
| Educational Attainment | In Labor Force | Unemployed |
| Less than High School | 2 (100.0%) | 0 (0.0%) |
| High School Diploma | 41 (68.3%) | 0 (0.0%) |
| College / Associate Degree | 151 (96.8%) | 0 (0.0%) |
| Bachelor's Degree or higher | 58 (79.5%) | 0 (0.0%) |
| Total | 252 (86.6%) | 0 (0.0%) |
Employment Occupations by Sex in Naselle
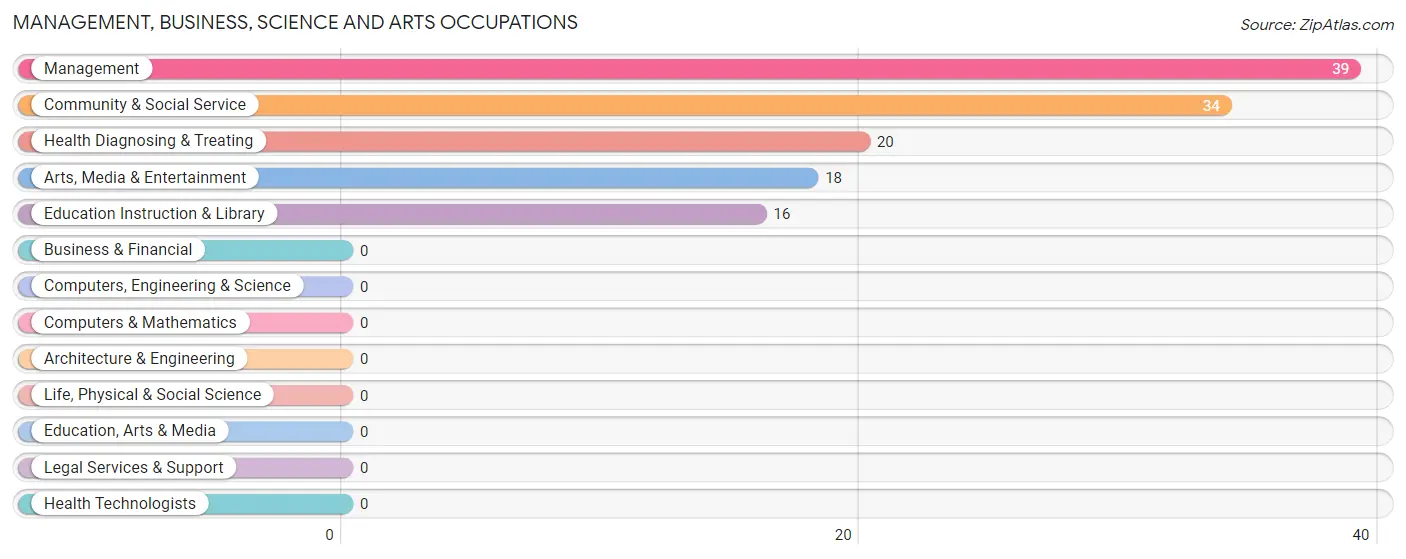
Management, Business, Science and Arts Occupations
The most common Management, Business, Science and Arts occupations in Naselle are Management (39 | 11.9%), Community & Social Service (34 | 10.4%), Health Diagnosing & Treating (20 | 6.1%), Arts, Media & Entertainment (18 | 5.5%), and Education Instruction & Library (16 | 4.9%).
Management, Business, Science and Arts Occupations by Sex
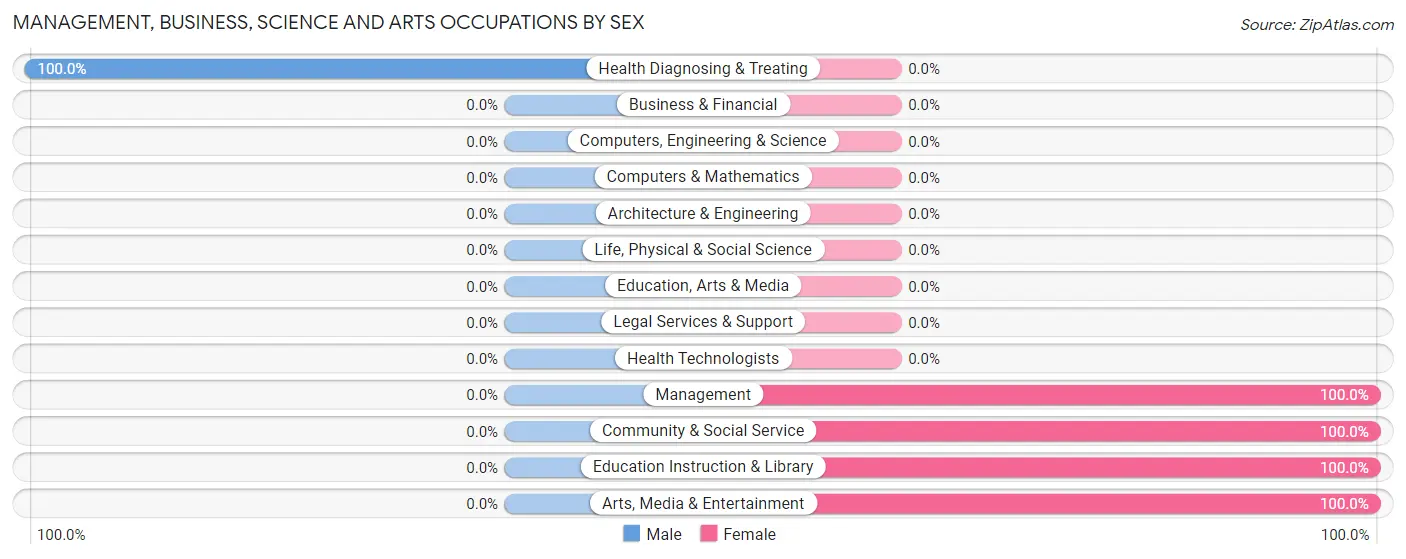
| Occupation | Male | Female |
| Management | 0 (0.0%) | 39 (100.0%) |
| Business & Financial | 0 (0.0%) | 0 (0.0%) |
| Computers, Engineering & Science | 0 (0.0%) | 0 (0.0%) |
| Computers & Mathematics | 0 (0.0%) | 0 (0.0%) |
| Architecture & Engineering | 0 (0.0%) | 0 (0.0%) |
| Life, Physical & Social Science | 0 (0.0%) | 0 (0.0%) |
| Community & Social Service | 0 (0.0%) | 34 (100.0%) |
| Education, Arts & Media | 0 (0.0%) | 0 (0.0%) |
| Legal Services & Support | 0 (0.0%) | 0 (0.0%) |
| Education Instruction & Library | 0 (0.0%) | 16 (100.0%) |
| Arts, Media & Entertainment | 0 (0.0%) | 18 (100.0%) |
| Health Diagnosing & Treating | 20 (100.0%) | 0 (0.0%) |
| Health Technologists | 0 (0.0%) | 0 (0.0%) |
| Total (Category) | 20 (21.5%) | 73 (78.5%) |
| Total (Overall) | 226 (69.1%) | 101 (30.9%) |
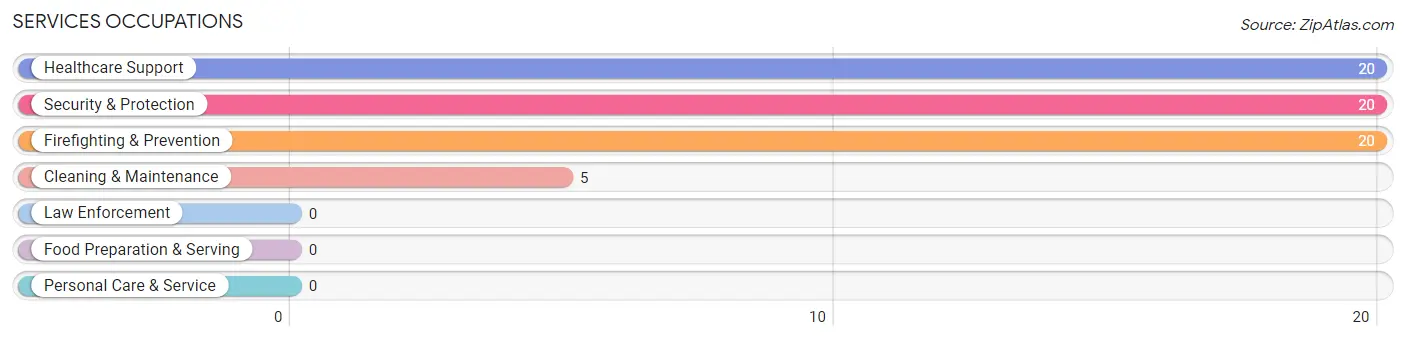
Services Occupations
The most common Services occupations in Naselle are Healthcare Support (20 | 6.1%), Security & Protection (20 | 6.1%), Firefighting & Prevention (20 | 6.1%), and Cleaning & Maintenance (5 | 1.5%).
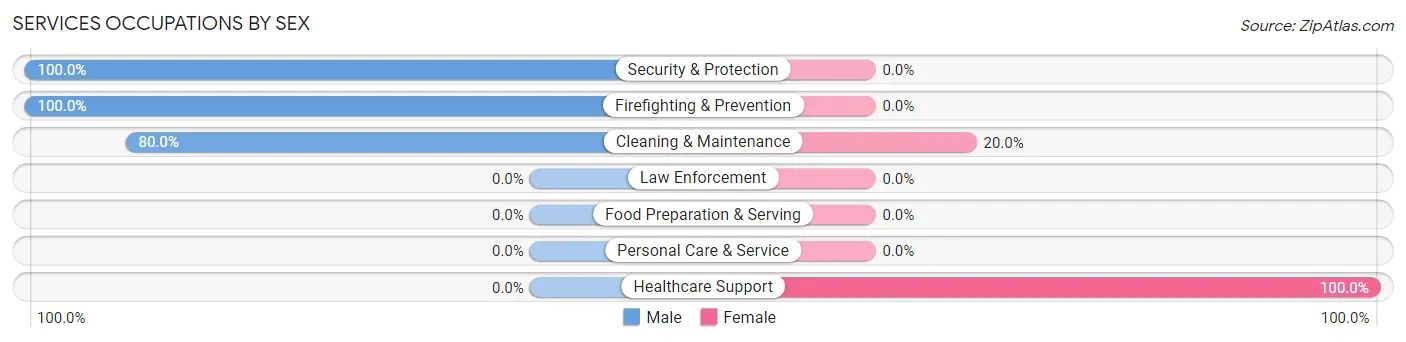
Services Occupations by Sex
Within the Services occupations in Naselle, the most male-oriented occupations are Security & Protection (100.0%), Firefighting & Prevention (100.0%), and Cleaning & Maintenance (80.0%), while the most female-oriented occupations are Healthcare Support (100.0%), and Cleaning & Maintenance (20.0%).
| Occupation | Male | Female |
| Healthcare Support | 0 (0.0%) | 20 (100.0%) |
| Security & Protection | 20 (100.0%) | 0 (0.0%) |
| Firefighting & Prevention | 20 (100.0%) | 0 (0.0%) |
| Law Enforcement | 0 (0.0%) | 0 (0.0%) |
| Food Preparation & Serving | 0 (0.0%) | 0 (0.0%) |
| Cleaning & Maintenance | 4 (80.0%) | 1 (20.0%) |
| Personal Care & Service | 0 (0.0%) | 0 (0.0%) |
| Total (Category) | 24 (53.3%) | 21 (46.7%) |
| Total (Overall) | 226 (69.1%) | 101 (30.9%) |
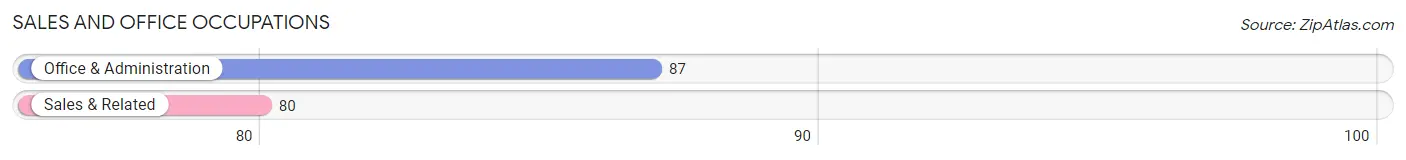
Sales and Office Occupations
The most common Sales and Office occupations in Naselle are Office & Administration (87 | 26.6%), and Sales & Related (80 | 24.5%).
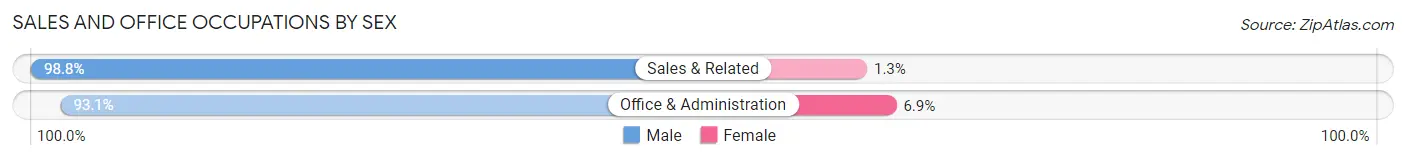
Sales and Office Occupations by Sex
| Occupation | Male | Female |
| Sales & Related | 79 (98.8%) | 1 (1.3%) |
| Office & Administration | 81 (93.1%) | 6 (6.9%) |
| Total (Category) | 160 (95.8%) | 7 (4.2%) |
| Total (Overall) | 226 (69.1%) | 101 (30.9%) |
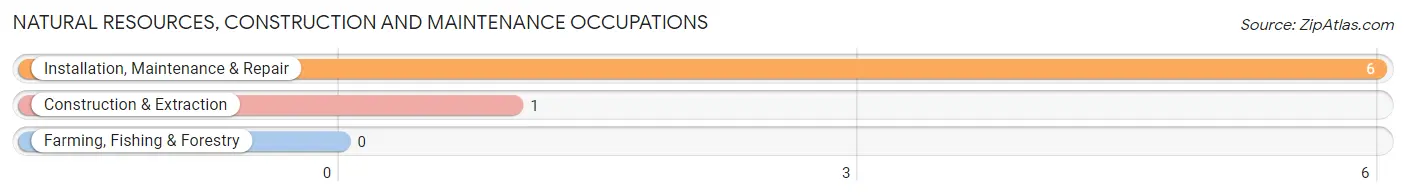
Natural Resources, Construction and Maintenance Occupations
The most common Natural Resources, Construction and Maintenance occupations in Naselle are Installation, Maintenance & Repair (6 | 1.8%), and Construction & Extraction (1 | 0.3%).
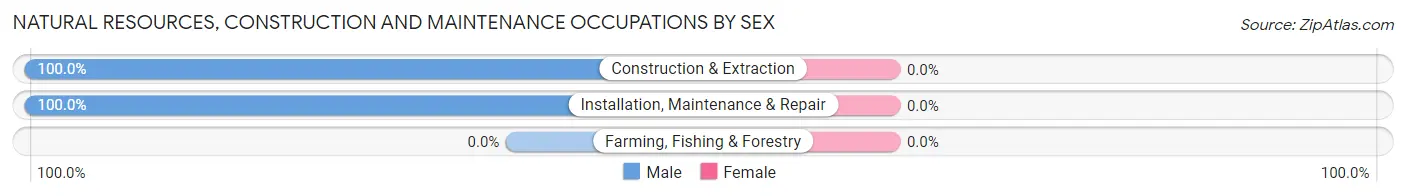
Natural Resources, Construction and Maintenance Occupations by Sex
| Occupation | Male | Female |
| Farming, Fishing & Forestry | 0 (0.0%) | 0 (0.0%) |
| Construction & Extraction | 1 (100.0%) | 0 (0.0%) |
| Installation, Maintenance & Repair | 6 (100.0%) | 0 (0.0%) |
| Total (Category) | 7 (100.0%) | 0 (0.0%) |
| Total (Overall) | 226 (69.1%) | 101 (30.9%) |
Production, Transportation and Moving Occupations
The most common Production, Transportation and Moving occupations in Naselle are Transportation (8 | 2.5%), and Material Moving (7 | 2.1%).
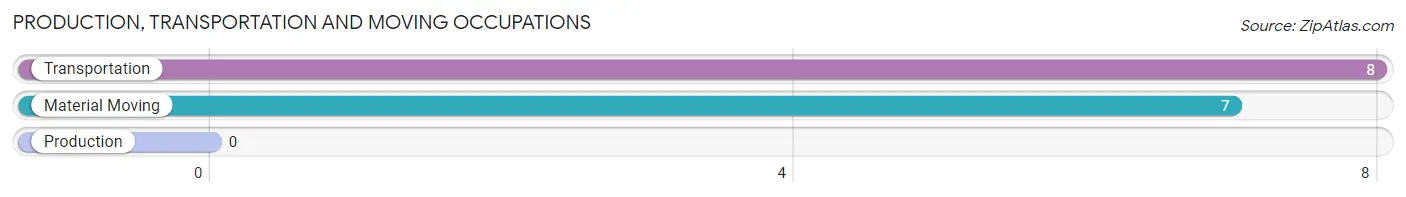
Production, Transportation and Moving Occupations by Sex
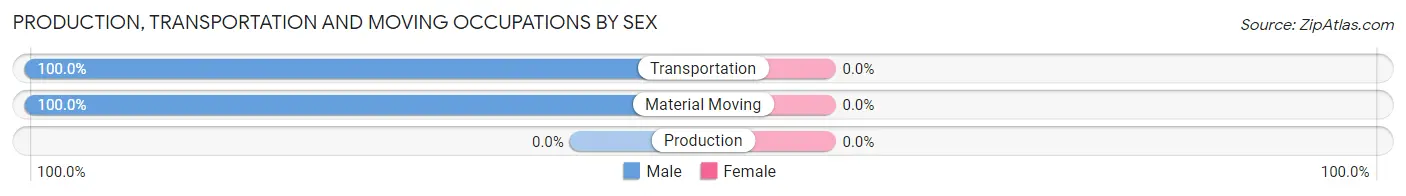
| Occupation | Male | Female |
| Production | 0 (0.0%) | 0 (0.0%) |
| Transportation | 8 (100.0%) | 0 (0.0%) |
| Material Moving | 7 (100.0%) | 0 (0.0%) |
| Total (Category) | 15 (100.0%) | 0 (0.0%) |
| Total (Overall) | 226 (69.1%) | 101 (30.9%) |
Employment Industries by Sex in Naselle
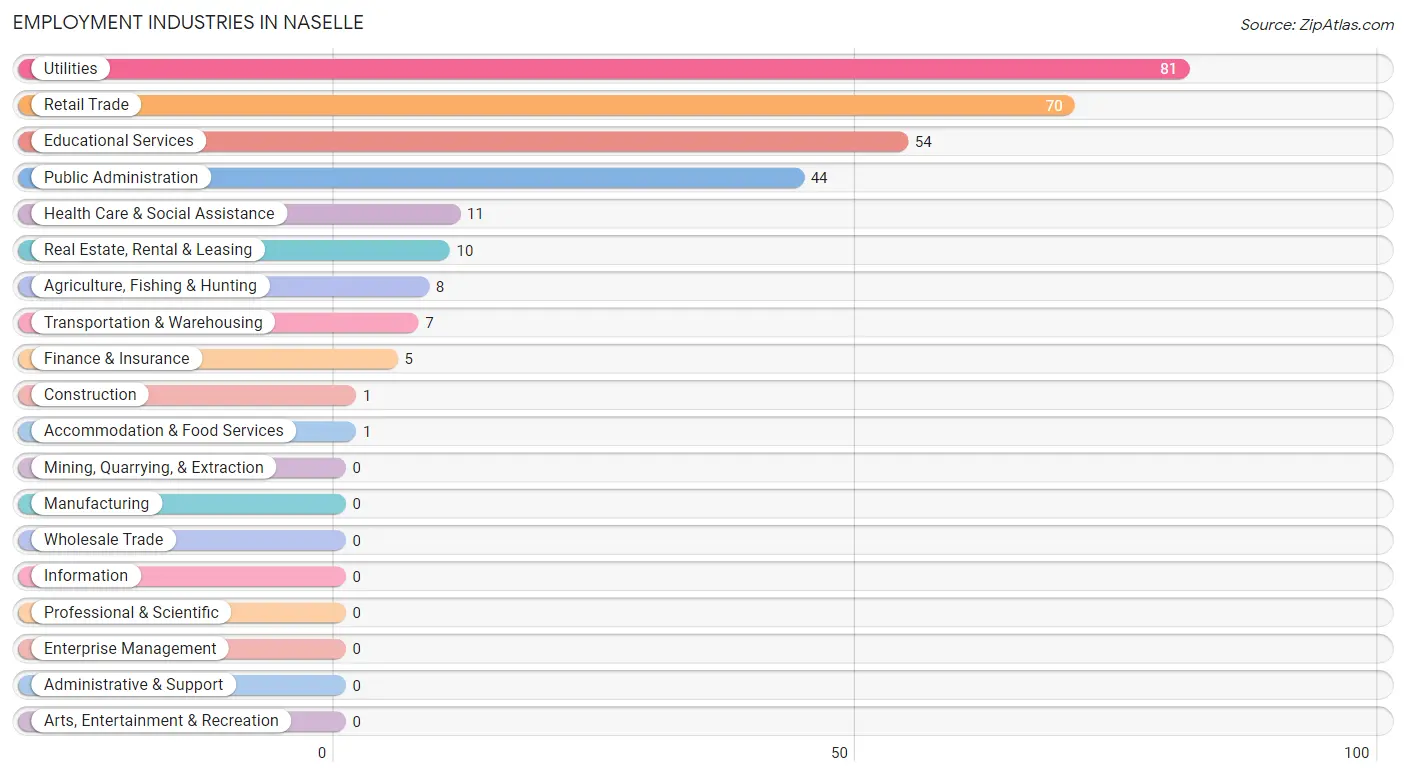
Employment Industries in Naselle
The major employment industries in Naselle include Utilities (81 | 24.8%), Retail Trade (70 | 21.4%), Educational Services (54 | 16.5%), Public Administration (44 | 13.5%), and Health Care & Social Assistance (11 | 3.4%).
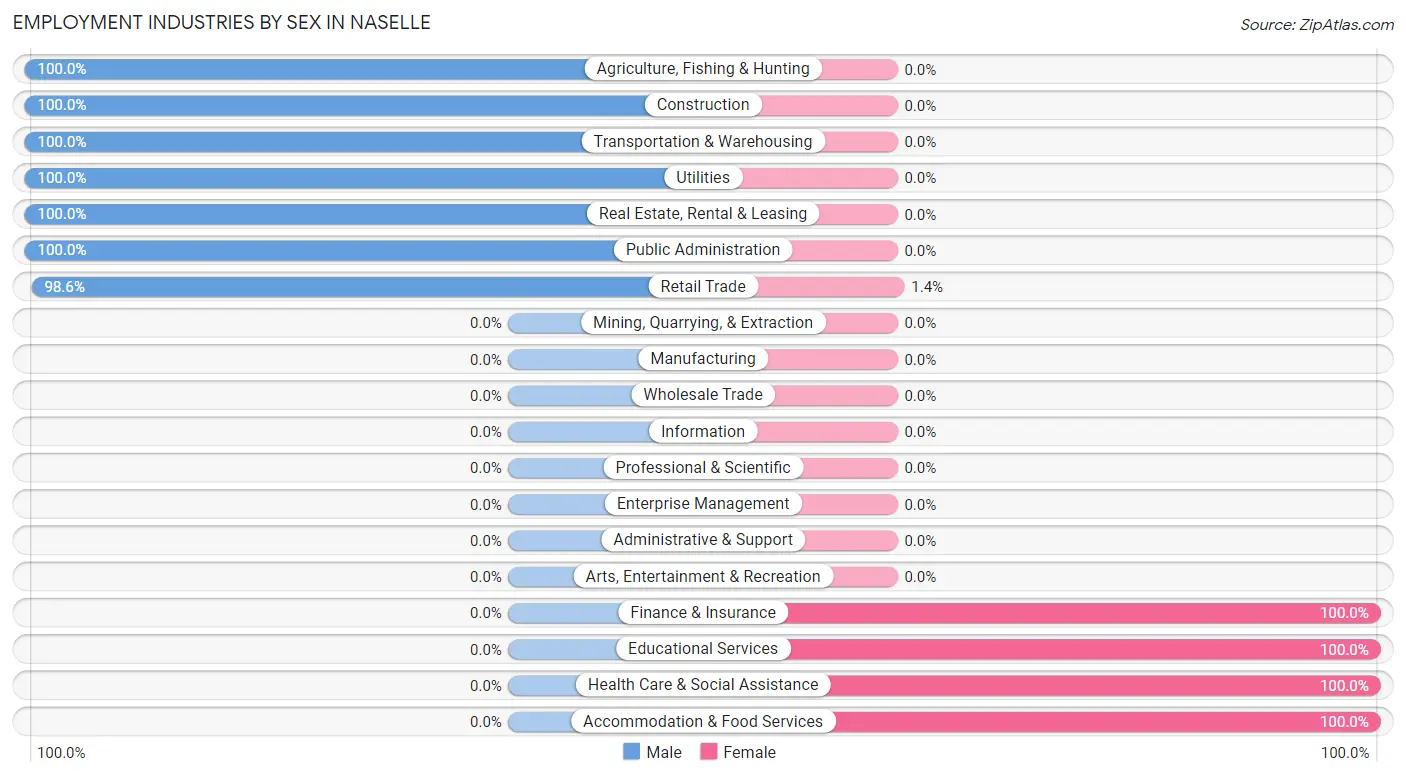
Employment Industries by Sex in Naselle
The Naselle industries that see more men than women are Agriculture, Fishing & Hunting (100.0%), Construction (100.0%), and Transportation & Warehousing (100.0%), whereas the industries that tend to have a higher number of women are Finance & Insurance (100.0%), Educational Services (100.0%), and Health Care & Social Assistance (100.0%).
| Industry | Male | Female |
| Agriculture, Fishing & Hunting | 8 (100.0%) | 0 (0.0%) |
| Mining, Quarrying, & Extraction | 0 (0.0%) | 0 (0.0%) |
| Construction | 1 (100.0%) | 0 (0.0%) |
| Manufacturing | 0 (0.0%) | 0 (0.0%) |
| Wholesale Trade | 0 (0.0%) | 0 (0.0%) |
| Retail Trade | 69 (98.6%) | 1 (1.4%) |
| Transportation & Warehousing | 7 (100.0%) | 0 (0.0%) |
| Utilities | 81 (100.0%) | 0 (0.0%) |
| Information | 0 (0.0%) | 0 (0.0%) |
| Finance & Insurance | 0 (0.0%) | 5 (100.0%) |
| Real Estate, Rental & Leasing | 10 (100.0%) | 0 (0.0%) |
| Professional & Scientific | 0 (0.0%) | 0 (0.0%) |
| Enterprise Management | 0 (0.0%) | 0 (0.0%) |
| Administrative & Support | 0 (0.0%) | 0 (0.0%) |
| Educational Services | 0 (0.0%) | 54 (100.0%) |
| Health Care & Social Assistance | 0 (0.0%) | 11 (100.0%) |
| Arts, Entertainment & Recreation | 0 (0.0%) | 0 (0.0%) |
| Accommodation & Food Services | 0 (0.0%) | 1 (100.0%) |
| Public Administration | 44 (100.0%) | 0 (0.0%) |
| Total | 226 (69.1%) | 101 (30.9%) |
Education in Naselle
School Enrollment in Naselle
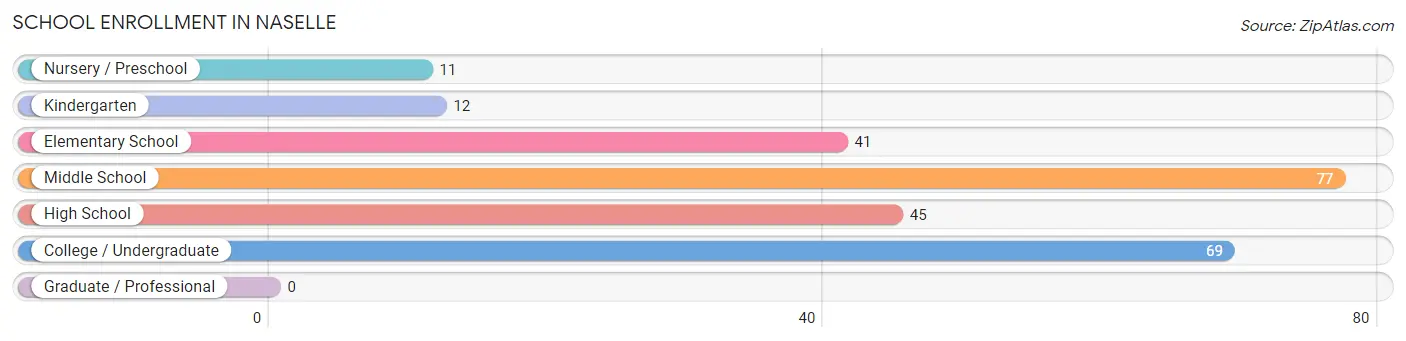
The most common levels of schooling among the 255 students in Naselle are middle school (77 | 30.2%), college / undergraduate (69 | 27.1%), and high school (45 | 17.6%).
| School Level | # Students | % Students |
| Nursery / Preschool | 11 | 4.3% |
| Kindergarten | 12 | 4.7% |
| Elementary School | 41 | 16.1% |
| Middle School | 77 | 30.2% |
| High School | 45 | 17.6% |
| College / Undergraduate | 69 | 27.1% |
| Graduate / Professional | 0 | 0.0% |
| Total | 255 | 100.0% |
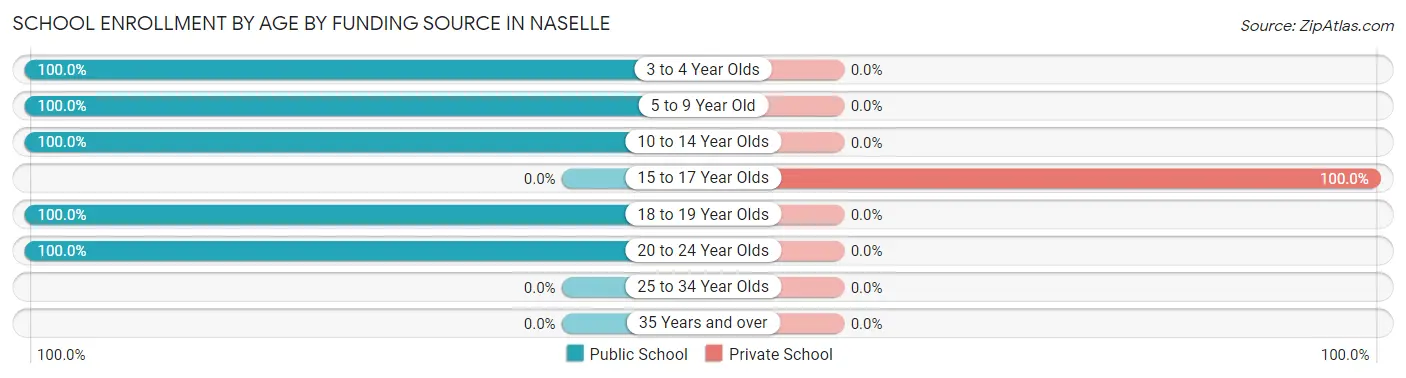
School Enrollment by Age by Funding Source in Naselle
Out of a total of 255 students who are enrolled in schools in Naselle, 1 (0.4%) attend a private institution, while the remaining 254 (99.6%) are enrolled in public schools. The age group of 15 to 17 year olds has the highest likelihood of being enrolled in private schools, with 1 (100.0% in the age bracket) enrolled. Conversely, the age group of 3 to 4 year olds has the lowest likelihood of being enrolled in a private school, with 11 (100.0% in the age bracket) attending a public institution.
| Age Bracket | Public School | Private School |
| 3 to 4 Year Olds | 11 (100.0%) | 0 (0.0%) |
| 5 to 9 Year Old | 40 (100.0%) | 0 (0.0%) |
| 10 to 14 Year Olds | 90 (100.0%) | 0 (0.0%) |
| 15 to 17 Year Olds | 0 (0.0%) | 1 (100.0%) |
| 18 to 19 Year Olds | 44 (100.0%) | 0 (0.0%) |
| 20 to 24 Year Olds | 69 (100.0%) | 0 (0.0%) |
| 25 to 34 Year Olds | 0 (0.0%) | 0 (0.0%) |
| 35 Years and over | 0 (0.0%) | 0 (0.0%) |
| Total | 254 (99.6%) | 1 (0.4%) |
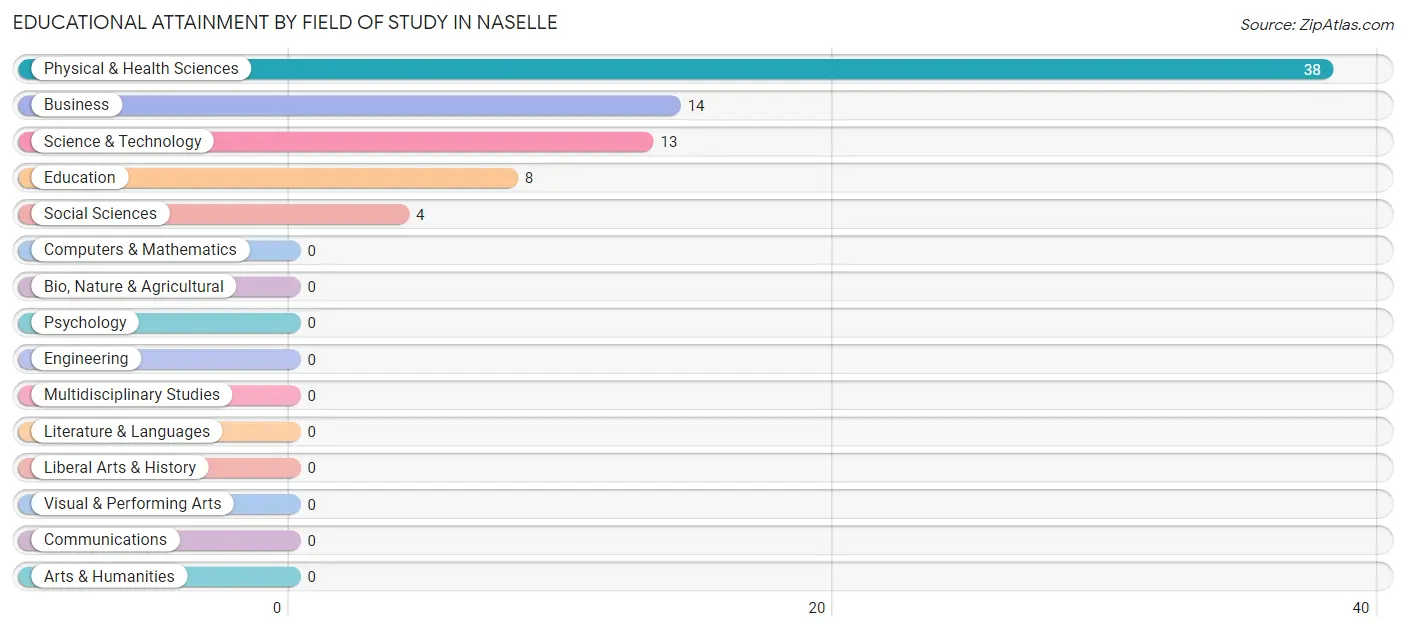
Educational Attainment by Field of Study in Naselle
Physical & health sciences (38 | 49.3%), business (14 | 18.2%), science & technology (13 | 16.9%), education (8 | 10.4%), and social sciences (4 | 5.2%) are the most common fields of study among 77 individuals in Naselle who have obtained a bachelor's degree or higher.
| Field of Study | # Graduates | % Graduates |
| Computers & Mathematics | 0 | 0.0% |
| Bio, Nature & Agricultural | 0 | 0.0% |
| Physical & Health Sciences | 38 | 49.3% |
| Psychology | 0 | 0.0% |
| Social Sciences | 4 | 5.2% |
| Engineering | 0 | 0.0% |
| Multidisciplinary Studies | 0 | 0.0% |
| Science & Technology | 13 | 16.9% |
| Business | 14 | 18.2% |
| Education | 8 | 10.4% |
| Literature & Languages | 0 | 0.0% |
| Liberal Arts & History | 0 | 0.0% |
| Visual & Performing Arts | 0 | 0.0% |
| Communications | 0 | 0.0% |
| Arts & Humanities | 0 | 0.0% |
| Total | 77 | 100.0% |
Transportation & Commute in Naselle
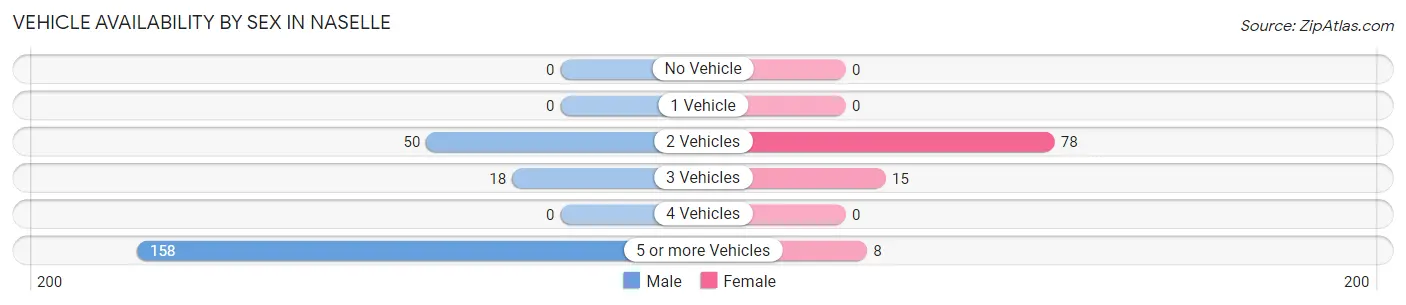
Vehicle Availability by Sex in Naselle
The most prevalent vehicle ownership categories in Naselle are males with 5 or more vehicles (158, accounting for 69.9%) and females with 5 or more vehicles (8, making up 156.4%).
| Vehicles Available | Male | Female |
| No Vehicle | 0 (0.0%) | 0 (0.0%) |
| 1 Vehicle | 0 (0.0%) | 0 (0.0%) |
| 2 Vehicles | 50 (22.1%) | 78 (77.2%) |
| 3 Vehicles | 18 (8.0%) | 15 (14.8%) |
| 4 Vehicles | 0 (0.0%) | 0 (0.0%) |
| 5 or more Vehicles | 158 (69.9%) | 8 (7.9%) |
| Total | 226 (100.0%) | 101 (100.0%) |
Commute Time in Naselle
The most frequently occuring commute durations in Naselle are less than 5 minutes (122 commuters, 40.9%), 35 to 39 minutes (89 commuters, 29.9%), and 90 or more minutes (28 commuters, 9.4%).
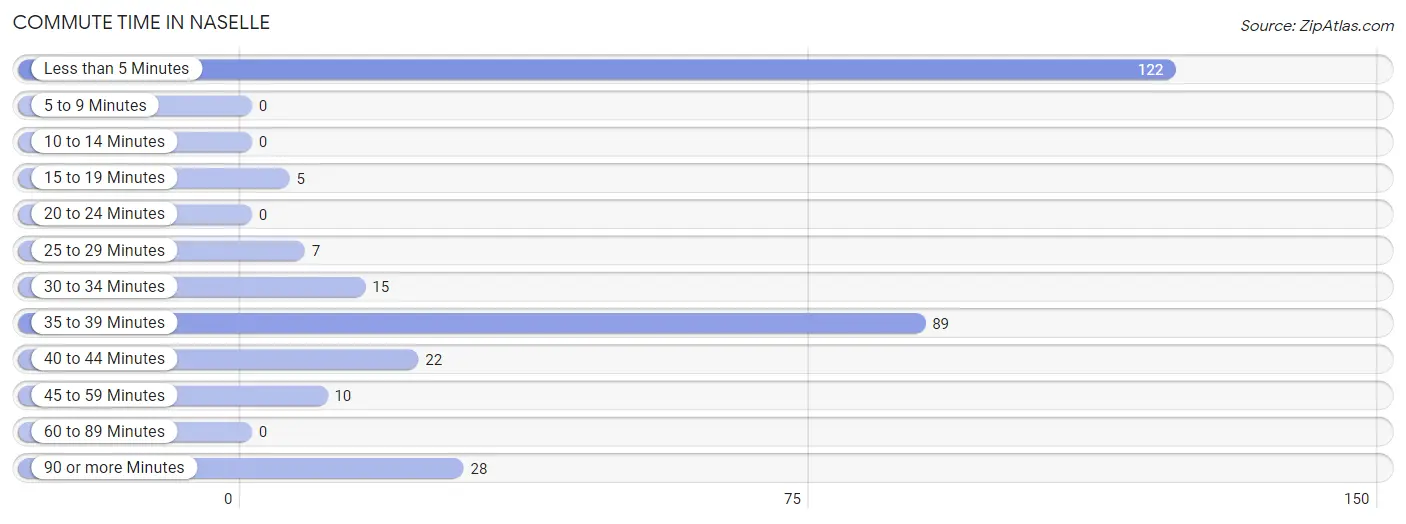
| Commute Time | # Commuters | % Commuters |
| Less than 5 Minutes | 122 | 40.9% |
| 5 to 9 Minutes | 0 | 0.0% |
| 10 to 14 Minutes | 0 | 0.0% |
| 15 to 19 Minutes | 5 | 1.7% |
| 20 to 24 Minutes | 0 | 0.0% |
| 25 to 29 Minutes | 7 | 2.4% |
| 30 to 34 Minutes | 15 | 5.0% |
| 35 to 39 Minutes | 89 | 29.9% |
| 40 to 44 Minutes | 22 | 7.4% |
| 45 to 59 Minutes | 10 | 3.4% |
| 60 to 89 Minutes | 0 | 0.0% |
| 90 or more Minutes | 28 | 9.4% |
Commute Time by Sex in Naselle
The most common commute times in Naselle are less than 5 minutes (91 commuters, 40.3%) for males and less than 5 minutes (31 commuters, 43.1%) for females.
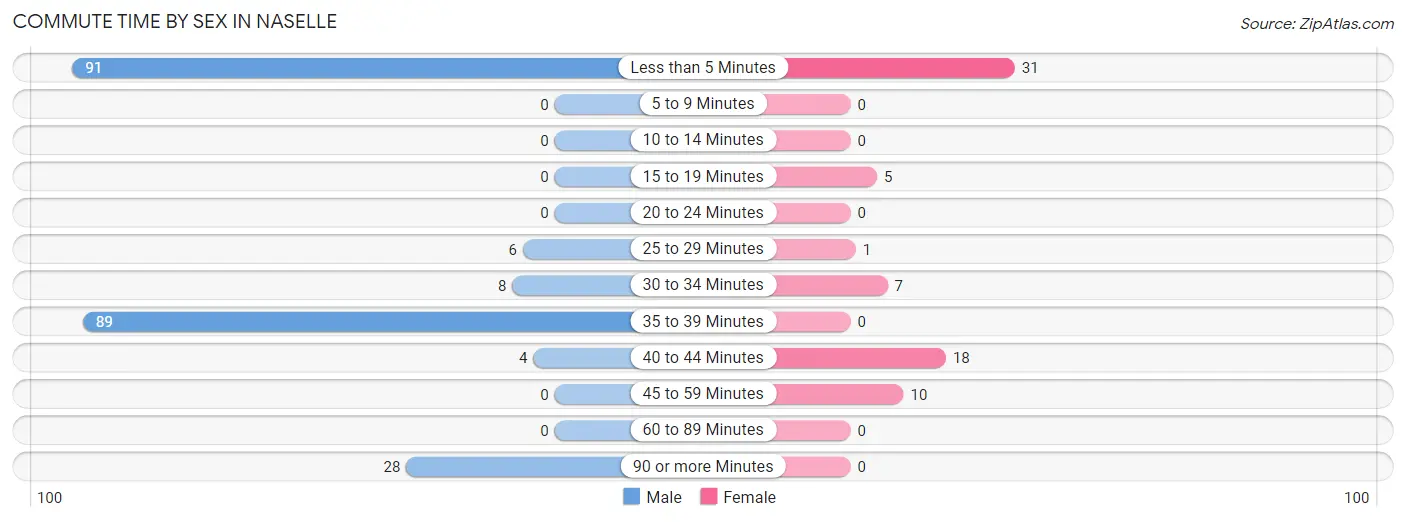
| Commute Time | Male | Female |
| Less than 5 Minutes | 91 (40.3%) | 31 (43.1%) |
| 5 to 9 Minutes | 0 (0.0%) | 0 (0.0%) |
| 10 to 14 Minutes | 0 (0.0%) | 0 (0.0%) |
| 15 to 19 Minutes | 0 (0.0%) | 5 (6.9%) |
| 20 to 24 Minutes | 0 (0.0%) | 0 (0.0%) |
| 25 to 29 Minutes | 6 (2.6%) | 1 (1.4%) |
| 30 to 34 Minutes | 8 (3.5%) | 7 (9.7%) |
| 35 to 39 Minutes | 89 (39.4%) | 0 (0.0%) |
| 40 to 44 Minutes | 4 (1.8%) | 18 (25.0%) |
| 45 to 59 Minutes | 0 (0.0%) | 10 (13.9%) |
| 60 to 89 Minutes | 0 (0.0%) | 0 (0.0%) |
| 90 or more Minutes | 28 (12.4%) | 0 (0.0%) |
Time of Departure to Work by Sex in Naselle
The most frequent times of departure to work in Naselle are 8:30 AM to 8:59 AM (97, 42.9%) for males and 7:00 AM to 7:29 AM (31, 43.1%) for females.
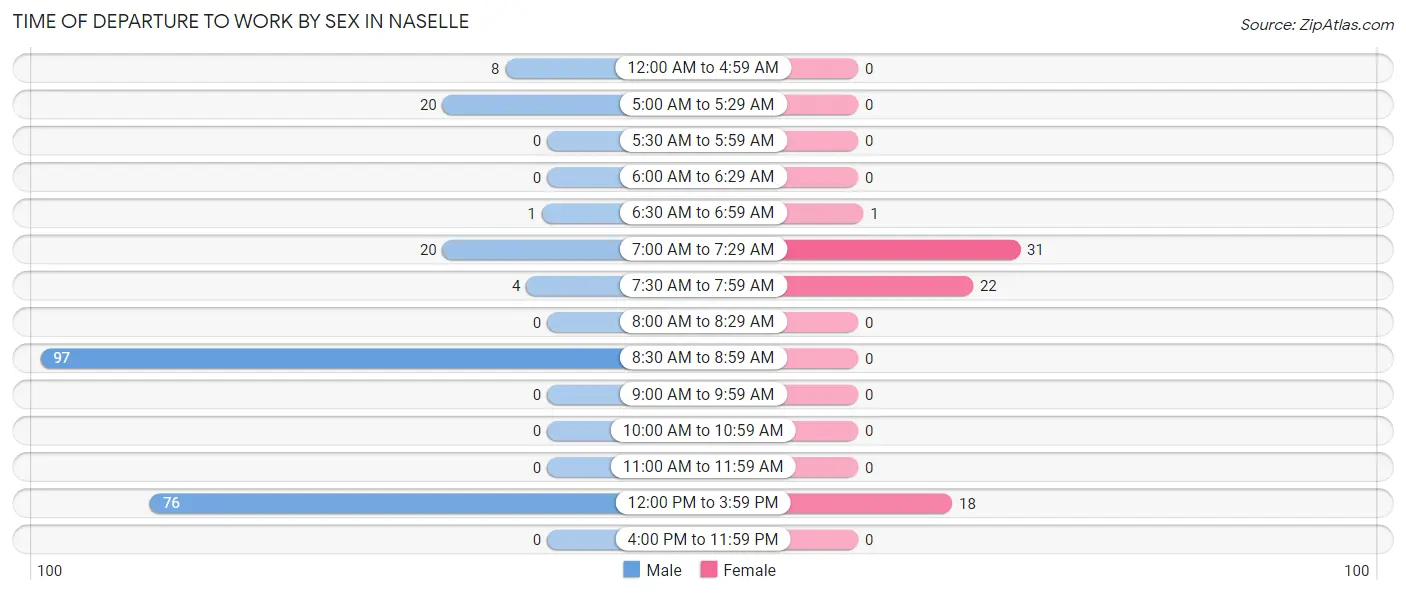
| Time of Departure | Male | Female |
| 12:00 AM to 4:59 AM | 8 (3.5%) | 0 (0.0%) |
| 5:00 AM to 5:29 AM | 20 (8.8%) | 0 (0.0%) |
| 5:30 AM to 5:59 AM | 0 (0.0%) | 0 (0.0%) |
| 6:00 AM to 6:29 AM | 0 (0.0%) | 0 (0.0%) |
| 6:30 AM to 6:59 AM | 1 (0.4%) | 1 (1.4%) |
| 7:00 AM to 7:29 AM | 20 (8.8%) | 31 (43.1%) |
| 7:30 AM to 7:59 AM | 4 (1.8%) | 22 (30.6%) |
| 8:00 AM to 8:29 AM | 0 (0.0%) | 0 (0.0%) |
| 8:30 AM to 8:59 AM | 97 (42.9%) | 0 (0.0%) |
| 9:00 AM to 9:59 AM | 0 (0.0%) | 0 (0.0%) |
| 10:00 AM to 10:59 AM | 0 (0.0%) | 0 (0.0%) |
| 11:00 AM to 11:59 AM | 0 (0.0%) | 0 (0.0%) |
| 12:00 PM to 3:59 PM | 76 (33.6%) | 18 (25.0%) |
| 4:00 PM to 11:59 PM | 0 (0.0%) | 0 (0.0%) |
| Total | 226 (100.0%) | 72 (100.0%) |
Housing Occupancy in Naselle
Occupancy by Ownership in Naselle
Of the total 249 dwellings in Naselle, owner-occupied units account for 228 (91.6%), while renter-occupied units make up 21 (8.4%).
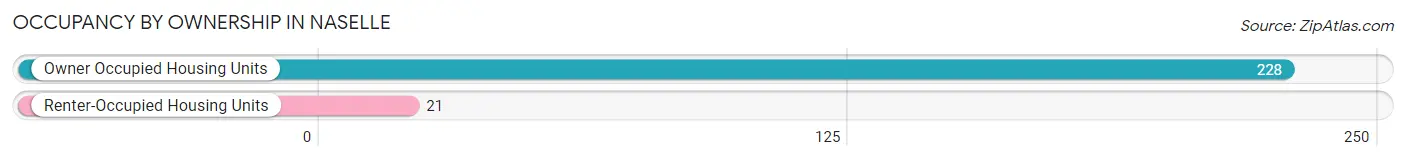
| Occupancy | # Housing Units | % Housing Units |
| Owner Occupied Housing Units | 228 | 91.6% |
| Renter-Occupied Housing Units | 21 | 8.4% |
| Total Occupied Housing Units | 249 | 100.0% |
Occupancy by Household Size in Naselle
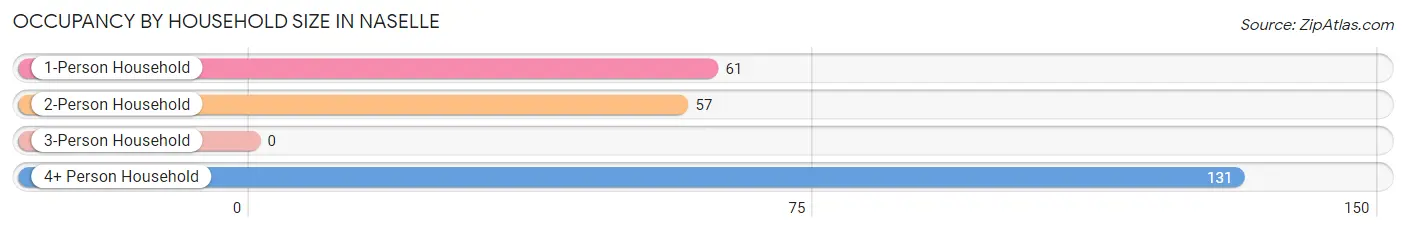
| Household Size | # Housing Units | % Housing Units |
| 1-Person Household | 61 | 24.5% |
| 2-Person Household | 57 | 22.9% |
| 3-Person Household | 0 | 0.0% |
| 4+ Person Household | 131 | 52.6% |
| Total Housing Units | 249 | 100.0% |
Occupancy by Ownership by Household Size in Naselle
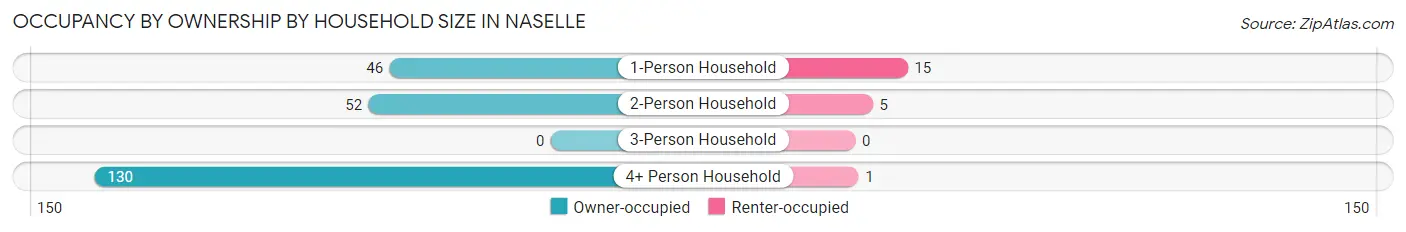
| Household Size | Owner-occupied | Renter-occupied |
| 1-Person Household | 46 (75.4%) | 15 (24.6%) |
| 2-Person Household | 52 (91.2%) | 5 (8.8%) |
| 3-Person Household | 0 (0.0%) | 0 (0.0%) |
| 4+ Person Household | 130 (99.2%) | 1 (0.8%) |
| Total Housing Units | 228 (91.6%) | 21 (8.4%) |
Occupancy by Educational Attainment in Naselle
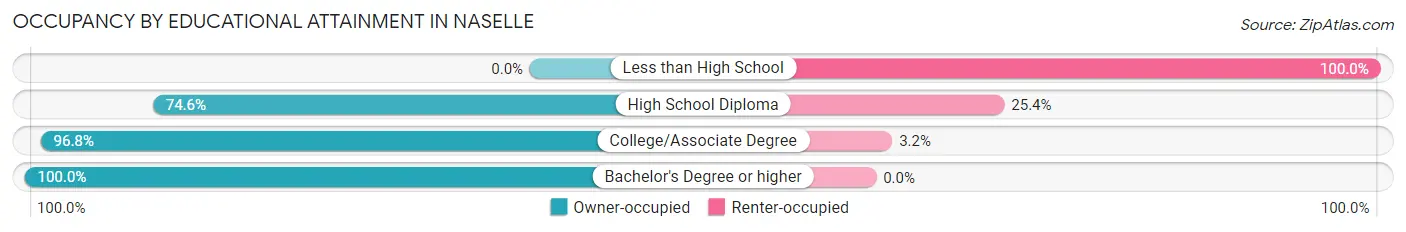
| Household Size | Owner-occupied | Renter-occupied |
| Less than High School | 0 (0.0%) | 1 (100.0%) |
| High School Diploma | 44 (74.6%) | 15 (25.4%) |
| College/Associate Degree | 152 (96.8%) | 5 (3.2%) |
| Bachelor's Degree or higher | 32 (100.0%) | 0 (0.0%) |
Occupancy by Age of Householder in Naselle
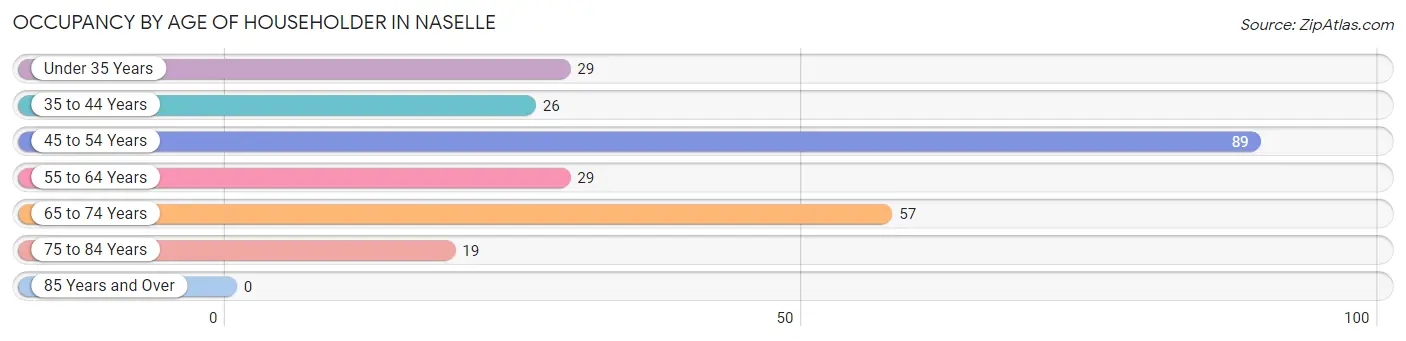
| Age Bracket | # Households | % Households |
| Under 35 Years | 29 | 11.7% |
| 35 to 44 Years | 26 | 10.4% |
| 45 to 54 Years | 89 | 35.7% |
| 55 to 64 Years | 29 | 11.7% |
| 65 to 74 Years | 57 | 22.9% |
| 75 to 84 Years | 19 | 7.6% |
| 85 Years and Over | 0 | 0.0% |
| Total | 249 | 100.0% |
Housing Finances in Naselle
Median Income by Occupancy in Naselle
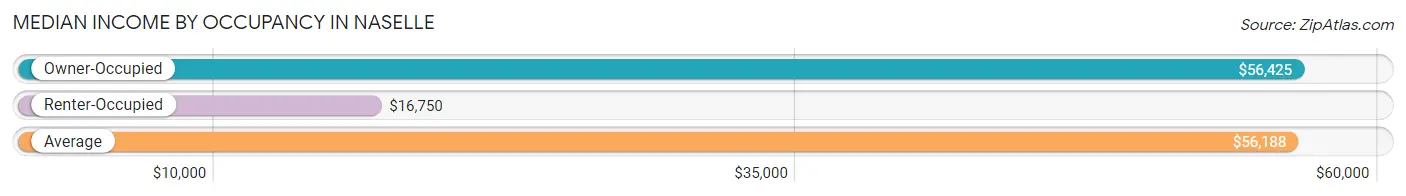
| Occupancy Type | # Households | Median Income |
| Owner-Occupied | 228 (91.6%) | $56,425 |
| Renter-Occupied | 21 (8.4%) | $16,750 |
| Average | 249 (100.0%) | $56,188 |
Occupancy by Householder Income Bracket in Naselle
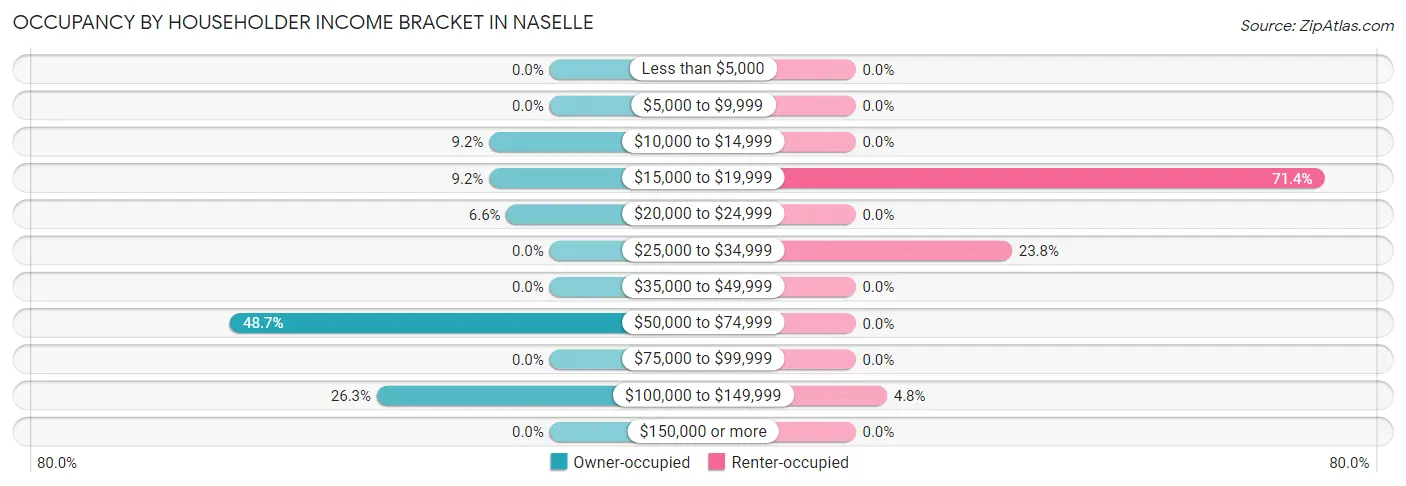
| Income Bracket | Owner-occupied | Renter-occupied |
| Less than $5,000 | 0 (0.0%) | 0 (0.0%) |
| $5,000 to $9,999 | 0 (0.0%) | 0 (0.0%) |
| $10,000 to $14,999 | 21 (9.2%) | 0 (0.0%) |
| $15,000 to $19,999 | 21 (9.2%) | 15 (71.4%) |
| $20,000 to $24,999 | 15 (6.6%) | 0 (0.0%) |
| $25,000 to $34,999 | 0 (0.0%) | 5 (23.8%) |
| $35,000 to $49,999 | 0 (0.0%) | 0 (0.0%) |
| $50,000 to $74,999 | 111 (48.7%) | 0 (0.0%) |
| $75,000 to $99,999 | 0 (0.0%) | 0 (0.0%) |
| $100,000 to $149,999 | 60 (26.3%) | 1 (4.8%) |
| $150,000 or more | 0 (0.0%) | 0 (0.0%) |
| Total | 228 (100.0%) | 21 (100.0%) |
Monthly Housing Cost Tiers in Naselle
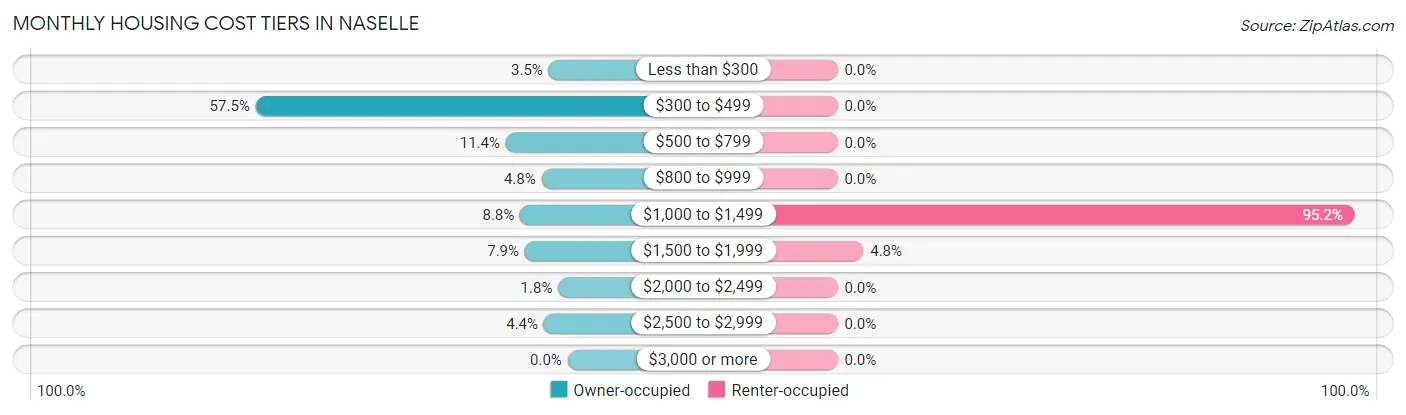
| Monthly Cost | Owner-occupied | Renter-occupied |
| Less than $300 | 8 (3.5%) | 0 (0.0%) |
| $300 to $499 | 131 (57.5%) | 0 (0.0%) |
| $500 to $799 | 26 (11.4%) | 0 (0.0%) |
| $800 to $999 | 11 (4.8%) | 0 (0.0%) |
| $1,000 to $1,499 | 20 (8.8%) | 20 (95.2%) |
| $1,500 to $1,999 | 18 (7.9%) | 1 (4.8%) |
| $2,000 to $2,499 | 4 (1.8%) | 0 (0.0%) |
| $2,500 to $2,999 | 10 (4.4%) | 0 (0.0%) |
| $3,000 or more | 0 (0.0%) | 0 (0.0%) |
| Total | 228 (100.0%) | 21 (100.0%) |
Physical Housing Characteristics in Naselle
Housing Structures in Naselle
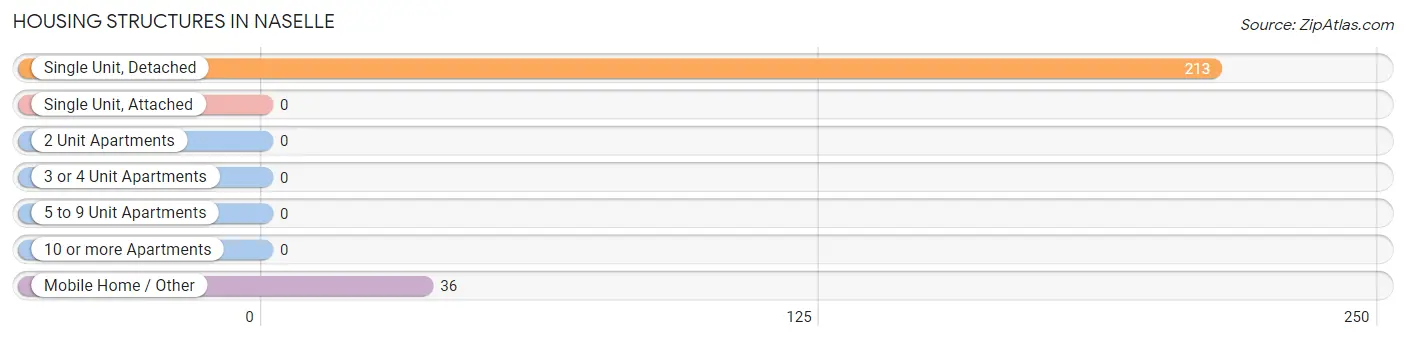
| Structure Type | # Housing Units | % Housing Units |
| Single Unit, Detached | 213 | 85.5% |
| Single Unit, Attached | 0 | 0.0% |
| 2 Unit Apartments | 0 | 0.0% |
| 3 or 4 Unit Apartments | 0 | 0.0% |
| 5 to 9 Unit Apartments | 0 | 0.0% |
| 10 or more Apartments | 0 | 0.0% |
| Mobile Home / Other | 36 | 14.5% |
| Total | 249 | 100.0% |
Housing Structures by Occupancy in Naselle
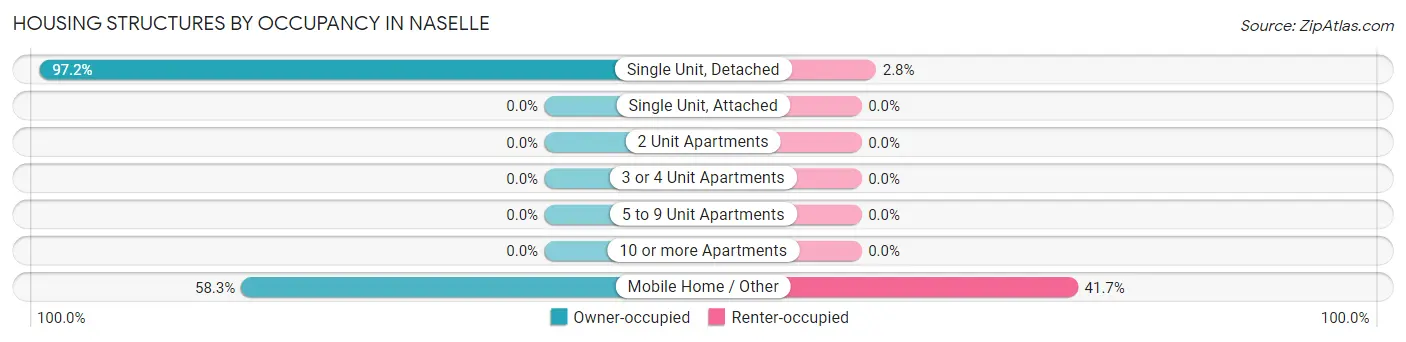
| Structure Type | Owner-occupied | Renter-occupied |
| Single Unit, Detached | 207 (97.2%) | 6 (2.8%) |
| Single Unit, Attached | 0 (0.0%) | 0 (0.0%) |
| 2 Unit Apartments | 0 (0.0%) | 0 (0.0%) |
| 3 or 4 Unit Apartments | 0 (0.0%) | 0 (0.0%) |
| 5 to 9 Unit Apartments | 0 (0.0%) | 0 (0.0%) |
| 10 or more Apartments | 0 (0.0%) | 0 (0.0%) |
| Mobile Home / Other | 21 (58.3%) | 15 (41.7%) |
| Total | 228 (91.6%) | 21 (8.4%) |
Housing Structures by Number of Rooms in Naselle
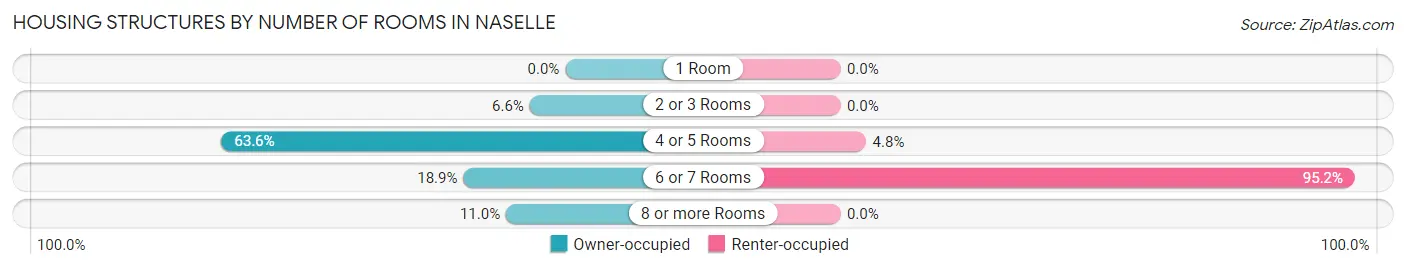
| Number of Rooms | Owner-occupied | Renter-occupied |
| 1 Room | 0 (0.0%) | 0 (0.0%) |
| 2 or 3 Rooms | 15 (6.6%) | 0 (0.0%) |
| 4 or 5 Rooms | 145 (63.6%) | 1 (4.8%) |
| 6 or 7 Rooms | 43 (18.9%) | 20 (95.2%) |
| 8 or more Rooms | 25 (11.0%) | 0 (0.0%) |
| Total | 228 (100.0%) | 21 (100.0%) |
Housing Structure by Heating Type in Naselle
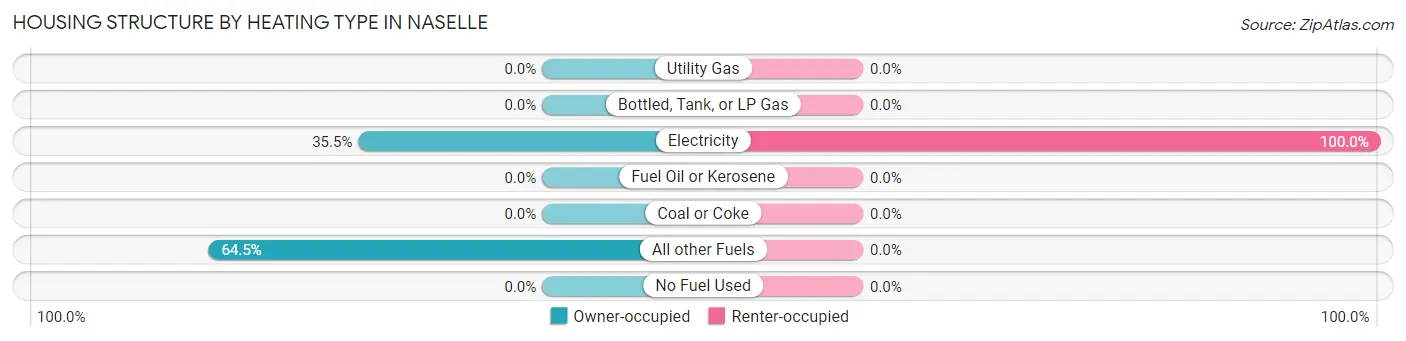
| Heating Type | Owner-occupied | Renter-occupied |
| Utility Gas | 0 (0.0%) | 0 (0.0%) |
| Bottled, Tank, or LP Gas | 0 (0.0%) | 0 (0.0%) |
| Electricity | 81 (35.5%) | 21 (100.0%) |
| Fuel Oil or Kerosene | 0 (0.0%) | 0 (0.0%) |
| Coal or Coke | 0 (0.0%) | 0 (0.0%) |
| All other Fuels | 147 (64.5%) | 0 (0.0%) |
| No Fuel Used | 0 (0.0%) | 0 (0.0%) |
| Total | 228 (100.0%) | 21 (100.0%) |
Household Vehicle Usage in Naselle
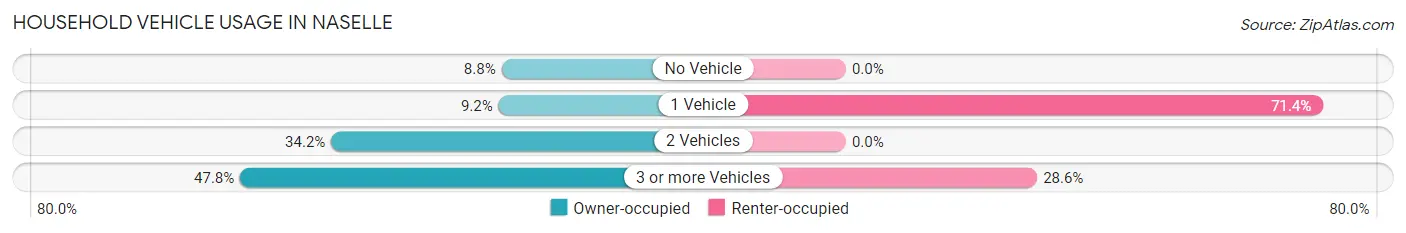
| Vehicles per Household | Owner-occupied | Renter-occupied |
| No Vehicle | 20 (8.8%) | 0 (0.0%) |
| 1 Vehicle | 21 (9.2%) | 15 (71.4%) |
| 2 Vehicles | 78 (34.2%) | 0 (0.0%) |
| 3 or more Vehicles | 109 (47.8%) | 6 (28.6%) |
| Total | 228 (100.0%) | 21 (100.0%) |
Real Estate & Mortgages in Naselle
Real Estate and Mortgage Overview in Naselle
| Characteristic | Without Mortgage | With Mortgage |
| Housing Units | 148 | 80 |
| Median Property Value | - | - |
| Median Household Income | $55,850 | $0 |
| Monthly Housing Costs | $424 | $0 |
| Real Estate Taxes | $1,343 | $5 |
Property Value by Mortgage Status in Naselle
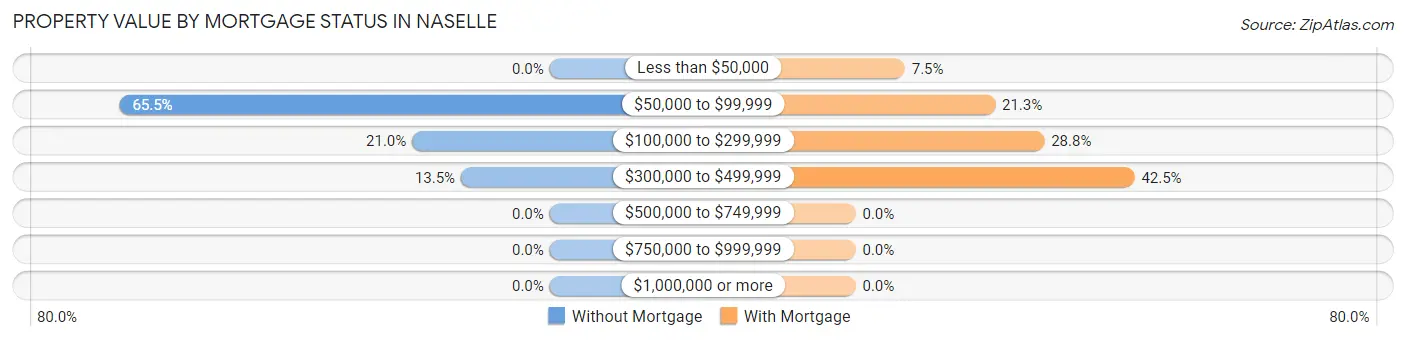
| Property Value | Without Mortgage | With Mortgage |
| Less than $50,000 | 0 (0.0%) | 6 (7.5%) |
| $50,000 to $99,999 | 97 (65.5%) | 17 (21.2%) |
| $100,000 to $299,999 | 31 (20.9%) | 23 (28.7%) |
| $300,000 to $499,999 | 20 (13.5%) | 34 (42.5%) |
| $500,000 to $749,999 | 0 (0.0%) | 0 (0.0%) |
| $750,000 to $999,999 | 0 (0.0%) | 0 (0.0%) |
| $1,000,000 or more | 0 (0.0%) | 0 (0.0%) |
| Total | 148 (100.0%) | 80 (100.0%) |
Household Income by Mortgage Status in Naselle
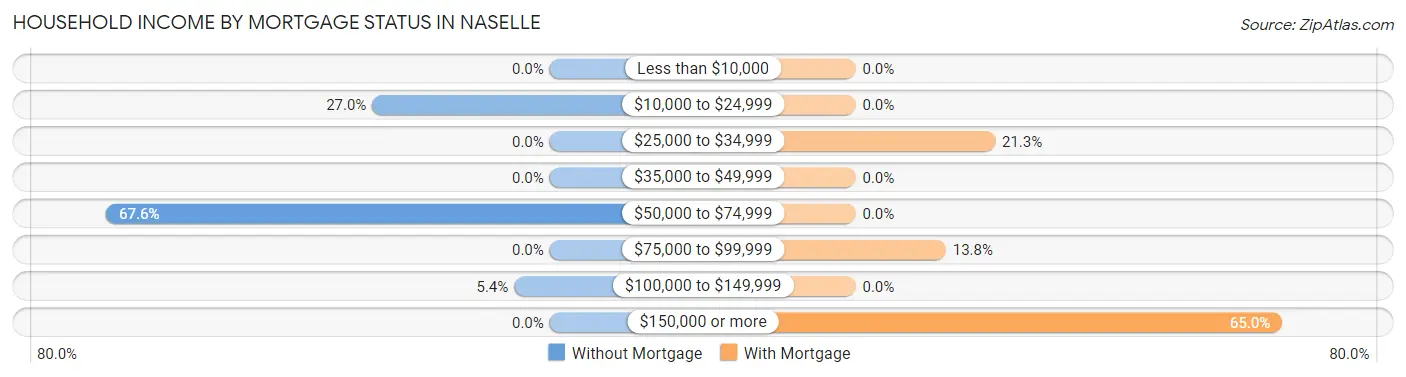
| Household Income | Without Mortgage | With Mortgage |
| Less than $10,000 | 0 (0.0%) | 0 (0.0%) |
| $10,000 to $24,999 | 40 (27.0%) | 0 (0.0%) |
| $25,000 to $34,999 | 0 (0.0%) | 17 (21.2%) |
| $35,000 to $49,999 | 0 (0.0%) | 0 (0.0%) |
| $50,000 to $74,999 | 100 (67.6%) | 0 (0.0%) |
| $75,000 to $99,999 | 0 (0.0%) | 11 (13.8%) |
| $100,000 to $149,999 | 8 (5.4%) | 0 (0.0%) |
| $150,000 or more | 0 (0.0%) | 52 (65.0%) |
| Total | 148 (100.0%) | 80 (100.0%) |
Property Value to Household Income Ratio in Naselle
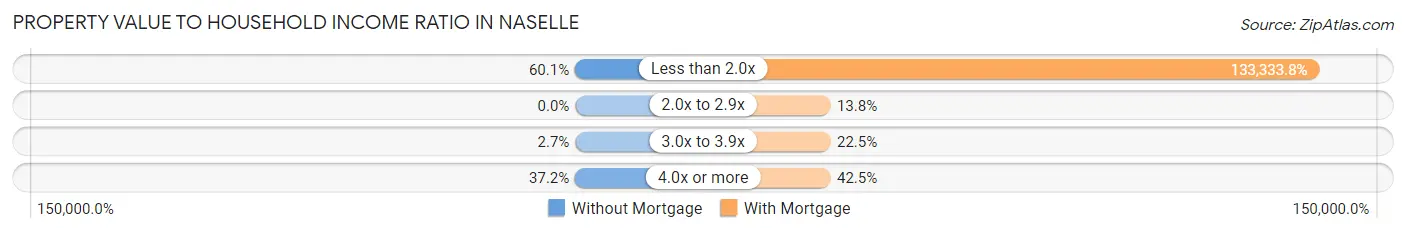
| Value-to-Income Ratio | Without Mortgage | With Mortgage |
| Less than 2.0x | 89 (60.1%) | 106,667 (133,333.8%) |
| 2.0x to 2.9x | 0 (0.0%) | 11 (13.8%) |
| 3.0x to 3.9x | 4 (2.7%) | 18 (22.5%) |
| 4.0x or more | 55 (37.2%) | 34 (42.5%) |
| Total | 148 (100.0%) | 80 (100.0%) |
Real Estate Taxes by Mortgage Status in Naselle
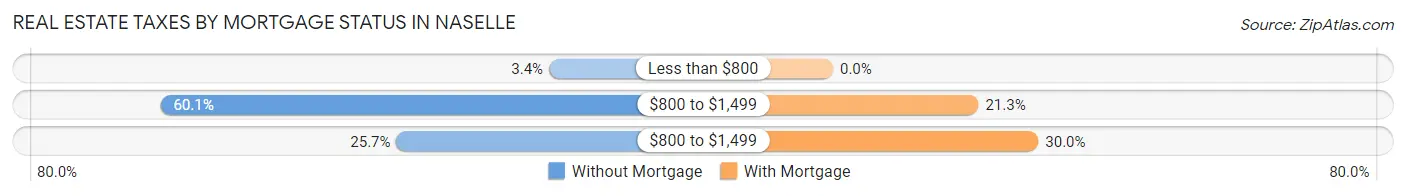
| Property Taxes | Without Mortgage | With Mortgage |
| Less than $800 | 5 (3.4%) | 0 (0.0%) |
| $800 to $1,499 | 89 (60.1%) | 17 (21.2%) |
| $800 to $1,499 | 38 (25.7%) | 24 (30.0%) |
| Total | 148 (100.0%) | 80 (100.0%) |
Health & Disability in Naselle
Health Insurance Coverage by Age in Naselle
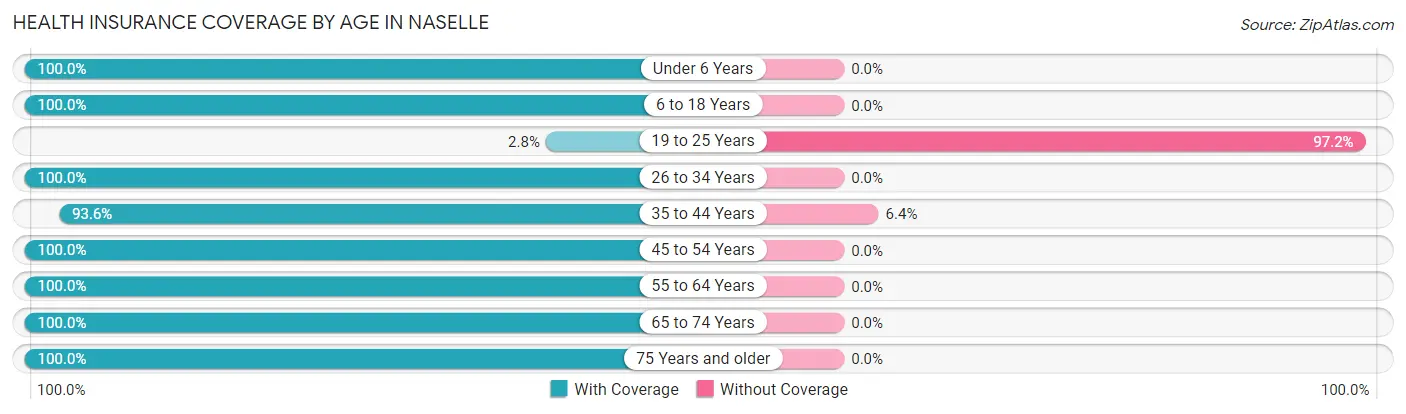
| Age Bracket | With Coverage | Without Coverage |
| Under 6 Years | 16 (100.0%) | 0 (0.0%) |
| 6 to 18 Years | 175 (100.0%) | 0 (0.0%) |
| 19 to 25 Years | 2 (2.8%) | 69 (97.2%) |
| 26 to 34 Years | 33 (100.0%) | 0 (0.0%) |
| 35 to 44 Years | 73 (93.6%) | 5 (6.4%) |
| 45 to 54 Years | 129 (100.0%) | 0 (0.0%) |
| 55 to 64 Years | 51 (100.0%) | 0 (0.0%) |
| 65 to 74 Years | 57 (100.0%) | 0 (0.0%) |
| 75 Years and older | 19 (100.0%) | 0 (0.0%) |
| Total | 555 (88.2%) | 74 (11.8%) |
Health Insurance Coverage by Citizenship Status in Naselle
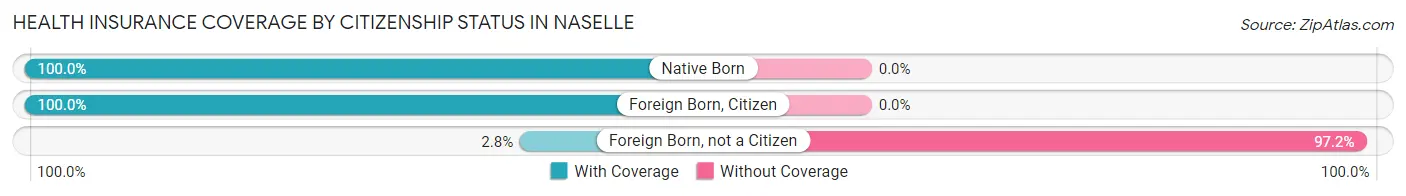
| Citizenship Status | With Coverage | Without Coverage |
| Native Born | 16 (100.0%) | 0 (0.0%) |
| Foreign Born, Citizen | 175 (100.0%) | 0 (0.0%) |
| Foreign Born, not a Citizen | 2 (2.8%) | 69 (97.2%) |
Health Insurance Coverage by Household Income in Naselle
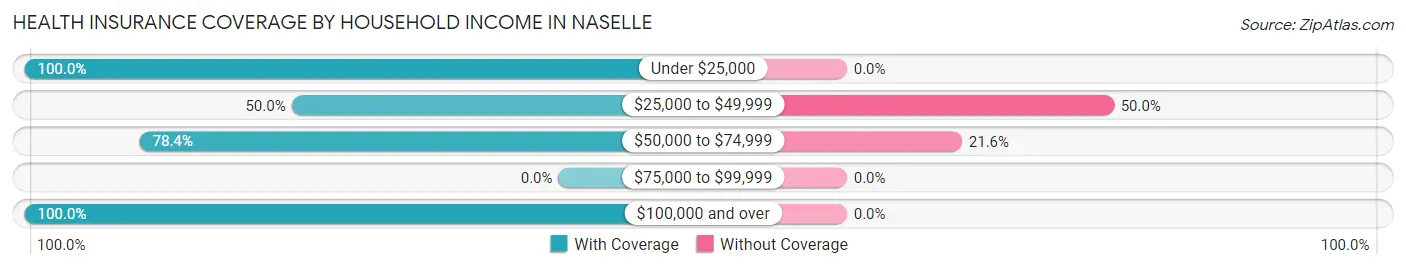
| Household Income | With Coverage | Without Coverage |
| Under $25,000 | 101 (100.0%) | 0 (0.0%) |
| $25,000 to $49,999 | 5 (50.0%) | 5 (50.0%) |
| $50,000 to $74,999 | 251 (78.4%) | 69 (21.6%) |
| $75,000 to $99,999 | 0 (0.0%) | 0 (0.0%) |
| $100,000 and over | 198 (100.0%) | 0 (0.0%) |
Public vs Private Health Insurance Coverage by Age in Naselle
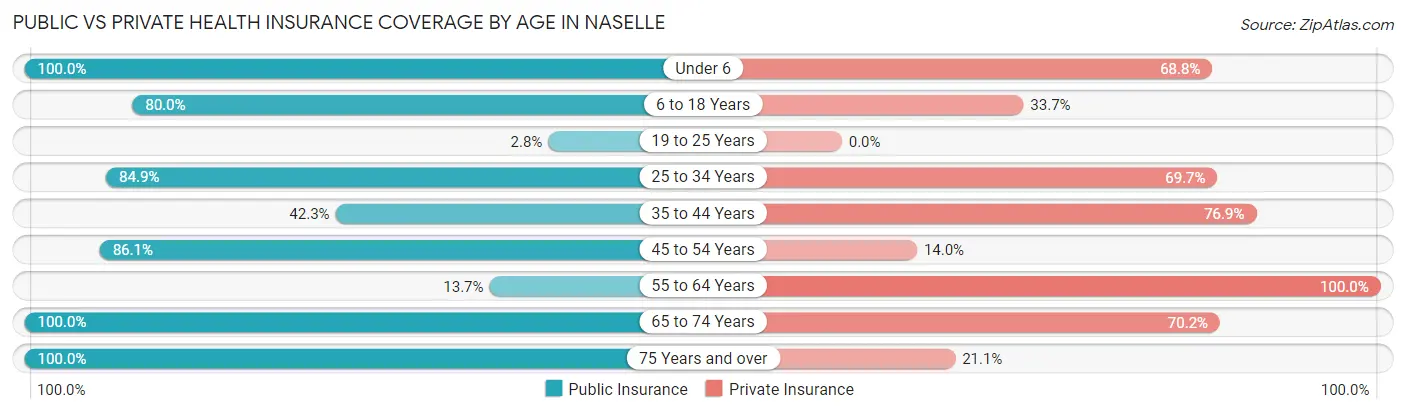
| Age Bracket | Public Insurance | Private Insurance |
| Under 6 | 16 (100.0%) | 11 (68.8%) |
| 6 to 18 Years | 140 (80.0%) | 59 (33.7%) |
| 19 to 25 Years | 2 (2.8%) | 0 (0.0%) |
| 25 to 34 Years | 28 (84.9%) | 23 (69.7%) |
| 35 to 44 Years | 33 (42.3%) | 60 (76.9%) |
| 45 to 54 Years | 111 (86.1%) | 18 (14.0%) |
| 55 to 64 Years | 7 (13.7%) | 51 (100.0%) |
| 65 to 74 Years | 57 (100.0%) | 40 (70.2%) |
| 75 Years and over | 19 (100.0%) | 4 (21.0%) |
| Total | 413 (65.7%) | 266 (42.3%) |
Disability Status by Sex by Age in Naselle
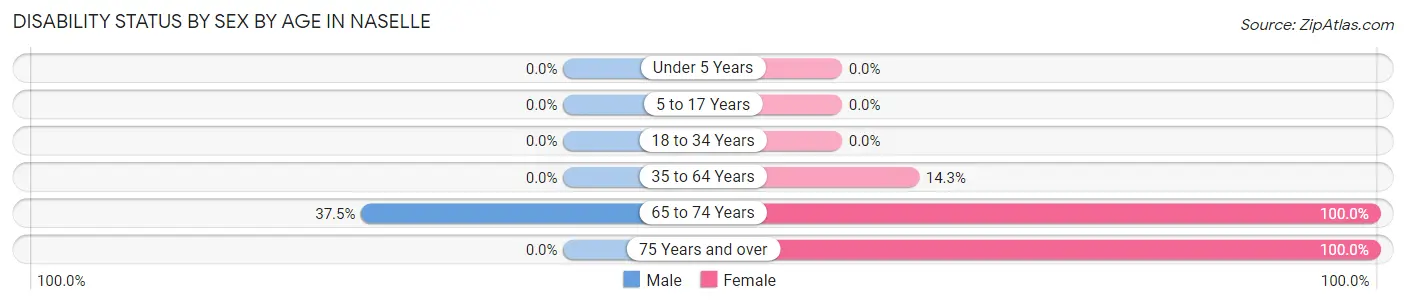
| Age Bracket | Male | Female |
| Under 5 Years | 0 (0.0%) | 0 (0.0%) |
| 5 to 17 Years | 0 (0.0%) | 0 (0.0%) |
| 18 to 34 Years | 0 (0.0%) | 0 (0.0%) |
| 35 to 64 Years | 0 (0.0%) | 13 (14.3%) |
| 65 to 74 Years | 9 (37.5%) | 33 (100.0%) |
| 75 Years and over | 0 (0.0%) | 15 (100.0%) |
Disability Class by Sex by Age in Naselle
Disability Class: Hearing Difficulty
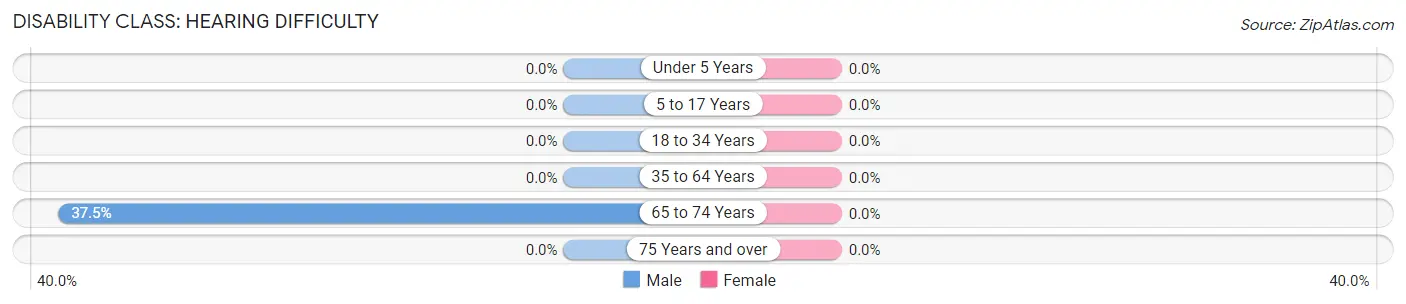
| Age Bracket | Male | Female |
| Under 5 Years | 0 (0.0%) | 0 (0.0%) |
| 5 to 17 Years | 0 (0.0%) | 0 (0.0%) |
| 18 to 34 Years | 0 (0.0%) | 0 (0.0%) |
| 35 to 64 Years | 0 (0.0%) | 0 (0.0%) |
| 65 to 74 Years | 9 (37.5%) | 0 (0.0%) |
| 75 Years and over | 0 (0.0%) | 0 (0.0%) |
Disability Class: Vision Difficulty
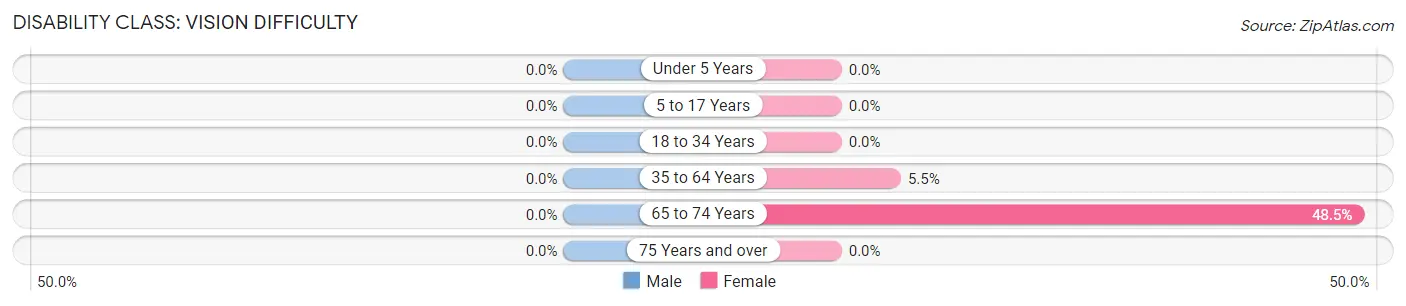
| Age Bracket | Male | Female |
| Under 5 Years | 0 (0.0%) | 0 (0.0%) |
| 5 to 17 Years | 0 (0.0%) | 0 (0.0%) |
| 18 to 34 Years | 0 (0.0%) | 0 (0.0%) |
| 35 to 64 Years | 0 (0.0%) | 5 (5.5%) |
| 65 to 74 Years | 0 (0.0%) | 16 (48.5%) |
| 75 Years and over | 0 (0.0%) | 0 (0.0%) |
Disability Class: Cognitive Difficulty
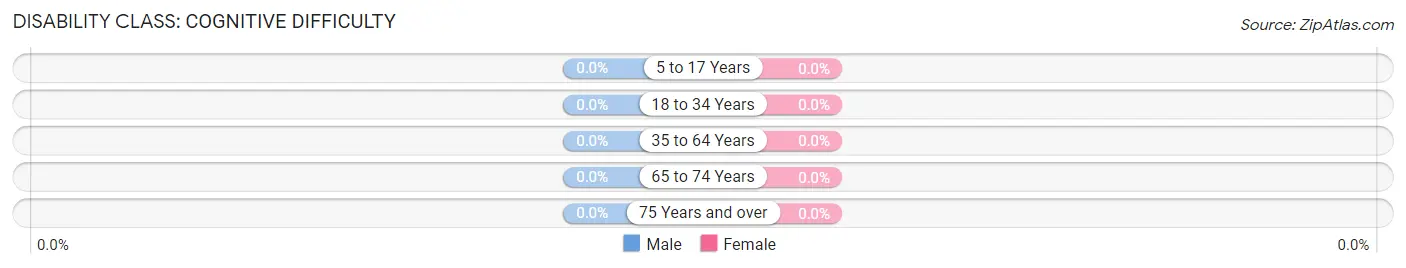
| Age Bracket | Male | Female |
| 5 to 17 Years | 0 (0.0%) | 0 (0.0%) |
| 18 to 34 Years | 0 (0.0%) | 0 (0.0%) |
| 35 to 64 Years | 0 (0.0%) | 0 (0.0%) |
| 65 to 74 Years | 0 (0.0%) | 0 (0.0%) |
| 75 Years and over | 0 (0.0%) | 0 (0.0%) |
Disability Class: Ambulatory Difficulty
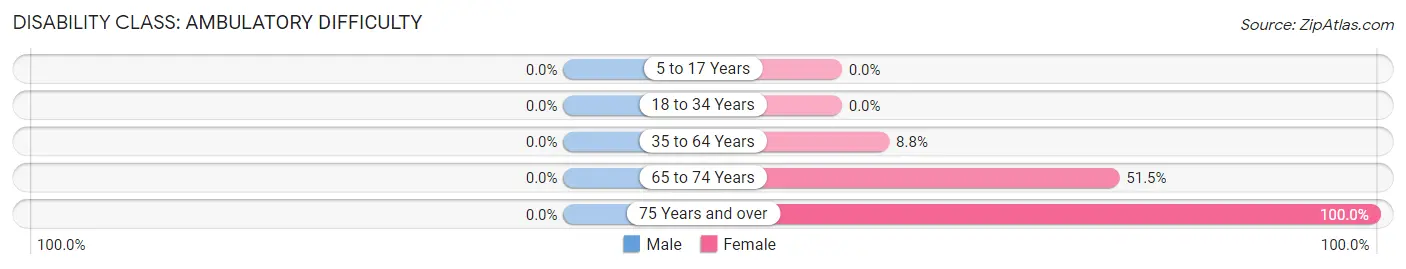
| Age Bracket | Male | Female |
| 5 to 17 Years | 0 (0.0%) | 0 (0.0%) |
| 18 to 34 Years | 0 (0.0%) | 0 (0.0%) |
| 35 to 64 Years | 0 (0.0%) | 8 (8.8%) |
| 65 to 74 Years | 0 (0.0%) | 17 (51.5%) |
| 75 Years and over | 0 (0.0%) | 15 (100.0%) |
Disability Class: Self-Care Difficulty
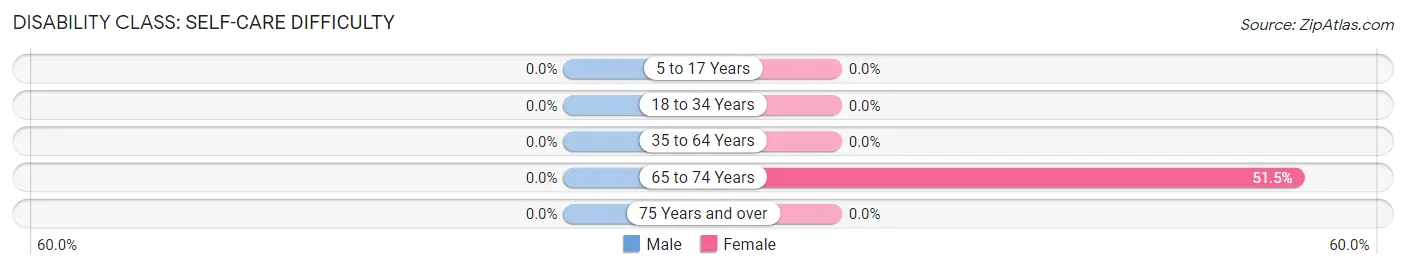
| Age Bracket | Male | Female |
| 5 to 17 Years | 0 (0.0%) | 0 (0.0%) |
| 18 to 34 Years | 0 (0.0%) | 0 (0.0%) |
| 35 to 64 Years | 0 (0.0%) | 0 (0.0%) |
| 65 to 74 Years | 0 (0.0%) | 17 (51.5%) |
| 75 Years and over | 0 (0.0%) | 0 (0.0%) |
Technology Access in Naselle
Computing Device Access in Naselle
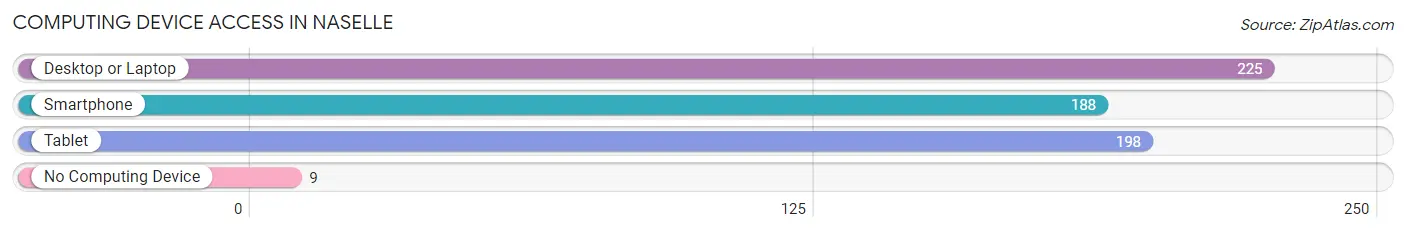
| Device Type | # Households | % Households |
| Desktop or Laptop | 225 | 90.4% |
| Smartphone | 188 | 75.5% |
| Tablet | 198 | 79.5% |
| No Computing Device | 9 | 3.6% |
| Total | 249 | 100.0% |
Internet Access in Naselle
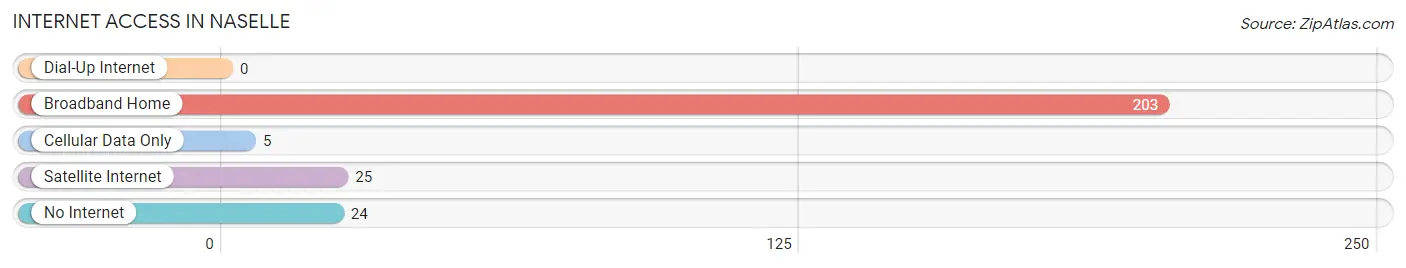
| Internet Type | # Households | % Households |
| Dial-Up Internet | 0 | 0.0% |
| Broadband Home | 203 | 81.5% |
| Cellular Data Only | 5 | 2.0% |
| Satellite Internet | 25 | 10.0% |
| No Internet | 24 | 9.6% |
| Total | 249 | 100.0% |
Naselle Summary
Naselle is a small town located in the southwestern corner of Washington State, in Pacific County. It is situated on the Naselle River, which flows into the Pacific Ocean. The town has a population of approximately 1,000 people and is known for its rural charm and natural beauty.
History
The area that is now Naselle was first inhabited by the Chinook Indians, who lived in the area for thousands of years before the arrival of European settlers. The first Europeans to settle in the area were Finnish immigrants, who arrived in the late 1800s. The town was officially founded in 1891 and was named after the Naselle River.
In the early 1900s, Naselle was a thriving logging and fishing community. The town was home to several sawmills and canneries, and the local economy was largely dependent on the timber and fishing industries. The town also had a thriving shipbuilding industry, and several ships were built in the area.
In the 1950s, the timber industry began to decline, and the local economy shifted to focus on agriculture. The town is now home to several farms, and the local economy is largely dependent on the agricultural industry.
Geography
Naselle is located in the southwestern corner of Washington State, in Pacific County. It is situated on the Naselle River, which flows into the Pacific Ocean. The town is surrounded by lush forests and rolling hills, and is known for its rural charm and natural beauty.
The town is located approximately 30 miles from the state capital of Olympia, and is within easy driving distance of the cities of Longview, Astoria, and Portland, Oregon.
Economy
The local economy of Naselle is largely dependent on the agricultural industry. The town is home to several farms, and the local economy is largely dependent on the production of dairy, beef, and poultry products.
The town is also home to several small businesses, including restaurants, retail stores, and service providers. The town is also home to a small port, which is used for shipping and receiving goods.
Demographics
As of the 2010 census, the population of Naselle was 1,039. The town is predominantly white, with approximately 95% of the population identifying as Caucasian. The town also has a small Hispanic population, with approximately 4% of the population identifying as Hispanic or Latino.
The median household income in Naselle is $41,250, and the median home value is $133,000. The town has a high rate of homeownership, with approximately 75% of the population owning their own homes.
Conclusion
Naselle is a small town located in the southwestern corner of Washington State, in Pacific County. It is situated on the Naselle River, which flows into the Pacific Ocean. The town has a population of approximately 1,000 people and is known for its rural charm and natural beauty. The local economy of Naselle is largely dependent on the agricultural industry, and the town is home to several farms. The town is predominantly white, with approximately 95% of the population identifying as Caucasian. The median household income in Naselle is $41,250, and the median home value is $133,000.
Common Questions
What is Per Capita Income in Naselle?
Per Capita income in Naselle is $22,935.
What is the Median Family Income in Naselle?
Median Family Income in Naselle is $57,052.
What is the Median Household income in Naselle?
Median Household Income in Naselle is $56,188.
What is Income or Wage Gap in Naselle?
Income or Wage Gap in Naselle is 47.9%.
Women in Naselle earn 52.1 cents for every dollar earned by a man.
What is Inequality or Gini Index in Naselle?
Inequality or Gini Index in Naselle is 0.34.
What is the Total Population of Naselle?
Total Population of Naselle is 629.
What is the Total Male Population of Naselle?
Total Male Population of Naselle is 402.
What is the Total Female Population of Naselle?
Total Female Population of Naselle is 227.
What is the Ratio of Males per 100 Females in Naselle?
There are 177.09 Males per 100 Females in Naselle.
What is the Ratio of Females per 100 Males in Naselle?
There are 56.47 Females per 100 Males in Naselle.
What is the Median Population Age in Naselle?
Median Population Age in Naselle is 36.9 Years.
What is the Average Family Size in Naselle
Average Family Size in Naselle is 3.1 People.
What is the Average Household Size in Naselle
Average Household Size in Naselle is 2.5 People.
How Large is the Labor Force in Naselle?
There are 327 People in the Labor Forcein in Naselle.
What is the Percentage of People in the Labor Force in Naselle?
67.8% of People are in the Labor Force in Naselle.