Clear Lake CDP Pierce County, WA Map & Demographics
Clear Lake CDP Pierce County Overview
$43,992
PER CAPITA INCOME
$113,828
AVG FAMILY INCOME
$94,755
AVG HOUSEHOLD INCOME
30.2%
WAGE / INCOME GAP [ % ]
69.8¢/ $1
WAGE / INCOME GAP [ $ ]
0.27
INEQUALITY / GINI INDEX
1,157
TOTAL POPULATION
584
MALE POPULATION
573
FEMALE POPULATION
101.92
MALES / 100 FEMALES
98.12
FEMALES / 100 MALES
45.0
MEDIAN AGE
3.0
AVG FAMILY SIZE
2.4
AVG HOUSEHOLD SIZE
585
LABOR FORCE [ PEOPLE ]
65.0%
PERCENT IN LABOR FORCE
6.0%
UNEMPLOYMENT RATE
Income in Clear Lake CDP Pierce County
Income Overview in Clear Lake CDP Pierce County
Per Capita Income in Clear Lake CDP Pierce County is $43,992, while median incomes of families and households are $113,828 and $94,755 respectively.
| Characteristic | Number | Measure |
| Per Capita Income | 1,157 | $43,992 |
| Median Family Income | 327 | $113,828 |
| Mean Family Income | 327 | $124,849 |
| Median Household Income | 476 | $94,755 |
| Mean Household Income | 476 | $106,506 |
| Income Deficit | 327 | $0 |
| Wage / Income Gap (%) | 1,157 | 30.16% |
| Wage / Income Gap ($) | 1,157 | 69.84¢ per $1 |
| Gini / Inequality Index | 1,157 | 0.27 |
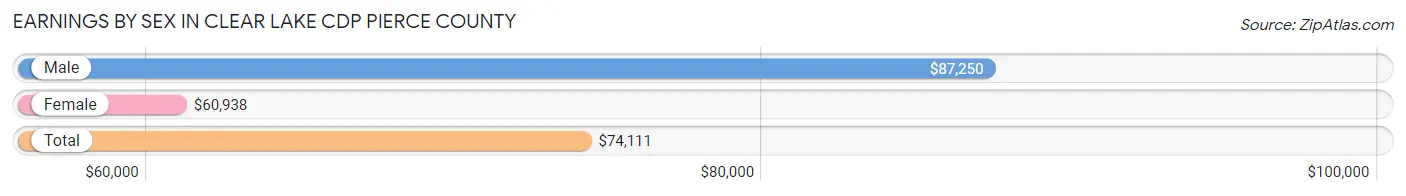
Earnings by Sex in Clear Lake CDP Pierce County
Average Earnings in Clear Lake CDP Pierce County are $74,111, $87,250 for men and $60,938 for women, a difference of 30.2%.
| Sex | Number | Average Earnings |
| Male | 279 (50.2%) | $87,250 |
| Female | 277 (49.8%) | $60,938 |
| Total | 556 (100.0%) | $74,111 |
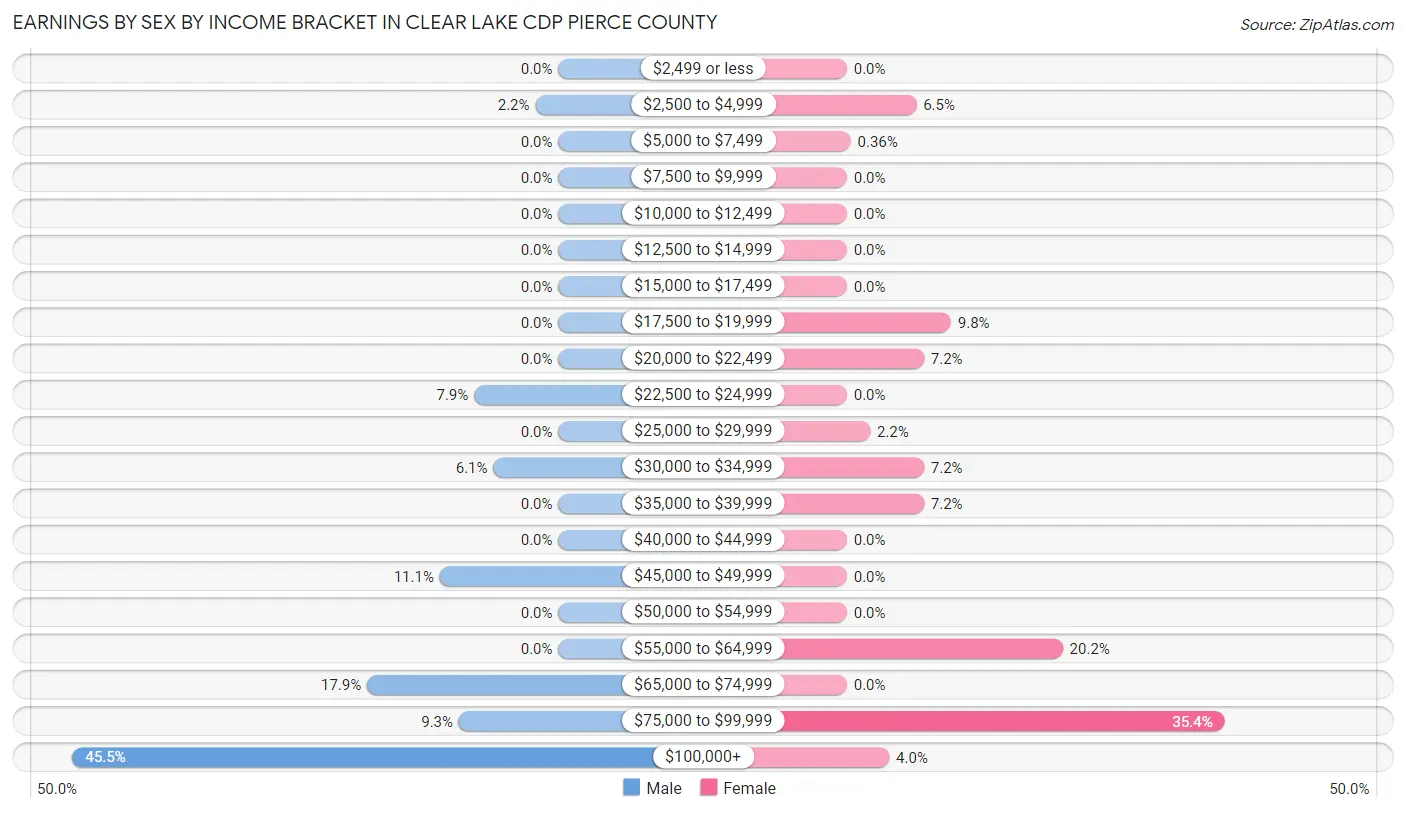
Earnings by Sex by Income Bracket in Clear Lake CDP Pierce County
The most common earnings brackets in Clear Lake CDP Pierce County are $100,000+ for men (127 | 45.5%) and $75,000 to $99,999 for women (98 | 35.4%).
| Income | Male | Female |
| $2,499 or less | 0 (0.0%) | 0 (0.0%) |
| $2,500 to $4,999 | 6 (2.1%) | 18 (6.5%) |
| $5,000 to $7,499 | 0 (0.0%) | 1 (0.4%) |
| $7,500 to $9,999 | 0 (0.0%) | 0 (0.0%) |
| $10,000 to $12,499 | 0 (0.0%) | 0 (0.0%) |
| $12,500 to $14,999 | 0 (0.0%) | 0 (0.0%) |
| $15,000 to $17,499 | 0 (0.0%) | 0 (0.0%) |
| $17,500 to $19,999 | 0 (0.0%) | 27 (9.8%) |
| $20,000 to $22,499 | 0 (0.0%) | 20 (7.2%) |
| $22,500 to $24,999 | 22 (7.9%) | 0 (0.0%) |
| $25,000 to $29,999 | 0 (0.0%) | 6 (2.2%) |
| $30,000 to $34,999 | 17 (6.1%) | 20 (7.2%) |
| $35,000 to $39,999 | 0 (0.0%) | 20 (7.2%) |
| $40,000 to $44,999 | 0 (0.0%) | 0 (0.0%) |
| $45,000 to $49,999 | 31 (11.1%) | 0 (0.0%) |
| $50,000 to $54,999 | 0 (0.0%) | 0 (0.0%) |
| $55,000 to $64,999 | 0 (0.0%) | 56 (20.2%) |
| $65,000 to $74,999 | 50 (17.9%) | 0 (0.0%) |
| $75,000 to $99,999 | 26 (9.3%) | 98 (35.4%) |
| $100,000+ | 127 (45.5%) | 11 (4.0%) |
| Total | 279 (100.0%) | 277 (100.0%) |
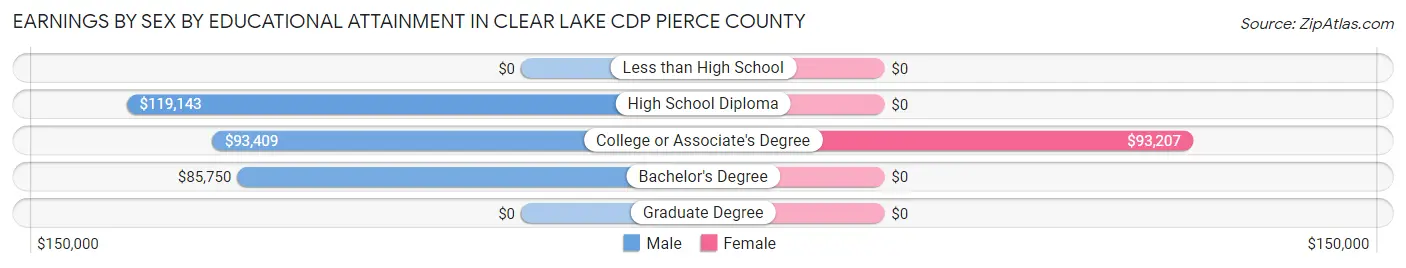
Earnings by Sex by Educational Attainment in Clear Lake CDP Pierce County
Average earnings in Clear Lake CDP Pierce County are $100,298 for men and $64,148 for women, a difference of 36.0%. Men with an educational attainment of high school diploma enjoy the highest average annual earnings of $119,143, while those with bachelor's degree education earn the least with $85,750. Women with an educational attainment of college or associate's degree earn the most with the average annual earnings of $93,207, while those with college or associate's degree education have the smallest earnings of $93,207.
| Educational Attainment | Male Income | Female Income |
| Less than High School | - | - |
| High School Diploma | $119,143 | $0 |
| College or Associate's Degree | $93,409 | $93,207 |
| Bachelor's Degree | $85,750 | $0 |
| Graduate Degree | - | - |
| Total | $100,298 | $64,148 |
Family Income in Clear Lake CDP Pierce County
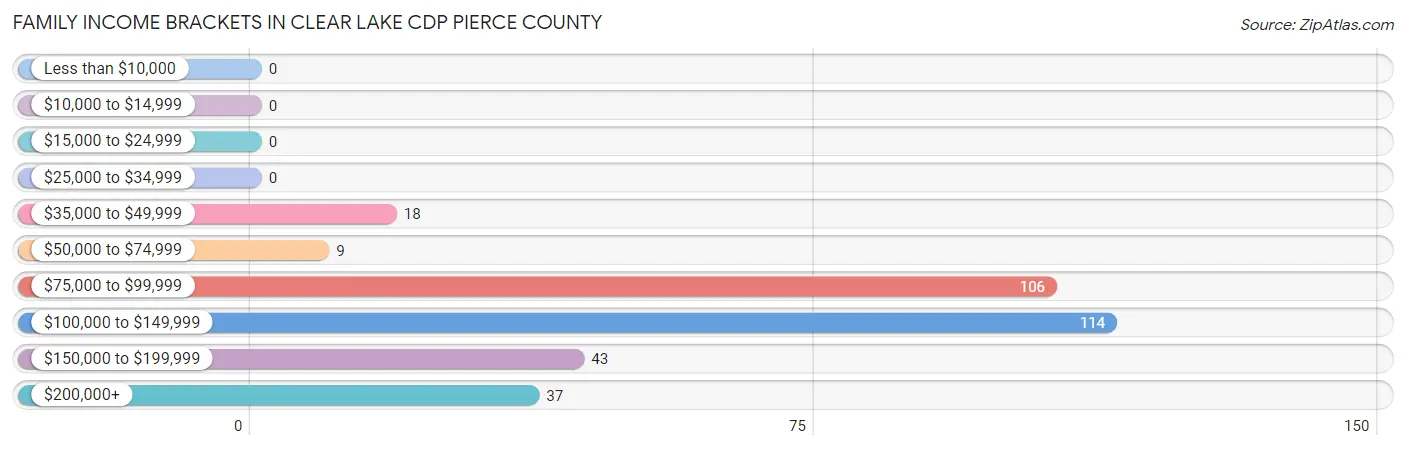
Family Income Brackets in Clear Lake CDP Pierce County
According to the Clear Lake CDP Pierce County family income data, there are 114 families falling into the $100,000 to $149,999 income range, which is the most common income bracket and makes up 34.9% of all families.
| Income Bracket | # Families | % Families |
| Less than $10,000 | 0 | 0.0% |
| $10,000 to $14,999 | 0 | 0.0% |
| $15,000 to $24,999 | 0 | 0.0% |
| $25,000 to $34,999 | 0 | 0.0% |
| $35,000 to $49,999 | 18 | 5.5% |
| $50,000 to $74,999 | 9 | 2.8% |
| $75,000 to $99,999 | 106 | 32.4% |
| $100,000 to $149,999 | 114 | 34.9% |
| $150,000 to $199,999 | 43 | 13.1% |
| $200,000+ | 37 | 11.3% |
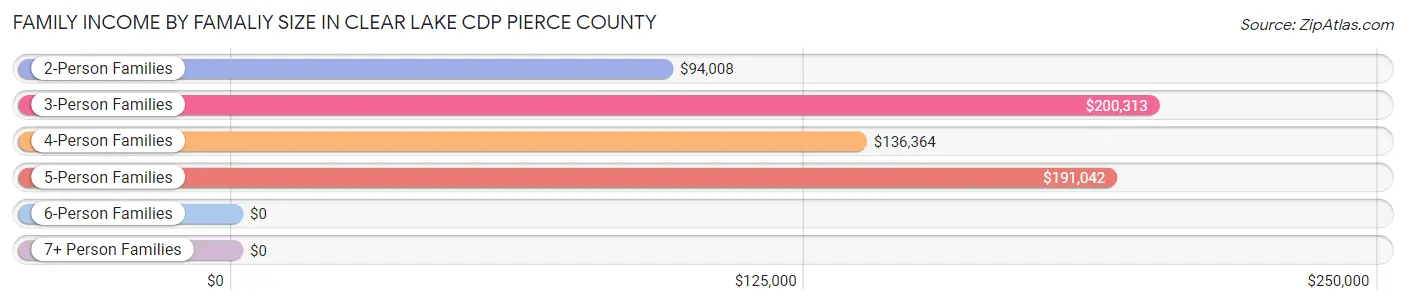
Family Income by Famaliy Size in Clear Lake CDP Pierce County
3-person families (43 | 13.2%) account for the highest median family income in Clear Lake CDP Pierce County with $200,313 per family, while 3-person families (43 | 13.2%) have the highest median income of $66,771 per family member.
| Income Bracket | # Families | Median Income |
| 2-Person Families | 183 (56.0%) | $94,008 |
| 3-Person Families | 43 (13.2%) | $200,313 |
| 4-Person Families | 42 (12.8%) | $136,364 |
| 5-Person Families | 35 (10.7%) | $191,042 |
| 6-Person Families | 19 (5.8%) | $0 |
| 7+ Person Families | 5 (1.5%) | $0 |
| Total | 327 (100.0%) | $113,828 |
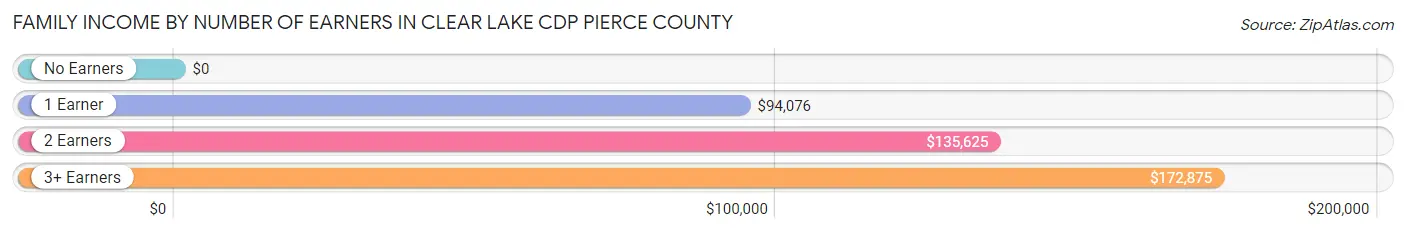
Family Income by Number of Earners in Clear Lake CDP Pierce County
| Number of Earners | # Families | Median Income |
| No Earners | 40 (12.2%) | $0 |
| 1 Earner | 134 (41.0%) | $94,076 |
| 2 Earners | 107 (32.7%) | $135,625 |
| 3+ Earners | 46 (14.1%) | $172,875 |
| Total | 327 (100.0%) | $113,828 |
Household Income in Clear Lake CDP Pierce County
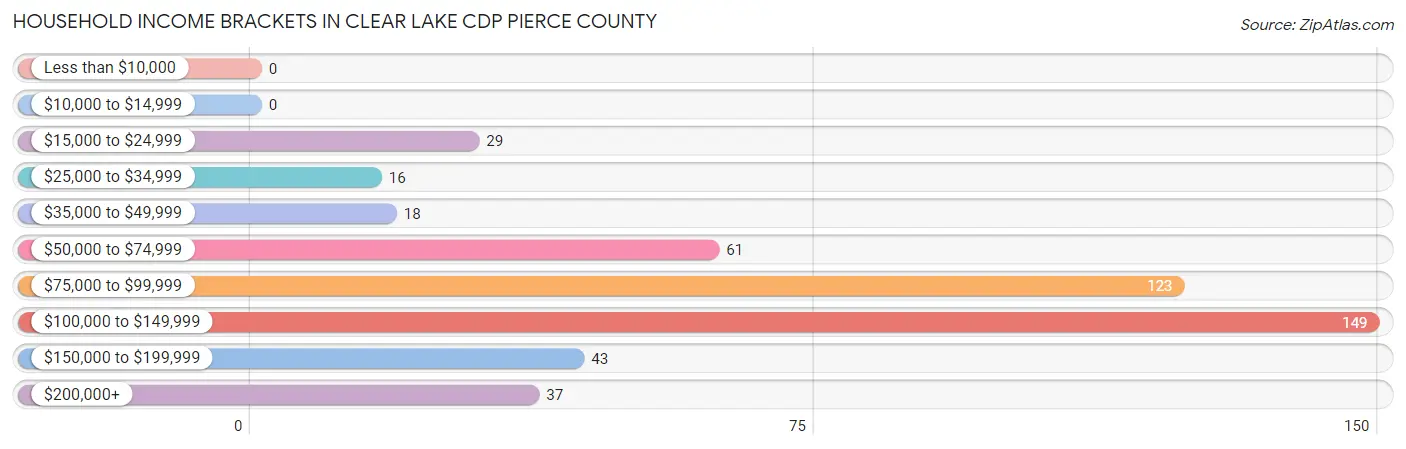
Household Income Brackets in Clear Lake CDP Pierce County
With 149 households falling in the category, the $100,000 to $149,999 income range is the most frequent in Clear Lake CDP Pierce County, accounting for 31.3% of all households.
| Income Bracket | # Households | % Households |
| Less than $10,000 | 0 | 0.0% |
| $10,000 to $14,999 | 0 | 0.0% |
| $15,000 to $24,999 | 29 | 6.1% |
| $25,000 to $34,999 | 16 | 3.4% |
| $35,000 to $49,999 | 18 | 3.8% |
| $50,000 to $74,999 | 61 | 12.8% |
| $75,000 to $99,999 | 123 | 25.8% |
| $100,000 to $149,999 | 149 | 31.3% |
| $150,000 to $199,999 | 43 | 9.0% |
| $200,000+ | 37 | 7.8% |
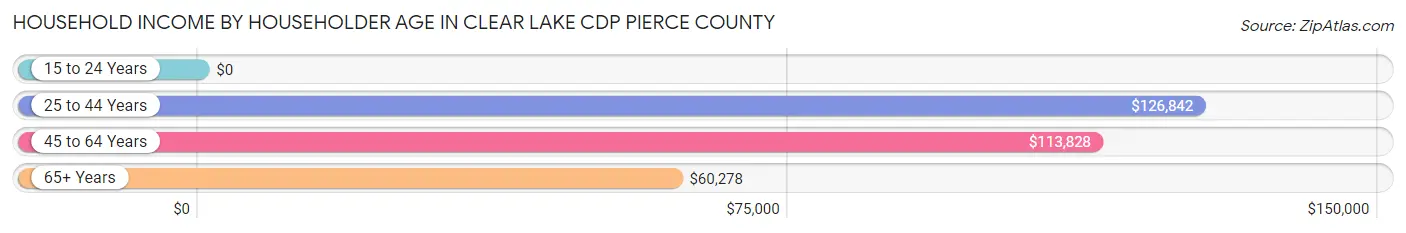
Household Income by Householder Age in Clear Lake CDP Pierce County
The median household income in Clear Lake CDP Pierce County is $94,755, with the highest median household income of $126,842 found in the 25 to 44 years age bracket for the primary householder. A total of 72 households (15.1%) fall into this category. Meanwhile, the 15 to 24 years age bracket for the primary householder has the lowest median household income of $0, with 7 households (1.5%) in this group.
| Income Bracket | # Households | Median Income |
| 15 to 24 Years | 7 (1.5%) | $0 |
| 25 to 44 Years | 72 (15.1%) | $126,842 |
| 45 to 64 Years | 263 (55.2%) | $113,828 |
| 65+ Years | 134 (28.1%) | $60,278 |
| Total | 476 (100.0%) | $94,755 |
Poverty in Clear Lake CDP Pierce County
Income Below Poverty by Sex and Age in Clear Lake CDP Pierce County
With 0.2% poverty level for males and 0.5% for females among the residents of Clear Lake CDP Pierce County, 45 to 54 year old males and 35 to 44 year old females are the most vulnerable to poverty, with 1 males (0.9%) and 1 females (2.3%) in their respective age groups living below the poverty level.
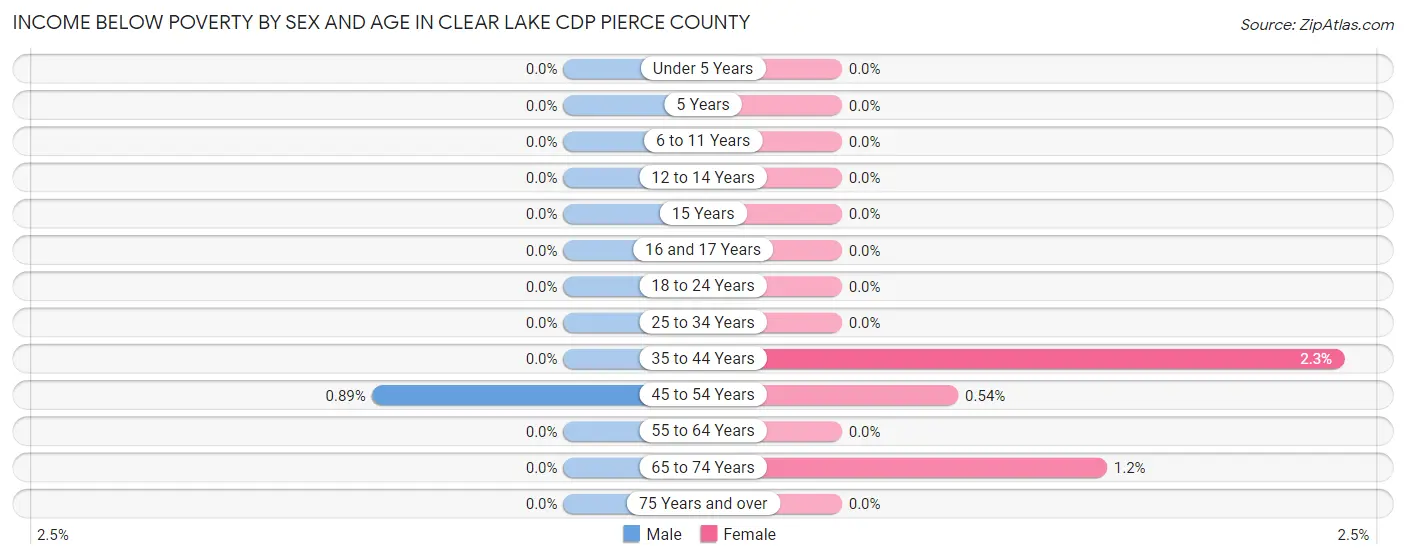
| Age Bracket | Male | Female |
| Under 5 Years | 0 (0.0%) | 0 (0.0%) |
| 5 Years | 0 (0.0%) | 0 (0.0%) |
| 6 to 11 Years | 0 (0.0%) | 0 (0.0%) |
| 12 to 14 Years | 0 (0.0%) | 0 (0.0%) |
| 15 Years | 0 (0.0%) | 0 (0.0%) |
| 16 and 17 Years | 0 (0.0%) | 0 (0.0%) |
| 18 to 24 Years | 0 (0.0%) | 0 (0.0%) |
| 25 to 34 Years | 0 (0.0%) | 0 (0.0%) |
| 35 to 44 Years | 0 (0.0%) | 1 (2.3%) |
| 45 to 54 Years | 1 (0.9%) | 1 (0.5%) |
| 55 to 64 Years | 0 (0.0%) | 0 (0.0%) |
| 65 to 74 Years | 0 (0.0%) | 1 (1.2%) |
| 75 Years and over | 0 (0.0%) | 0 (0.0%) |
| Total | 1 (0.2%) | 3 (0.5%) |
Income Above Poverty by Sex and Age in Clear Lake CDP Pierce County
According to the poverty statistics in Clear Lake CDP Pierce County, males aged under 5 years and females aged under 5 years are the age groups that are most secure financially, with 100.0% of males and 100.0% of females in these age groups living above the poverty line.
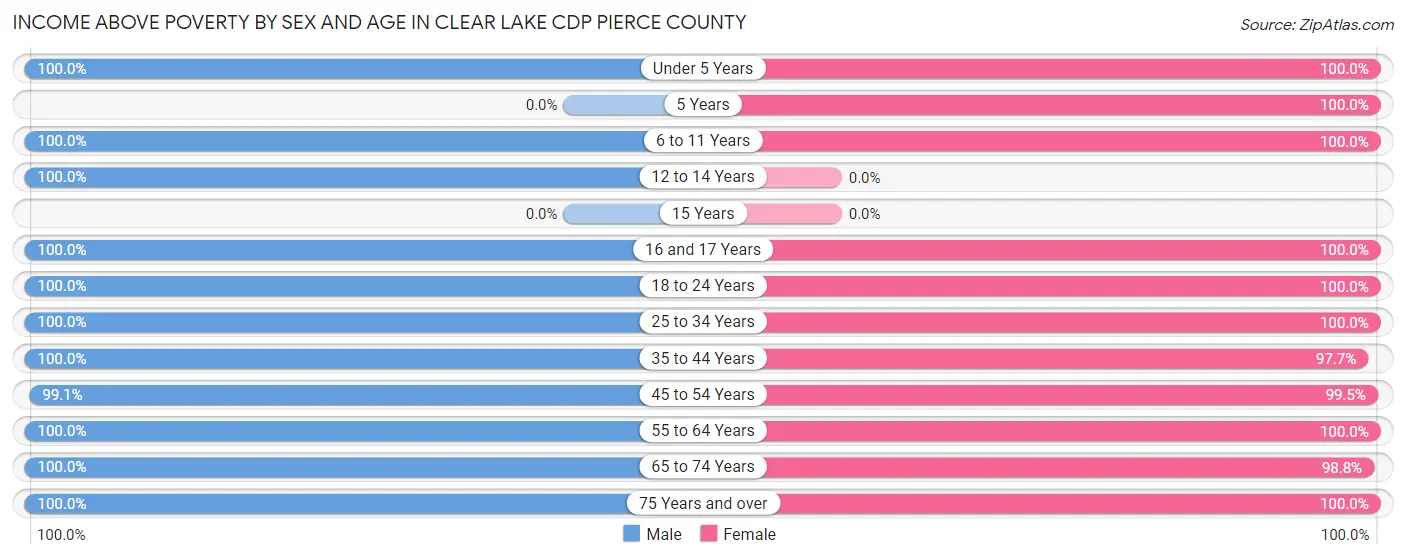
| Age Bracket | Male | Female |
| Under 5 Years | 27 (100.0%) | 24 (100.0%) |
| 5 Years | 0 (0.0%) | 5 (100.0%) |
| 6 to 11 Years | 127 (100.0%) | 40 (100.0%) |
| 12 to 14 Years | 34 (100.0%) | 0 (0.0%) |
| 15 Years | 0 (0.0%) | 0 (0.0%) |
| 16 and 17 Years | 23 (100.0%) | 30 (100.0%) |
| 18 to 24 Years | 40 (100.0%) | 56 (100.0%) |
| 25 to 34 Years | 47 (100.0%) | 25 (100.0%) |
| 35 to 44 Years | 58 (100.0%) | 42 (97.7%) |
| 45 to 54 Years | 111 (99.1%) | 183 (99.5%) |
| 55 to 64 Years | 68 (100.0%) | 28 (100.0%) |
| 65 to 74 Years | 39 (100.0%) | 80 (98.8%) |
| 75 Years and over | 9 (100.0%) | 57 (100.0%) |
| Total | 583 (99.8%) | 570 (99.5%) |
Income Below Poverty Among Married-Couple Families in Clear Lake CDP Pierce County
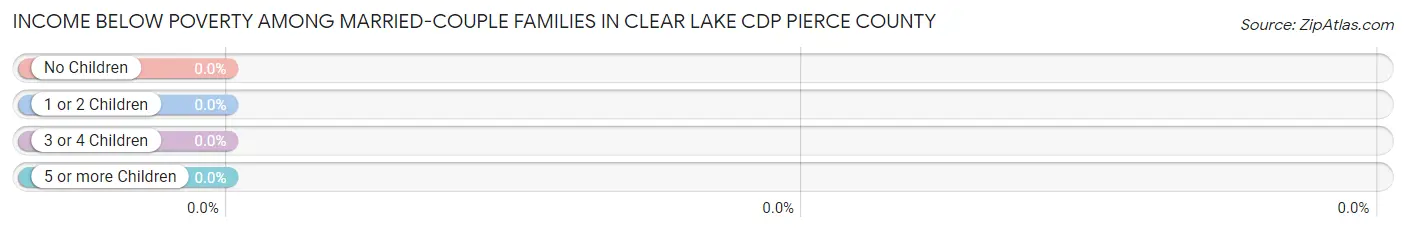
| Children | Above Poverty | Below Poverty |
| No Children | 123 (100.0%) | 0 (0.0%) |
| 1 or 2 Children | 70 (100.0%) | 0 (0.0%) |
| 3 or 4 Children | 33 (100.0%) | 0 (0.0%) |
| 5 or more Children | 0 (0.0%) | 0 (0.0%) |
| Total | 226 (100.0%) | 0 (0.0%) |
Income Below Poverty Among Single-Parent Households in Clear Lake CDP Pierce County
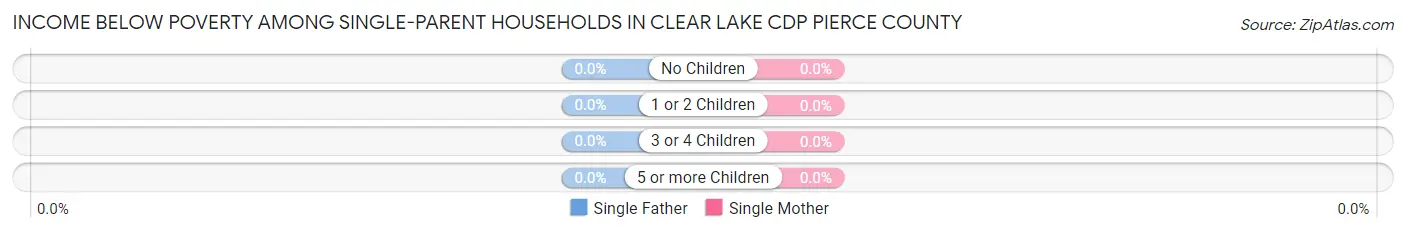
| Children | Single Father | Single Mother |
| No Children | 0 (0.0%) | 0 (0.0%) |
| 1 or 2 Children | 0 (0.0%) | 0 (0.0%) |
| 3 or 4 Children | 0 (0.0%) | 0 (0.0%) |
| 5 or more Children | 0 (0.0%) | 0 (0.0%) |
| Total | 0 (0.0%) | 0 (0.0%) |
Income Below Poverty Among Married-Couple vs Single-Parent Households in Clear Lake CDP Pierce County
| Children | Married-Couple Families | Single-Parent Households |
| No Children | 0 (0.0%) | 0 (0.0%) |
| 1 or 2 Children | 0 (0.0%) | 0 (0.0%) |
| 3 or 4 Children | 0 (0.0%) | 0 (0.0%) |
| 5 or more Children | 0 (0.0%) | 0 (0.0%) |
| Total | 0 (0.0%) | 0 (0.0%) |
Race in Clear Lake CDP Pierce County
The most populous races in Clear Lake CDP Pierce County are White / Caucasian (848 | 73.3%), Some other Race (106 | 9.2%), and Black / African American (92 | 8.0%).
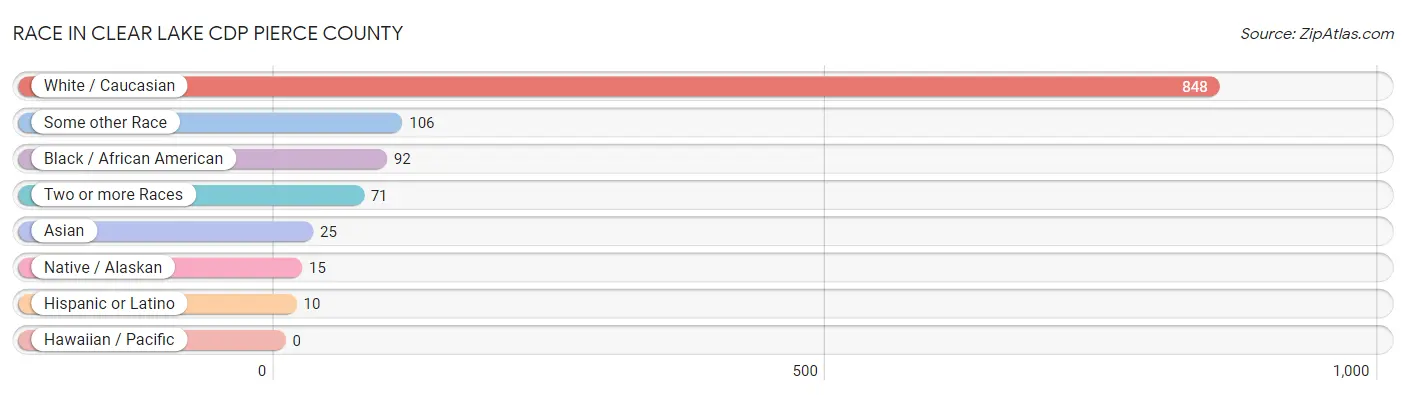
| Race | # Population | % Population |
| Asian | 25 | 2.2% |
| Black / African American | 92 | 8.0% |
| Hawaiian / Pacific | 0 | 0.0% |
| Hispanic or Latino | 10 | 0.9% |
| Native / Alaskan | 15 | 1.3% |
| White / Caucasian | 848 | 73.3% |
| Two or more Races | 71 | 6.1% |
| Some other Race | 106 | 9.2% |
| Total | 1,157 | 100.0% |
Ancestry in Clear Lake CDP Pierce County
The most populous ancestries reported in Clear Lake CDP Pierce County are German (368 | 31.8%), Jamaican (198 | 17.1%), English (130 | 11.2%), Irish (110 | 9.5%), and Scandinavian (94 | 8.1%), together accounting for 77.8% of all Clear Lake CDP Pierce County residents.
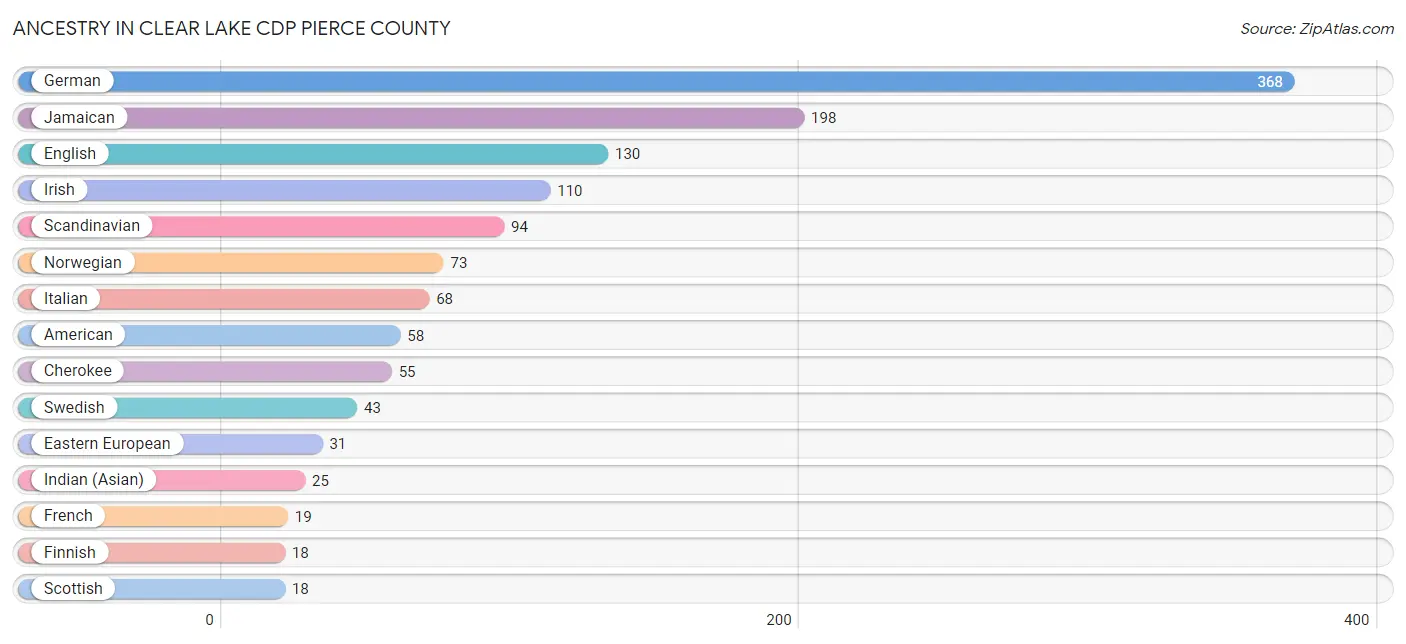
| Ancestry | # Population | % Population |
| American | 58 | 5.0% |
| Arapaho | 11 | 0.9% |
| British | 7 | 0.6% |
| Cherokee | 55 | 4.8% |
| Chickasaw | 10 | 0.9% |
| Eastern European | 31 | 2.7% |
| English | 130 | 11.2% |
| European | 6 | 0.5% |
| Finnish | 18 | 1.6% |
| French | 19 | 1.6% |
| German | 368 | 31.8% |
| Hungarian | 6 | 0.5% |
| Indian (Asian) | 25 | 2.2% |
| Irish | 110 | 9.5% |
| Italian | 68 | 5.9% |
| Jamaican | 198 | 17.1% |
| Norwegian | 73 | 6.3% |
| Polish | 16 | 1.4% |
| Puerto Rican | 10 | 0.9% |
| Puget Sound Salish | 4 | 0.4% |
| Russian | 6 | 0.5% |
| Scandinavian | 94 | 8.1% |
| Scottish | 18 | 1.6% |
| Sri Lankan | 1 | 0.1% |
| Swedish | 43 | 3.7% |
| Swiss | 6 | 0.5% | View All 26 Rows |
Immigrants in Clear Lake CDP Pierce County
The most numerous immigrant groups reported in Clear Lake CDP Pierce County came from Caribbean (92 | 8.0%), Jamaica (92 | 8.0%), Latin America (92 | 8.0%), Asia (25 | 2.2%), and China (24 | 2.1%), together accounting for 28.1% of all Clear Lake CDP Pierce County residents.
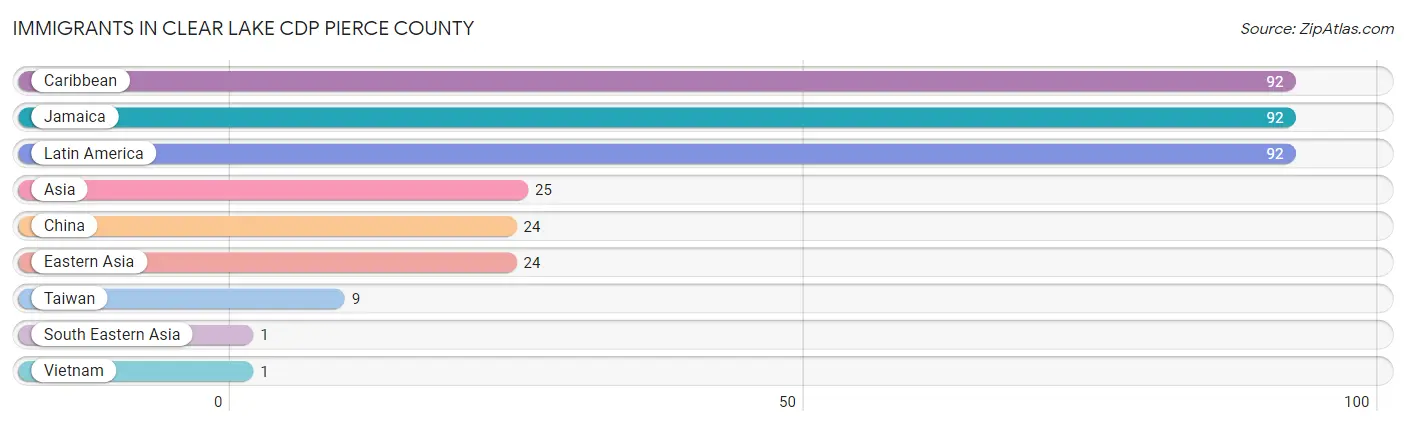
| Immigration Origin | # Population | % Population |
| Asia | 25 | 2.2% |
| Caribbean | 92 | 8.0% |
| China | 24 | 2.1% |
| Eastern Asia | 24 | 2.1% |
| Jamaica | 92 | 8.0% |
| Latin America | 92 | 8.0% |
| South Eastern Asia | 1 | 0.1% |
| Taiwan | 9 | 0.8% |
| Vietnam | 1 | 0.1% | View All 9 Rows |
Sex and Age in Clear Lake CDP Pierce County
Sex and Age in Clear Lake CDP Pierce County
The most populous age groups in Clear Lake CDP Pierce County are 10 to 14 Years (140 | 24.0%) for men and 50 to 54 Years (103 | 18.0%) for women.
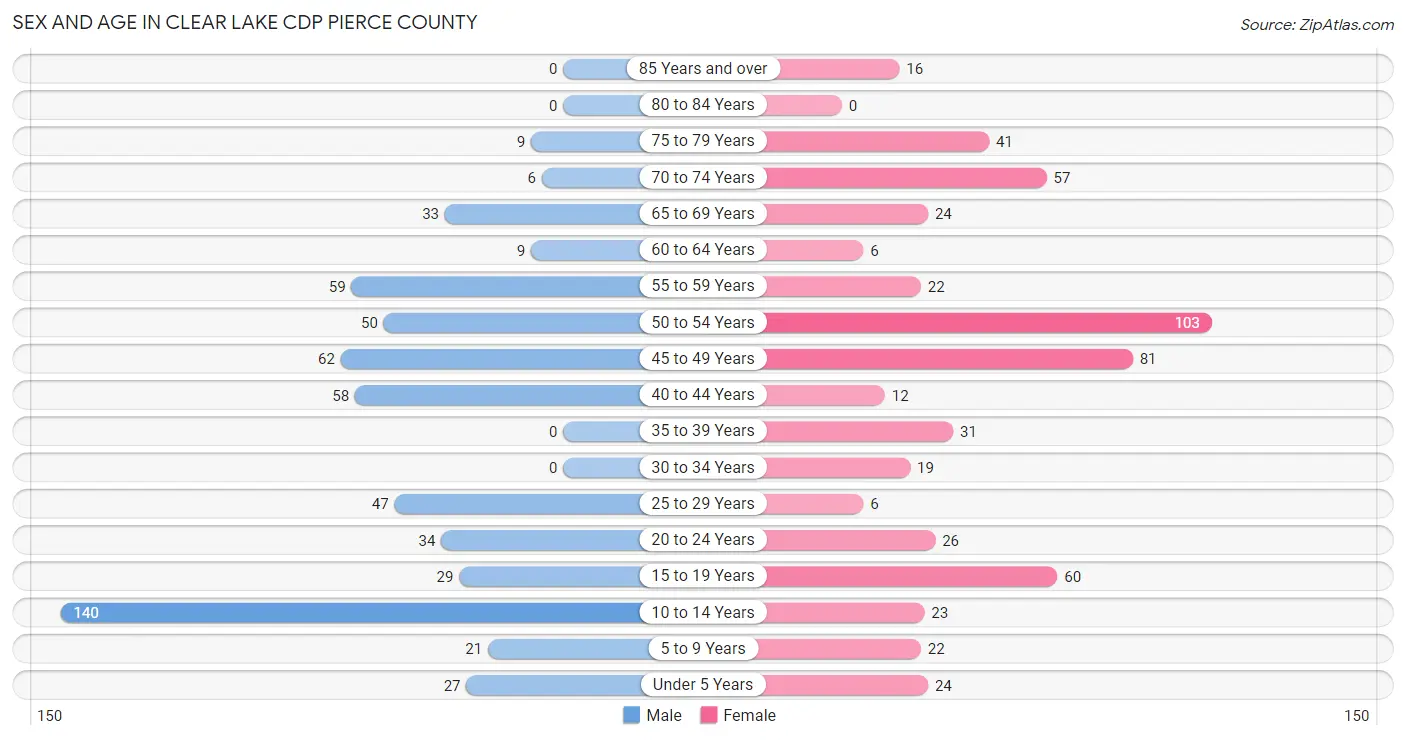
| Age Bracket | Male | Female |
| Under 5 Years | 27 (4.6%) | 24 (4.2%) |
| 5 to 9 Years | 21 (3.6%) | 22 (3.8%) |
| 10 to 14 Years | 140 (24.0%) | 23 (4.0%) |
| 15 to 19 Years | 29 (5.0%) | 60 (10.5%) |
| 20 to 24 Years | 34 (5.8%) | 26 (4.5%) |
| 25 to 29 Years | 47 (8.1%) | 6 (1.1%) |
| 30 to 34 Years | 0 (0.0%) | 19 (3.3%) |
| 35 to 39 Years | 0 (0.0%) | 31 (5.4%) |
| 40 to 44 Years | 58 (9.9%) | 12 (2.1%) |
| 45 to 49 Years | 62 (10.6%) | 81 (14.1%) |
| 50 to 54 Years | 50 (8.6%) | 103 (18.0%) |
| 55 to 59 Years | 59 (10.1%) | 22 (3.8%) |
| 60 to 64 Years | 9 (1.5%) | 6 (1.1%) |
| 65 to 69 Years | 33 (5.7%) | 24 (4.2%) |
| 70 to 74 Years | 6 (1.0%) | 57 (10.0%) |
| 75 to 79 Years | 9 (1.5%) | 41 (7.2%) |
| 80 to 84 Years | 0 (0.0%) | 0 (0.0%) |
| 85 Years and over | 0 (0.0%) | 16 (2.8%) |
| Total | 584 (100.0%) | 573 (100.0%) |
Families and Households in Clear Lake CDP Pierce County
Median Family Size in Clear Lake CDP Pierce County
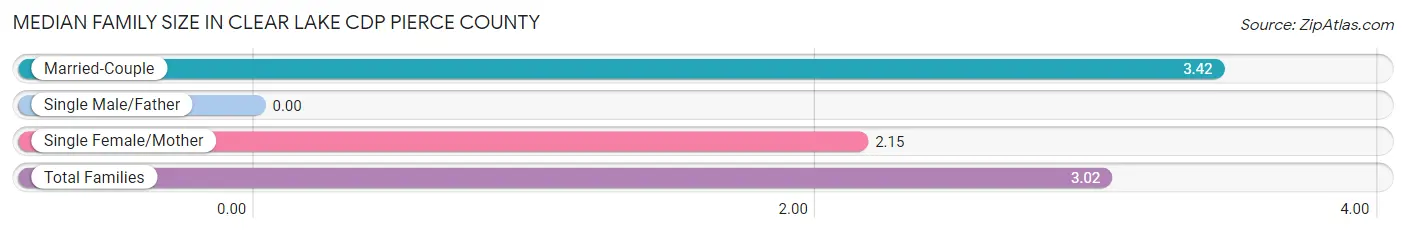
| Family Type | # Families | Family Size |
| Married-Couple | 226 (69.1%) | 3.42 |
| Single Male/Father | 0 (0.0%) | - |
| Single Female/Mother | 101 (30.9%) | 2.15 |
| Total Families | 327 (100.0%) | 3.02 |
Median Household Size in Clear Lake CDP Pierce County
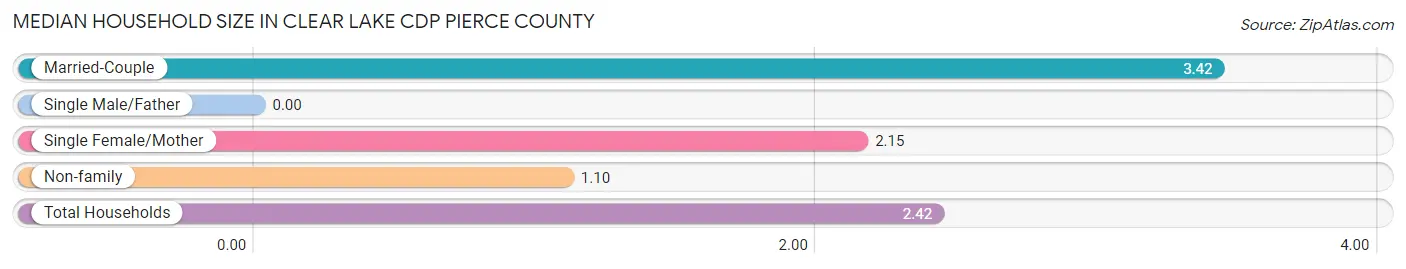
| Household Type | # Households | Household Size |
| Married-Couple | 226 (47.5%) | 3.42 |
| Single Male/Father | 0 (0.0%) | - |
| Single Female/Mother | 101 (21.2%) | 2.15 |
| Non-family | 149 (31.3%) | 1.10 |
| Total Households | 476 (100.0%) | 2.42 |
Household Size by Marriage Status in Clear Lake CDP Pierce County
Out of a total of 476 households in Clear Lake CDP Pierce County, 327 (68.7%) are family households, while 149 (31.3%) are nonfamily households. The most numerous type of family households are 2-person households, comprising 183, and the most common type of nonfamily households are 1-person households, comprising 132.
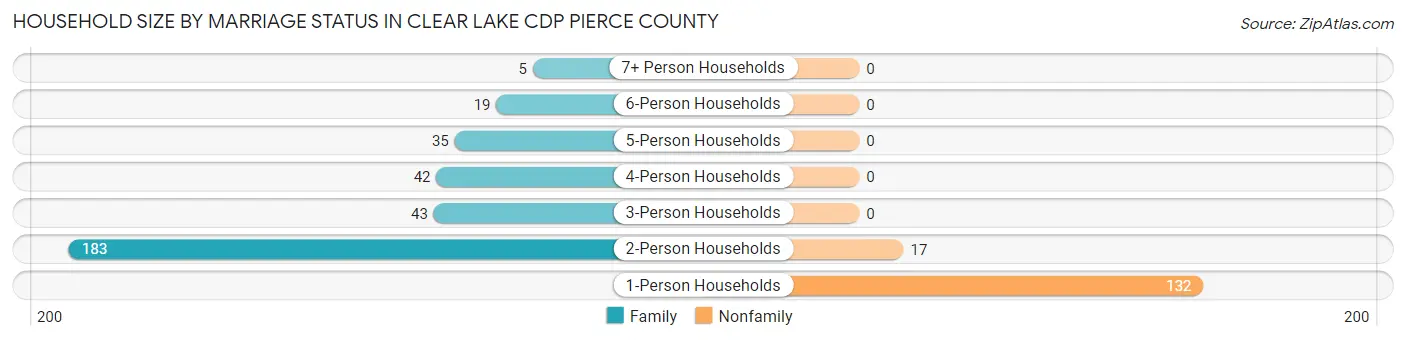
| Household Size | Family Households | Nonfamily Households |
| 1-Person Households | - | 132 (27.7%) |
| 2-Person Households | 183 (38.5%) | 17 (3.6%) |
| 3-Person Households | 43 (9.0%) | 0 (0.0%) |
| 4-Person Households | 42 (8.8%) | 0 (0.0%) |
| 5-Person Households | 35 (7.3%) | 0 (0.0%) |
| 6-Person Households | 19 (4.0%) | 0 (0.0%) |
| 7+ Person Households | 5 (1.1%) | 0 (0.0%) |
| Total | 327 (68.7%) | 149 (31.3%) |
Female Fertility in Clear Lake CDP Pierce County
Fertility by Age in Clear Lake CDP Pierce County
| Age Bracket | Women with Births | Births / 1,000 Women |
| 15 to 19 years | 0 (0.0%) | 0.0 |
| 20 to 34 years | 0 (0.0%) | 0.0 |
| 35 to 50 years | 0 (0.0%) | 0.0 |
| Total | 0 (0.0%) | 0.0 |
Fertility by Age by Marriage Status in Clear Lake CDP Pierce County
| Age Bracket | Married | Unmarried |
| 15 to 19 years | 0 (0.0%) | 0 (0.0%) |
| 20 to 34 years | 0 (0.0%) | 0 (0.0%) |
| 35 to 50 years | 0 (0.0%) | 0 (0.0%) |
| Total | 0 (0.0%) | 0 (0.0%) |
Fertility by Education in Clear Lake CDP Pierce County
| Educational Attainment | Women with Births | Births / 1,000 Women |
| Less than High School | 0 (0.0%) | 0.0 |
| High School Diploma | 0 (0.0%) | 0.0 |
| College or Associate's Degree | 0 (0.0%) | 0.0 |
| Bachelor's Degree | 0 (0.0%) | 0.0 |
| Graduate Degree | 0 (0.0%) | 0.0 |
| Total | 0 (0.0%) | 0.0 |
Fertility by Education by Marriage Status in Clear Lake CDP Pierce County
| Educational Attainment | Married | Unmarried |
| Less than High School | 0 (0.0%) | 0 (0.0%) |
| High School Diploma | 0 (0.0%) | 0 (0.0%) |
| College or Associate's Degree | 0 (0.0%) | 0 (0.0%) |
| Bachelor's Degree | 0 (0.0%) | 0 (0.0%) |
| Graduate Degree | 0 (0.0%) | 0 (0.0%) |
| Total | 0 (0.0%) | 0 (0.0%) |
Employment Characteristics in Clear Lake CDP Pierce County
Employment by Class of Employer in Clear Lake CDP Pierce County
Among the 550 employed individuals in Clear Lake CDP Pierce County, private company employees (261 | 47.4%), self-employed (not incorporated) (138 | 25.1%), and state government employees (63 | 11.5%) make up the most common classes of employment.
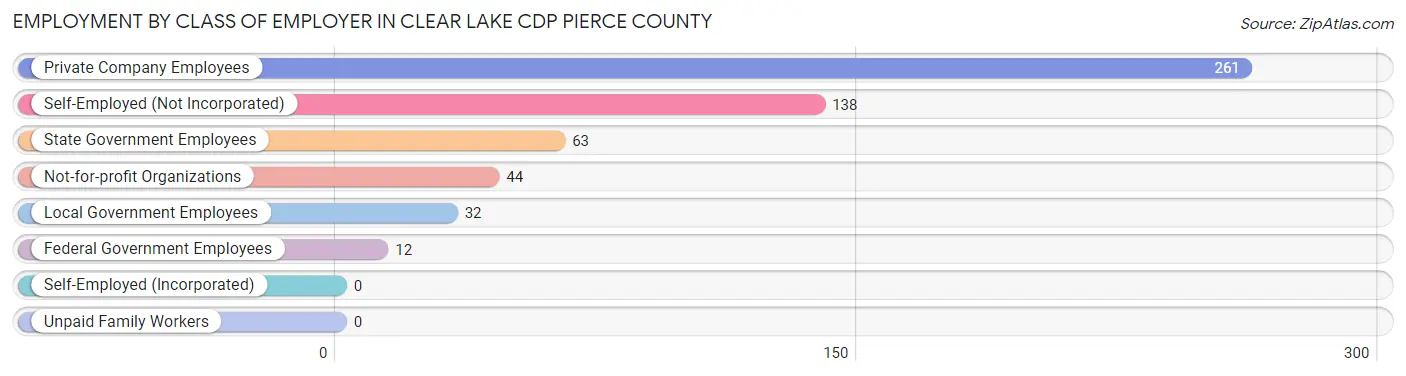
| Employer Class | # Employees | % Employees |
| Private Company Employees | 261 | 47.4% |
| Self-Employed (Incorporated) | 0 | 0.0% |
| Self-Employed (Not Incorporated) | 138 | 25.1% |
| Not-for-profit Organizations | 44 | 8.0% |
| Local Government Employees | 32 | 5.8% |
| State Government Employees | 63 | 11.5% |
| Federal Government Employees | 12 | 2.2% |
| Unpaid Family Workers | 0 | 0.0% |
| Total | 550 | 100.0% |
Employment Status by Age in Clear Lake CDP Pierce County
According to the labor force statistics for Clear Lake CDP Pierce County, out of the total population over 16 years of age (900), 65.0% or 585 individuals are in the labor force, with 6.0% or 35 of them unemployed. The age group with the highest labor force participation rate is 30 to 34 years, with 100.0% or 19 individuals in the labor force. Within the labor force, the 65 to 74 years age range has the highest percentage of unemployed individuals, with 100.0% or 29 of them being unemployed.
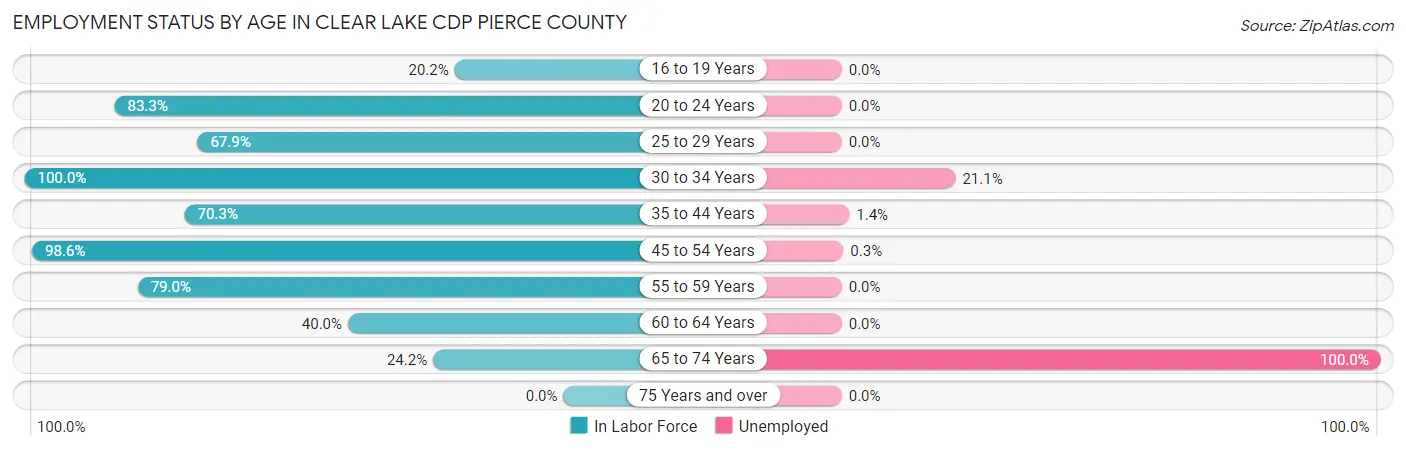
| Age Bracket | In Labor Force | Unemployed |
| 16 to 19 Years | 18 (20.2%) | 0 (0.0%) |
| 20 to 24 Years | 50 (83.3%) | 0 (0.0%) |
| 25 to 29 Years | 36 (67.9%) | 0 (0.0%) |
| 30 to 34 Years | 19 (100.0%) | 4 (21.1%) |
| 35 to 44 Years | 71 (70.3%) | 1 (1.4%) |
| 45 to 54 Years | 292 (98.6%) | 1 (0.3%) |
| 55 to 59 Years | 64 (79.0%) | 0 (0.0%) |
| 60 to 64 Years | 6 (40.0%) | 0 (0.0%) |
| 65 to 74 Years | 29 (24.2%) | 29 (100.0%) |
| 75 Years and over | 0 (0.0%) | 0 (0.0%) |
| Total | 585 (65.0%) | 35 (6.0%) |
Employment Status by Educational Attainment in Clear Lake CDP Pierce County
According to labor force statistics for Clear Lake CDP Pierce County, 86.4% of individuals (488) out of the total population between 25 and 64 years of age (565) are in the labor force, with 1.2% or 6 of them being unemployed. The group with the highest labor force participation rate are those with the educational attainment of bachelor's degree or higher, with 100.0% or 131 individuals in the labor force. Within the labor force, individuals with less than high school education have the highest percentage of unemployment, with 3.7% or 1 of them being unemployed.
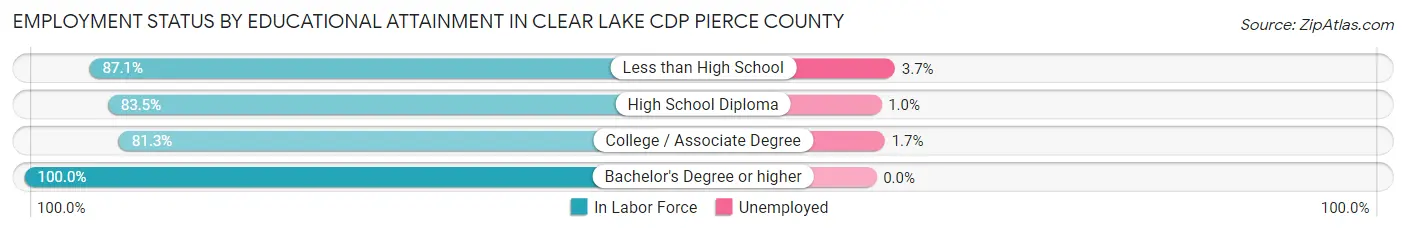
| Educational Attainment | In Labor Force | Unemployed |
| Less than High School | 27 (87.1%) | 1 (3.7%) |
| High School Diploma | 96 (83.5%) | 1 (1.0%) |
| College / Associate Degree | 234 (81.3%) | 5 (1.7%) |
| Bachelor's Degree or higher | 131 (100.0%) | 0 (0.0%) |
| Total | 488 (86.4%) | 7 (1.2%) |
Employment Occupations by Sex in Clear Lake CDP Pierce County
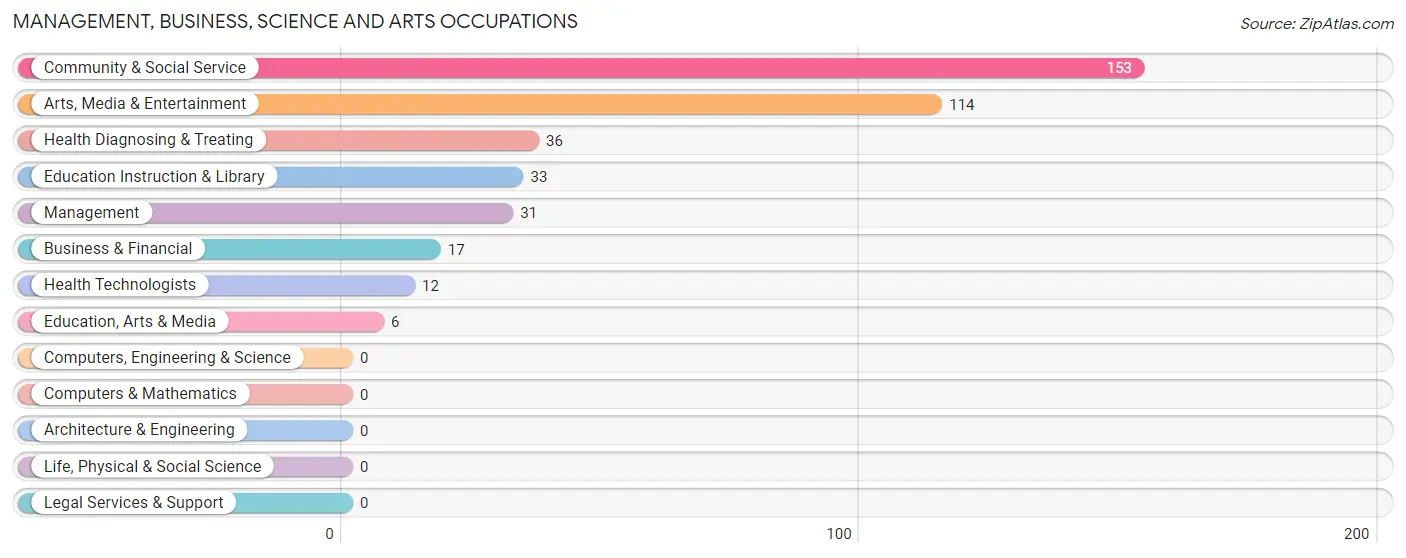
Management, Business, Science and Arts Occupations
The most common Management, Business, Science and Arts occupations in Clear Lake CDP Pierce County are Community & Social Service (153 | 27.8%), Arts, Media & Entertainment (114 | 20.7%), Health Diagnosing & Treating (36 | 6.6%), Education Instruction & Library (33 | 6.0%), and Management (31 | 5.6%).
Management, Business, Science and Arts Occupations by Sex
Within the Management, Business, Science and Arts occupations in Clear Lake CDP Pierce County, the most male-oriented occupations are Management (100.0%), Business & Financial (100.0%), and Health Diagnosing & Treating (66.7%), while the most female-oriented occupations are Education, Arts & Media (100.0%), Education Instruction & Library (100.0%), and Health Technologists (100.0%).
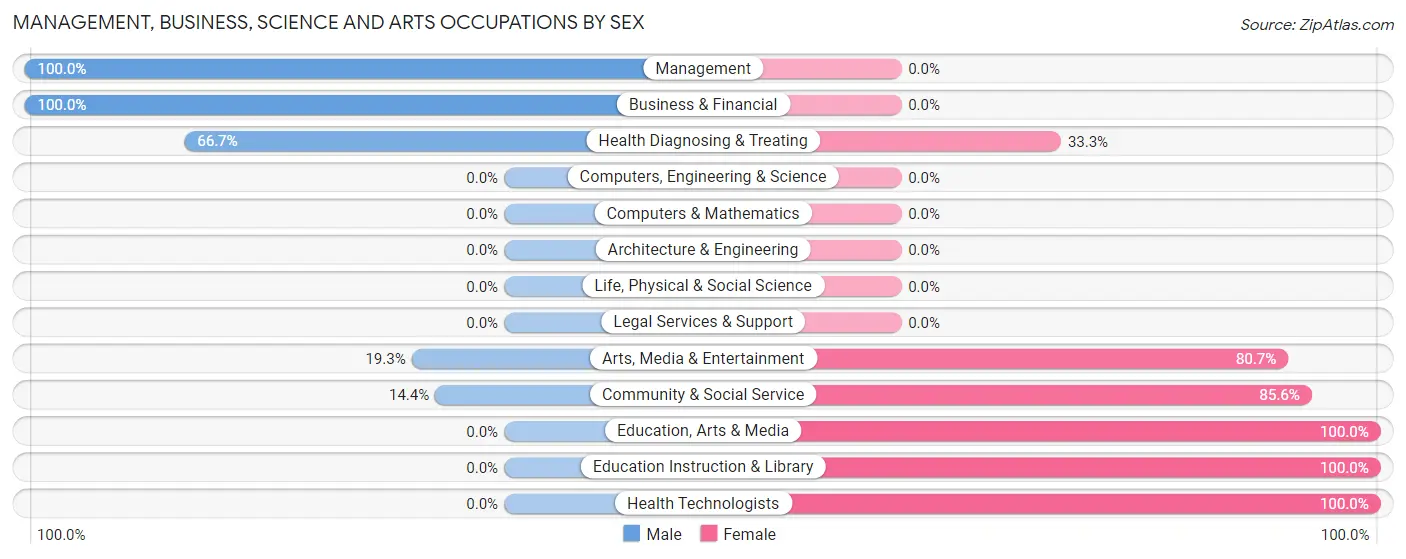
| Occupation | Male | Female |
| Management | 31 (100.0%) | 0 (0.0%) |
| Business & Financial | 17 (100.0%) | 0 (0.0%) |
| Computers, Engineering & Science | 0 (0.0%) | 0 (0.0%) |
| Computers & Mathematics | 0 (0.0%) | 0 (0.0%) |
| Architecture & Engineering | 0 (0.0%) | 0 (0.0%) |
| Life, Physical & Social Science | 0 (0.0%) | 0 (0.0%) |
| Community & Social Service | 22 (14.4%) | 131 (85.6%) |
| Education, Arts & Media | 0 (0.0%) | 6 (100.0%) |
| Legal Services & Support | 0 (0.0%) | 0 (0.0%) |
| Education Instruction & Library | 0 (0.0%) | 33 (100.0%) |
| Arts, Media & Entertainment | 22 (19.3%) | 92 (80.7%) |
| Health Diagnosing & Treating | 24 (66.7%) | 12 (33.3%) |
| Health Technologists | 0 (0.0%) | 12 (100.0%) |
| Total (Category) | 94 (39.7%) | 143 (60.3%) |
| Total (Overall) | 273 (49.6%) | 277 (50.4%) |
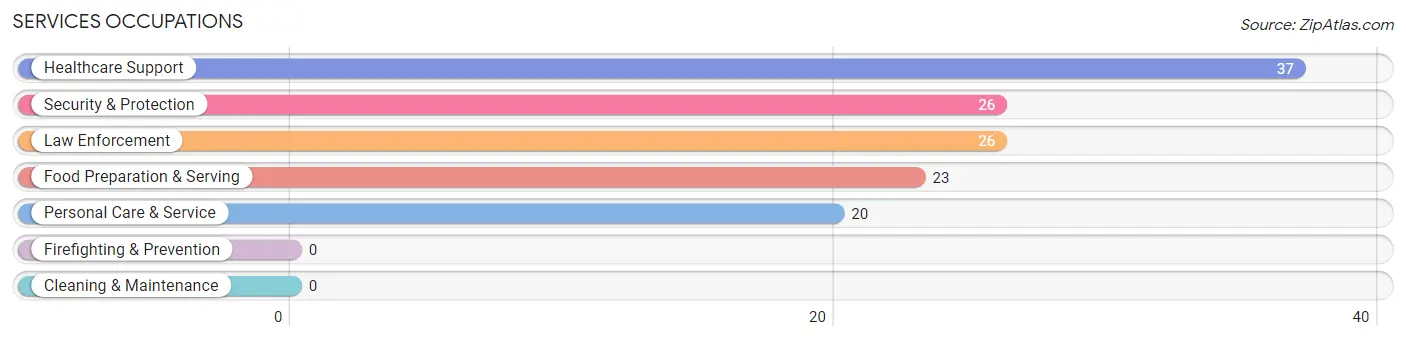
Services Occupations
The most common Services occupations in Clear Lake CDP Pierce County are Healthcare Support (37 | 6.7%), Security & Protection (26 | 4.7%), Law Enforcement (26 | 4.7%), Food Preparation & Serving (23 | 4.2%), and Personal Care & Service (20 | 3.6%).
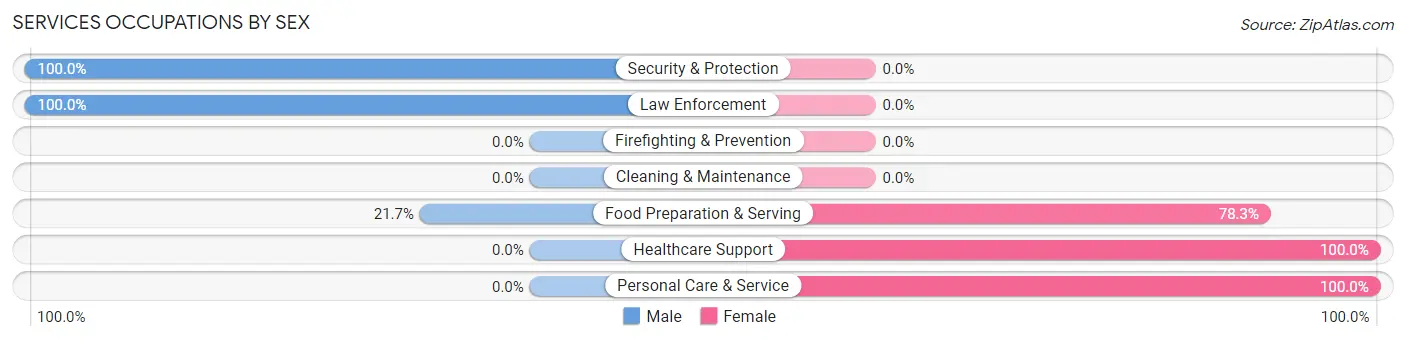
Services Occupations by Sex
Within the Services occupations in Clear Lake CDP Pierce County, the most male-oriented occupations are Security & Protection (100.0%), Law Enforcement (100.0%), and Food Preparation & Serving (21.7%), while the most female-oriented occupations are Healthcare Support (100.0%), Personal Care & Service (100.0%), and Food Preparation & Serving (78.3%).
| Occupation | Male | Female |
| Healthcare Support | 0 (0.0%) | 37 (100.0%) |
| Security & Protection | 26 (100.0%) | 0 (0.0%) |
| Firefighting & Prevention | 0 (0.0%) | 0 (0.0%) |
| Law Enforcement | 26 (100.0%) | 0 (0.0%) |
| Food Preparation & Serving | 5 (21.7%) | 18 (78.3%) |
| Cleaning & Maintenance | 0 (0.0%) | 0 (0.0%) |
| Personal Care & Service | 0 (0.0%) | 20 (100.0%) |
| Total (Category) | 31 (29.2%) | 75 (70.8%) |
| Total (Overall) | 273 (49.6%) | 277 (50.4%) |
Sales and Office Occupations
The most common Sales and Office occupations in Clear Lake CDP Pierce County are Office & Administration (59 | 10.7%), and Sales & Related (7 | 1.3%).
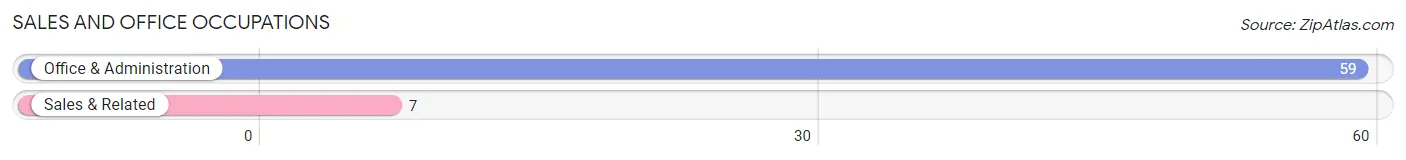
Sales and Office Occupations by Sex
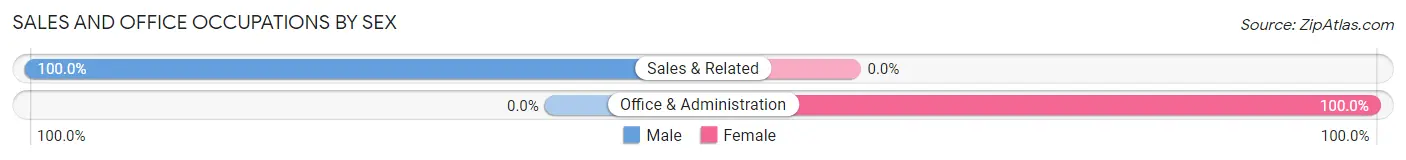
| Occupation | Male | Female |
| Sales & Related | 7 (100.0%) | 0 (0.0%) |
| Office & Administration | 0 (0.0%) | 59 (100.0%) |
| Total (Category) | 7 (10.6%) | 59 (89.4%) |
| Total (Overall) | 273 (49.6%) | 277 (50.4%) |
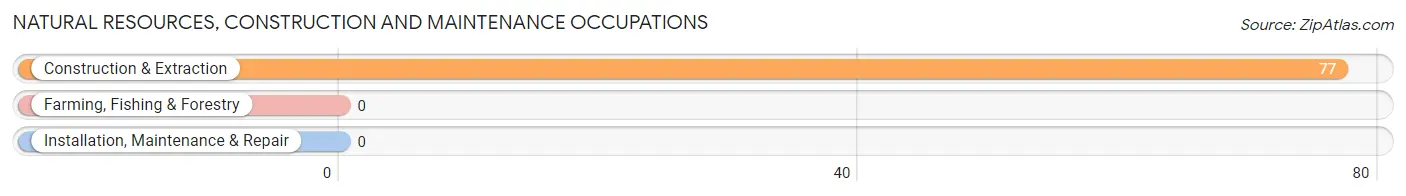
Natural Resources, Construction and Maintenance Occupations
The most common Natural Resources, Construction and Maintenance occupations in Clear Lake CDP Pierce County are , and Construction & Extraction (77 | 14.0%).
Natural Resources, Construction and Maintenance Occupations by Sex
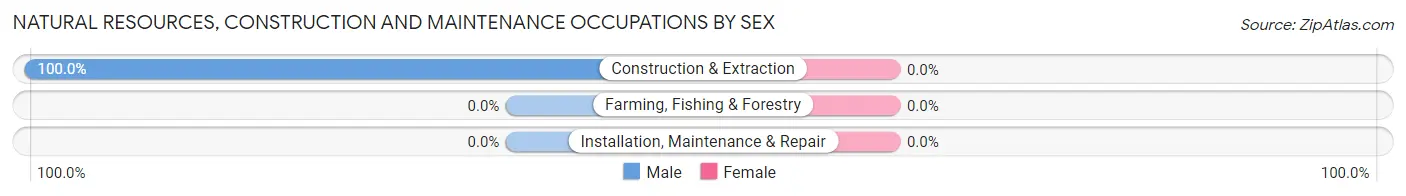
| Occupation | Male | Female |
| Farming, Fishing & Forestry | 0 (0.0%) | 0 (0.0%) |
| Construction & Extraction | 77 (100.0%) | 0 (0.0%) |
| Installation, Maintenance & Repair | 0 (0.0%) | 0 (0.0%) |
| Total (Category) | 77 (100.0%) | 0 (0.0%) |
| Total (Overall) | 273 (49.6%) | 277 (50.4%) |
Production, Transportation and Moving Occupations
The most common Production, Transportation and Moving occupations in Clear Lake CDP Pierce County are Production (26 | 4.7%), Transportation (21 | 3.8%), and Material Moving (17 | 3.1%).
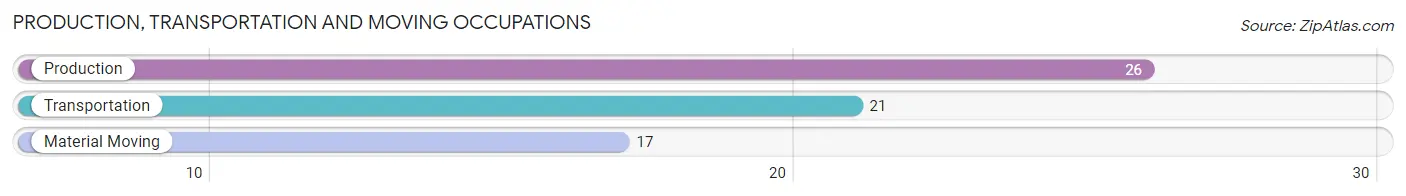
Production, Transportation and Moving Occupations by Sex
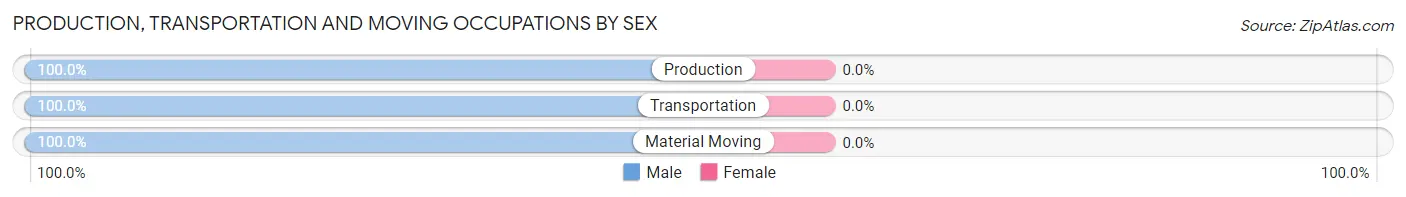
| Occupation | Male | Female |
| Production | 26 (100.0%) | 0 (0.0%) |
| Transportation | 21 (100.0%) | 0 (0.0%) |
| Material Moving | 17 (100.0%) | 0 (0.0%) |
| Total (Category) | 64 (100.0%) | 0 (0.0%) |
| Total (Overall) | 273 (49.6%) | 277 (50.4%) |
Employment Industries by Sex in Clear Lake CDP Pierce County
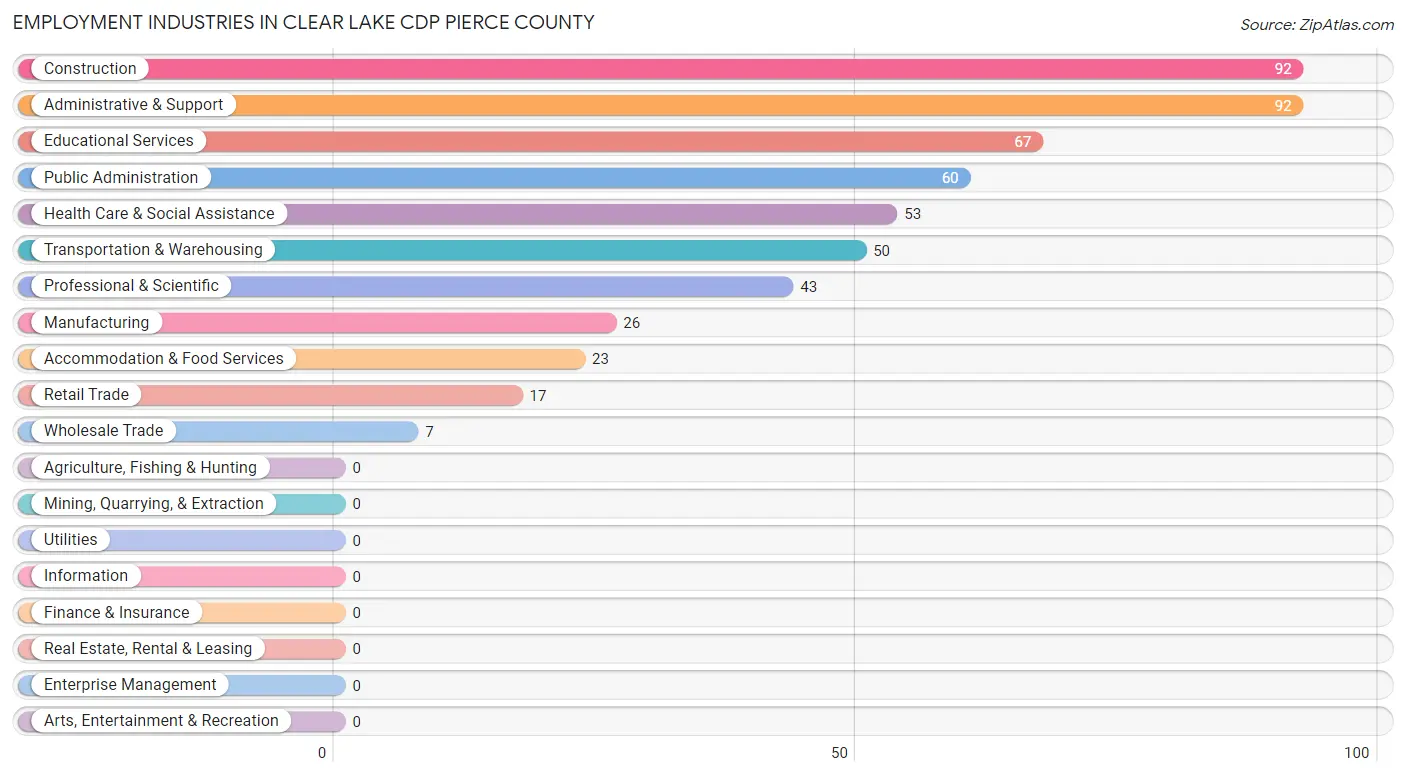
Employment Industries in Clear Lake CDP Pierce County
The major employment industries in Clear Lake CDP Pierce County include Construction (92 | 16.7%), Administrative & Support (92 | 16.7%), Educational Services (67 | 12.2%), Public Administration (60 | 10.9%), and Health Care & Social Assistance (53 | 9.6%).
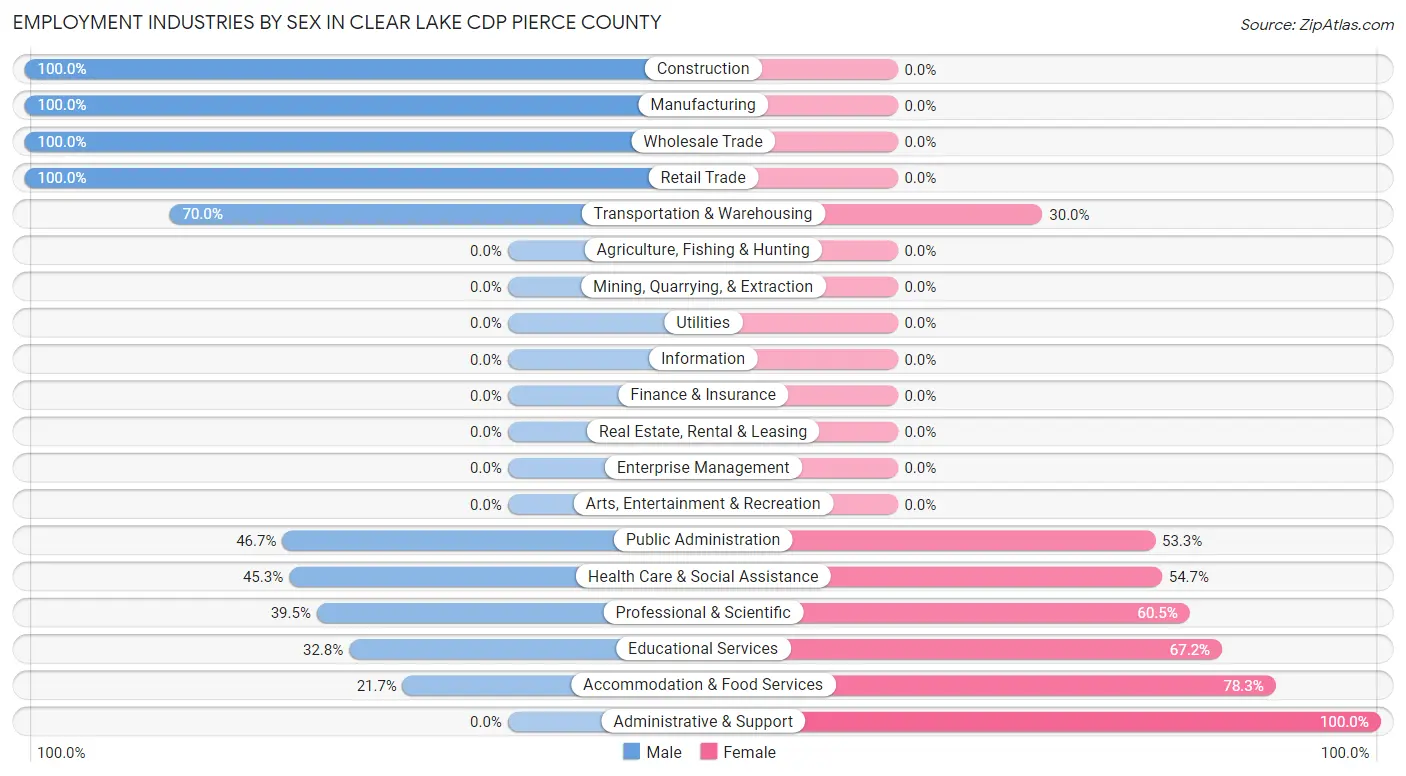
Employment Industries by Sex in Clear Lake CDP Pierce County
The Clear Lake CDP Pierce County industries that see more men than women are Construction (100.0%), Manufacturing (100.0%), and Wholesale Trade (100.0%), whereas the industries that tend to have a higher number of women are Administrative & Support (100.0%), Accommodation & Food Services (78.3%), and Educational Services (67.2%).
| Industry | Male | Female |
| Agriculture, Fishing & Hunting | 0 (0.0%) | 0 (0.0%) |
| Mining, Quarrying, & Extraction | 0 (0.0%) | 0 (0.0%) |
| Construction | 92 (100.0%) | 0 (0.0%) |
| Manufacturing | 26 (100.0%) | 0 (0.0%) |
| Wholesale Trade | 7 (100.0%) | 0 (0.0%) |
| Retail Trade | 17 (100.0%) | 0 (0.0%) |
| Transportation & Warehousing | 35 (70.0%) | 15 (30.0%) |
| Utilities | 0 (0.0%) | 0 (0.0%) |
| Information | 0 (0.0%) | 0 (0.0%) |
| Finance & Insurance | 0 (0.0%) | 0 (0.0%) |
| Real Estate, Rental & Leasing | 0 (0.0%) | 0 (0.0%) |
| Professional & Scientific | 17 (39.5%) | 26 (60.5%) |
| Enterprise Management | 0 (0.0%) | 0 (0.0%) |
| Administrative & Support | 0 (0.0%) | 92 (100.0%) |
| Educational Services | 22 (32.8%) | 45 (67.2%) |
| Health Care & Social Assistance | 24 (45.3%) | 29 (54.7%) |
| Arts, Entertainment & Recreation | 0 (0.0%) | 0 (0.0%) |
| Accommodation & Food Services | 5 (21.7%) | 18 (78.3%) |
| Public Administration | 28 (46.7%) | 32 (53.3%) |
| Total | 273 (49.6%) | 277 (50.4%) |
Education in Clear Lake CDP Pierce County
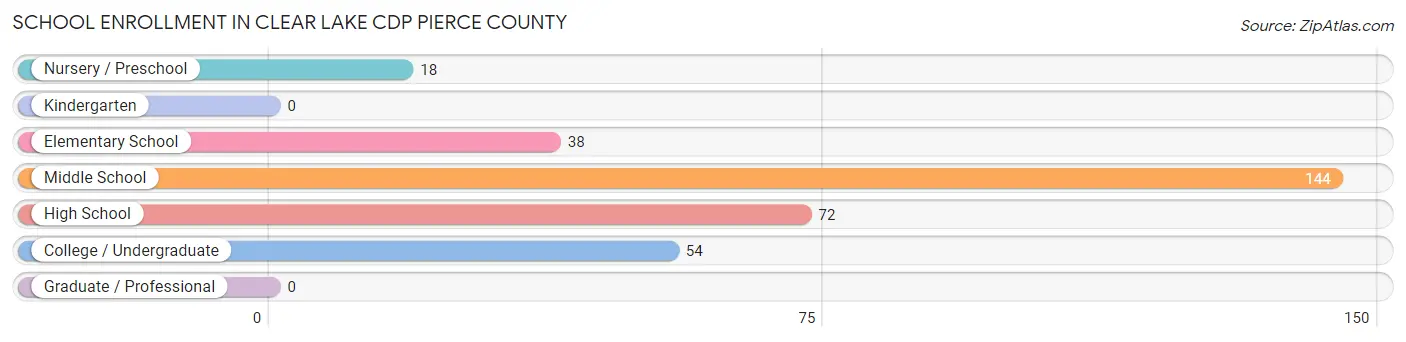
School Enrollment in Clear Lake CDP Pierce County
The most common levels of schooling among the 326 students in Clear Lake CDP Pierce County are middle school (144 | 44.2%), high school (72 | 22.1%), and college / undergraduate (54 | 16.6%).
| School Level | # Students | % Students |
| Nursery / Preschool | 18 | 5.5% |
| Kindergarten | 0 | 0.0% |
| Elementary School | 38 | 11.7% |
| Middle School | 144 | 44.2% |
| High School | 72 | 22.1% |
| College / Undergraduate | 54 | 16.6% |
| Graduate / Professional | 0 | 0.0% |
| Total | 326 | 100.0% |
School Enrollment by Age by Funding Source in Clear Lake CDP Pierce County
Out of a total of 326 students who are enrolled in schools in Clear Lake CDP Pierce County, 171 (52.5%) attend a private institution, while the remaining 155 (47.5%) are enrolled in public schools. The age group of 35 years and over has the highest likelihood of being enrolled in private schools, with 1 (100.0% in the age bracket) enrolled. Conversely, the age group of 3 to 4 year olds has the lowest likelihood of being enrolled in a private school, with 13 (100.0% in the age bracket) attending a public institution.
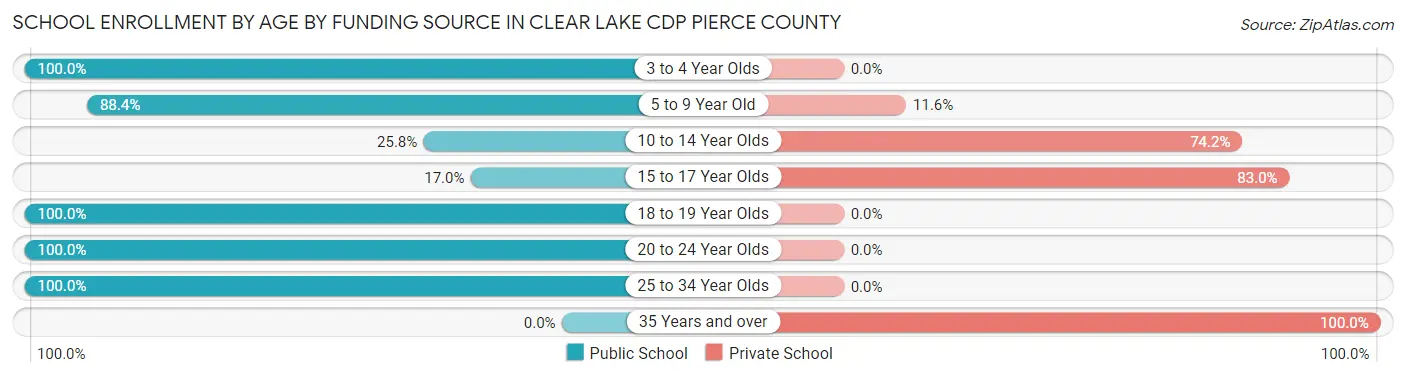
| Age Bracket | Public School | Private School |
| 3 to 4 Year Olds | 13 (100.0%) | 0 (0.0%) |
| 5 to 9 Year Old | 38 (88.4%) | 5 (11.6%) |
| 10 to 14 Year Olds | 42 (25.8%) | 121 (74.2%) |
| 15 to 17 Year Olds | 9 (17.0%) | 44 (83.0%) |
| 18 to 19 Year Olds | 12 (100.0%) | 0 (0.0%) |
| 20 to 24 Year Olds | 20 (100.0%) | 0 (0.0%) |
| 25 to 34 Year Olds | 21 (100.0%) | 0 (0.0%) |
| 35 Years and over | 0 (0.0%) | 1 (100.0%) |
| Total | 155 (47.5%) | 171 (52.5%) |
Educational Attainment by Field of Study in Clear Lake CDP Pierce County
Arts & humanities (50 | 22.1%), science & technology (46 | 20.3%), bio, nature & agricultural (33 | 14.6%), education (22 | 9.7%), and multidisciplinary studies (20 | 8.8%) are the most common fields of study among 226 individuals in Clear Lake CDP Pierce County who have obtained a bachelor's degree or higher.
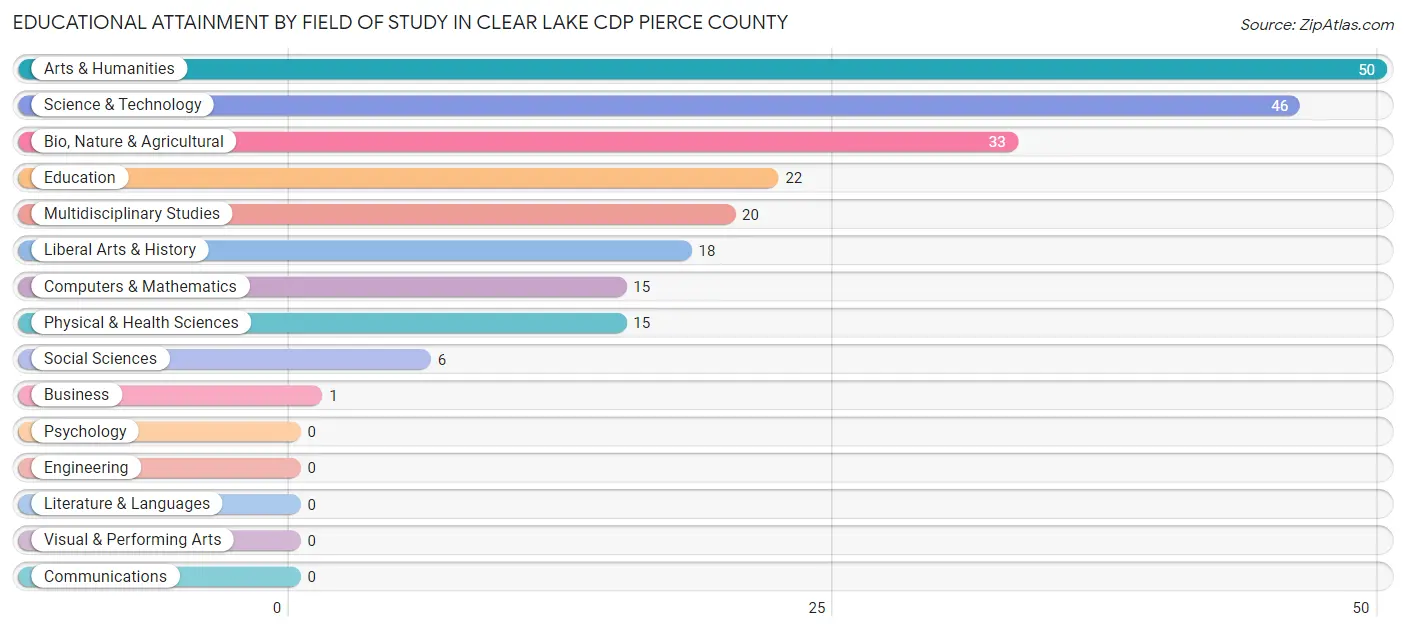
| Field of Study | # Graduates | % Graduates |
| Computers & Mathematics | 15 | 6.6% |
| Bio, Nature & Agricultural | 33 | 14.6% |
| Physical & Health Sciences | 15 | 6.6% |
| Psychology | 0 | 0.0% |
| Social Sciences | 6 | 2.6% |
| Engineering | 0 | 0.0% |
| Multidisciplinary Studies | 20 | 8.8% |
| Science & Technology | 46 | 20.3% |
| Business | 1 | 0.4% |
| Education | 22 | 9.7% |
| Literature & Languages | 0 | 0.0% |
| Liberal Arts & History | 18 | 8.0% |
| Visual & Performing Arts | 0 | 0.0% |
| Communications | 0 | 0.0% |
| Arts & Humanities | 50 | 22.1% |
| Total | 226 | 100.0% |
Transportation & Commute in Clear Lake CDP Pierce County
Vehicle Availability by Sex in Clear Lake CDP Pierce County
The most prevalent vehicle ownership categories in Clear Lake CDP Pierce County are males with 4 vehicles (113, accounting for 41.4%) and females with 4 vehicles (85, making up 40.9%).
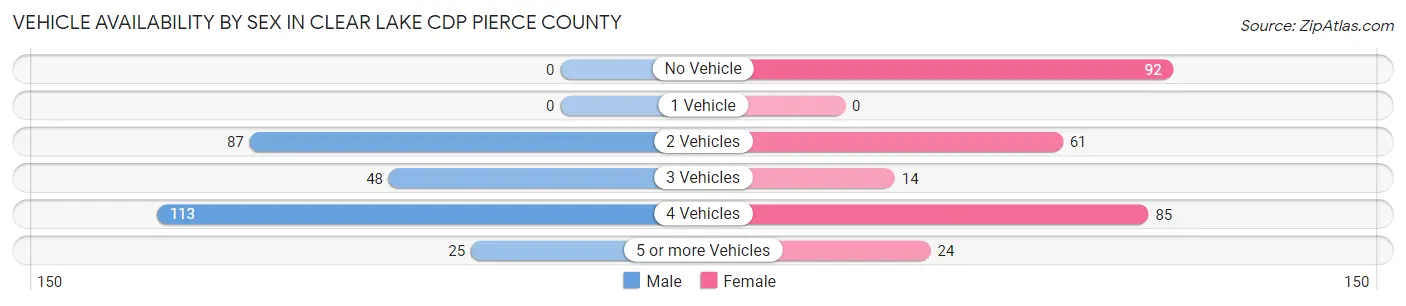
| Vehicles Available | Male | Female |
| No Vehicle | 0 (0.0%) | 92 (33.3%) |
| 1 Vehicle | 0 (0.0%) | 0 (0.0%) |
| 2 Vehicles | 87 (31.9%) | 61 (22.1%) |
| 3 Vehicles | 48 (17.6%) | 14 (5.1%) |
| 4 Vehicles | 113 (41.4%) | 85 (30.8%) |
| 5 or more Vehicles | 25 (9.2%) | 24 (8.7%) |
| Total | 273 (100.0%) | 276 (100.0%) |
Commute Time in Clear Lake CDP Pierce County
The most frequently occuring commute durations in Clear Lake CDP Pierce County are 90 or more minutes (69 commuters, 16.3%), 40 to 44 minutes (54 commuters, 12.7%), and 60 to 89 minutes (52 commuters, 12.3%).
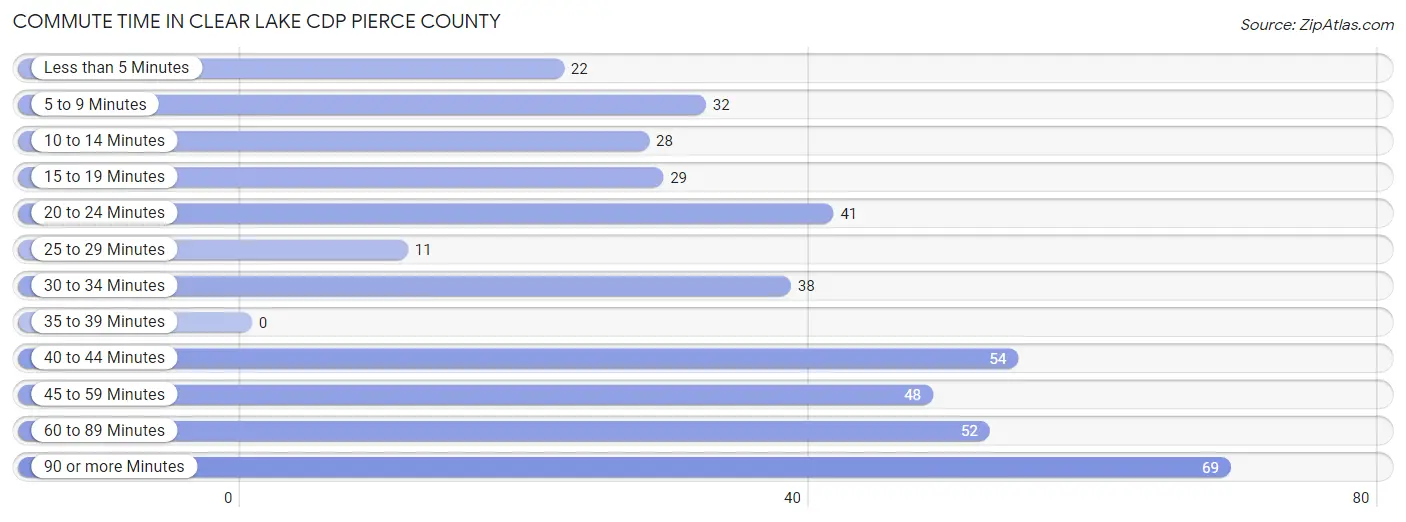
| Commute Time | # Commuters | % Commuters |
| Less than 5 Minutes | 22 | 5.2% |
| 5 to 9 Minutes | 32 | 7.5% |
| 10 to 14 Minutes | 28 | 6.6% |
| 15 to 19 Minutes | 29 | 6.8% |
| 20 to 24 Minutes | 41 | 9.7% |
| 25 to 29 Minutes | 11 | 2.6% |
| 30 to 34 Minutes | 38 | 9.0% |
| 35 to 39 Minutes | 0 | 0.0% |
| 40 to 44 Minutes | 54 | 12.7% |
| 45 to 59 Minutes | 48 | 11.3% |
| 60 to 89 Minutes | 52 | 12.3% |
| 90 or more Minutes | 69 | 16.3% |
Commute Time by Sex in Clear Lake CDP Pierce County
The most common commute times in Clear Lake CDP Pierce County are 90 or more minutes (69 commuters, 25.3%) for males and 60 to 89 minutes (38 commuters, 25.2%) for females.
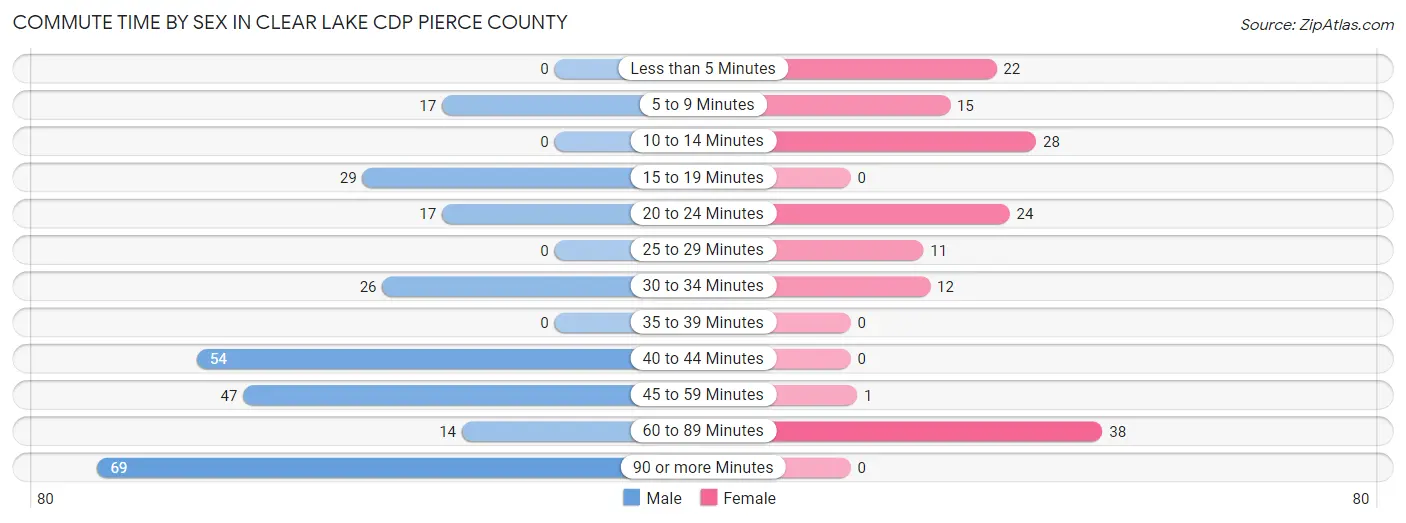
| Commute Time | Male | Female |
| Less than 5 Minutes | 0 (0.0%) | 22 (14.6%) |
| 5 to 9 Minutes | 17 (6.2%) | 15 (9.9%) |
| 10 to 14 Minutes | 0 (0.0%) | 28 (18.5%) |
| 15 to 19 Minutes | 29 (10.6%) | 0 (0.0%) |
| 20 to 24 Minutes | 17 (6.2%) | 24 (15.9%) |
| 25 to 29 Minutes | 0 (0.0%) | 11 (7.3%) |
| 30 to 34 Minutes | 26 (9.5%) | 12 (8.0%) |
| 35 to 39 Minutes | 0 (0.0%) | 0 (0.0%) |
| 40 to 44 Minutes | 54 (19.8%) | 0 (0.0%) |
| 45 to 59 Minutes | 47 (17.2%) | 1 (0.7%) |
| 60 to 89 Minutes | 14 (5.1%) | 38 (25.2%) |
| 90 or more Minutes | 69 (25.3%) | 0 (0.0%) |
Time of Departure to Work by Sex in Clear Lake CDP Pierce County
The most frequent times of departure to work in Clear Lake CDP Pierce County are 12:00 AM to 4:59 AM (128, 46.9%) for males and 7:00 AM to 7:29 AM (55, 36.4%) for females.
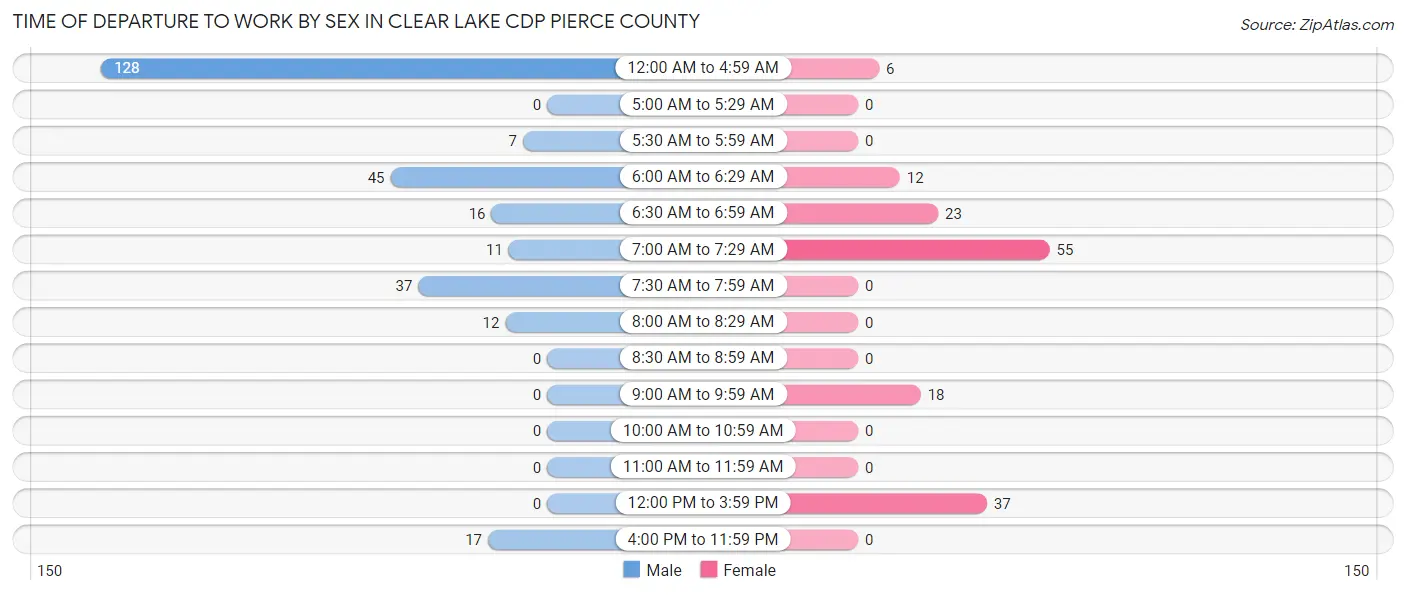
| Time of Departure | Male | Female |
| 12:00 AM to 4:59 AM | 128 (46.9%) | 6 (4.0%) |
| 5:00 AM to 5:29 AM | 0 (0.0%) | 0 (0.0%) |
| 5:30 AM to 5:59 AM | 7 (2.6%) | 0 (0.0%) |
| 6:00 AM to 6:29 AM | 45 (16.5%) | 12 (8.0%) |
| 6:30 AM to 6:59 AM | 16 (5.9%) | 23 (15.2%) |
| 7:00 AM to 7:29 AM | 11 (4.0%) | 55 (36.4%) |
| 7:30 AM to 7:59 AM | 37 (13.6%) | 0 (0.0%) |
| 8:00 AM to 8:29 AM | 12 (4.4%) | 0 (0.0%) |
| 8:30 AM to 8:59 AM | 0 (0.0%) | 0 (0.0%) |
| 9:00 AM to 9:59 AM | 0 (0.0%) | 18 (11.9%) |
| 10:00 AM to 10:59 AM | 0 (0.0%) | 0 (0.0%) |
| 11:00 AM to 11:59 AM | 0 (0.0%) | 0 (0.0%) |
| 12:00 PM to 3:59 PM | 0 (0.0%) | 37 (24.5%) |
| 4:00 PM to 11:59 PM | 17 (6.2%) | 0 (0.0%) |
| Total | 273 (100.0%) | 151 (100.0%) |
Housing Occupancy in Clear Lake CDP Pierce County
Occupancy by Ownership in Clear Lake CDP Pierce County
Of the total 476 dwellings in Clear Lake CDP Pierce County, owner-occupied units account for 469 (98.5%), while renter-occupied units make up 7 (1.5%).
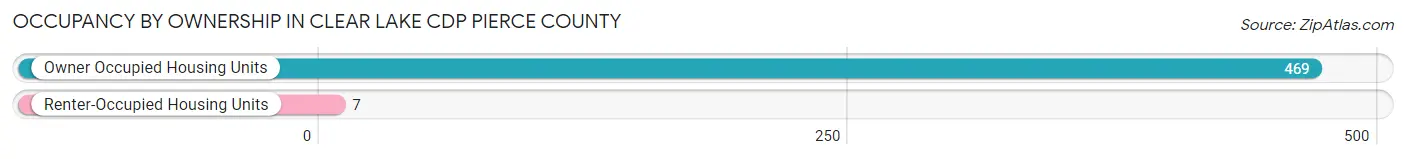
| Occupancy | # Housing Units | % Housing Units |
| Owner Occupied Housing Units | 469 | 98.5% |
| Renter-Occupied Housing Units | 7 | 1.5% |
| Total Occupied Housing Units | 476 | 100.0% |
Occupancy by Household Size in Clear Lake CDP Pierce County
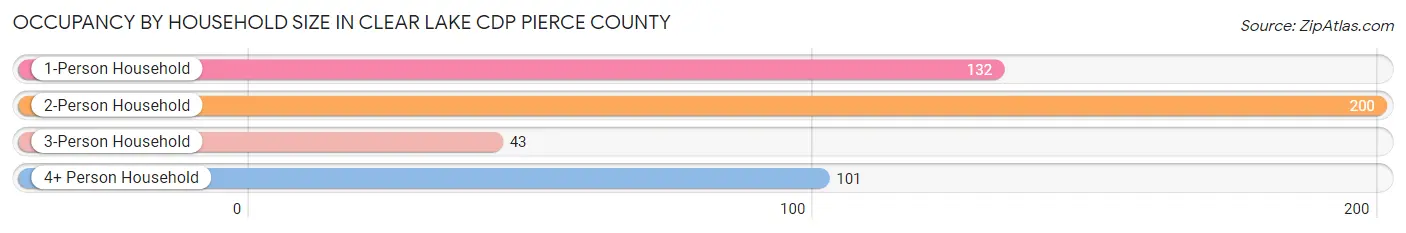
| Household Size | # Housing Units | % Housing Units |
| 1-Person Household | 132 | 27.7% |
| 2-Person Household | 200 | 42.0% |
| 3-Person Household | 43 | 9.0% |
| 4+ Person Household | 101 | 21.2% |
| Total Housing Units | 476 | 100.0% |
Occupancy by Ownership by Household Size in Clear Lake CDP Pierce County
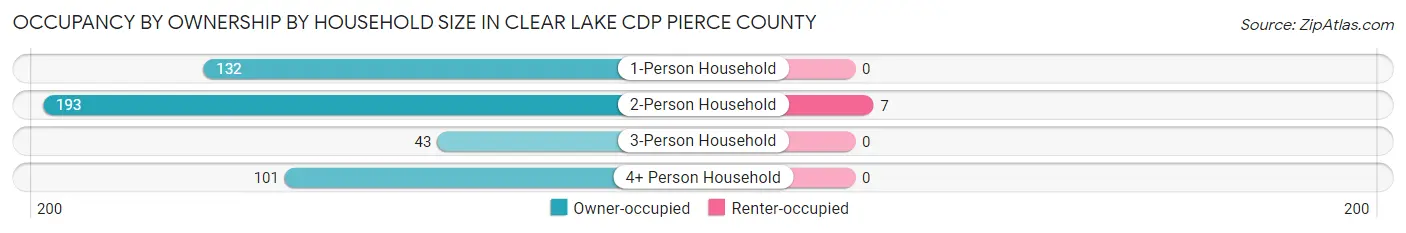
| Household Size | Owner-occupied | Renter-occupied |
| 1-Person Household | 132 (100.0%) | 0 (0.0%) |
| 2-Person Household | 193 (96.5%) | 7 (3.5%) |
| 3-Person Household | 43 (100.0%) | 0 (0.0%) |
| 4+ Person Household | 101 (100.0%) | 0 (0.0%) |
| Total Housing Units | 469 (98.5%) | 7 (1.5%) |
Occupancy by Educational Attainment in Clear Lake CDP Pierce County
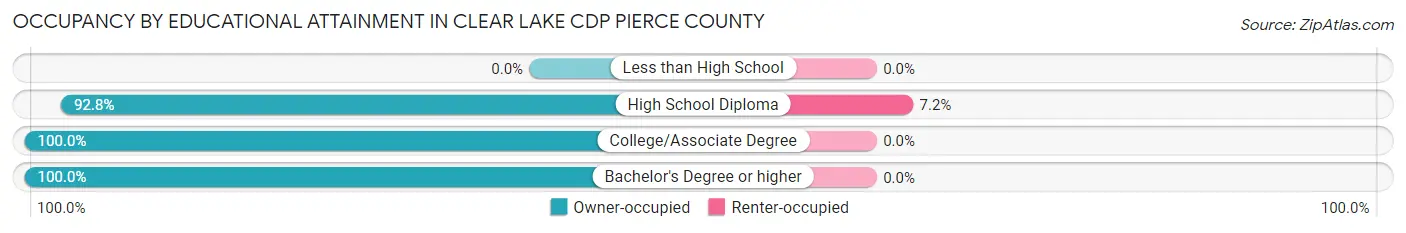
| Household Size | Owner-occupied | Renter-occupied |
| Less than High School | 0 (0.0%) | 0 (0.0%) |
| High School Diploma | 90 (92.8%) | 7 (7.2%) |
| College/Associate Degree | 292 (100.0%) | 0 (0.0%) |
| Bachelor's Degree or higher | 87 (100.0%) | 0 (0.0%) |
Occupancy by Age of Householder in Clear Lake CDP Pierce County
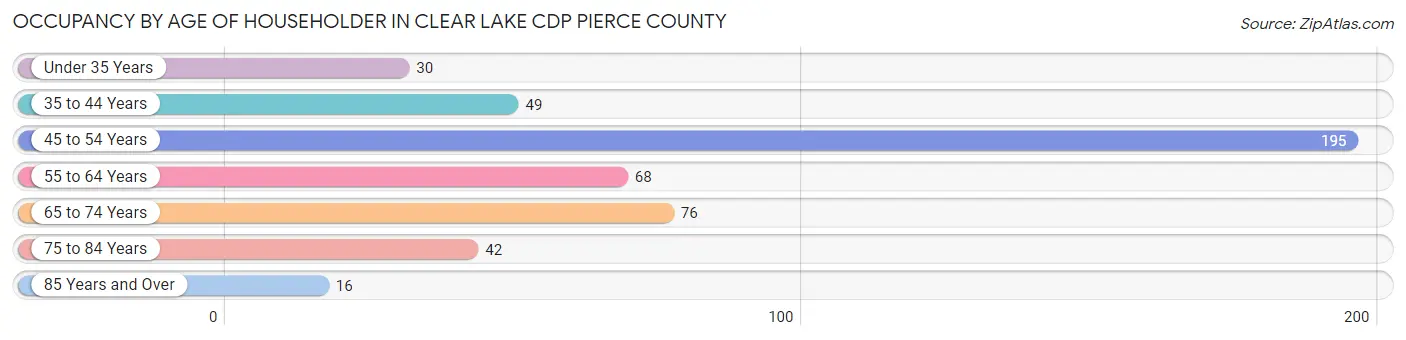
| Age Bracket | # Households | % Households |
| Under 35 Years | 30 | 6.3% |
| 35 to 44 Years | 49 | 10.3% |
| 45 to 54 Years | 195 | 41.0% |
| 55 to 64 Years | 68 | 14.3% |
| 65 to 74 Years | 76 | 16.0% |
| 75 to 84 Years | 42 | 8.8% |
| 85 Years and Over | 16 | 3.4% |
| Total | 476 | 100.0% |
Housing Finances in Clear Lake CDP Pierce County
Median Income by Occupancy in Clear Lake CDP Pierce County
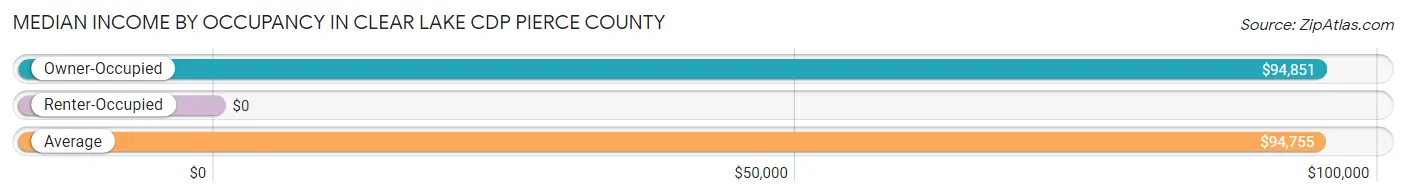
| Occupancy Type | # Households | Median Income |
| Owner-Occupied | 469 (98.5%) | $94,851 |
| Renter-Occupied | 7 (1.5%) | $0 |
| Average | 476 (100.0%) | $94,755 |
Occupancy by Householder Income Bracket in Clear Lake CDP Pierce County
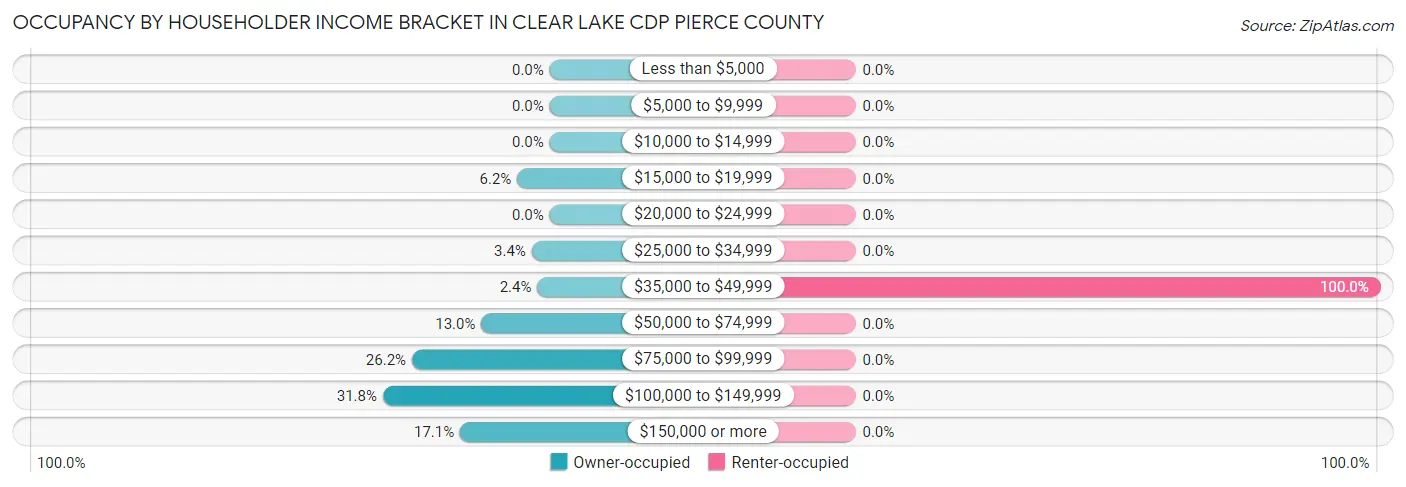
| Income Bracket | Owner-occupied | Renter-occupied |
| Less than $5,000 | 0 (0.0%) | 0 (0.0%) |
| $5,000 to $9,999 | 0 (0.0%) | 0 (0.0%) |
| $10,000 to $14,999 | 0 (0.0%) | 0 (0.0%) |
| $15,000 to $19,999 | 29 (6.2%) | 0 (0.0%) |
| $20,000 to $24,999 | 0 (0.0%) | 0 (0.0%) |
| $25,000 to $34,999 | 16 (3.4%) | 0 (0.0%) |
| $35,000 to $49,999 | 11 (2.4%) | 7 (100.0%) |
| $50,000 to $74,999 | 61 (13.0%) | 0 (0.0%) |
| $75,000 to $99,999 | 123 (26.2%) | 0 (0.0%) |
| $100,000 to $149,999 | 149 (31.8%) | 0 (0.0%) |
| $150,000 or more | 80 (17.1%) | 0 (0.0%) |
| Total | 469 (100.0%) | 7 (100.0%) |
Monthly Housing Cost Tiers in Clear Lake CDP Pierce County
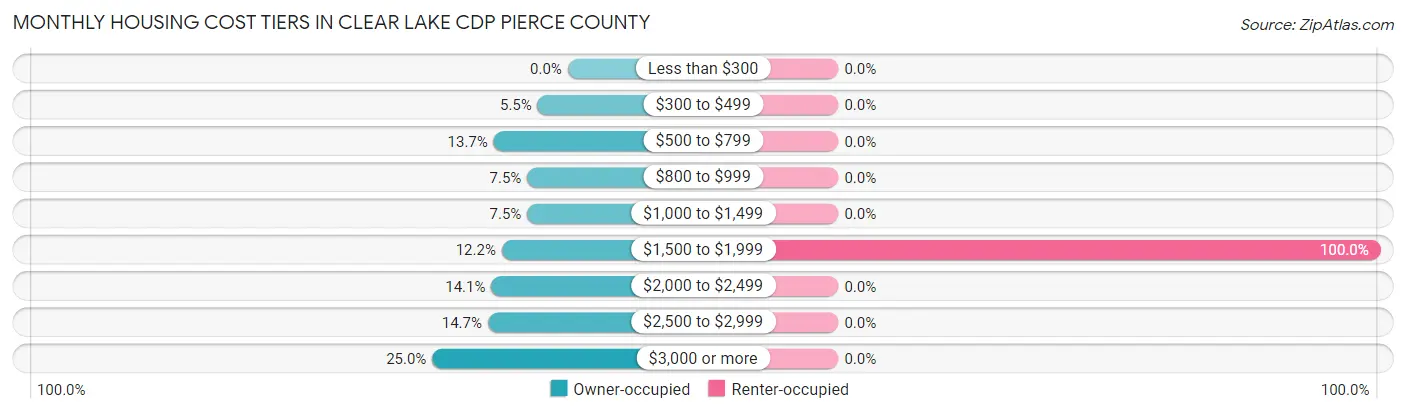
| Monthly Cost | Owner-occupied | Renter-occupied |
| Less than $300 | 0 (0.0%) | 0 (0.0%) |
| $300 to $499 | 26 (5.5%) | 0 (0.0%) |
| $500 to $799 | 64 (13.7%) | 0 (0.0%) |
| $800 to $999 | 35 (7.5%) | 0 (0.0%) |
| $1,000 to $1,499 | 35 (7.5%) | 0 (0.0%) |
| $1,500 to $1,999 | 57 (12.1%) | 7 (100.0%) |
| $2,000 to $2,499 | 66 (14.1%) | 0 (0.0%) |
| $2,500 to $2,999 | 69 (14.7%) | 0 (0.0%) |
| $3,000 or more | 117 (24.9%) | 0 (0.0%) |
| Total | 469 (100.0%) | 7 (100.0%) |
Physical Housing Characteristics in Clear Lake CDP Pierce County
Housing Structures in Clear Lake CDP Pierce County
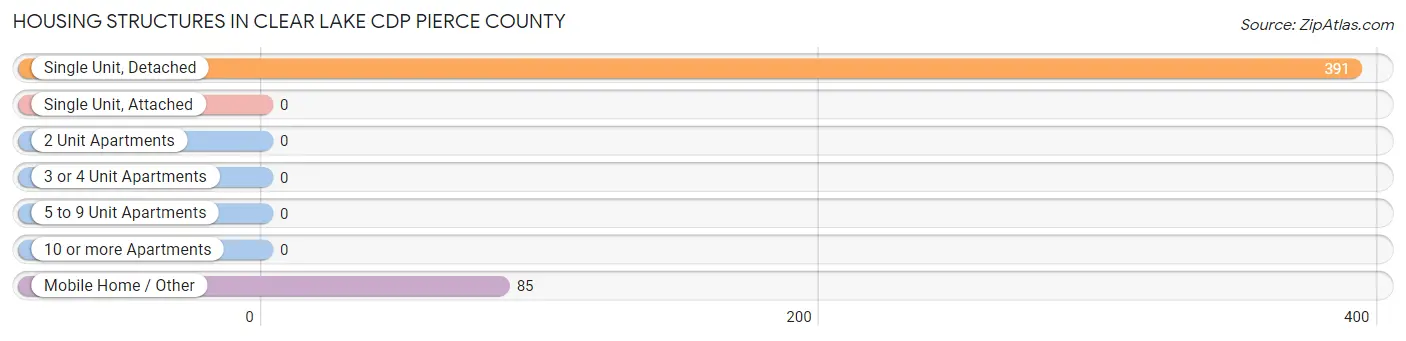
| Structure Type | # Housing Units | % Housing Units |
| Single Unit, Detached | 391 | 82.1% |
| Single Unit, Attached | 0 | 0.0% |
| 2 Unit Apartments | 0 | 0.0% |
| 3 or 4 Unit Apartments | 0 | 0.0% |
| 5 to 9 Unit Apartments | 0 | 0.0% |
| 10 or more Apartments | 0 | 0.0% |
| Mobile Home / Other | 85 | 17.9% |
| Total | 476 | 100.0% |
Housing Structures by Occupancy in Clear Lake CDP Pierce County
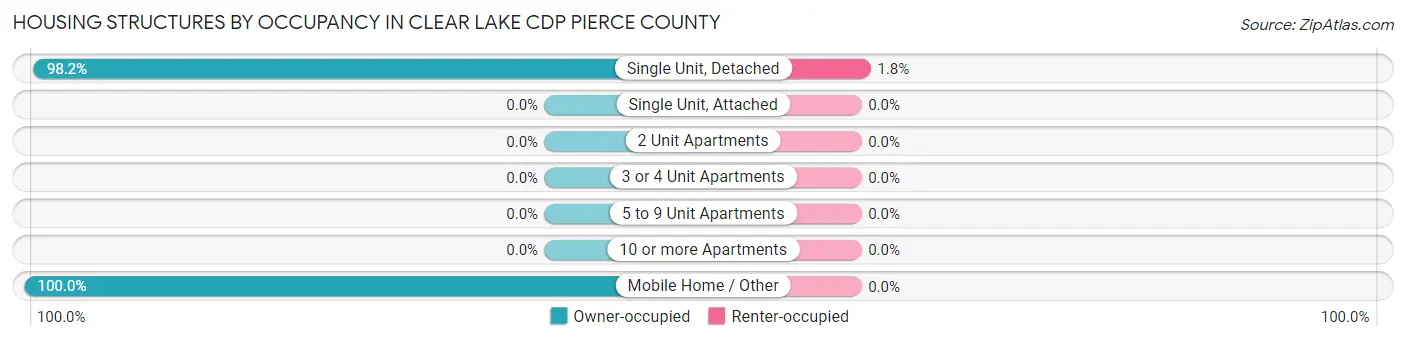
| Structure Type | Owner-occupied | Renter-occupied |
| Single Unit, Detached | 384 (98.2%) | 7 (1.8%) |
| Single Unit, Attached | 0 (0.0%) | 0 (0.0%) |
| 2 Unit Apartments | 0 (0.0%) | 0 (0.0%) |
| 3 or 4 Unit Apartments | 0 (0.0%) | 0 (0.0%) |
| 5 to 9 Unit Apartments | 0 (0.0%) | 0 (0.0%) |
| 10 or more Apartments | 0 (0.0%) | 0 (0.0%) |
| Mobile Home / Other | 85 (100.0%) | 0 (0.0%) |
| Total | 469 (98.5%) | 7 (1.5%) |
Housing Structures by Number of Rooms in Clear Lake CDP Pierce County
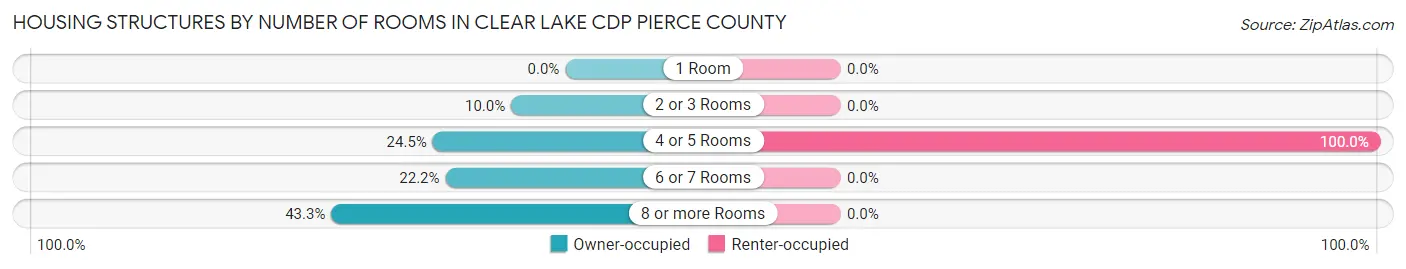
| Number of Rooms | Owner-occupied | Renter-occupied |
| 1 Room | 0 (0.0%) | 0 (0.0%) |
| 2 or 3 Rooms | 47 (10.0%) | 0 (0.0%) |
| 4 or 5 Rooms | 115 (24.5%) | 7 (100.0%) |
| 6 or 7 Rooms | 104 (22.2%) | 0 (0.0%) |
| 8 or more Rooms | 203 (43.3%) | 0 (0.0%) |
| Total | 469 (100.0%) | 7 (100.0%) |
Housing Structure by Heating Type in Clear Lake CDP Pierce County
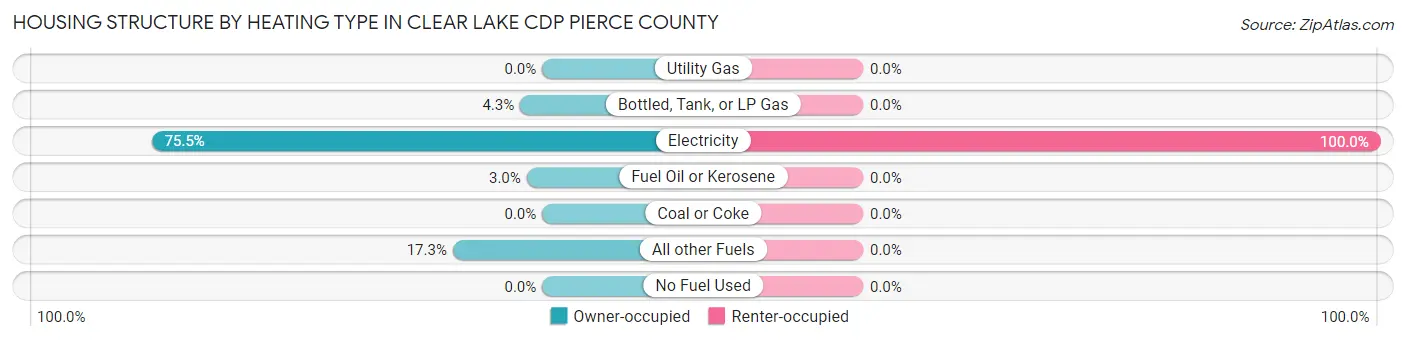
| Heating Type | Owner-occupied | Renter-occupied |
| Utility Gas | 0 (0.0%) | 0 (0.0%) |
| Bottled, Tank, or LP Gas | 20 (4.3%) | 0 (0.0%) |
| Electricity | 354 (75.5%) | 7 (100.0%) |
| Fuel Oil or Kerosene | 14 (3.0%) | 0 (0.0%) |
| Coal or Coke | 0 (0.0%) | 0 (0.0%) |
| All other Fuels | 81 (17.3%) | 0 (0.0%) |
| No Fuel Used | 0 (0.0%) | 0 (0.0%) |
| Total | 469 (100.0%) | 7 (100.0%) |
Household Vehicle Usage in Clear Lake CDP Pierce County
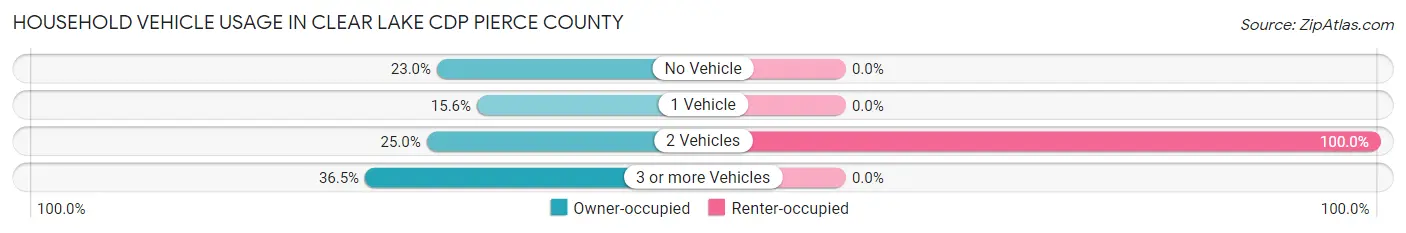
| Vehicles per Household | Owner-occupied | Renter-occupied |
| No Vehicle | 108 (23.0%) | 0 (0.0%) |
| 1 Vehicle | 73 (15.6%) | 0 (0.0%) |
| 2 Vehicles | 117 (24.9%) | 7 (100.0%) |
| 3 or more Vehicles | 171 (36.5%) | 0 (0.0%) |
| Total | 469 (100.0%) | 7 (100.0%) |
Real Estate & Mortgages in Clear Lake CDP Pierce County
Real Estate and Mortgage Overview in Clear Lake CDP Pierce County
| Characteristic | Without Mortgage | With Mortgage |
| Housing Units | 95 | 374 |
| Median Property Value | $485,900 | $586,400 |
| Median Household Income | $65,417 | $80 |
| Monthly Housing Costs | $683 | $117 |
| Real Estate Taxes | $5,313 | $0 |
Property Value by Mortgage Status in Clear Lake CDP Pierce County
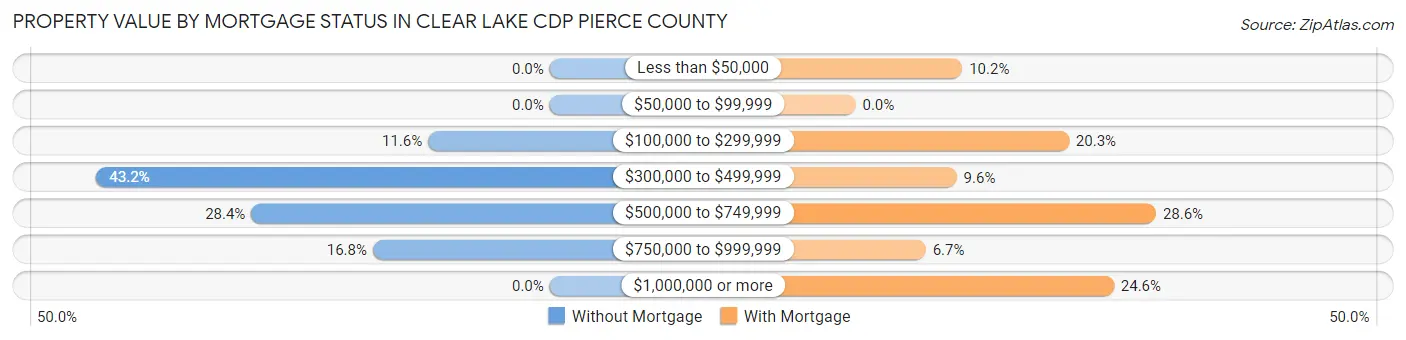
| Property Value | Without Mortgage | With Mortgage |
| Less than $50,000 | 0 (0.0%) | 38 (10.2%) |
| $50,000 to $99,999 | 0 (0.0%) | 0 (0.0%) |
| $100,000 to $299,999 | 11 (11.6%) | 76 (20.3%) |
| $300,000 to $499,999 | 41 (43.2%) | 36 (9.6%) |
| $500,000 to $749,999 | 27 (28.4%) | 107 (28.6%) |
| $750,000 to $999,999 | 16 (16.8%) | 25 (6.7%) |
| $1,000,000 or more | 0 (0.0%) | 92 (24.6%) |
| Total | 95 (100.0%) | 374 (100.0%) |
Household Income by Mortgage Status in Clear Lake CDP Pierce County
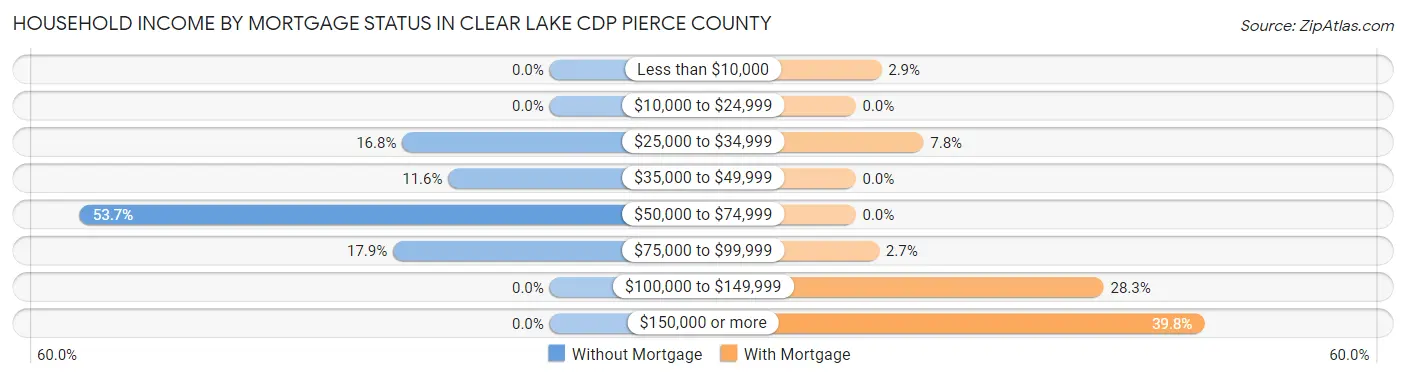
| Household Income | Without Mortgage | With Mortgage |
| Less than $10,000 | 0 (0.0%) | 11 (2.9%) |
| $10,000 to $24,999 | 0 (0.0%) | 0 (0.0%) |
| $25,000 to $34,999 | 16 (16.8%) | 29 (7.7%) |
| $35,000 to $49,999 | 11 (11.6%) | 0 (0.0%) |
| $50,000 to $74,999 | 51 (53.7%) | 0 (0.0%) |
| $75,000 to $99,999 | 17 (17.9%) | 10 (2.7%) |
| $100,000 to $149,999 | 0 (0.0%) | 106 (28.3%) |
| $150,000 or more | 0 (0.0%) | 149 (39.8%) |
| Total | 95 (100.0%) | 374 (100.0%) |
Property Value to Household Income Ratio in Clear Lake CDP Pierce County
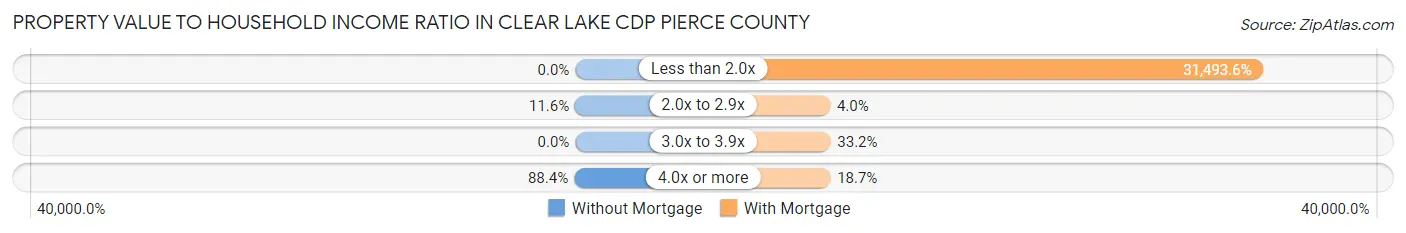
| Value-to-Income Ratio | Without Mortgage | With Mortgage |
| Less than 2.0x | 0 (0.0%) | 117,786 (31,493.6%) |
| 2.0x to 2.9x | 11 (11.6%) | 15 (4.0%) |
| 3.0x to 3.9x | 0 (0.0%) | 124 (33.2%) |
| 4.0x or more | 84 (88.4%) | 70 (18.7%) |
| Total | 95 (100.0%) | 374 (100.0%) |
Real Estate Taxes by Mortgage Status in Clear Lake CDP Pierce County
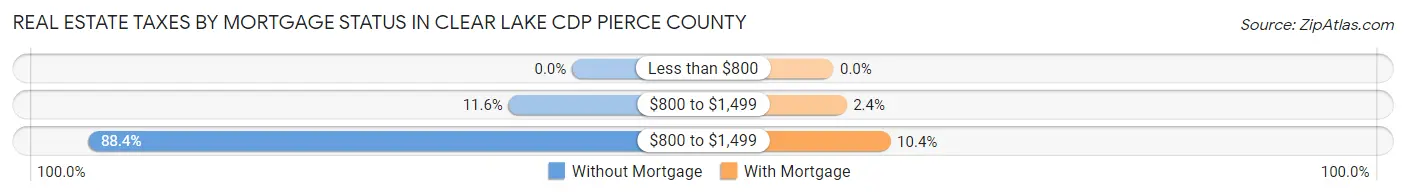
| Property Taxes | Without Mortgage | With Mortgage |
| Less than $800 | 0 (0.0%) | 0 (0.0%) |
| $800 to $1,499 | 11 (11.6%) | 9 (2.4%) |
| $800 to $1,499 | 84 (88.4%) | 39 (10.4%) |
| Total | 95 (100.0%) | 374 (100.0%) |
Health & Disability in Clear Lake CDP Pierce County
Health Insurance Coverage by Age in Clear Lake CDP Pierce County
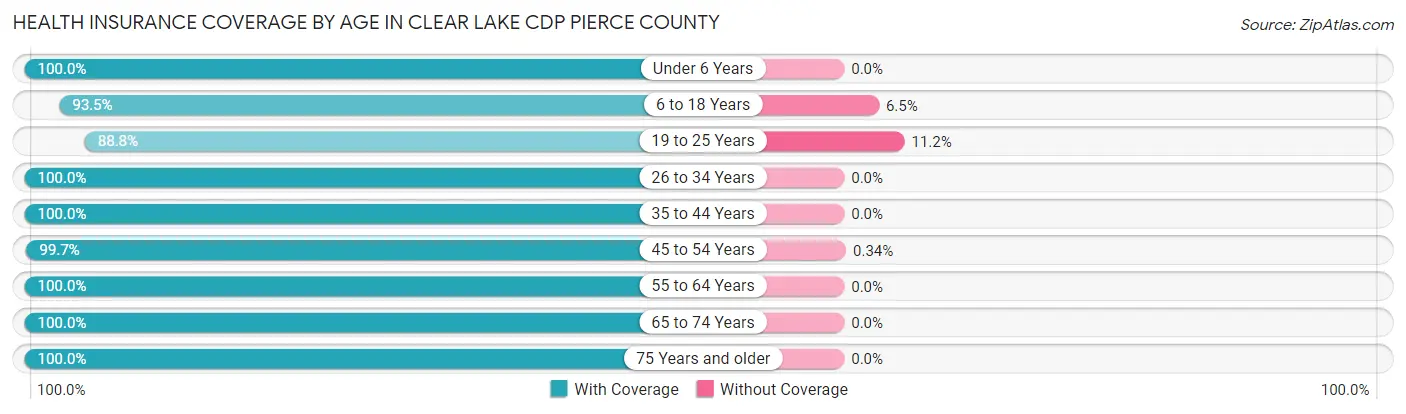
| Age Bracket | With Coverage | Without Coverage |
| Under 6 Years | 56 (100.0%) | 0 (0.0%) |
| 6 to 18 Years | 260 (93.5%) | 18 (6.5%) |
| 19 to 25 Years | 79 (88.8%) | 10 (11.2%) |
| 26 to 34 Years | 55 (100.0%) | 0 (0.0%) |
| 35 to 44 Years | 101 (100.0%) | 0 (0.0%) |
| 45 to 54 Years | 295 (99.7%) | 1 (0.3%) |
| 55 to 64 Years | 96 (100.0%) | 0 (0.0%) |
| 65 to 74 Years | 120 (100.0%) | 0 (0.0%) |
| 75 Years and older | 66 (100.0%) | 0 (0.0%) |
| Total | 1,128 (97.5%) | 29 (2.5%) |
Health Insurance Coverage by Citizenship Status in Clear Lake CDP Pierce County
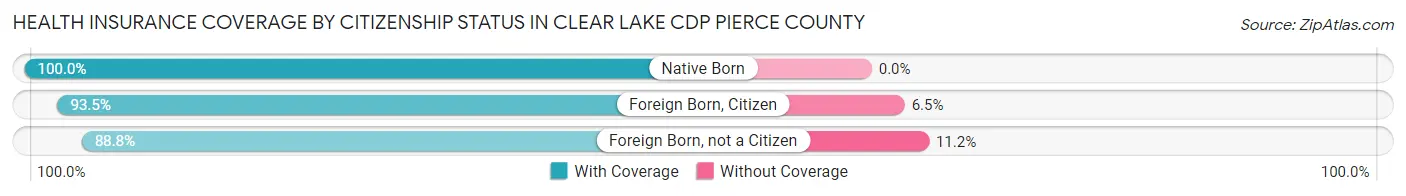
| Citizenship Status | With Coverage | Without Coverage |
| Native Born | 56 (100.0%) | 0 (0.0%) |
| Foreign Born, Citizen | 260 (93.5%) | 18 (6.5%) |
| Foreign Born, not a Citizen | 79 (88.8%) | 10 (11.2%) |
Health Insurance Coverage by Household Income in Clear Lake CDP Pierce County
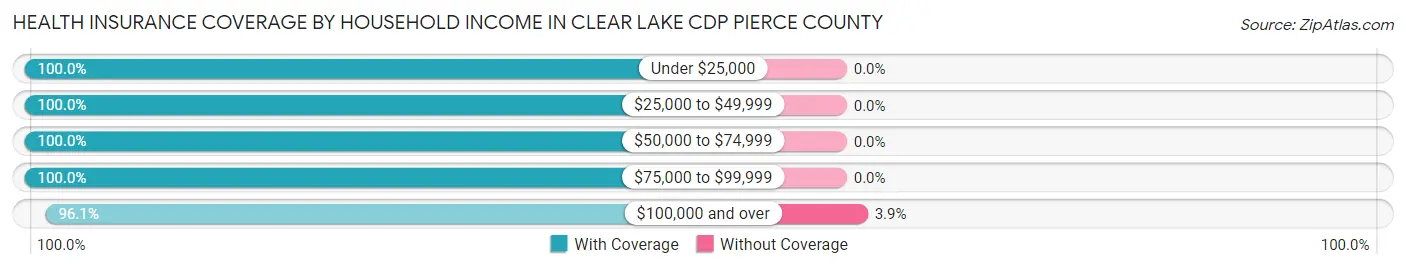
| Household Income | With Coverage | Without Coverage |
| Under $25,000 | 29 (100.0%) | 0 (0.0%) |
| $25,000 to $49,999 | 52 (100.0%) | 0 (0.0%) |
| $50,000 to $74,999 | 76 (100.0%) | 0 (0.0%) |
| $75,000 to $99,999 | 282 (100.0%) | 0 (0.0%) |
| $100,000 and over | 686 (96.1%) | 28 (3.9%) |
Public vs Private Health Insurance Coverage by Age in Clear Lake CDP Pierce County
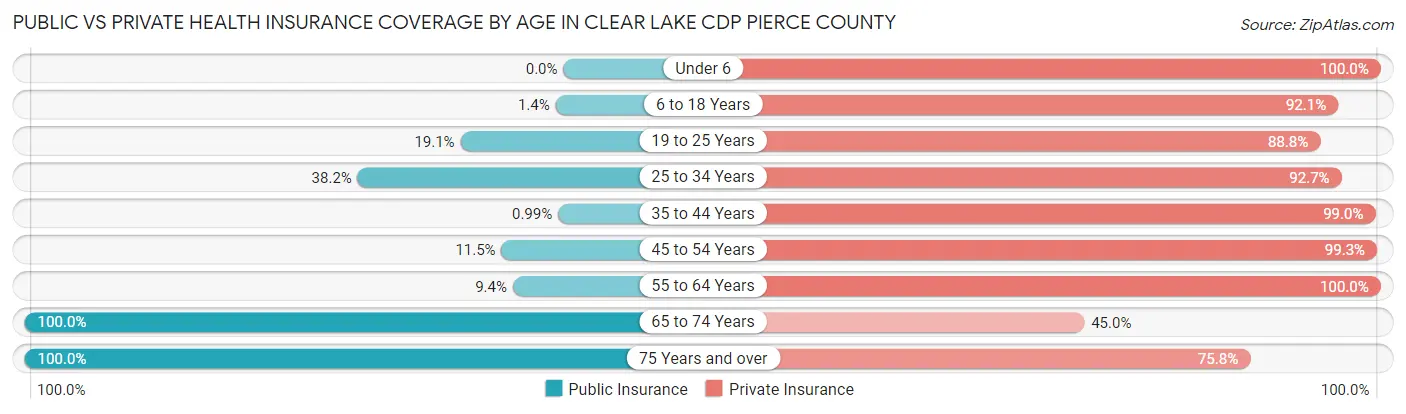
| Age Bracket | Public Insurance | Private Insurance |
| Under 6 | 0 (0.0%) | 56 (100.0%) |
| 6 to 18 Years | 4 (1.4%) | 256 (92.1%) |
| 19 to 25 Years | 17 (19.1%) | 79 (88.8%) |
| 25 to 34 Years | 21 (38.2%) | 51 (92.7%) |
| 35 to 44 Years | 1 (1.0%) | 100 (99.0%) |
| 45 to 54 Years | 34 (11.5%) | 294 (99.3%) |
| 55 to 64 Years | 9 (9.4%) | 96 (100.0%) |
| 65 to 74 Years | 120 (100.0%) | 54 (45.0%) |
| 75 Years and over | 66 (100.0%) | 50 (75.8%) |
| Total | 272 (23.5%) | 1,036 (89.5%) |
Disability Status by Sex by Age in Clear Lake CDP Pierce County
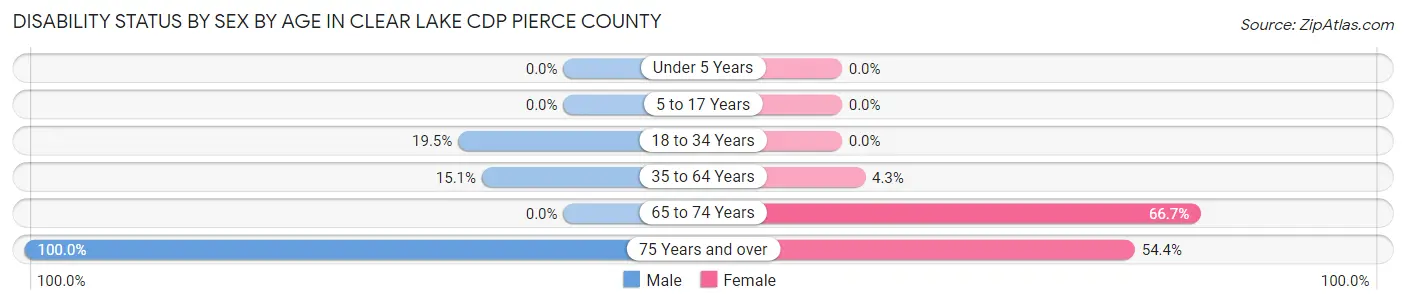
| Age Bracket | Male | Female |
| Under 5 Years | 0 (0.0%) | 0 (0.0%) |
| 5 to 17 Years | 0 (0.0%) | 0 (0.0%) |
| 18 to 34 Years | 17 (19.5%) | 0 (0.0%) |
| 35 to 64 Years | 36 (15.1%) | 11 (4.3%) |
| 65 to 74 Years | 0 (0.0%) | 54 (66.7%) |
| 75 Years and over | 9 (100.0%) | 31 (54.4%) |
Disability Class by Sex by Age in Clear Lake CDP Pierce County
Disability Class: Hearing Difficulty
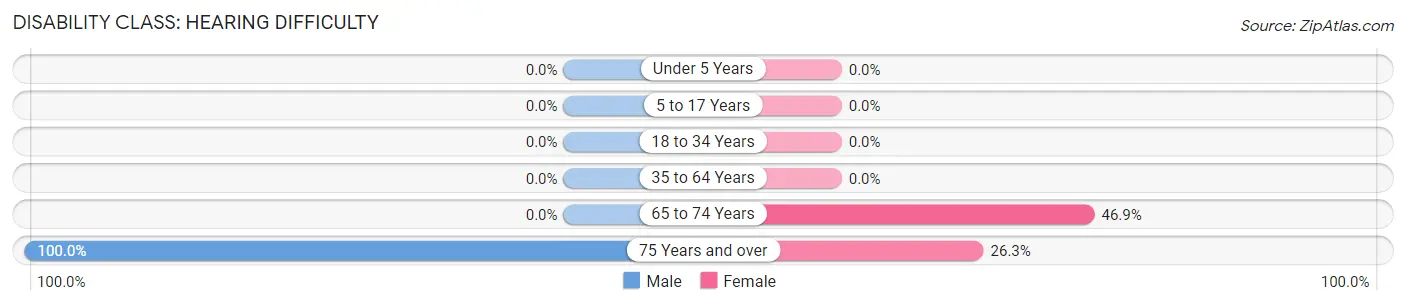
| Age Bracket | Male | Female |
| Under 5 Years | 0 (0.0%) | 0 (0.0%) |
| 5 to 17 Years | 0 (0.0%) | 0 (0.0%) |
| 18 to 34 Years | 0 (0.0%) | 0 (0.0%) |
| 35 to 64 Years | 0 (0.0%) | 0 (0.0%) |
| 65 to 74 Years | 0 (0.0%) | 38 (46.9%) |
| 75 Years and over | 9 (100.0%) | 15 (26.3%) |
Disability Class: Vision Difficulty
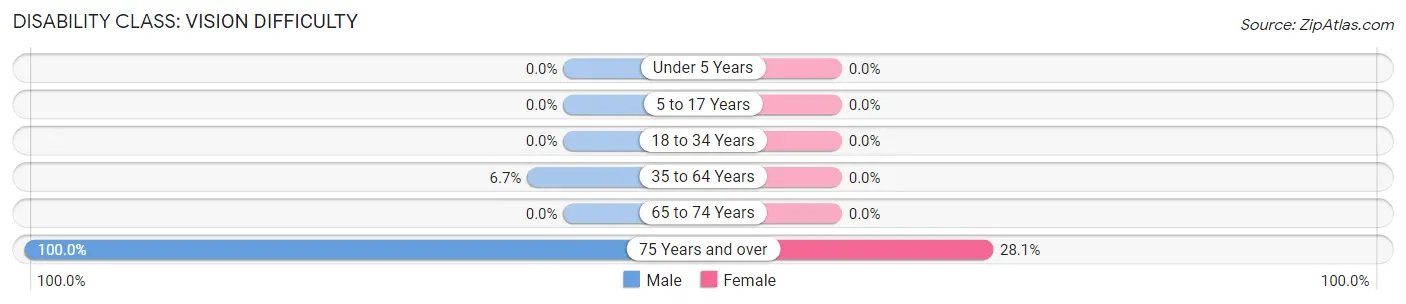
| Age Bracket | Male | Female |
| Under 5 Years | 0 (0.0%) | 0 (0.0%) |
| 5 to 17 Years | 0 (0.0%) | 0 (0.0%) |
| 18 to 34 Years | 0 (0.0%) | 0 (0.0%) |
| 35 to 64 Years | 16 (6.7%) | 0 (0.0%) |
| 65 to 74 Years | 0 (0.0%) | 0 (0.0%) |
| 75 Years and over | 9 (100.0%) | 16 (28.1%) |
Disability Class: Cognitive Difficulty
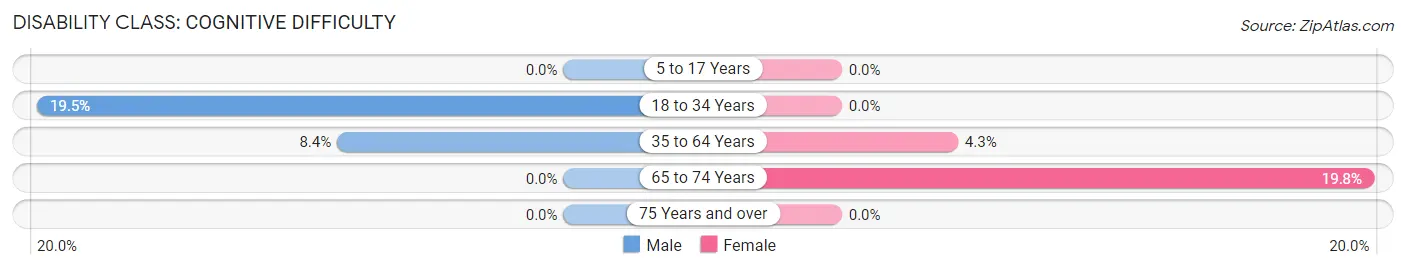
| Age Bracket | Male | Female |
| 5 to 17 Years | 0 (0.0%) | 0 (0.0%) |
| 18 to 34 Years | 17 (19.5%) | 0 (0.0%) |
| 35 to 64 Years | 20 (8.4%) | 11 (4.3%) |
| 65 to 74 Years | 0 (0.0%) | 16 (19.8%) |
| 75 Years and over | 0 (0.0%) | 0 (0.0%) |
Disability Class: Ambulatory Difficulty
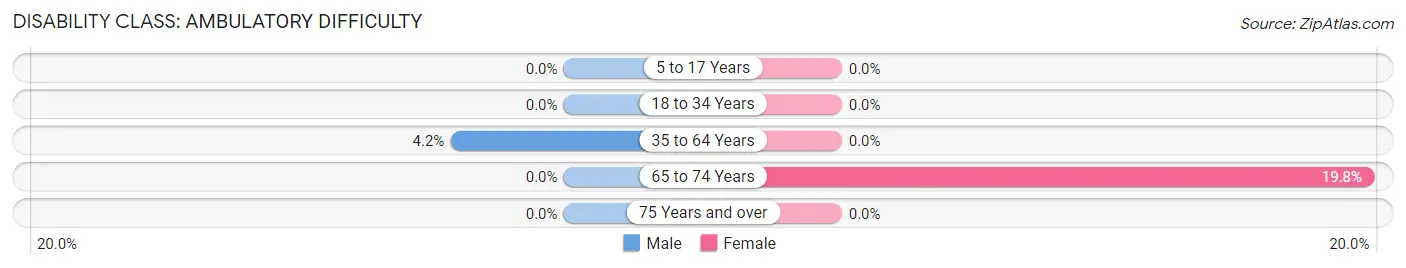
| Age Bracket | Male | Female |
| 5 to 17 Years | 0 (0.0%) | 0 (0.0%) |
| 18 to 34 Years | 0 (0.0%) | 0 (0.0%) |
| 35 to 64 Years | 10 (4.2%) | 0 (0.0%) |
| 65 to 74 Years | 0 (0.0%) | 16 (19.8%) |
| 75 Years and over | 0 (0.0%) | 0 (0.0%) |
Disability Class: Self-Care Difficulty
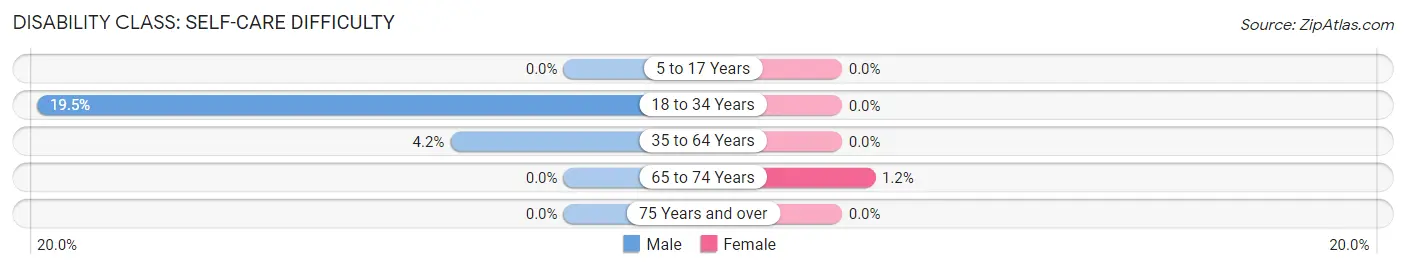
| Age Bracket | Male | Female |
| 5 to 17 Years | 0 (0.0%) | 0 (0.0%) |
| 18 to 34 Years | 17 (19.5%) | 0 (0.0%) |
| 35 to 64 Years | 10 (4.2%) | 0 (0.0%) |
| 65 to 74 Years | 0 (0.0%) | 1 (1.2%) |
| 75 Years and over | 0 (0.0%) | 0 (0.0%) |
Technology Access in Clear Lake CDP Pierce County
Computing Device Access in Clear Lake CDP Pierce County
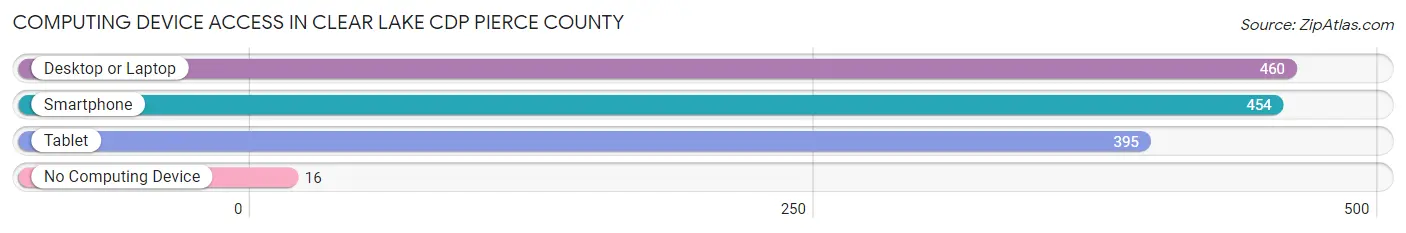
| Device Type | # Households | % Households |
| Desktop or Laptop | 460 | 96.6% |
| Smartphone | 454 | 95.4% |
| Tablet | 395 | 83.0% |
| No Computing Device | 16 | 3.4% |
| Total | 476 | 100.0% |
Internet Access in Clear Lake CDP Pierce County
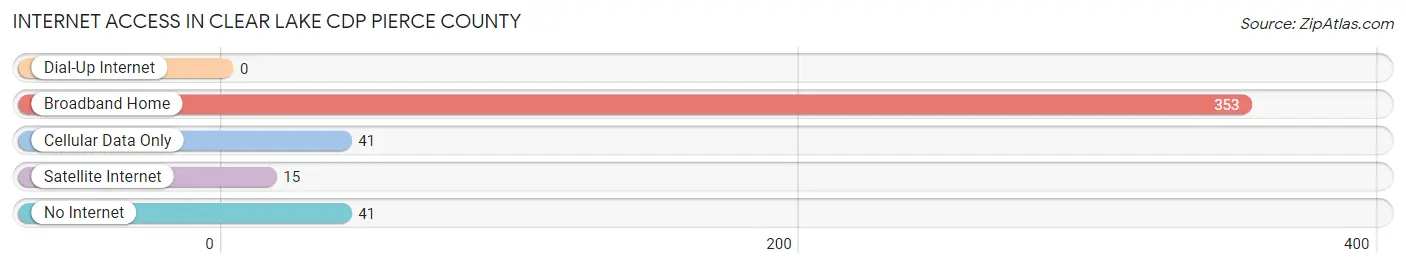
| Internet Type | # Households | % Households |
| Dial-Up Internet | 0 | 0.0% |
| Broadband Home | 353 | 74.2% |
| Cellular Data Only | 41 | 8.6% |
| Satellite Internet | 15 | 3.2% |
| No Internet | 41 | 8.6% |
| Total | 476 | 100.0% |
Clear Lake CDP Pierce County Summary
Introduction
Clear Lake Cdp is a census-designated place (CDP) located in Pierce County, Washington. It is located in the foothills of the Cascade Mountains, about 25 miles south of Tacoma and about 30 miles east of Seattle. The population of Clear Lake Cdp was 1,845 at the 2010 census.
History
The area that is now Clear Lake Cdp was first settled in the late 1800s by homesteaders. The first post office was established in 1891 and the town was officially incorporated in 1909. The town was named after Clear Lake, which is located nearby.
The area was primarily a logging and farming community until the 1950s, when the population began to grow due to the influx of people from the Seattle area. The population continued to grow throughout the 1960s and 1970s, and the town was eventually annexed by Pierce County in 1978.
Geography
Clear Lake Cdp is located in the foothills of the Cascade Mountains, about 25 miles south of Tacoma and about 30 miles east of Seattle. The area is mostly rural, with rolling hills and forests. The Clear Lake Cdp is bordered by the towns of Buckley, Wilkeson, and Carbonado.
The climate in Clear Lake Cdp is mild and temperate, with warm summers and cool winters. The average annual temperature is around 50 degrees Fahrenheit.
Economy
The economy of Clear Lake Cdp is primarily based on agriculture and forestry. The area is home to several farms, as well as a number of logging companies. The town also has a few small businesses, including a grocery store, a hardware store, and a few restaurants.
Demographics
As of the 2010 census, the population of Clear Lake Cdp was 1,845. The racial makeup of the town was 94.3% White, 0.7% African American, 0.7% Native American, 0.7% Asian, 0.2% Pacific Islander, and 2.6% from other races. The median household income was $50,938, and the median family income was $58,938.
Conclusion
Clear Lake Cdp is a small, rural community located in Pierce County, Washington. The area is mostly agricultural and forestry-based, and the population is primarily white. The town has a few small businesses, and the median household income is slightly above the state average.
Common Questions
What is Per Capita Income in Clear Lake CDP Pierce County?
Per Capita income in Clear Lake CDP Pierce County is $43,992.
What is the Median Family Income in Clear Lake CDP Pierce County?
Median Family Income in Clear Lake CDP Pierce County is $113,828.
What is the Median Household income in Clear Lake CDP Pierce County?
Median Household Income in Clear Lake CDP Pierce County is $94,755.
What is Income or Wage Gap in Clear Lake CDP Pierce County?
Income or Wage Gap in Clear Lake CDP Pierce County is 30.2%.
Women in Clear Lake CDP Pierce County earn 69.8 cents for every dollar earned by a man.
What is Inequality or Gini Index in Clear Lake CDP Pierce County?
Inequality or Gini Index in Clear Lake CDP Pierce County is 0.27.
What is the Total Population of Clear Lake CDP Pierce County?
Total Population of Clear Lake CDP Pierce County is 1,157.
What is the Total Male Population of Clear Lake CDP Pierce County?
Total Male Population of Clear Lake CDP Pierce County is 584.
What is the Total Female Population of Clear Lake CDP Pierce County?
Total Female Population of Clear Lake CDP Pierce County is 573.
What is the Ratio of Males per 100 Females in Clear Lake CDP Pierce County?
There are 101.92 Males per 100 Females in Clear Lake CDP Pierce County.
What is the Ratio of Females per 100 Males in Clear Lake CDP Pierce County?
There are 98.12 Females per 100 Males in Clear Lake CDP Pierce County.
What is the Median Population Age in Clear Lake CDP Pierce County?
Median Population Age in Clear Lake CDP Pierce County is 45.0 Years.
What is the Average Family Size in Clear Lake CDP Pierce County
Average Family Size in Clear Lake CDP Pierce County is 3.0 People.
What is the Average Household Size in Clear Lake CDP Pierce County
Average Household Size in Clear Lake CDP Pierce County is 2.4 People.
How Large is the Labor Force in Clear Lake CDP Pierce County?
There are 585 People in the Labor Forcein in Clear Lake CDP Pierce County.
What is the Percentage of People in the Labor Force in Clear Lake CDP Pierce County?
65.0% of People are in the Labor Force in Clear Lake CDP Pierce County.
What is the Unemployment Rate in Clear Lake CDP Pierce County?
Unemployment Rate in Clear Lake CDP Pierce County is 6.0%.