Zip Codes with the Highest Percentage of Population Employed in Security & Protection in Snohomish, WA
RELATED REPORTS & OPTIONS
Security & Protection
Snohomish
Compare Zip Codes
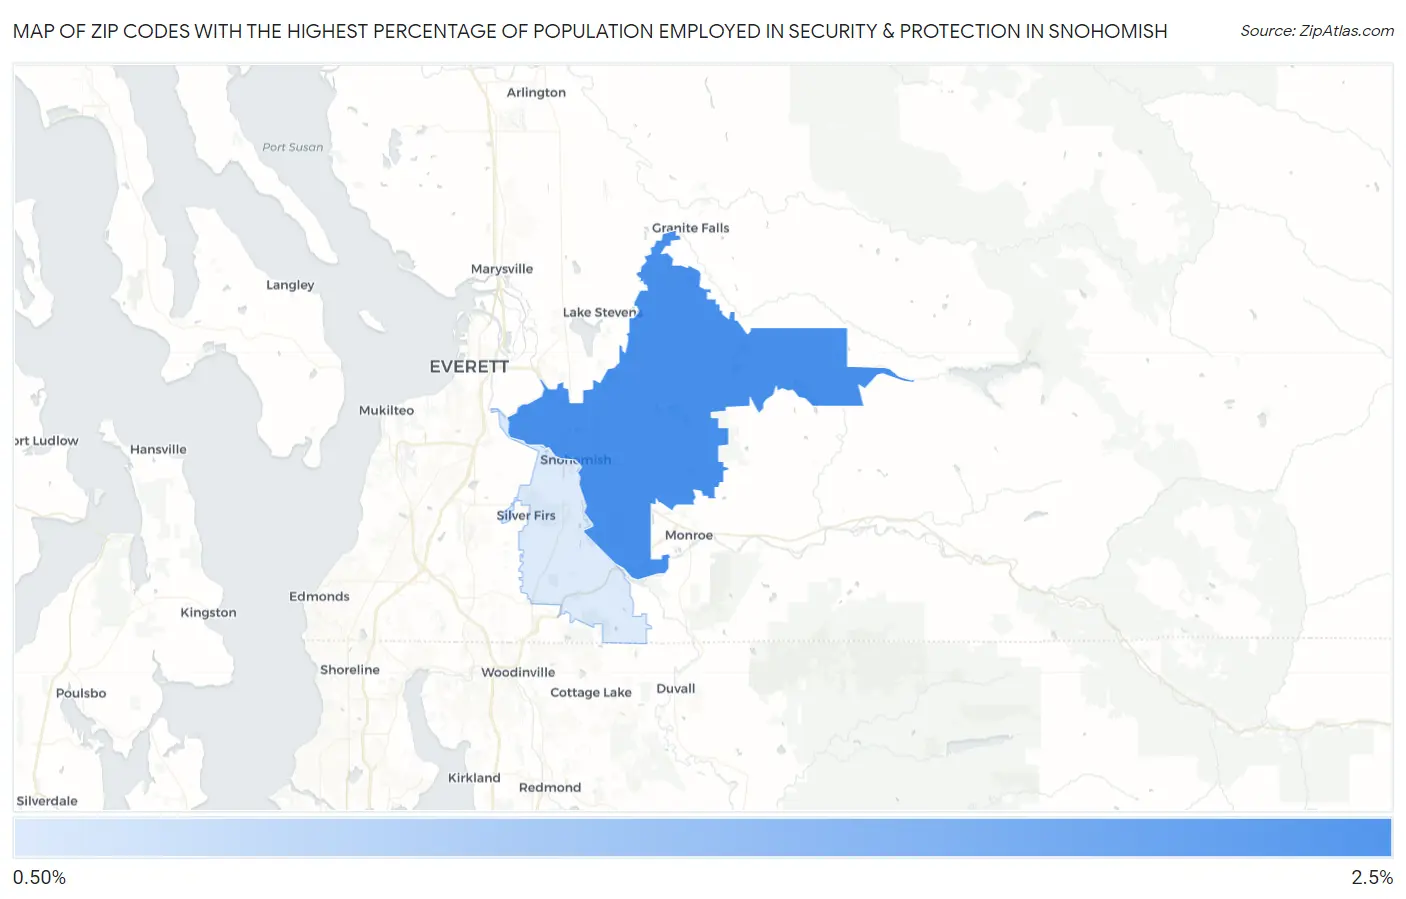
Map of Zip Codes with the Highest Percentage of Population Employed in Security & Protection in Snohomish
1.4%
2.0%
Zip Codes with the Highest Percentage of Population Employed in Security & Protection in Snohomish, WA
| Zip Code | % Employed | vs State | vs National | |
| 1. | 98290 | 2.0% | 1.8%(+0.229)#223 | 2.1%(-0.106)#12,296 |
| 2. | 98296 | 1.4% | 1.8%(-0.370)#323 | 2.1%(-0.705)#16,638 |
1
Common Questions
What are the Top Zip Codes with the Highest Percentage of Population Employed in Security & Protection in Snohomish, WA?
Top Zip Codes with the Highest Percentage of Population Employed in Security & Protection in Snohomish, WA are:
What zip code has the Highest Percentage of Population Employed in Security & Protection in Snohomish, WA?
98290 has the Highest Percentage of Population Employed in Security & Protection in Snohomish, WA with 2.0%.
What is the Percentage of Population Employed in Security & Protection in Snohomish, WA?
Percentage of Population Employed in Security & Protection in Snohomish is 4.1%.
What is the Percentage of Population Employed in Security & Protection in Washington?
Percentage of Population Employed in Security & Protection in Washington is 1.8%.
What is the Percentage of Population Employed in Security & Protection in the United States?
Percentage of Population Employed in Security & Protection in the United States is 2.1%.