Blaine, WA Map & Demographics
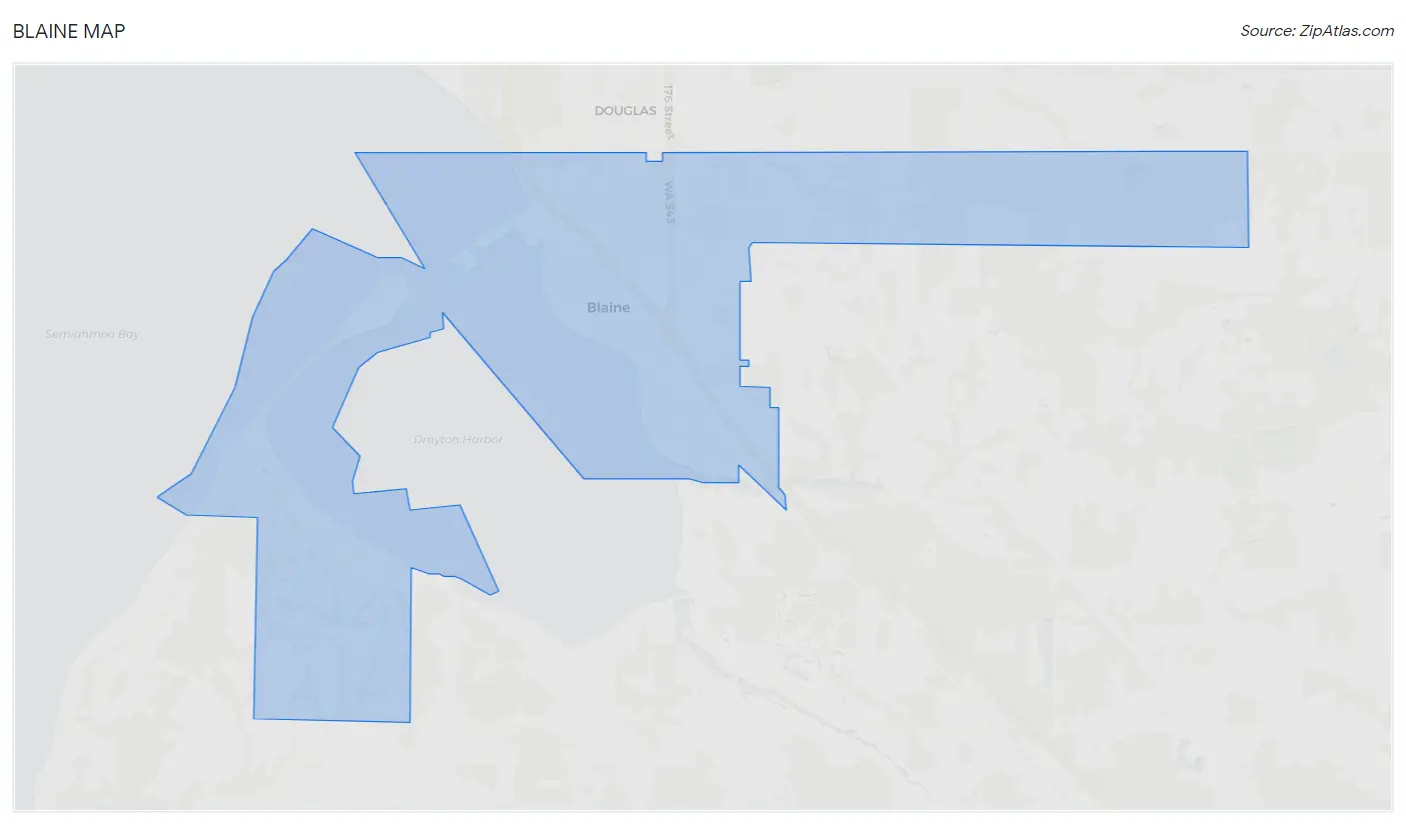
Blaine Map
Blaine Overview
$37,061
PER CAPITA INCOME
$82,616
AVG FAMILY INCOME
$78,633
AVG HOUSEHOLD INCOME
42.2%
WAGE / INCOME GAP [ % ]
57.8¢/ $1
WAGE / INCOME GAP [ $ ]
0.42
INEQUALITY / GINI INDEX
5,865
TOTAL POPULATION
2,833
MALE POPULATION
3,032
FEMALE POPULATION
93.44
MALES / 100 FEMALES
107.02
FEMALES / 100 MALES
38.1
MEDIAN AGE
3.1
AVG FAMILY SIZE
2.5
AVG HOUSEHOLD SIZE
2,553
LABOR FORCE [ PEOPLE ]
54.0%
PERCENT IN LABOR FORCE
9.7%
UNEMPLOYMENT RATE
Blaine Zip Codes
Blaine Area Codes
Income in Blaine
Income Overview in Blaine
Per Capita Income in Blaine is $37,061, while median incomes of families and households are $82,616 and $78,633 respectively.
| Characteristic | Number | Measure |
| Per Capita Income | 5,865 | $37,061 |
| Median Family Income | 1,356 | $82,616 |
| Mean Family Income | 1,356 | $102,425 |
| Median Household Income | 2,329 | $78,633 |
| Mean Household Income | 2,329 | $92,657 |
| Income Deficit | 1,356 | $0 |
| Wage / Income Gap (%) | 5,865 | 42.24% |
| Wage / Income Gap ($) | 5,865 | 57.76¢ per $1 |
| Gini / Inequality Index | 5,865 | 0.42 |
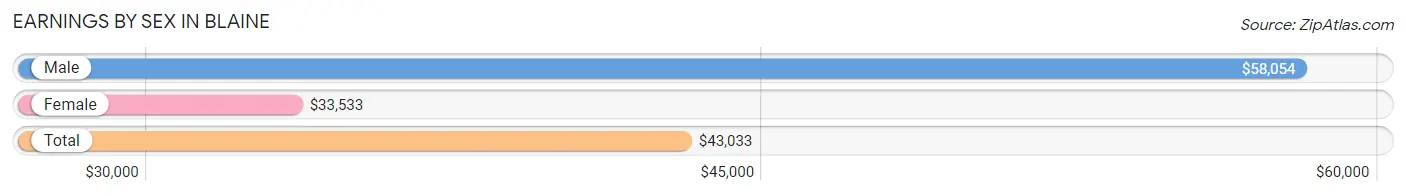
Earnings by Sex in Blaine
Average Earnings in Blaine are $43,033, $58,054 for men and $33,533 for women, a difference of 42.2%.
| Sex | Number | Average Earnings |
| Male | 1,393 (54.0%) | $58,054 |
| Female | 1,185 (46.0%) | $33,533 |
| Total | 2,578 (100.0%) | $43,033 |
Earnings by Sex by Income Bracket in Blaine
The most common earnings brackets in Blaine are $100,000+ for men (281 | 20.2%) and $30,000 to $34,999 for women (177 | 14.9%).
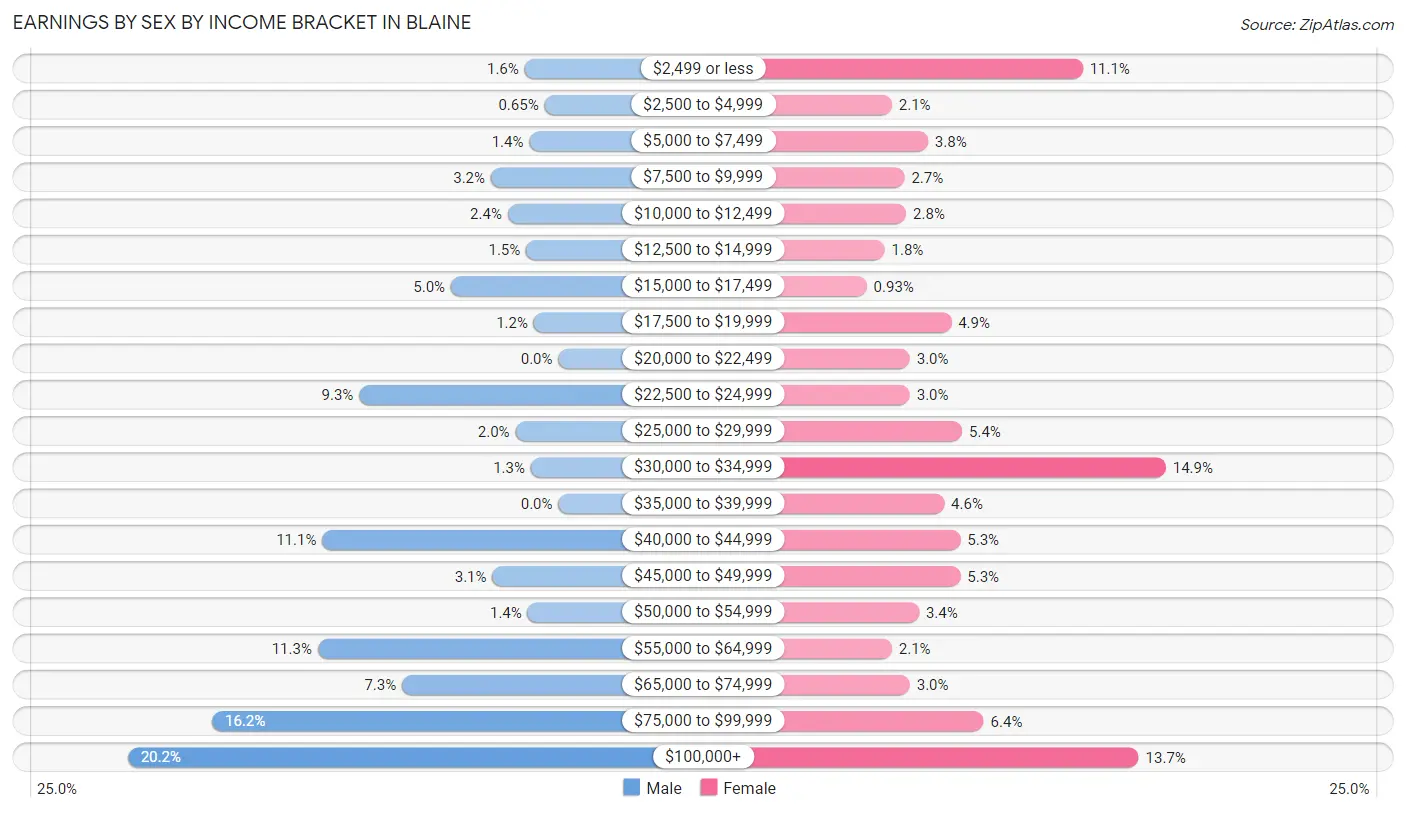
| Income | Male | Female |
| $2,499 or less | 22 (1.6%) | 131 (11.1%) |
| $2,500 to $4,999 | 9 (0.6%) | 25 (2.1%) |
| $5,000 to $7,499 | 19 (1.4%) | 45 (3.8%) |
| $7,500 to $9,999 | 44 (3.2%) | 32 (2.7%) |
| $10,000 to $12,499 | 33 (2.4%) | 33 (2.8%) |
| $12,500 to $14,999 | 21 (1.5%) | 21 (1.8%) |
| $15,000 to $17,499 | 70 (5.0%) | 11 (0.9%) |
| $17,500 to $19,999 | 16 (1.1%) | 58 (4.9%) |
| $20,000 to $22,499 | 0 (0.0%) | 35 (2.9%) |
| $22,500 to $24,999 | 130 (9.3%) | 35 (2.9%) |
| $25,000 to $29,999 | 28 (2.0%) | 64 (5.4%) |
| $30,000 to $34,999 | 18 (1.3%) | 177 (14.9%) |
| $35,000 to $39,999 | 0 (0.0%) | 54 (4.6%) |
| $40,000 to $44,999 | 154 (11.1%) | 63 (5.3%) |
| $45,000 to $49,999 | 43 (3.1%) | 63 (5.3%) |
| $50,000 to $54,999 | 20 (1.4%) | 40 (3.4%) |
| $55,000 to $64,999 | 157 (11.3%) | 25 (2.1%) |
| $65,000 to $74,999 | 102 (7.3%) | 35 (2.9%) |
| $75,000 to $99,999 | 226 (16.2%) | 76 (6.4%) |
| $100,000+ | 281 (20.2%) | 162 (13.7%) |
| Total | 1,393 (100.0%) | 1,185 (100.0%) |
Earnings by Sex by Educational Attainment in Blaine
Average earnings in Blaine are $68,333 for men and $35,833 for women, a difference of 47.6%. Men with an educational attainment of graduate degree enjoy the highest average annual earnings of $134,306, while those with high school diploma education earn the least with $55,625. Women with an educational attainment of bachelor's degree earn the most with the average annual earnings of $100,324, while those with high school diploma education have the smallest earnings of $28,021.
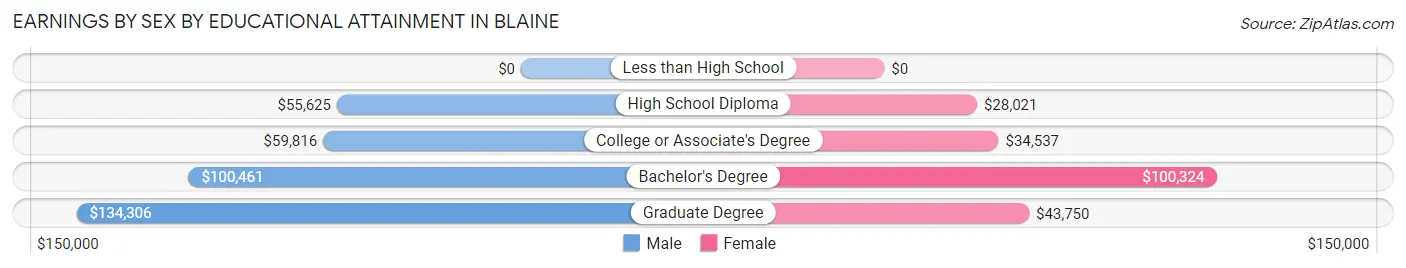
| Educational Attainment | Male Income | Female Income |
| Less than High School | - | - |
| High School Diploma | $55,625 | $28,021 |
| College or Associate's Degree | $59,816 | $34,537 |
| Bachelor's Degree | $100,461 | $100,324 |
| Graduate Degree | $134,306 | $43,750 |
| Total | $68,333 | $35,833 |
Family Income in Blaine
Family Income Brackets in Blaine
According to the Blaine family income data, there are 308 families falling into the $100,000 to $149,999 income range, which is the most common income bracket and makes up 22.7% of all families.
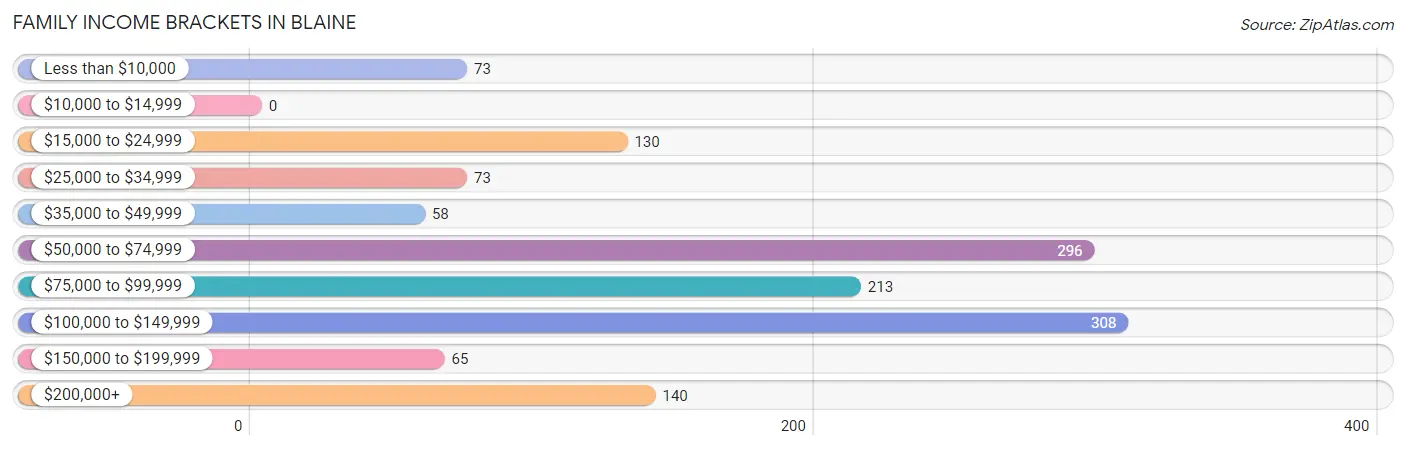
| Income Bracket | # Families | % Families |
| Less than $10,000 | 73 | 5.4% |
| $10,000 to $14,999 | 0 | 0.0% |
| $15,000 to $24,999 | 130 | 9.6% |
| $25,000 to $34,999 | 73 | 5.4% |
| $35,000 to $49,999 | 58 | 4.3% |
| $50,000 to $74,999 | 296 | 21.8% |
| $75,000 to $99,999 | 213 | 15.7% |
| $100,000 to $149,999 | 308 | 22.7% |
| $150,000 to $199,999 | 65 | 4.8% |
| $200,000+ | 140 | 10.3% |
Family Income by Famaliy Size in Blaine
3-person families (357 | 26.3%) account for the highest median family income in Blaine with $93,021 per family, while 2-person families (577 | 42.5%) have the highest median income of $41,614 per family member.
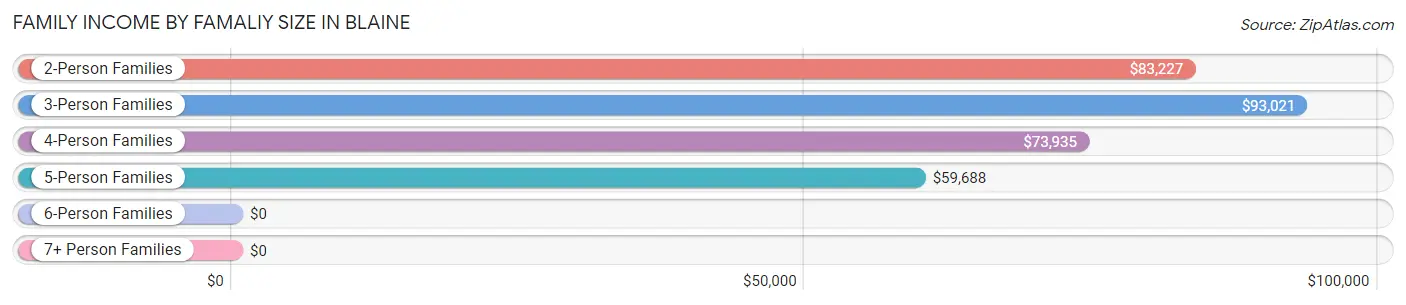
| Income Bracket | # Families | Median Income |
| 2-Person Families | 577 (42.5%) | $83,227 |
| 3-Person Families | 357 (26.3%) | $93,021 |
| 4-Person Families | 355 (26.2%) | $73,935 |
| 5-Person Families | 35 (2.6%) | $59,688 |
| 6-Person Families | 13 (1.0%) | $0 |
| 7+ Person Families | 19 (1.4%) | $0 |
| Total | 1,356 (100.0%) | $82,616 |
Family Income by Number of Earners in Blaine
The median family income in Blaine is $82,616, with families comprising 3+ earners (53) having the highest median family income of $127,841, while families with no earners (287) have the lowest median family income of $54,917, accounting for 3.9% and 21.2% of families, respectively.
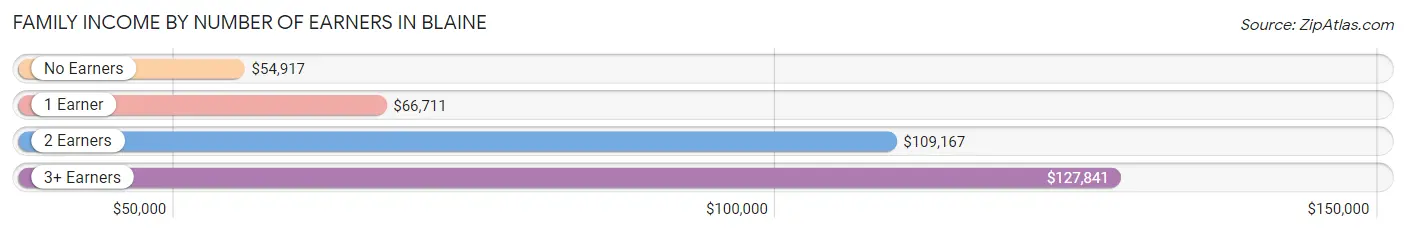
| Number of Earners | # Families | Median Income |
| No Earners | 287 (21.2%) | $54,917 |
| 1 Earner | 534 (39.4%) | $66,711 |
| 2 Earners | 482 (35.5%) | $109,167 |
| 3+ Earners | 53 (3.9%) | $127,841 |
| Total | 1,356 (100.0%) | $82,616 |
Household Income in Blaine
Household Income Brackets in Blaine
With 533 households falling in the category, the $100,000 to $149,999 income range is the most frequent in Blaine, accounting for 22.9% of all households. In contrast, only 84 households (3.6%) fall into the less than $10,000 income bracket, making it the least populous group.
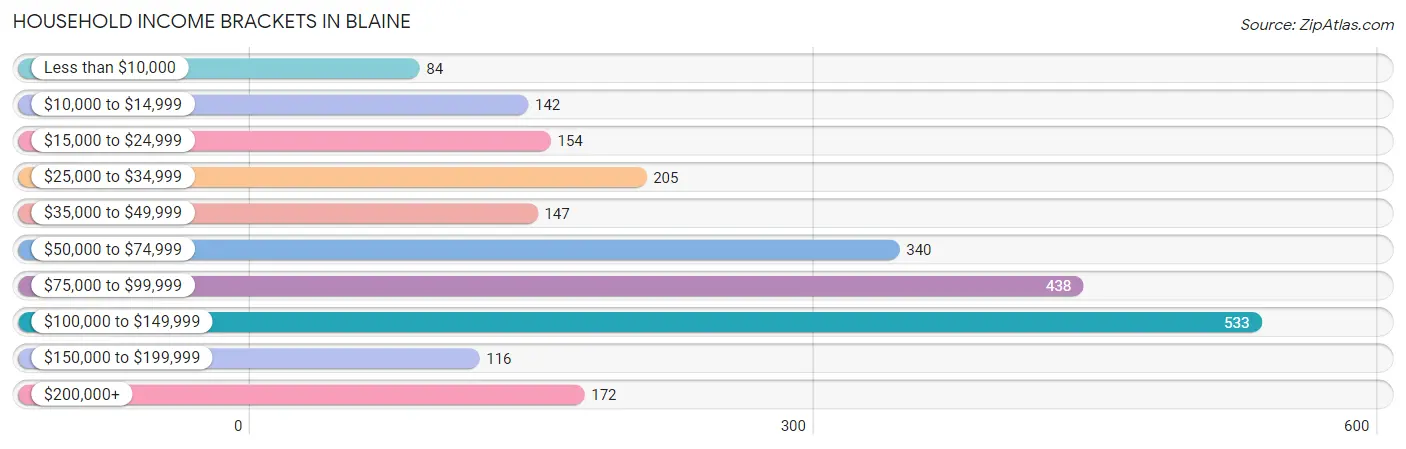
| Income Bracket | # Households | % Households |
| Less than $10,000 | 84 | 3.6% |
| $10,000 to $14,999 | 142 | 6.1% |
| $15,000 to $24,999 | 154 | 6.6% |
| $25,000 to $34,999 | 205 | 8.8% |
| $35,000 to $49,999 | 147 | 6.3% |
| $50,000 to $74,999 | 340 | 14.6% |
| $75,000 to $99,999 | 438 | 18.8% |
| $100,000 to $149,999 | 533 | 22.9% |
| $150,000 to $199,999 | 116 | 5.0% |
| $200,000+ | 172 | 7.4% |
Household Income by Householder Age in Blaine
The median household income in Blaine is $78,633, with the highest median household income of $102,553 found in the 25 to 44 years age bracket for the primary householder. A total of 681 households (29.2%) fall into this category. Meanwhile, the 15 to 24 years age bracket for the primary householder has the lowest median household income of $66,392, with 77 households (3.3%) in this group.
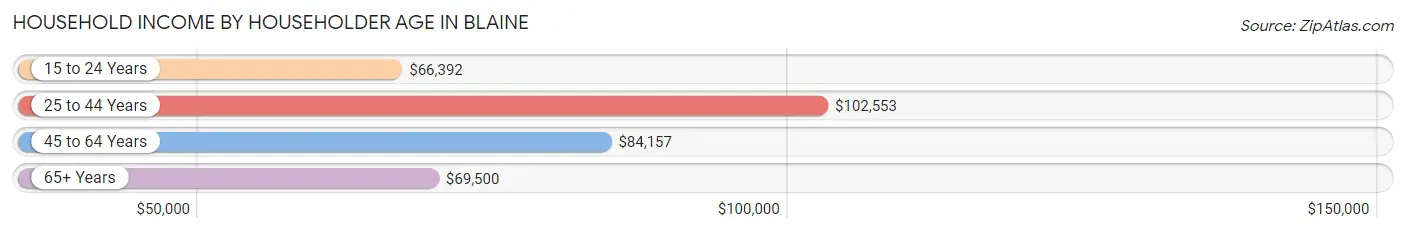
| Income Bracket | # Households | Median Income |
| 15 to 24 Years | 77 (3.3%) | $66,392 |
| 25 to 44 Years | 681 (29.2%) | $102,553 |
| 45 to 64 Years | 809 (34.7%) | $84,157 |
| 65+ Years | 762 (32.7%) | $69,500 |
| Total | 2,329 (100.0%) | $78,633 |
Poverty in Blaine
Income Below Poverty by Sex and Age in Blaine
With 11.7% poverty level for males and 18.8% for females among the residents of Blaine, 6 to 11 year old males and under 5 year old females are the most vulnerable to poverty, with 140 males (60.1%) and 57 females (52.8%) in their respective age groups living below the poverty level.
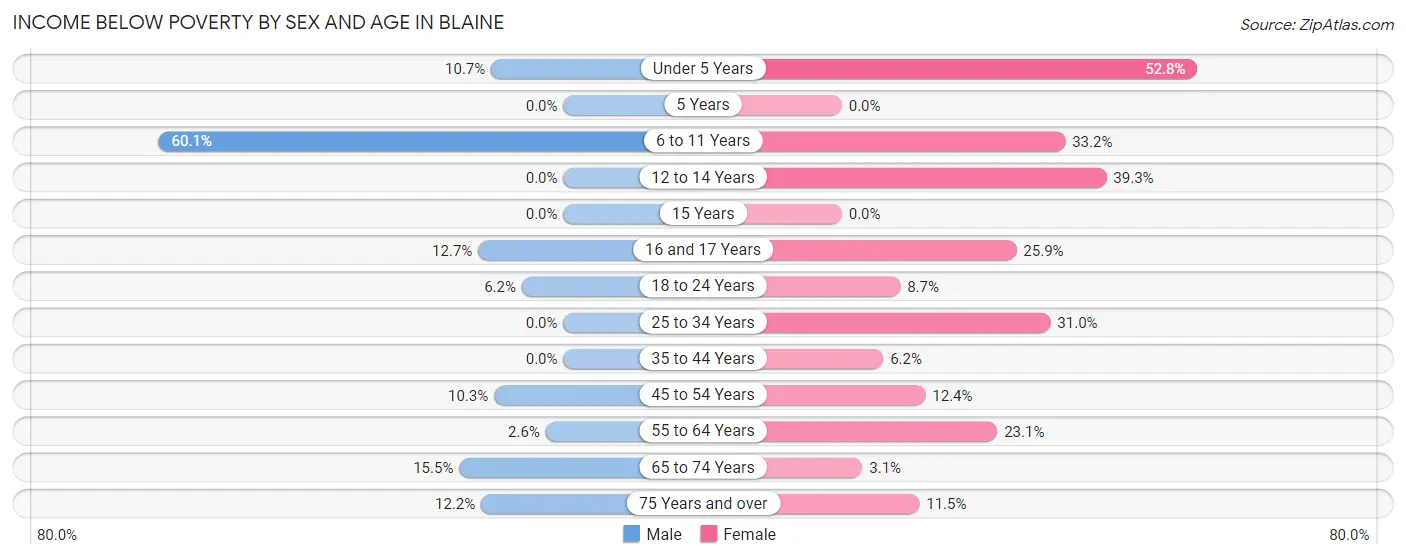
| Age Bracket | Male | Female |
| Under 5 Years | 19 (10.7%) | 57 (52.8%) |
| 5 Years | 0 (0.0%) | 0 (0.0%) |
| 6 to 11 Years | 140 (60.1%) | 72 (33.2%) |
| 12 to 14 Years | 0 (0.0%) | 33 (39.3%) |
| 15 Years | 0 (0.0%) | 0 (0.0%) |
| 16 and 17 Years | 21 (12.7%) | 35 (25.9%) |
| 18 to 24 Years | 19 (6.2%) | 25 (8.7%) |
| 25 to 34 Years | 0 (0.0%) | 136 (31.0%) |
| 35 to 44 Years | 0 (0.0%) | 20 (6.1%) |
| 45 to 54 Years | 37 (10.3%) | 36 (12.4%) |
| 55 to 64 Years | 9 (2.6%) | 93 (23.1%) |
| 65 to 74 Years | 60 (15.5%) | 12 (3.0%) |
| 75 Years and over | 21 (12.2%) | 16 (11.5%) |
| Total | 326 (11.7%) | 535 (18.8%) |
Income Above Poverty by Sex and Age in Blaine
According to the poverty statistics in Blaine, males aged 5 years and females aged 5 years are the age groups that are most secure financially, with 100.0% of males and 100.0% of females in these age groups living above the poverty line.
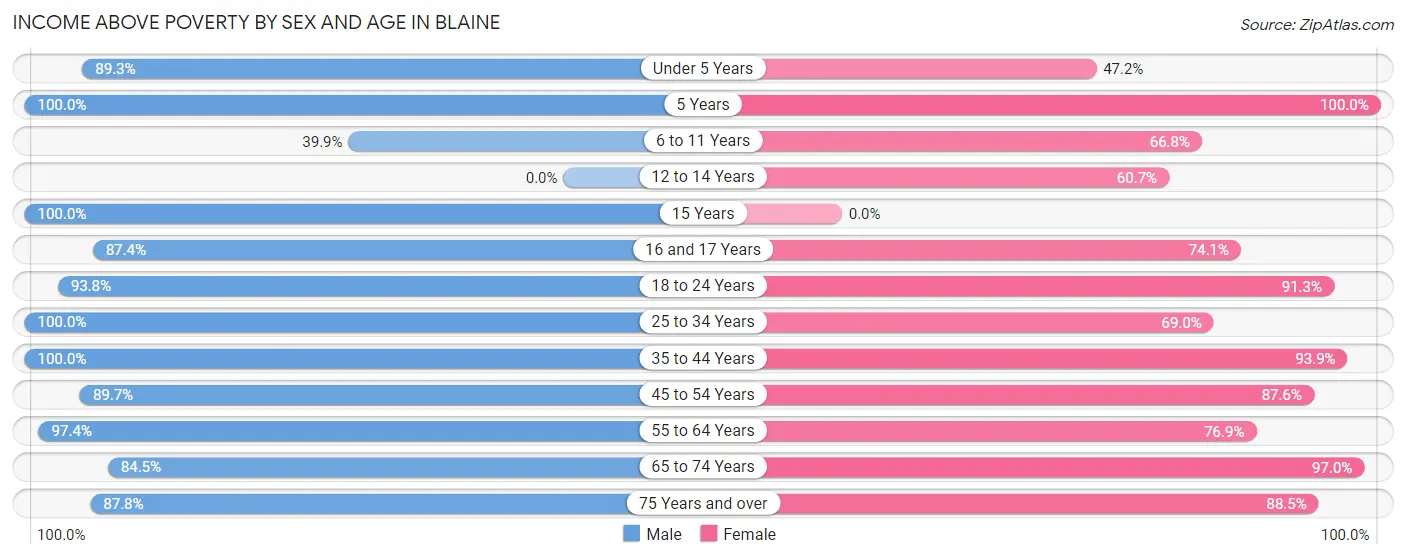
| Age Bracket | Male | Female |
| Under 5 Years | 158 (89.3%) | 51 (47.2%) |
| 5 Years | 45 (100.0%) | 20 (100.0%) |
| 6 to 11 Years | 93 (39.9%) | 145 (66.8%) |
| 12 to 14 Years | 0 (0.0%) | 51 (60.7%) |
| 15 Years | 74 (100.0%) | 0 (0.0%) |
| 16 and 17 Years | 145 (87.4%) | 100 (74.1%) |
| 18 to 24 Years | 289 (93.8%) | 263 (91.3%) |
| 25 to 34 Years | 257 (100.0%) | 303 (69.0%) |
| 35 to 44 Years | 271 (100.0%) | 305 (93.9%) |
| 45 to 54 Years | 323 (89.7%) | 254 (87.6%) |
| 55 to 64 Years | 334 (97.4%) | 310 (76.9%) |
| 65 to 74 Years | 328 (84.5%) | 381 (97.0%) |
| 75 Years and over | 151 (87.8%) | 123 (88.5%) |
| Total | 2,468 (88.3%) | 2,306 (81.2%) |
Income Below Poverty Among Married-Couple Families in Blaine
The poverty statistics for married-couple families in Blaine show that 2.4% or 23 of the total 945 families live below the poverty line. Families with 1 or 2 children have the highest poverty rate of 6.0%, comprising of 23 families. On the other hand, families with no children have the lowest poverty rate of 0.0%, which includes 0 families.
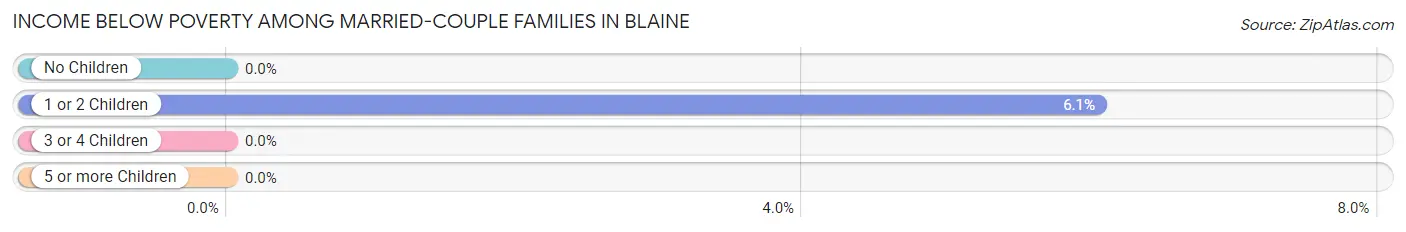
| Children | Above Poverty | Below Poverty |
| No Children | 532 (100.0%) | 0 (0.0%) |
| 1 or 2 Children | 357 (94.0%) | 23 (6.0%) |
| 3 or 4 Children | 33 (100.0%) | 0 (0.0%) |
| 5 or more Children | 0 (0.0%) | 0 (0.0%) |
| Total | 922 (97.6%) | 23 (2.4%) |
Income Below Poverty Among Single-Parent Households in Blaine
According to the poverty data in Blaine, 8.2% or 12 single-father households and 56.1% or 148 single-mother households are living below the poverty line. Among single-father households, those with 1 or 2 children have the highest poverty rate, with 12 households (20.3%) experiencing poverty. Likewise, among single-mother households, those with 3 or 4 children have the highest poverty rate, with 20 households (100.0%) falling below the poverty line.
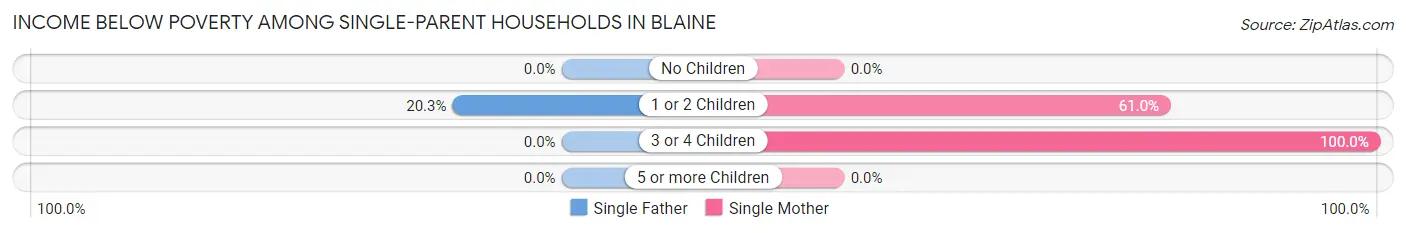
| Children | Single Father | Single Mother |
| No Children | 0 (0.0%) | 0 (0.0%) |
| 1 or 2 Children | 12 (20.3%) | 128 (61.0%) |
| 3 or 4 Children | 0 (0.0%) | 20 (100.0%) |
| 5 or more Children | 0 (0.0%) | 0 (0.0%) |
| Total | 12 (8.2%) | 148 (56.1%) |
Income Below Poverty Among Married-Couple vs Single-Parent Households in Blaine
The poverty data for Blaine shows that 23 of the married-couple family households (2.4%) and 160 of the single-parent households (38.9%) are living below the poverty level. Within the married-couple family households, those with 1 or 2 children have the highest poverty rate, with 23 households (6.0%) falling below the poverty line. Among the single-parent households, those with 3 or 4 children have the highest poverty rate, with 20 household (100.0%) living below poverty.
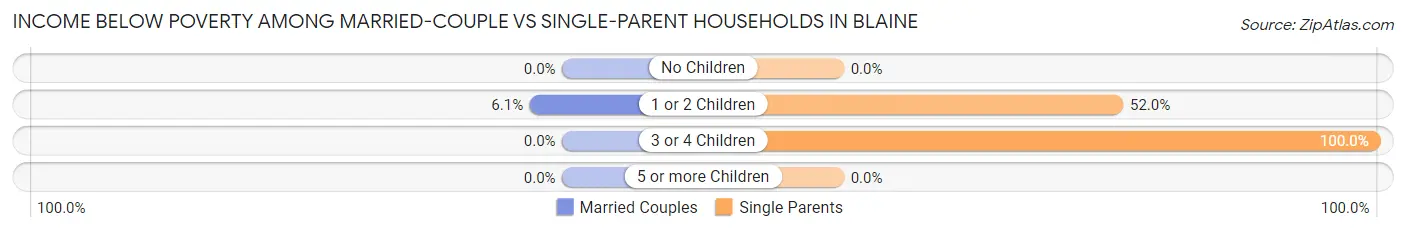
| Children | Married-Couple Families | Single-Parent Households |
| No Children | 0 (0.0%) | 0 (0.0%) |
| 1 or 2 Children | 23 (6.0%) | 140 (52.0%) |
| 3 or 4 Children | 0 (0.0%) | 20 (100.0%) |
| 5 or more Children | 0 (0.0%) | 0 (0.0%) |
| Total | 23 (2.4%) | 160 (38.9%) |
Race in Blaine
The most populous races in Blaine are White / Caucasian (4,383 | 74.7%), Hispanic or Latino (931 | 15.9%), and Two or more Races (862 | 14.7%).
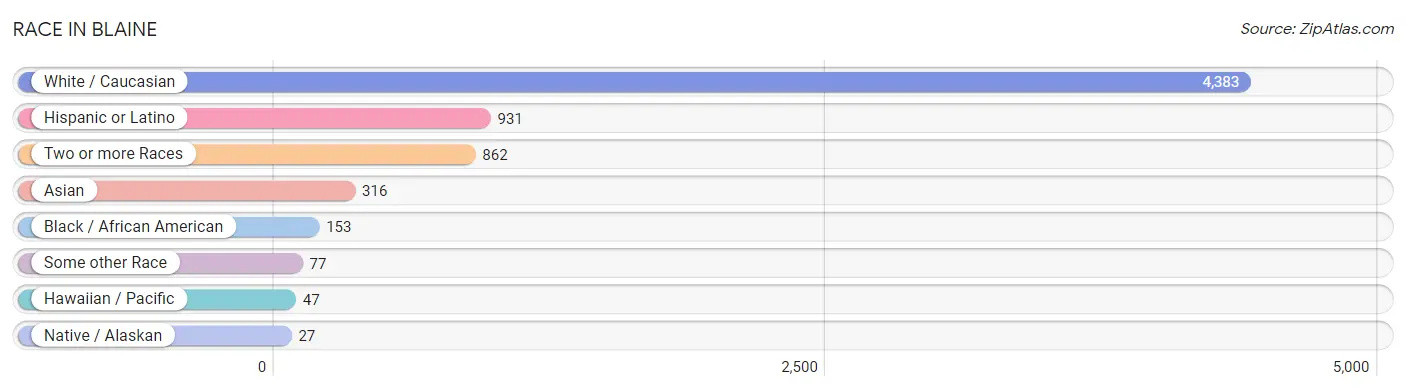
| Race | # Population | % Population |
| Asian | 316 | 5.4% |
| Black / African American | 153 | 2.6% |
| Hawaiian / Pacific | 47 | 0.8% |
| Hispanic or Latino | 931 | 15.9% |
| Native / Alaskan | 27 | 0.5% |
| White / Caucasian | 4,383 | 74.7% |
| Two or more Races | 862 | 14.7% |
| Some other Race | 77 | 1.3% |
| Total | 5,865 | 100.0% |
Ancestry in Blaine
The most populous ancestries reported in Blaine are German (942 | 16.1%), English (744 | 12.7%), Irish (665 | 11.3%), Korean (327 | 5.6%), and Central American (309 | 5.3%), together accounting for 50.9% of all Blaine residents.
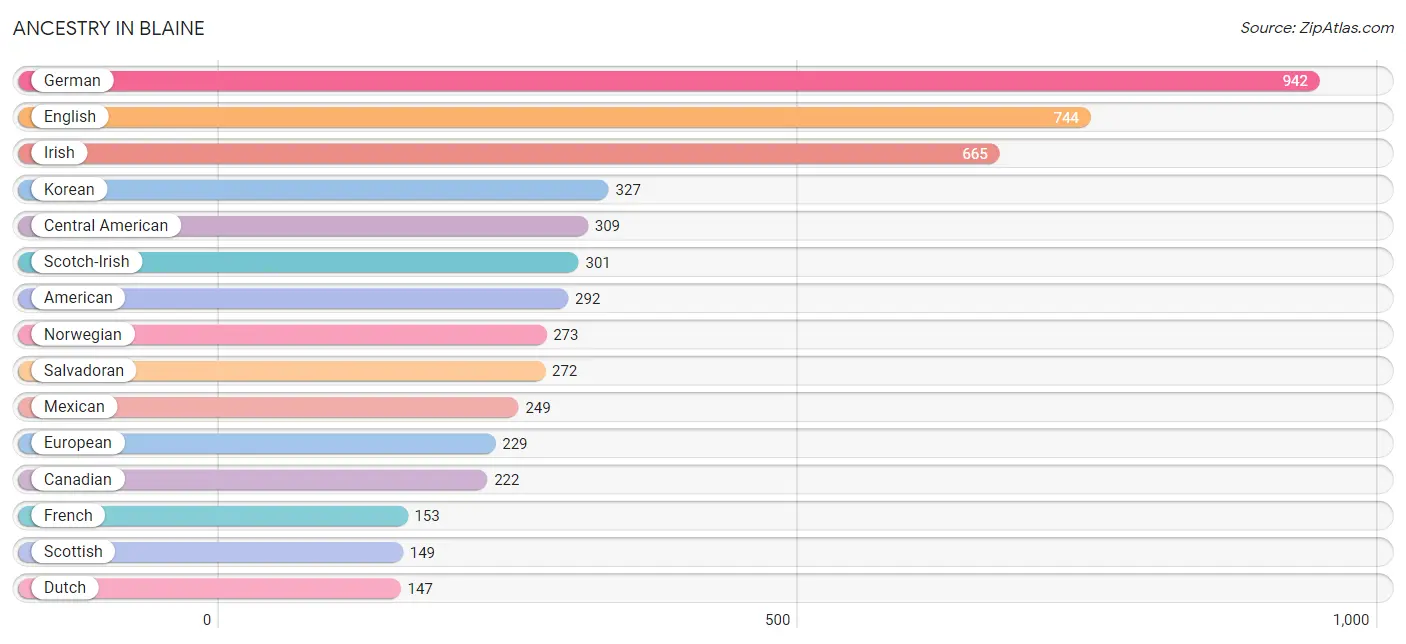
| Ancestry | # Population | % Population |
| African | 6 | 0.1% |
| Aleut | 20 | 0.3% |
| American | 292 | 5.0% |
| Arab | 39 | 0.7% |
| Austrian | 11 | 0.2% |
| Bhutanese | 23 | 0.4% |
| Brazilian | 14 | 0.2% |
| British | 123 | 2.1% |
| Canadian | 222 | 3.8% |
| Central American | 309 | 5.3% |
| Central American Indian | 7 | 0.1% |
| Czechoslovakian | 7 | 0.1% |
| Danish | 42 | 0.7% |
| Dutch | 147 | 2.5% |
| Egyptian | 39 | 0.7% |
| English | 744 | 12.7% |
| European | 229 | 3.9% |
| Finnish | 16 | 0.3% |
| French | 153 | 2.6% |
| French Canadian | 10 | 0.2% |
| German | 942 | 16.1% |
| Guamanian / Chamorro | 10 | 0.2% |
| Guatemalan | 37 | 0.6% |
| Hungarian | 52 | 0.9% |
| Icelander | 44 | 0.7% |
| Indian (Asian) | 117 | 2.0% |
| Irish | 665 | 11.3% |
| Italian | 146 | 2.5% |
| Jamaican | 93 | 1.6% |
| Japanese | 14 | 0.2% |
| Korean | 327 | 5.6% |
| Lithuanian | 86 | 1.5% |
| Mexican | 249 | 4.3% |
| Mexican American Indian | 7 | 0.1% |
| Native Hawaiian | 4 | 0.1% |
| Norwegian | 273 | 4.6% |
| Peruvian | 31 | 0.5% |
| Polish | 71 | 1.2% |
| Portuguese | 16 | 0.3% |
| Puerto Rican | 36 | 0.6% |
| Romanian | 11 | 0.2% |
| Russian | 114 | 1.9% |
| Salvadoran | 272 | 4.6% |
| Scandinavian | 15 | 0.3% |
| Scotch-Irish | 301 | 5.1% |
| Scottish | 149 | 2.5% |
| Serbian | 46 | 0.8% |
| Sioux | 8 | 0.1% |
| South American | 31 | 0.5% |
| Spaniard | 100 | 1.7% |
| Sri Lankan | 1 | 0.0% |
| Subsaharan African | 6 | 0.1% |
| Swedish | 124 | 2.1% |
| Thai | 12 | 0.2% |
| Ukrainian | 27 | 0.5% |
| Welsh | 21 | 0.4% | View All 56 Rows |
Immigrants in Blaine
The most numerous immigrant groups reported in Blaine came from Canada (430 | 7.3%), Asia (271 | 4.6%), Latin America (186 | 3.2%), China (173 | 2.9%), and Eastern Asia (173 | 2.9%), together accounting for 21.0% of all Blaine residents.
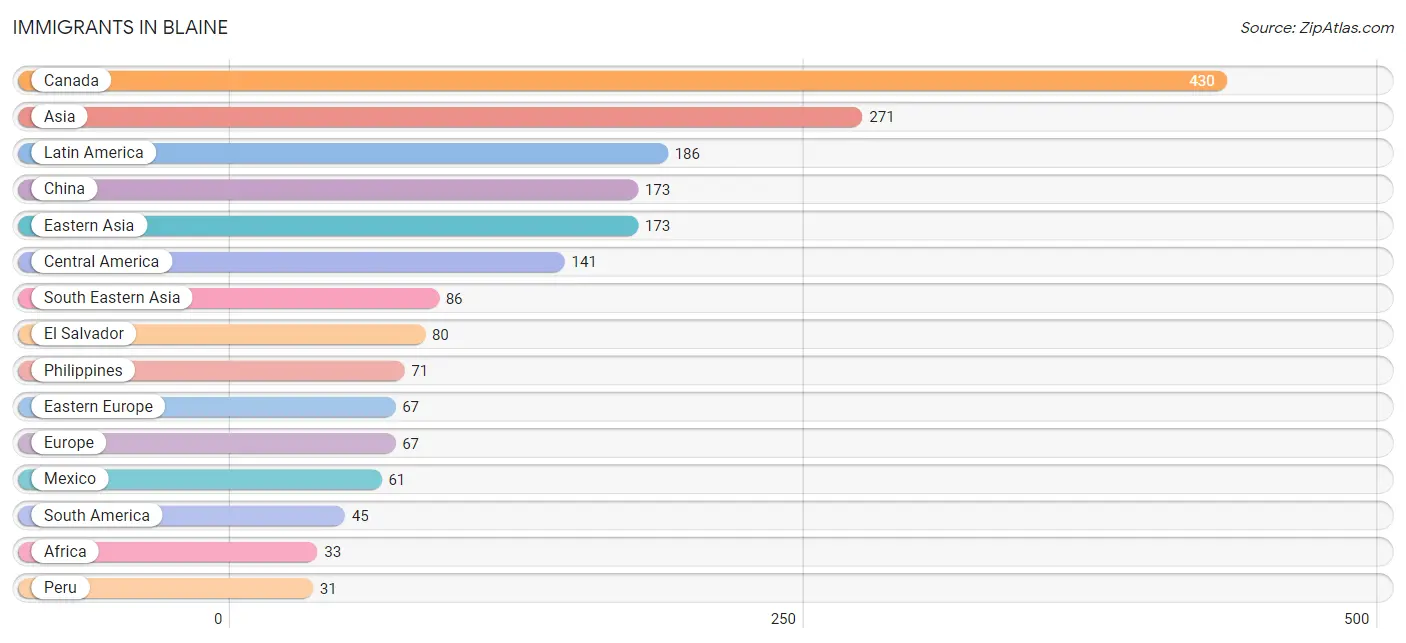
| Immigration Origin | # Population | % Population |
| Africa | 33 | 0.6% |
| Asia | 271 | 4.6% |
| Bosnia and Herzegovina | 11 | 0.2% |
| Brazil | 14 | 0.2% |
| Cambodia | 14 | 0.2% |
| Canada | 430 | 7.3% |
| Central America | 141 | 2.4% |
| China | 173 | 2.9% |
| Eastern Africa | 21 | 0.4% |
| Eastern Asia | 173 | 2.9% |
| Eastern Europe | 67 | 1.1% |
| Egypt | 12 | 0.2% |
| El Salvador | 80 | 1.4% |
| Ethiopia | 21 | 0.4% |
| Europe | 67 | 1.1% |
| Fiji | 13 | 0.2% |
| Hong Kong | 11 | 0.2% |
| India | 12 | 0.2% |
| Latin America | 186 | 3.2% |
| Mexico | 61 | 1.0% |
| Northern Africa | 12 | 0.2% |
| Oceania | 13 | 0.2% |
| Peru | 31 | 0.5% |
| Philippines | 71 | 1.2% |
| Serbia | 29 | 0.5% |
| South America | 45 | 0.8% |
| South Central Asia | 12 | 0.2% |
| South Eastern Asia | 86 | 1.5% |
| Taiwan | 10 | 0.2% |
| Ukraine | 27 | 0.5% |
| Vietnam | 1 | 0.0% | View All 31 Rows |
Sex and Age in Blaine
Sex and Age in Blaine
The most populous age groups in Blaine are 15 to 19 Years (358 | 12.6%) for men and 5 to 9 Years (319 | 10.5%) for women.
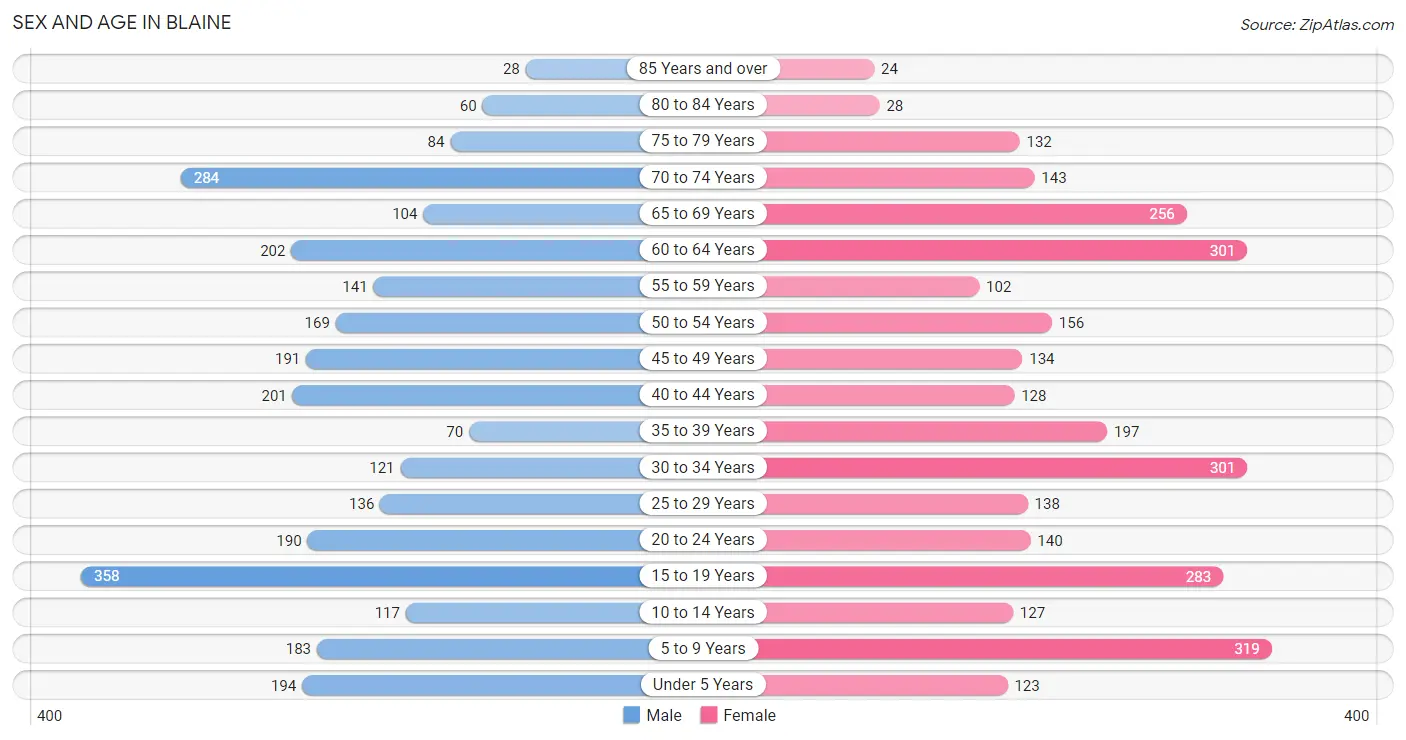
| Age Bracket | Male | Female |
| Under 5 Years | 194 (6.9%) | 123 (4.1%) |
| 5 to 9 Years | 183 (6.5%) | 319 (10.5%) |
| 10 to 14 Years | 117 (4.1%) | 127 (4.2%) |
| 15 to 19 Years | 358 (12.6%) | 283 (9.3%) |
| 20 to 24 Years | 190 (6.7%) | 140 (4.6%) |
| 25 to 29 Years | 136 (4.8%) | 138 (4.5%) |
| 30 to 34 Years | 121 (4.3%) | 301 (9.9%) |
| 35 to 39 Years | 70 (2.5%) | 197 (6.5%) |
| 40 to 44 Years | 201 (7.1%) | 128 (4.2%) |
| 45 to 49 Years | 191 (6.7%) | 134 (4.4%) |
| 50 to 54 Years | 169 (6.0%) | 156 (5.1%) |
| 55 to 59 Years | 141 (5.0%) | 102 (3.4%) |
| 60 to 64 Years | 202 (7.1%) | 301 (9.9%) |
| 65 to 69 Years | 104 (3.7%) | 256 (8.4%) |
| 70 to 74 Years | 284 (10.0%) | 143 (4.7%) |
| 75 to 79 Years | 84 (3.0%) | 132 (4.3%) |
| 80 to 84 Years | 60 (2.1%) | 28 (0.9%) |
| 85 Years and over | 28 (1.0%) | 24 (0.8%) |
| Total | 2,833 (100.0%) | 3,032 (100.0%) |
Families and Households in Blaine
Median Family Size in Blaine
The median family size in Blaine is 3.10 persons per family, with single female/mother families (264 | 19.5%) accounting for the largest median family size of 3.68 persons per family. On the other hand, single male/father families (147 | 10.8%) represent the smallest median family size with 2.57 persons per family.
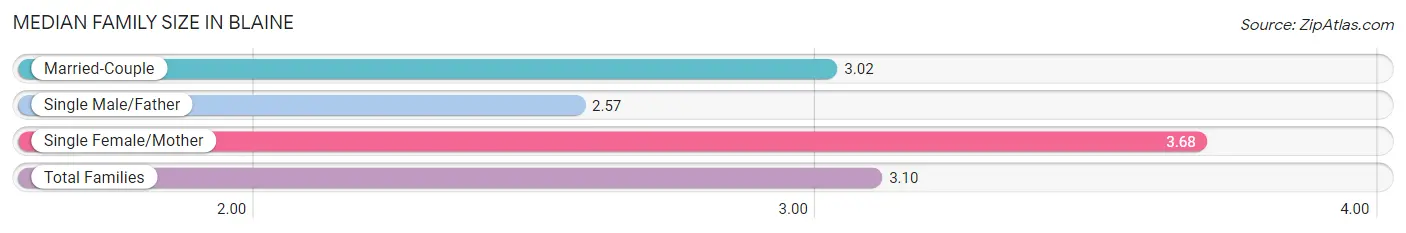
| Family Type | # Families | Family Size |
| Married-Couple | 945 (69.7%) | 3.02 |
| Single Male/Father | 147 (10.8%) | 2.57 |
| Single Female/Mother | 264 (19.5%) | 3.68 |
| Total Families | 1,356 (100.0%) | 3.10 |
Median Household Size in Blaine
The median household size in Blaine is 2.49 persons per household, with single female/mother households (264 | 11.3%) accounting for the largest median household size of 3.88 persons per household. non-family households (973 | 41.8%) represent the smallest median household size with 1.41 persons per household.
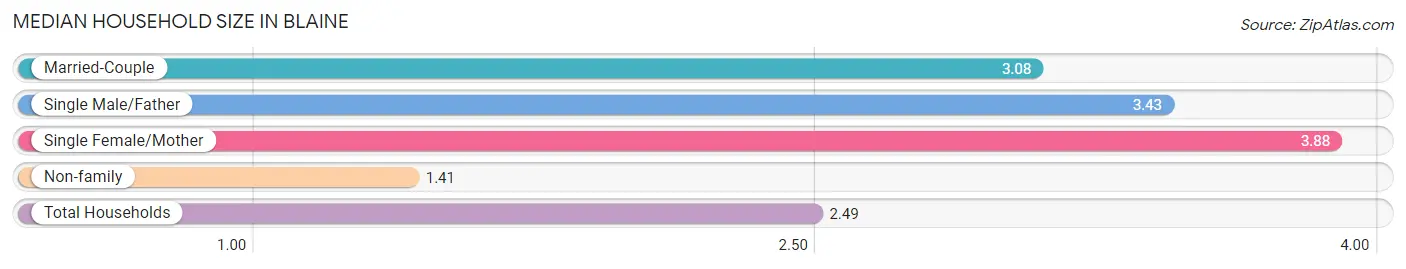
| Household Type | # Households | Household Size |
| Married-Couple | 945 (40.6%) | 3.08 |
| Single Male/Father | 147 (6.3%) | 3.43 |
| Single Female/Mother | 264 (11.3%) | 3.88 |
| Non-family | 973 (41.8%) | 1.41 |
| Total Households | 2,329 (100.0%) | 2.49 |
Household Size by Marriage Status in Blaine
Out of a total of 2,329 households in Blaine, 1,356 (58.2%) are family households, while 973 (41.8%) are nonfamily households. The most numerous type of family households are 2-person households, comprising 544, and the most common type of nonfamily households are 1-person households, comprising 838.
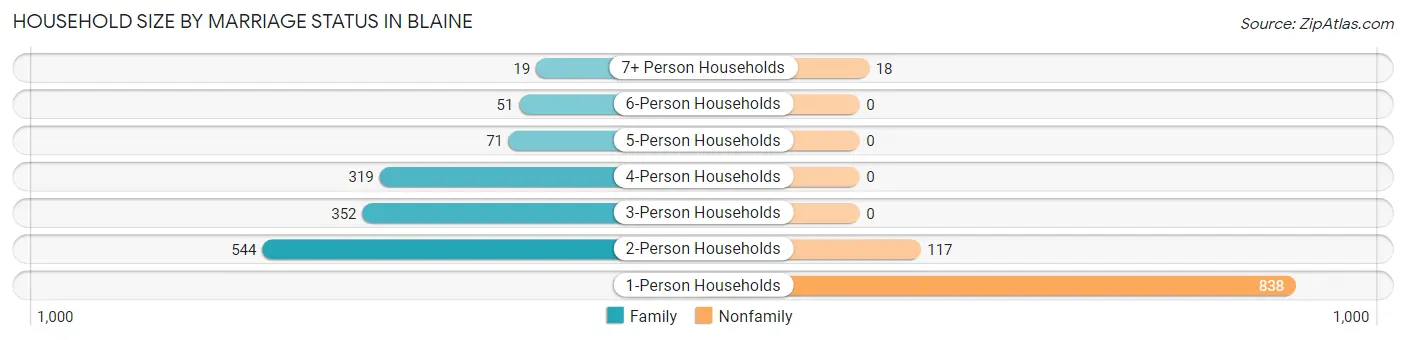
| Household Size | Family Households | Nonfamily Households |
| 1-Person Households | - | 838 (36.0%) |
| 2-Person Households | 544 (23.4%) | 117 (5.0%) |
| 3-Person Households | 352 (15.1%) | 0 (0.0%) |
| 4-Person Households | 319 (13.7%) | 0 (0.0%) |
| 5-Person Households | 71 (3.0%) | 0 (0.0%) |
| 6-Person Households | 51 (2.2%) | 0 (0.0%) |
| 7+ Person Households | 19 (0.8%) | 18 (0.8%) |
| Total | 1,356 (58.2%) | 973 (41.8%) |
Female Fertility in Blaine
Fertility by Age in Blaine
Average fertility rate in Blaine is 45.0 births per 1,000 women. Women in the age bracket of 20 to 34 years have the highest fertility rate with 66.0 births per 1,000 women. Women in the age bracket of 20 to 34 years acount for 62.3% of all women with births.
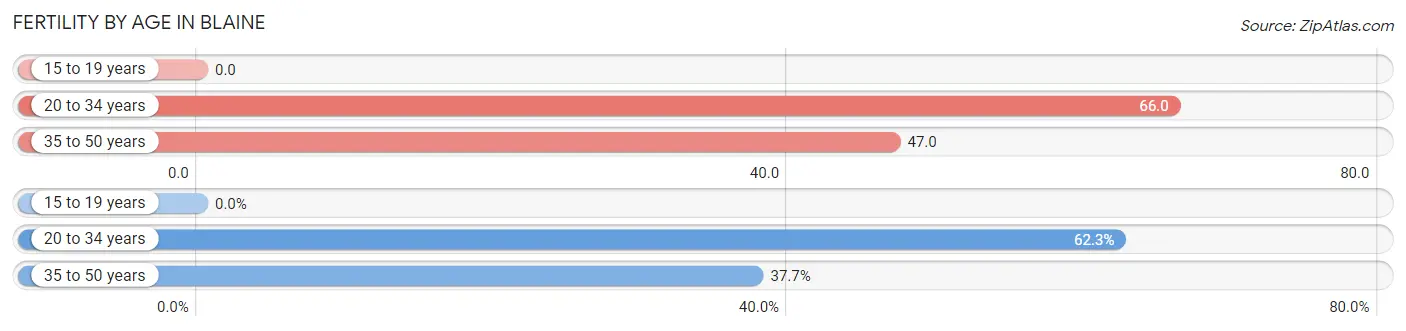
| Age Bracket | Women with Births | Births / 1,000 Women |
| 15 to 19 years | 0 (0.0%) | 0.0 |
| 20 to 34 years | 38 (62.3%) | 66.0 |
| 35 to 50 years | 23 (37.7%) | 47.0 |
| Total | 61 (100.0%) | 45.0 |
Fertility by Age by Marriage Status in Blaine
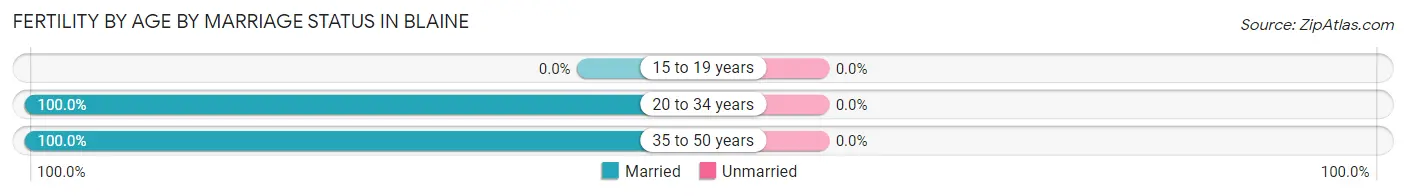
| Age Bracket | Married | Unmarried |
| 15 to 19 years | 0 (0.0%) | 0 (0.0%) |
| 20 to 34 years | 38 (100.0%) | 0 (0.0%) |
| 35 to 50 years | 23 (100.0%) | 0 (0.0%) |
| Total | 61 (100.0%) | 0 (0.0%) |
Fertility by Education in Blaine
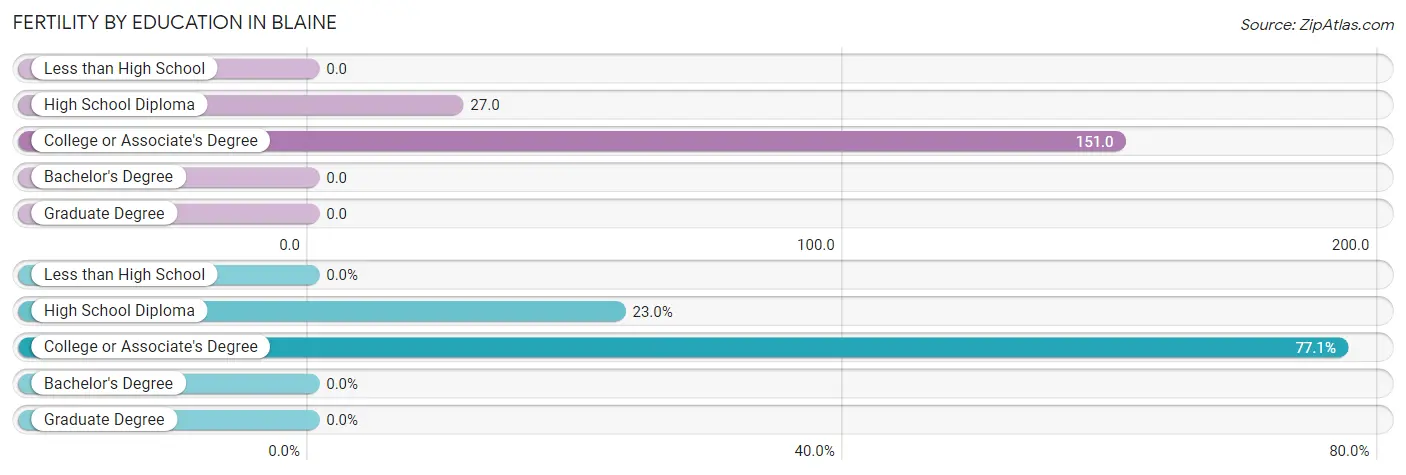
| Educational Attainment | Women with Births | Births / 1,000 Women |
| Less than High School | 0 (0.0%) | 0.0 |
| High School Diploma | 14 (23.0%) | 27.0 |
| College or Associate's Degree | 47 (77.0%) | 151.0 |
| Bachelor's Degree | 0 (0.0%) | 0.0 |
| Graduate Degree | 0 (0.0%) | 0.0 |
| Total | 61 (100.0%) | 45.0 |
Fertility by Education by Marriage Status in Blaine
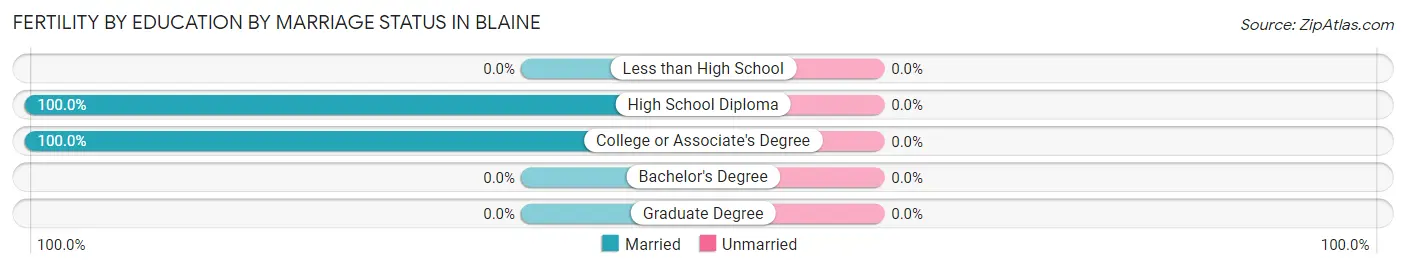
| Educational Attainment | Married | Unmarried |
| Less than High School | 0 (0.0%) | 0 (0.0%) |
| High School Diploma | 14 (100.0%) | 0 (0.0%) |
| College or Associate's Degree | 47 (100.0%) | 0 (0.0%) |
| Bachelor's Degree | 0 (0.0%) | 0 (0.0%) |
| Graduate Degree | 0 (0.0%) | 0 (0.0%) |
| Total | 61 (100.0%) | 0 (0.0%) |
Employment Characteristics in Blaine
Employment by Class of Employer in Blaine
Among the 2,287 employed individuals in Blaine, private company employees (1,507 | 65.9%), local government employees (188 | 8.2%), and state government employees (160 | 7.0%) make up the most common classes of employment.
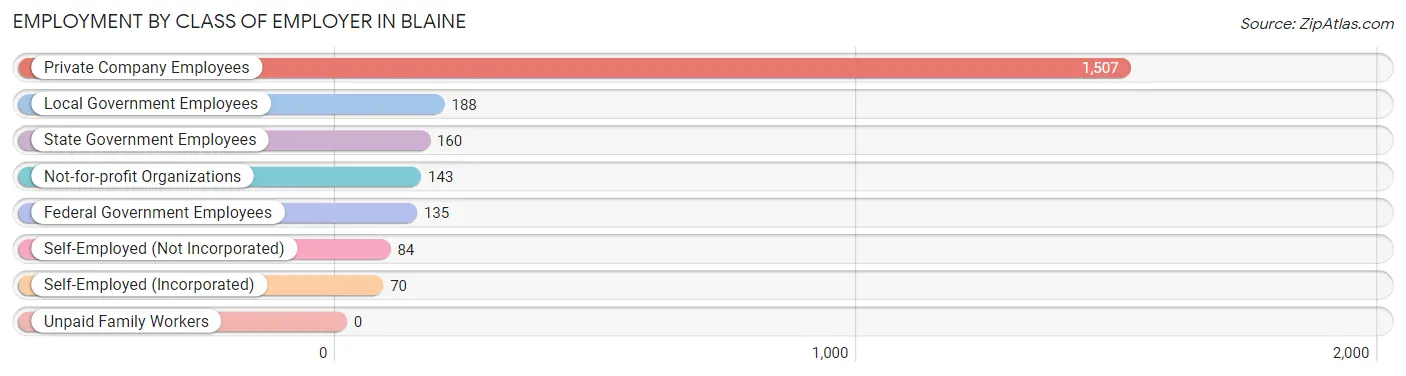
| Employer Class | # Employees | % Employees |
| Private Company Employees | 1,507 | 65.9% |
| Self-Employed (Incorporated) | 70 | 3.1% |
| Self-Employed (Not Incorporated) | 84 | 3.7% |
| Not-for-profit Organizations | 143 | 6.2% |
| Local Government Employees | 188 | 8.2% |
| State Government Employees | 160 | 7.0% |
| Federal Government Employees | 135 | 5.9% |
| Unpaid Family Workers | 0 | 0.0% |
| Total | 2,287 | 100.0% |
Employment Status by Age in Blaine
According to the labor force statistics for Blaine, out of the total population over 16 years of age (4,728), 54.0% or 2,553 individuals are in the labor force, with 9.7% or 248 of them unemployed. The age group with the highest labor force participation rate is 35 to 44 years, with 86.6% or 516 individuals in the labor force. Within the labor force, the 16 to 19 years age range has the highest percentage of unemployed individuals, with 41.2% or 105 of them being unemployed.
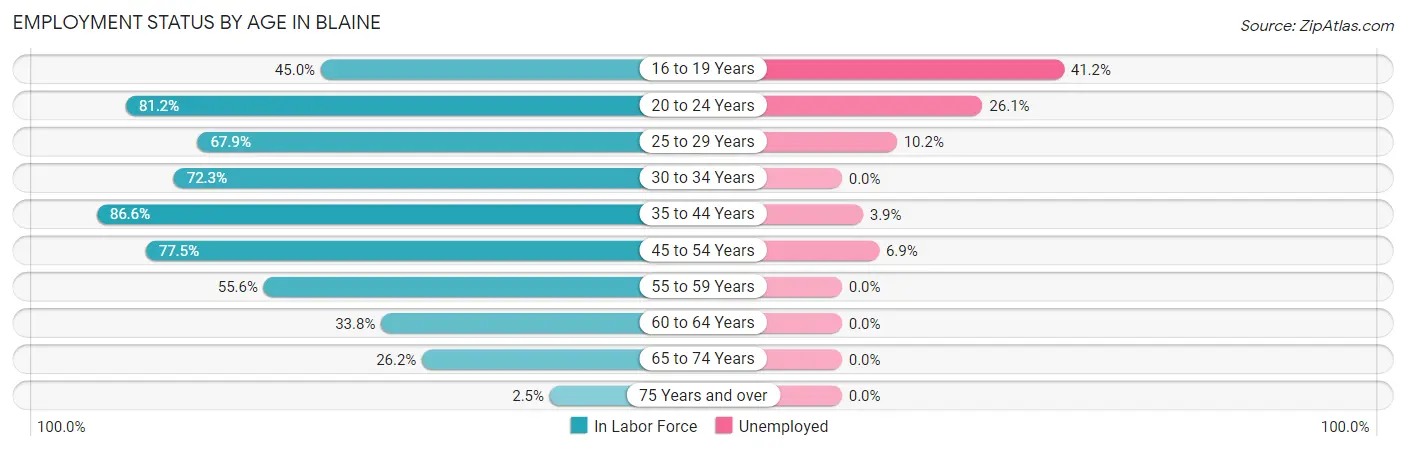
| Age Bracket | In Labor Force | Unemployed |
| 16 to 19 Years | 255 (45.0%) | 105 (41.2%) |
| 20 to 24 Years | 268 (81.2%) | 70 (26.1%) |
| 25 to 29 Years | 186 (67.9%) | 19 (10.2%) |
| 30 to 34 Years | 305 (72.3%) | 0 (0.0%) |
| 35 to 44 Years | 516 (86.6%) | 20 (3.9%) |
| 45 to 54 Years | 504 (77.5%) | 35 (6.9%) |
| 55 to 59 Years | 135 (55.6%) | 0 (0.0%) |
| 60 to 64 Years | 170 (33.8%) | 0 (0.0%) |
| 65 to 74 Years | 206 (26.2%) | 0 (0.0%) |
| 75 Years and over | 9 (2.5%) | 0 (0.0%) |
| Total | 2,553 (54.0%) | 248 (9.7%) |
Employment Status by Educational Attainment in Blaine
According to labor force statistics for Blaine, 67.6% of individuals (1,817) out of the total population between 25 and 64 years of age (2,688) are in the labor force, with 4.1% or 74 of them being unemployed. The group with the highest labor force participation rate are those with the educational attainment of bachelor's degree or higher, with 73.7% or 601 individuals in the labor force. Within the labor force, individuals with high school diploma education have the highest percentage of unemployment, with 5.7% or 40 of them being unemployed.
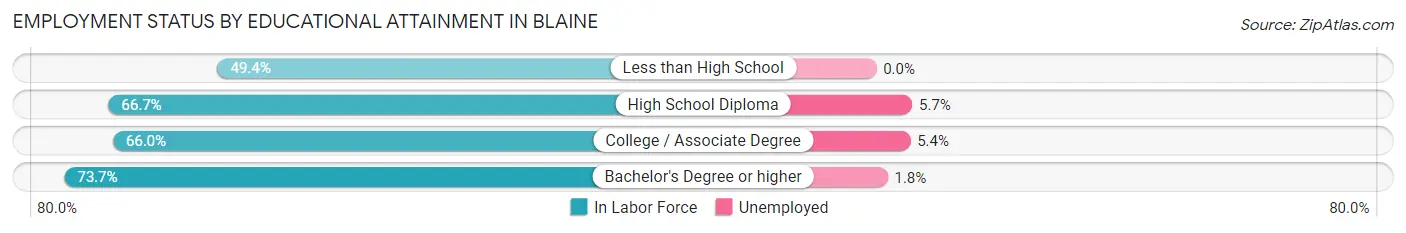
| Educational Attainment | In Labor Force | Unemployed |
| Less than High School | 86 (49.4%) | 0 (0.0%) |
| High School Diploma | 703 (66.7%) | 60 (5.7%) |
| College / Associate Degree | 426 (66.0%) | 35 (5.4%) |
| Bachelor's Degree or higher | 601 (73.7%) | 15 (1.8%) |
| Total | 1,817 (67.6%) | 110 (4.1%) |
Employment Occupations by Sex in Blaine
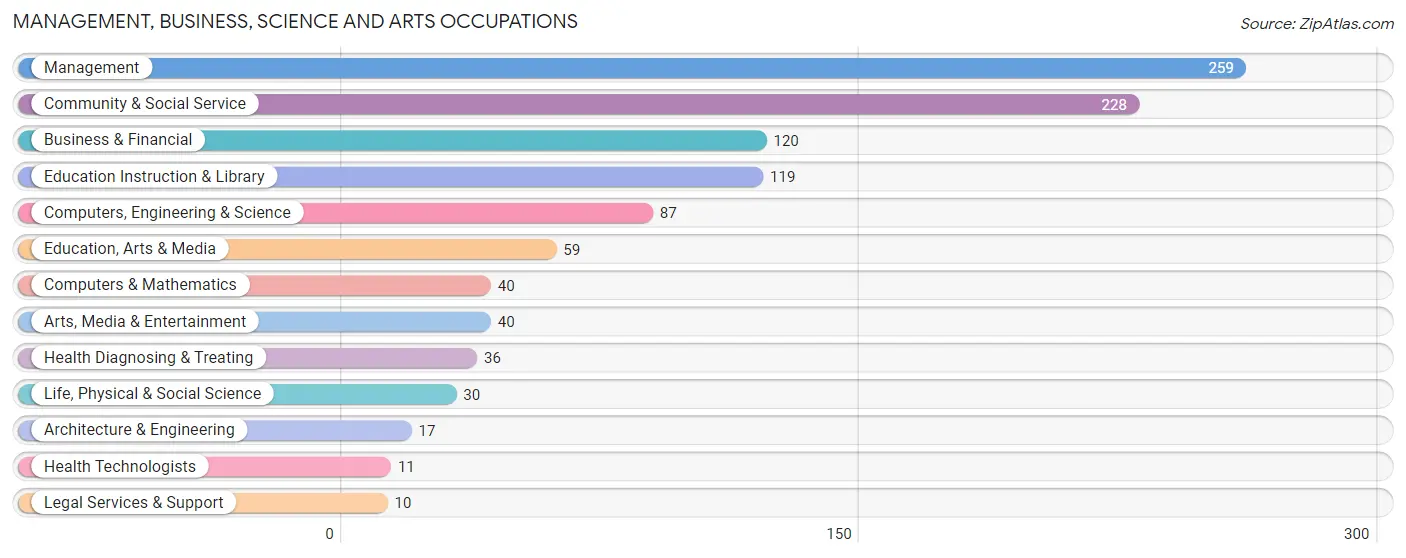
Management, Business, Science and Arts Occupations
The most common Management, Business, Science and Arts occupations in Blaine are Management (259 | 11.2%), Community & Social Service (228 | 9.9%), Business & Financial (120 | 5.2%), Education Instruction & Library (119 | 5.2%), and Computers, Engineering & Science (87 | 3.8%).
Management, Business, Science and Arts Occupations by Sex
Within the Management, Business, Science and Arts occupations in Blaine, the most male-oriented occupations are Health Technologists (100.0%), Computers & Mathematics (77.5%), and Business & Financial (75.8%), while the most female-oriented occupations are Architecture & Engineering (100.0%), Legal Services & Support (100.0%), and Arts, Media & Entertainment (77.5%).
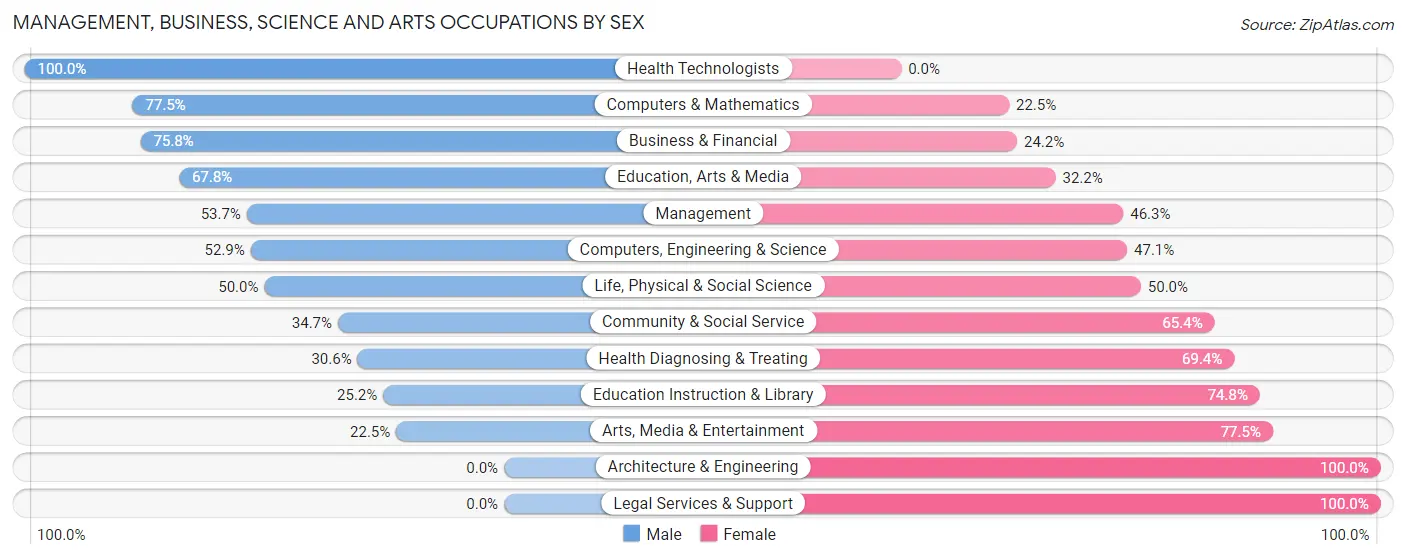
| Occupation | Male | Female |
| Management | 139 (53.7%) | 120 (46.3%) |
| Business & Financial | 91 (75.8%) | 29 (24.2%) |
| Computers, Engineering & Science | 46 (52.9%) | 41 (47.1%) |
| Computers & Mathematics | 31 (77.5%) | 9 (22.5%) |
| Architecture & Engineering | 0 (0.0%) | 17 (100.0%) |
| Life, Physical & Social Science | 15 (50.0%) | 15 (50.0%) |
| Community & Social Service | 79 (34.6%) | 149 (65.3%) |
| Education, Arts & Media | 40 (67.8%) | 19 (32.2%) |
| Legal Services & Support | 0 (0.0%) | 10 (100.0%) |
| Education Instruction & Library | 30 (25.2%) | 89 (74.8%) |
| Arts, Media & Entertainment | 9 (22.5%) | 31 (77.5%) |
| Health Diagnosing & Treating | 11 (30.6%) | 25 (69.4%) |
| Health Technologists | 11 (100.0%) | 0 (0.0%) |
| Total (Category) | 366 (50.1%) | 364 (49.9%) |
| Total (Overall) | 1,275 (55.3%) | 1,030 (44.7%) |
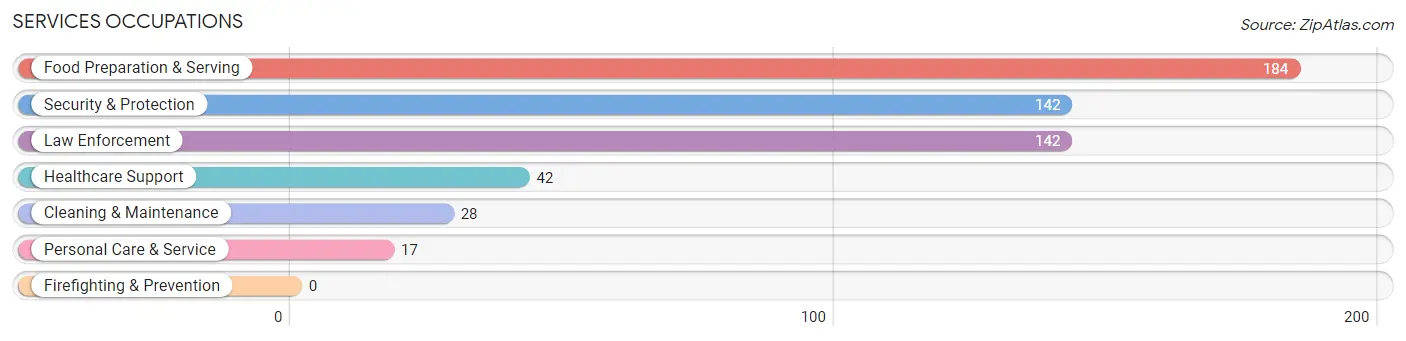
Services Occupations
The most common Services occupations in Blaine are Food Preparation & Serving (184 | 8.0%), Security & Protection (142 | 6.2%), Law Enforcement (142 | 6.2%), Healthcare Support (42 | 1.8%), and Cleaning & Maintenance (28 | 1.2%).
Services Occupations by Sex
Within the Services occupations in Blaine, the most male-oriented occupations are Healthcare Support (85.7%), Cleaning & Maintenance (71.4%), and Food Preparation & Serving (48.9%), while the most female-oriented occupations are Personal Care & Service (100.0%), Security & Protection (91.5%), and Law Enforcement (91.5%).
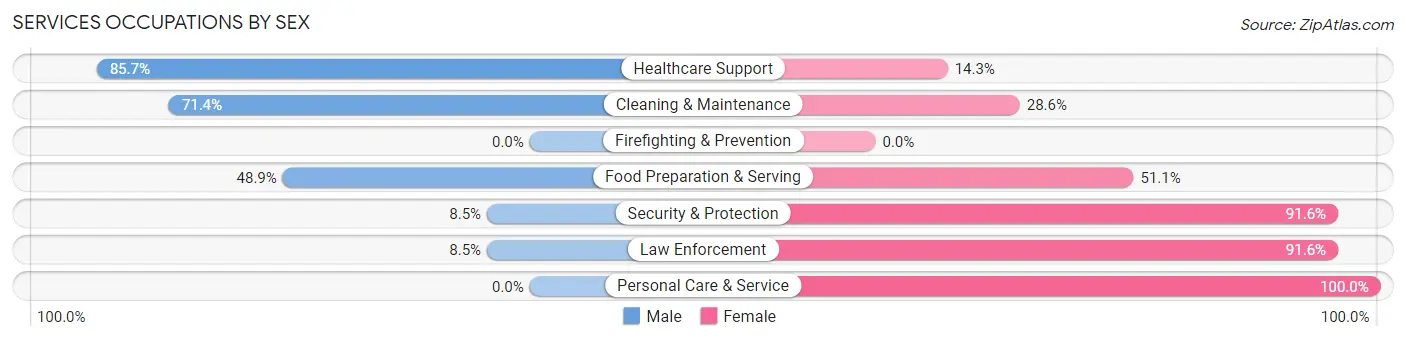
| Occupation | Male | Female |
| Healthcare Support | 36 (85.7%) | 6 (14.3%) |
| Security & Protection | 12 (8.5%) | 130 (91.5%) |
| Firefighting & Prevention | 0 (0.0%) | 0 (0.0%) |
| Law Enforcement | 12 (8.5%) | 130 (91.5%) |
| Food Preparation & Serving | 90 (48.9%) | 94 (51.1%) |
| Cleaning & Maintenance | 20 (71.4%) | 8 (28.6%) |
| Personal Care & Service | 0 (0.0%) | 17 (100.0%) |
| Total (Category) | 158 (38.3%) | 255 (61.7%) |
| Total (Overall) | 1,275 (55.3%) | 1,030 (44.7%) |
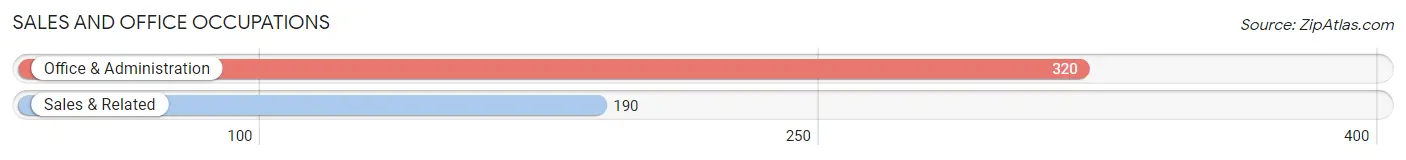
Sales and Office Occupations
The most common Sales and Office occupations in Blaine are Office & Administration (320 | 13.9%), and Sales & Related (190 | 8.2%).
Sales and Office Occupations by Sex
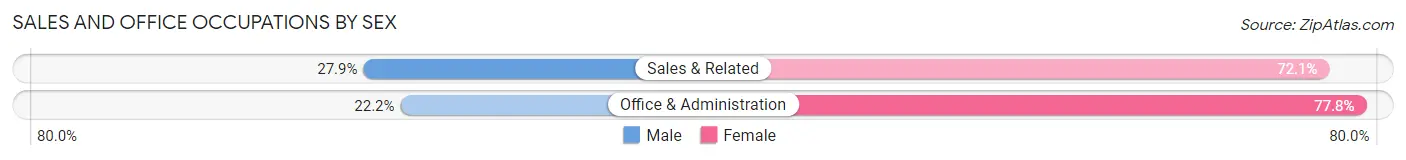
| Occupation | Male | Female |
| Sales & Related | 53 (27.9%) | 137 (72.1%) |
| Office & Administration | 71 (22.2%) | 249 (77.8%) |
| Total (Category) | 124 (24.3%) | 386 (75.7%) |
| Total (Overall) | 1,275 (55.3%) | 1,030 (44.7%) |
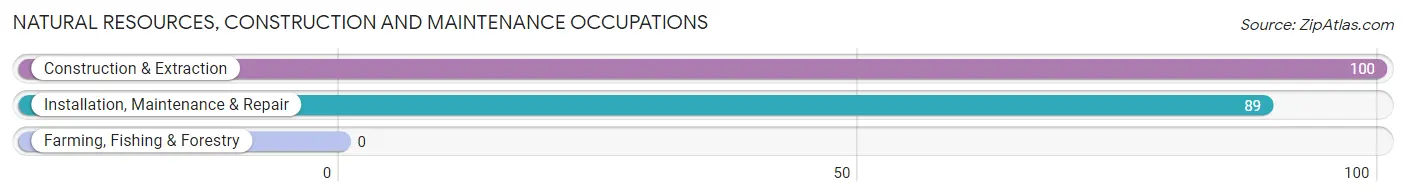
Natural Resources, Construction and Maintenance Occupations
The most common Natural Resources, Construction and Maintenance occupations in Blaine are Construction & Extraction (100 | 4.3%), and Installation, Maintenance & Repair (89 | 3.9%).
Natural Resources, Construction and Maintenance Occupations by Sex
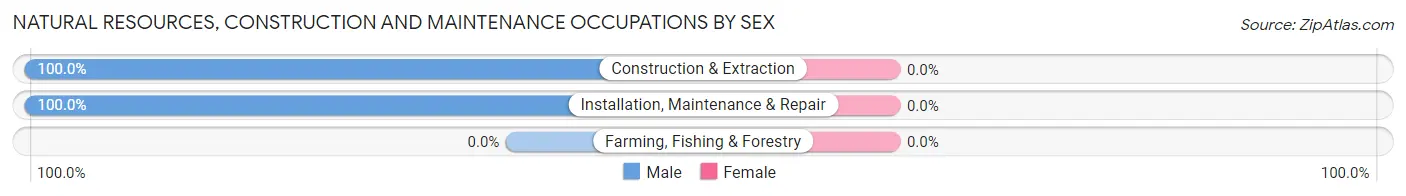
| Occupation | Male | Female |
| Farming, Fishing & Forestry | 0 (0.0%) | 0 (0.0%) |
| Construction & Extraction | 100 (100.0%) | 0 (0.0%) |
| Installation, Maintenance & Repair | 89 (100.0%) | 0 (0.0%) |
| Total (Category) | 189 (100.0%) | 0 (0.0%) |
| Total (Overall) | 1,275 (55.3%) | 1,030 (44.7%) |
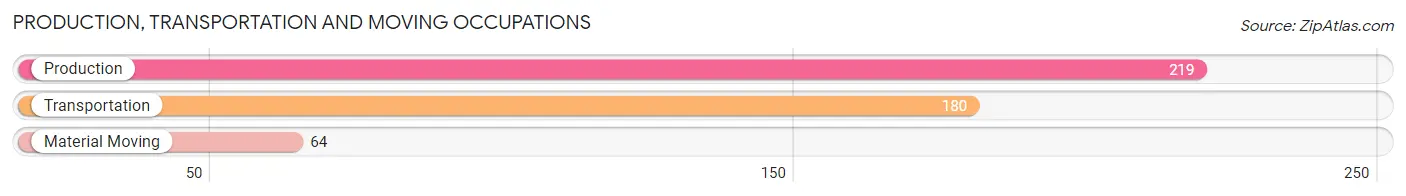
Production, Transportation and Moving Occupations
The most common Production, Transportation and Moving occupations in Blaine are Production (219 | 9.5%), Transportation (180 | 7.8%), and Material Moving (64 | 2.8%).
Production, Transportation and Moving Occupations by Sex
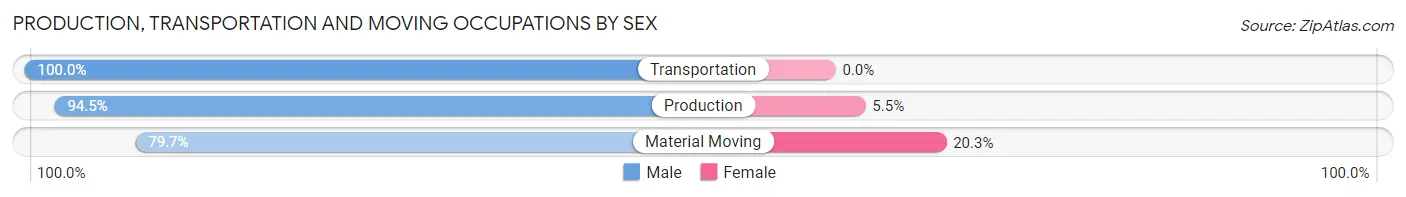
| Occupation | Male | Female |
| Production | 207 (94.5%) | 12 (5.5%) |
| Transportation | 180 (100.0%) | 0 (0.0%) |
| Material Moving | 51 (79.7%) | 13 (20.3%) |
| Total (Category) | 438 (94.6%) | 25 (5.4%) |
| Total (Overall) | 1,275 (55.3%) | 1,030 (44.7%) |
Employment Industries by Sex in Blaine
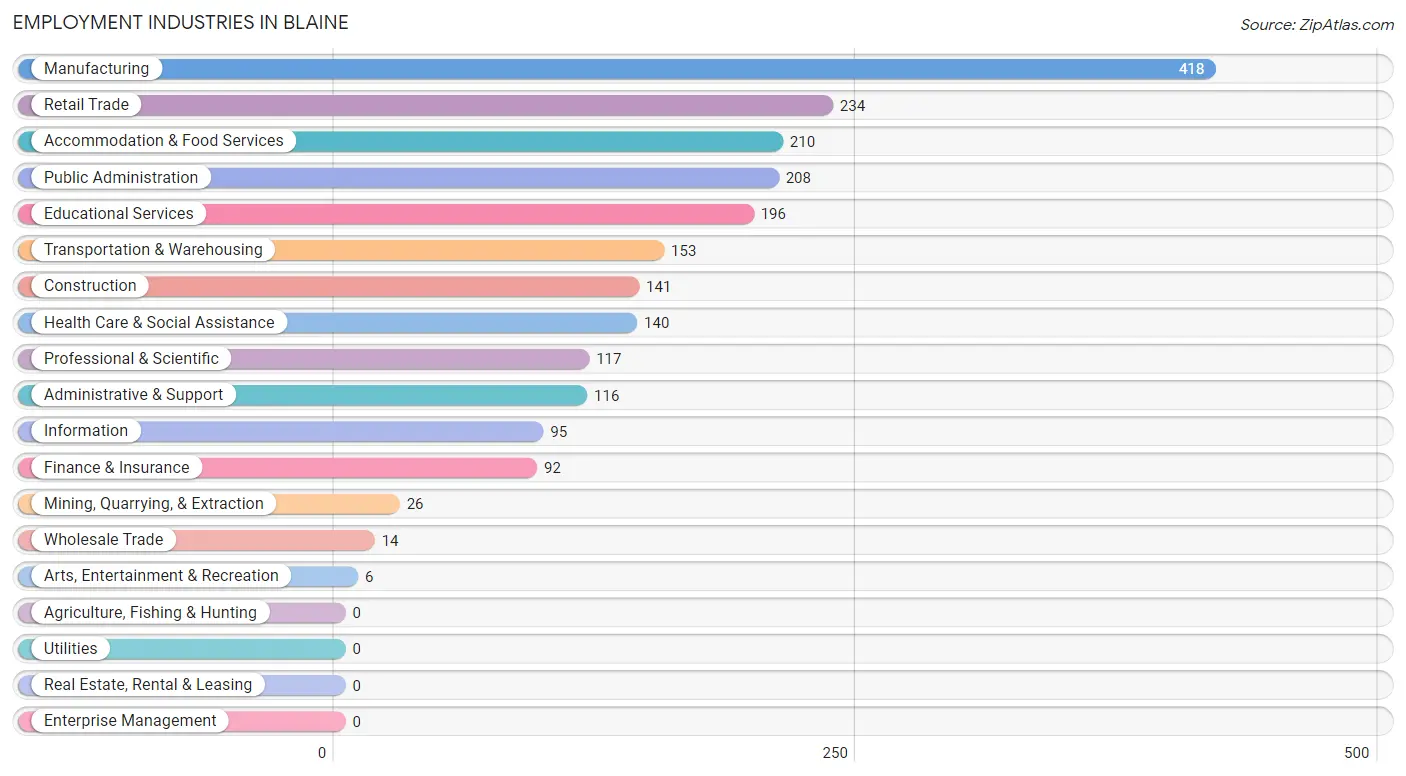
Employment Industries in Blaine
The major employment industries in Blaine include Manufacturing (418 | 18.1%), Retail Trade (234 | 10.2%), Accommodation & Food Services (210 | 9.1%), Public Administration (208 | 9.0%), and Educational Services (196 | 8.5%).
Employment Industries by Sex in Blaine
The Blaine industries that see more men than women are Mining, Quarrying, & Extraction (100.0%), Construction (100.0%), and Wholesale Trade (100.0%), whereas the industries that tend to have a higher number of women are Arts, Entertainment & Recreation (100.0%), Public Administration (86.5%), and Health Care & Social Assistance (73.6%).
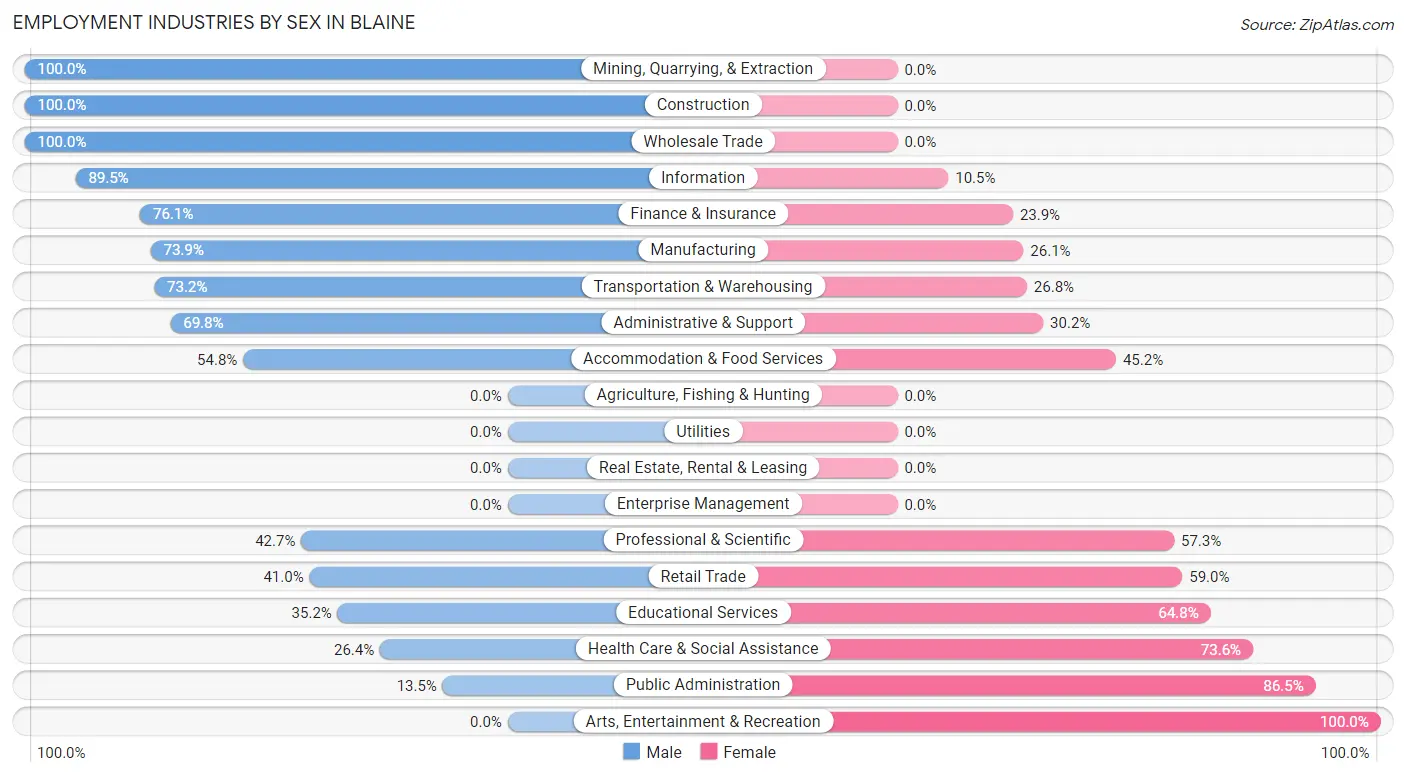
| Industry | Male | Female |
| Agriculture, Fishing & Hunting | 0 (0.0%) | 0 (0.0%) |
| Mining, Quarrying, & Extraction | 26 (100.0%) | 0 (0.0%) |
| Construction | 141 (100.0%) | 0 (0.0%) |
| Manufacturing | 309 (73.9%) | 109 (26.1%) |
| Wholesale Trade | 14 (100.0%) | 0 (0.0%) |
| Retail Trade | 96 (41.0%) | 138 (59.0%) |
| Transportation & Warehousing | 112 (73.2%) | 41 (26.8%) |
| Utilities | 0 (0.0%) | 0 (0.0%) |
| Information | 85 (89.5%) | 10 (10.5%) |
| Finance & Insurance | 70 (76.1%) | 22 (23.9%) |
| Real Estate, Rental & Leasing | 0 (0.0%) | 0 (0.0%) |
| Professional & Scientific | 50 (42.7%) | 67 (57.3%) |
| Enterprise Management | 0 (0.0%) | 0 (0.0%) |
| Administrative & Support | 81 (69.8%) | 35 (30.2%) |
| Educational Services | 69 (35.2%) | 127 (64.8%) |
| Health Care & Social Assistance | 37 (26.4%) | 103 (73.6%) |
| Arts, Entertainment & Recreation | 0 (0.0%) | 6 (100.0%) |
| Accommodation & Food Services | 115 (54.8%) | 95 (45.2%) |
| Public Administration | 28 (13.5%) | 180 (86.5%) |
| Total | 1,275 (55.3%) | 1,030 (44.7%) |
Education in Blaine
School Enrollment in Blaine
The most common levels of schooling among the 1,396 students in Blaine are high school (431 | 30.9%), elementary school (389 | 27.9%), and middle school (194 | 13.9%).
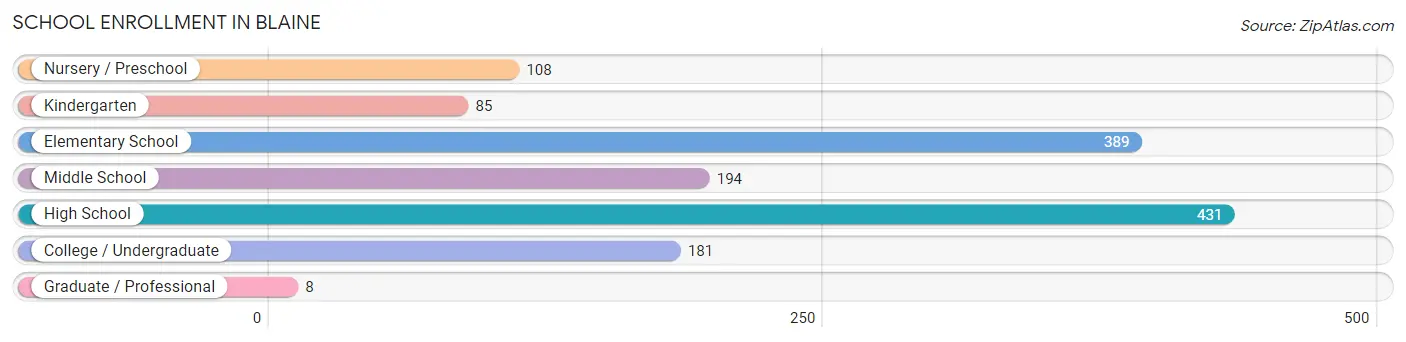
| School Level | # Students | % Students |
| Nursery / Preschool | 108 | 7.7% |
| Kindergarten | 85 | 6.1% |
| Elementary School | 389 | 27.9% |
| Middle School | 194 | 13.9% |
| High School | 431 | 30.9% |
| College / Undergraduate | 181 | 13.0% |
| Graduate / Professional | 8 | 0.6% |
| Total | 1,396 | 100.0% |
School Enrollment by Age by Funding Source in Blaine
Out of a total of 1,396 students who are enrolled in schools in Blaine, 29 (2.1%) attend a private institution, while the remaining 1,367 (97.9%) are enrolled in public schools. The age group of 35 years and over has the highest likelihood of being enrolled in private schools, with 14 (41.2% in the age bracket) enrolled. Conversely, the age group of 3 to 4 year olds has the lowest likelihood of being enrolled in a private school, with 76 (100.0% in the age bracket) attending a public institution.
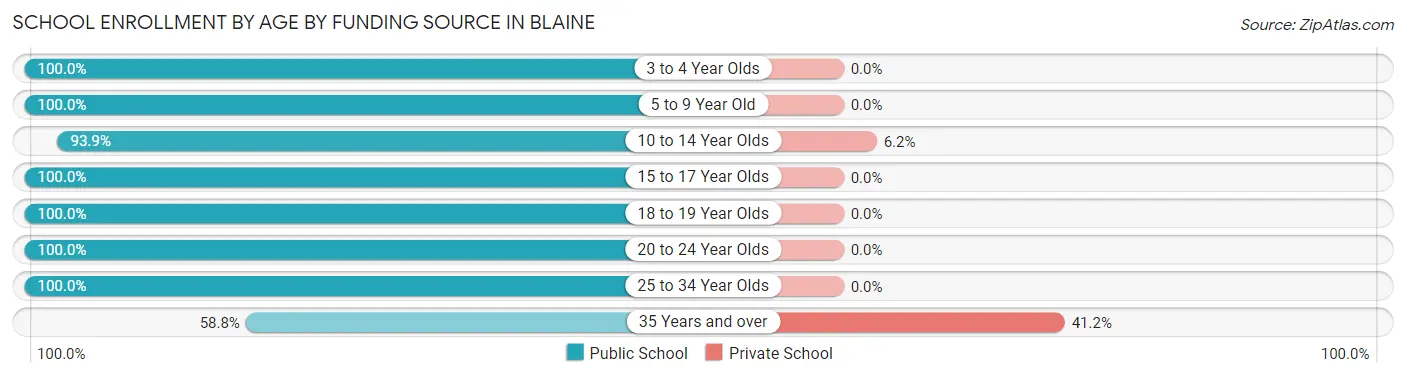
| Age Bracket | Public School | Private School |
| 3 to 4 Year Olds | 76 (100.0%) | 0 (0.0%) |
| 5 to 9 Year Old | 489 (100.0%) | 0 (0.0%) |
| 10 to 14 Year Olds | 229 (93.9%) | 15 (6.1%) |
| 15 to 17 Year Olds | 372 (100.0%) | 0 (0.0%) |
| 18 to 19 Year Olds | 52 (100.0%) | 0 (0.0%) |
| 20 to 24 Year Olds | 66 (100.0%) | 0 (0.0%) |
| 25 to 34 Year Olds | 63 (100.0%) | 0 (0.0%) |
| 35 Years and over | 20 (58.8%) | 14 (41.2%) |
| Total | 1,367 (97.9%) | 29 (2.1%) |
Educational Attainment by Field of Study in Blaine
Social sciences (227 | 15.8%), business (219 | 15.3%), liberal arts & history (199 | 13.9%), engineering (145 | 10.1%), and psychology (125 | 8.7%) are the most common fields of study among 1,434 individuals in Blaine who have obtained a bachelor's degree or higher.
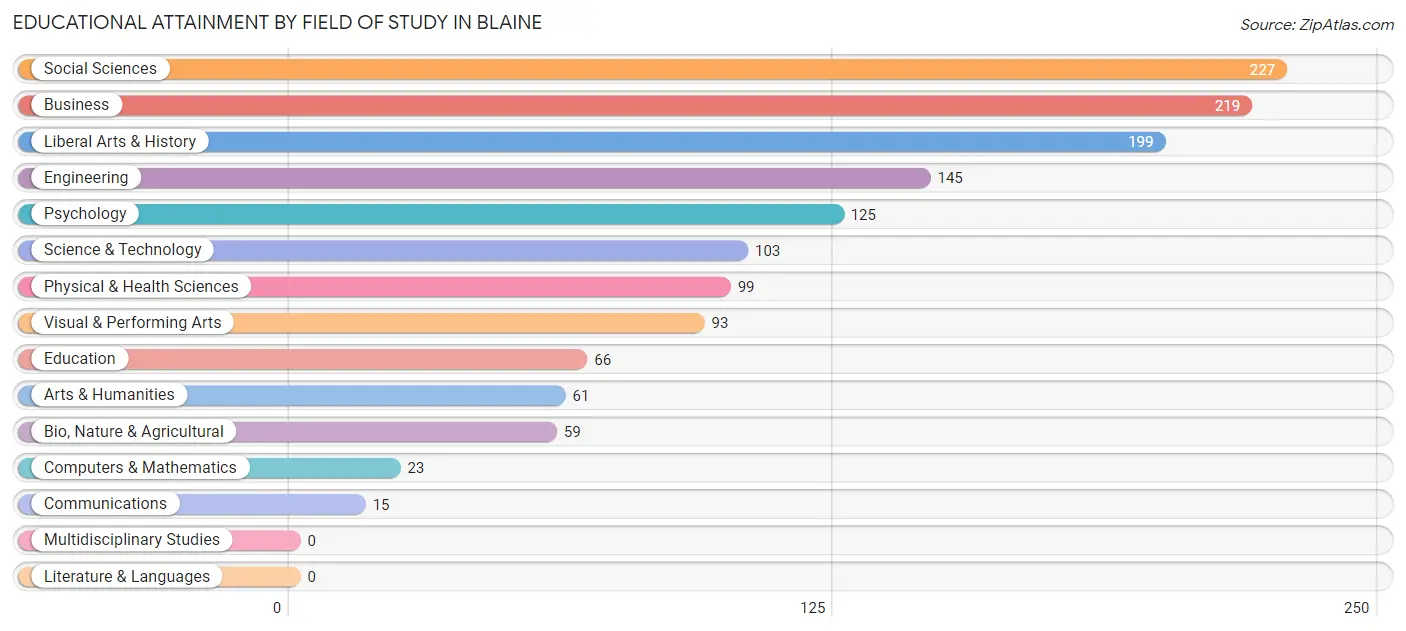
| Field of Study | # Graduates | % Graduates |
| Computers & Mathematics | 23 | 1.6% |
| Bio, Nature & Agricultural | 59 | 4.1% |
| Physical & Health Sciences | 99 | 6.9% |
| Psychology | 125 | 8.7% |
| Social Sciences | 227 | 15.8% |
| Engineering | 145 | 10.1% |
| Multidisciplinary Studies | 0 | 0.0% |
| Science & Technology | 103 | 7.2% |
| Business | 219 | 15.3% |
| Education | 66 | 4.6% |
| Literature & Languages | 0 | 0.0% |
| Liberal Arts & History | 199 | 13.9% |
| Visual & Performing Arts | 93 | 6.5% |
| Communications | 15 | 1.1% |
| Arts & Humanities | 61 | 4.3% |
| Total | 1,434 | 100.0% |
Transportation & Commute in Blaine
Vehicle Availability by Sex in Blaine
The most prevalent vehicle ownership categories in Blaine are males with 2 vehicles (527, accounting for 42.0%) and females with 2 vehicles (329, making up 51.2%).
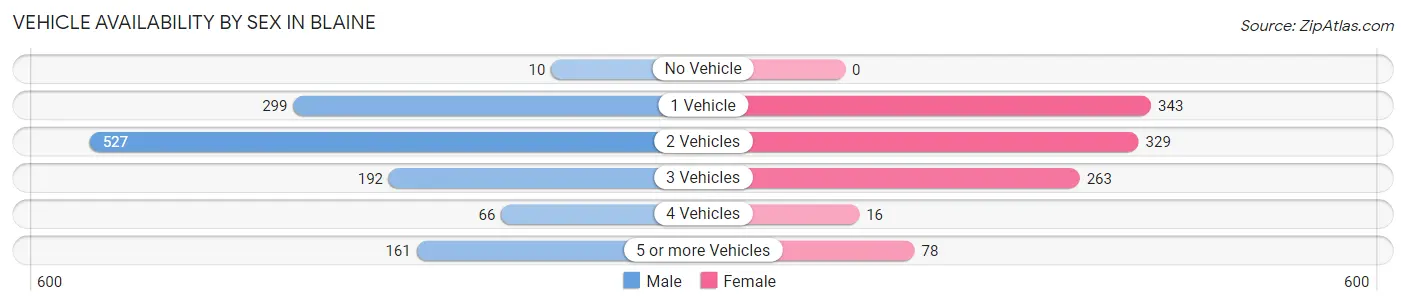
| Vehicles Available | Male | Female |
| No Vehicle | 10 (0.8%) | 0 (0.0%) |
| 1 Vehicle | 299 (23.8%) | 343 (33.3%) |
| 2 Vehicles | 527 (42.0%) | 329 (32.0%) |
| 3 Vehicles | 192 (15.3%) | 263 (25.6%) |
| 4 Vehicles | 66 (5.3%) | 16 (1.5%) |
| 5 or more Vehicles | 161 (12.8%) | 78 (7.6%) |
| Total | 1,255 (100.0%) | 1,029 (100.0%) |
Commute Time in Blaine
The most frequently occuring commute durations in Blaine are 10 to 14 minutes (413 commuters, 21.0%), 5 to 9 minutes (305 commuters, 15.5%), and 15 to 19 minutes (278 commuters, 14.1%).
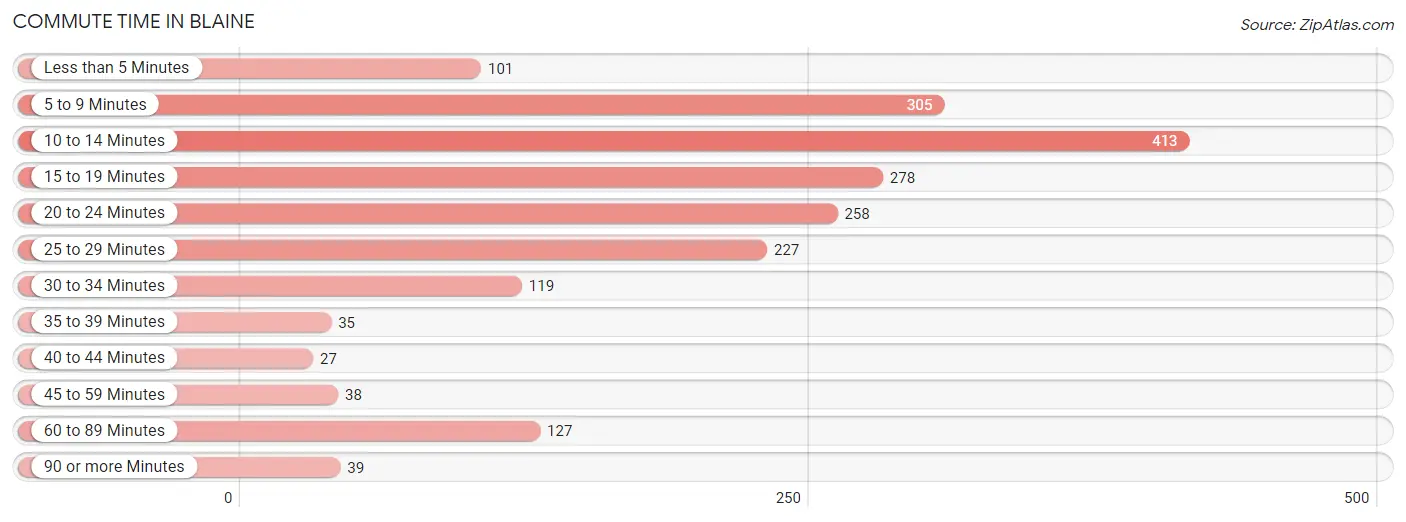
| Commute Time | # Commuters | % Commuters |
| Less than 5 Minutes | 101 | 5.1% |
| 5 to 9 Minutes | 305 | 15.5% |
| 10 to 14 Minutes | 413 | 21.0% |
| 15 to 19 Minutes | 278 | 14.1% |
| 20 to 24 Minutes | 258 | 13.1% |
| 25 to 29 Minutes | 227 | 11.5% |
| 30 to 34 Minutes | 119 | 6.0% |
| 35 to 39 Minutes | 35 | 1.8% |
| 40 to 44 Minutes | 27 | 1.4% |
| 45 to 59 Minutes | 38 | 1.9% |
| 60 to 89 Minutes | 127 | 6.5% |
| 90 or more Minutes | 39 | 2.0% |
Commute Time by Sex in Blaine
The most common commute times in Blaine are 15 to 19 minutes (209 commuters, 19.2%) for males and 10 to 14 minutes (232 commuters, 26.3%) for females.
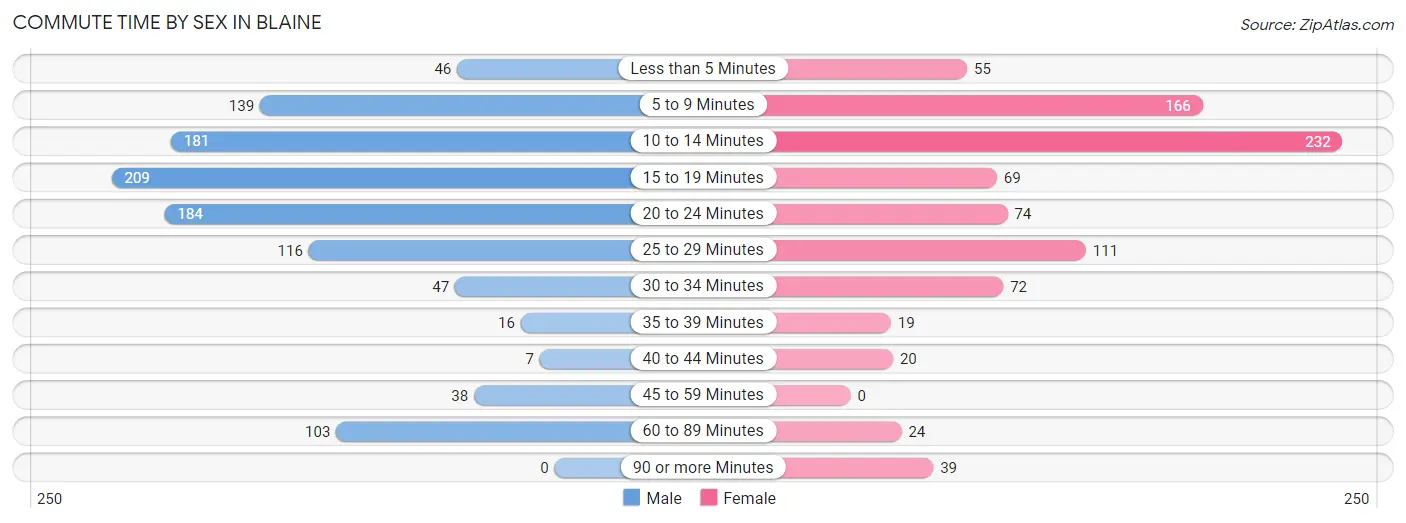
| Commute Time | Male | Female |
| Less than 5 Minutes | 46 (4.2%) | 55 (6.2%) |
| 5 to 9 Minutes | 139 (12.8%) | 166 (18.8%) |
| 10 to 14 Minutes | 181 (16.7%) | 232 (26.3%) |
| 15 to 19 Minutes | 209 (19.2%) | 69 (7.8%) |
| 20 to 24 Minutes | 184 (16.9%) | 74 (8.4%) |
| 25 to 29 Minutes | 116 (10.7%) | 111 (12.6%) |
| 30 to 34 Minutes | 47 (4.3%) | 72 (8.2%) |
| 35 to 39 Minutes | 16 (1.5%) | 19 (2.2%) |
| 40 to 44 Minutes | 7 (0.6%) | 20 (2.3%) |
| 45 to 59 Minutes | 38 (3.5%) | 0 (0.0%) |
| 60 to 89 Minutes | 103 (9.5%) | 24 (2.7%) |
| 90 or more Minutes | 0 (0.0%) | 39 (4.4%) |
Time of Departure to Work by Sex in Blaine
The most frequent times of departure to work in Blaine are 12:00 AM to 4:59 AM (184, 16.9%) for males and 12:00 PM to 3:59 PM (228, 25.9%) for females.
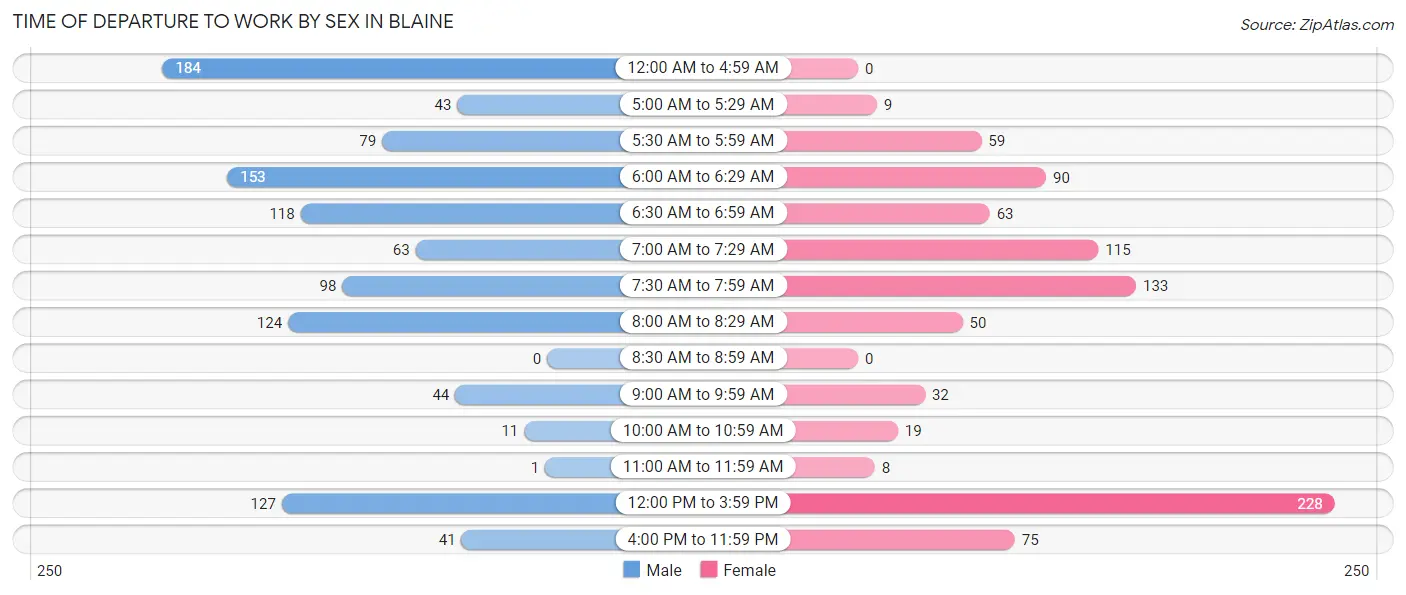
| Time of Departure | Male | Female |
| 12:00 AM to 4:59 AM | 184 (16.9%) | 0 (0.0%) |
| 5:00 AM to 5:29 AM | 43 (4.0%) | 9 (1.0%) |
| 5:30 AM to 5:59 AM | 79 (7.3%) | 59 (6.7%) |
| 6:00 AM to 6:29 AM | 153 (14.1%) | 90 (10.2%) |
| 6:30 AM to 6:59 AM | 118 (10.9%) | 63 (7.1%) |
| 7:00 AM to 7:29 AM | 63 (5.8%) | 115 (13.1%) |
| 7:30 AM to 7:59 AM | 98 (9.0%) | 133 (15.1%) |
| 8:00 AM to 8:29 AM | 124 (11.4%) | 50 (5.7%) |
| 8:30 AM to 8:59 AM | 0 (0.0%) | 0 (0.0%) |
| 9:00 AM to 9:59 AM | 44 (4.1%) | 32 (3.6%) |
| 10:00 AM to 10:59 AM | 11 (1.0%) | 19 (2.2%) |
| 11:00 AM to 11:59 AM | 1 (0.1%) | 8 (0.9%) |
| 12:00 PM to 3:59 PM | 127 (11.7%) | 228 (25.9%) |
| 4:00 PM to 11:59 PM | 41 (3.8%) | 75 (8.5%) |
| Total | 1,086 (100.0%) | 881 (100.0%) |
Housing Occupancy in Blaine
Occupancy by Ownership in Blaine
Of the total 2,329 dwellings in Blaine, owner-occupied units account for 1,526 (65.5%), while renter-occupied units make up 803 (34.5%).
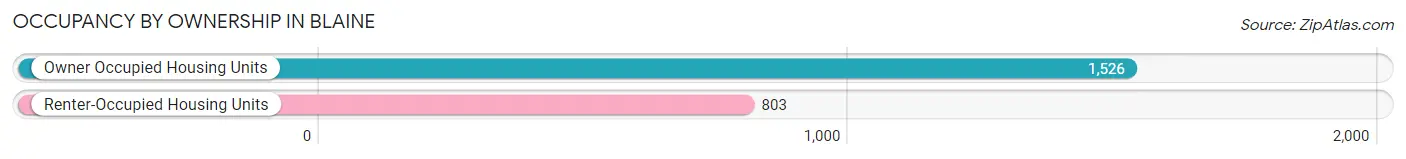
| Occupancy | # Housing Units | % Housing Units |
| Owner Occupied Housing Units | 1,526 | 65.5% |
| Renter-Occupied Housing Units | 803 | 34.5% |
| Total Occupied Housing Units | 2,329 | 100.0% |
Occupancy by Household Size in Blaine
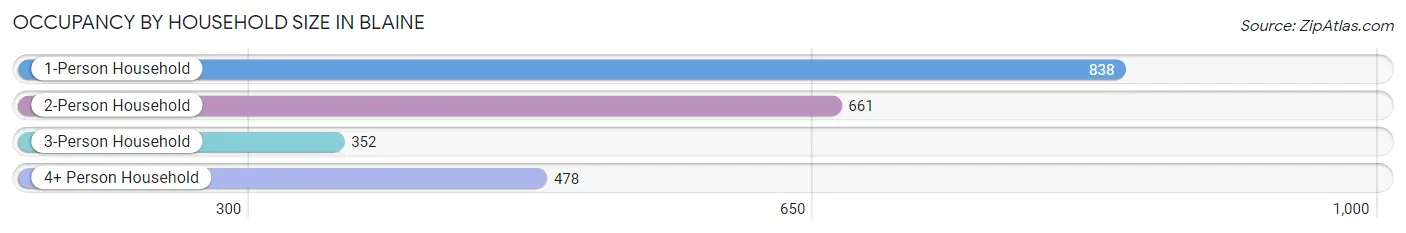
| Household Size | # Housing Units | % Housing Units |
| 1-Person Household | 838 | 36.0% |
| 2-Person Household | 661 | 28.4% |
| 3-Person Household | 352 | 15.1% |
| 4+ Person Household | 478 | 20.5% |
| Total Housing Units | 2,329 | 100.0% |
Occupancy by Ownership by Household Size in Blaine
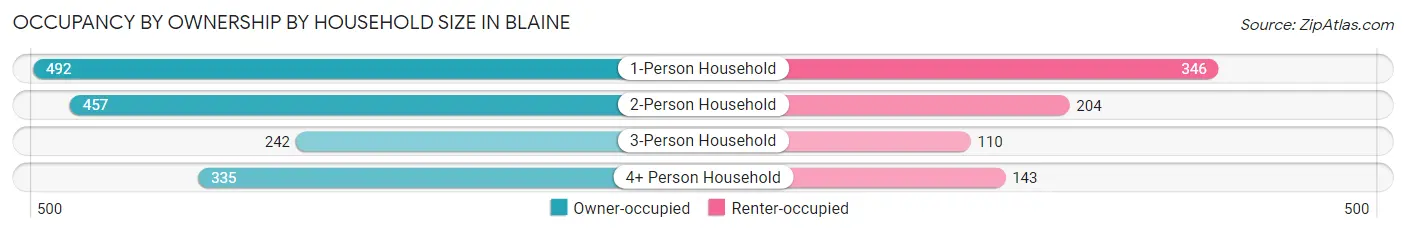
| Household Size | Owner-occupied | Renter-occupied |
| 1-Person Household | 492 (58.7%) | 346 (41.3%) |
| 2-Person Household | 457 (69.1%) | 204 (30.9%) |
| 3-Person Household | 242 (68.8%) | 110 (31.2%) |
| 4+ Person Household | 335 (70.1%) | 143 (29.9%) |
| Total Housing Units | 1,526 (65.5%) | 803 (34.5%) |
Occupancy by Educational Attainment in Blaine
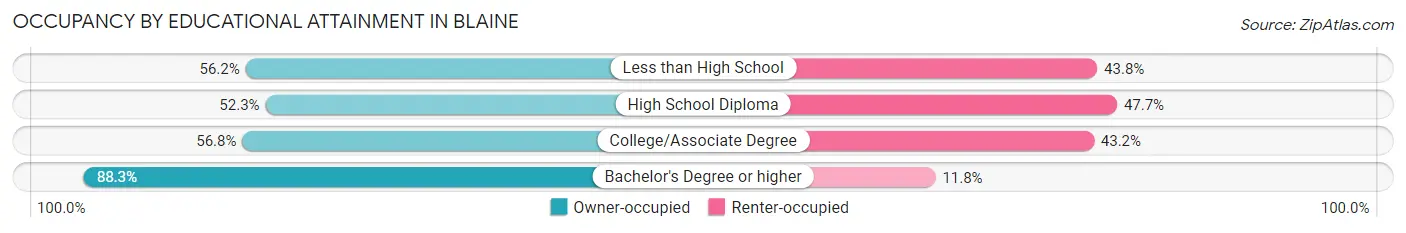
| Household Size | Owner-occupied | Renter-occupied |
| Less than High School | 59 (56.2%) | 46 (43.8%) |
| High School Diploma | 370 (52.3%) | 338 (47.7%) |
| College/Associate Degree | 436 (56.8%) | 331 (43.2%) |
| Bachelor's Degree or higher | 661 (88.2%) | 88 (11.7%) |
Occupancy by Age of Householder in Blaine
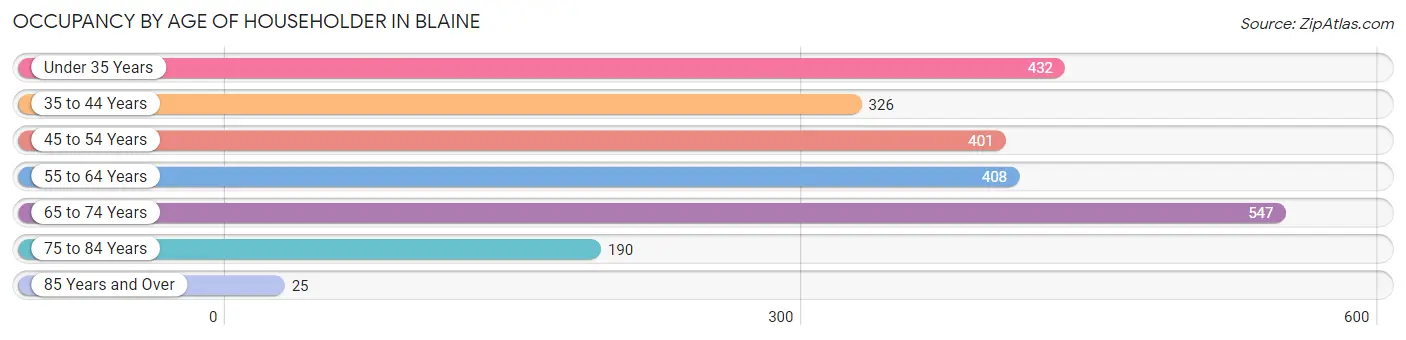
| Age Bracket | # Households | % Households |
| Under 35 Years | 432 | 18.5% |
| 35 to 44 Years | 326 | 14.0% |
| 45 to 54 Years | 401 | 17.2% |
| 55 to 64 Years | 408 | 17.5% |
| 65 to 74 Years | 547 | 23.5% |
| 75 to 84 Years | 190 | 8.2% |
| 85 Years and Over | 25 | 1.1% |
| Total | 2,329 | 100.0% |
Housing Finances in Blaine
Median Income by Occupancy in Blaine
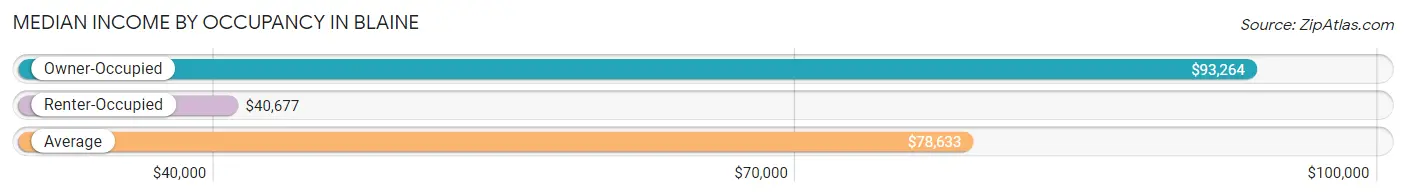
| Occupancy Type | # Households | Median Income |
| Owner-Occupied | 1,526 (65.5%) | $93,264 |
| Renter-Occupied | 803 (34.5%) | $40,677 |
| Average | 2,329 (100.0%) | $78,633 |
Occupancy by Householder Income Bracket in Blaine
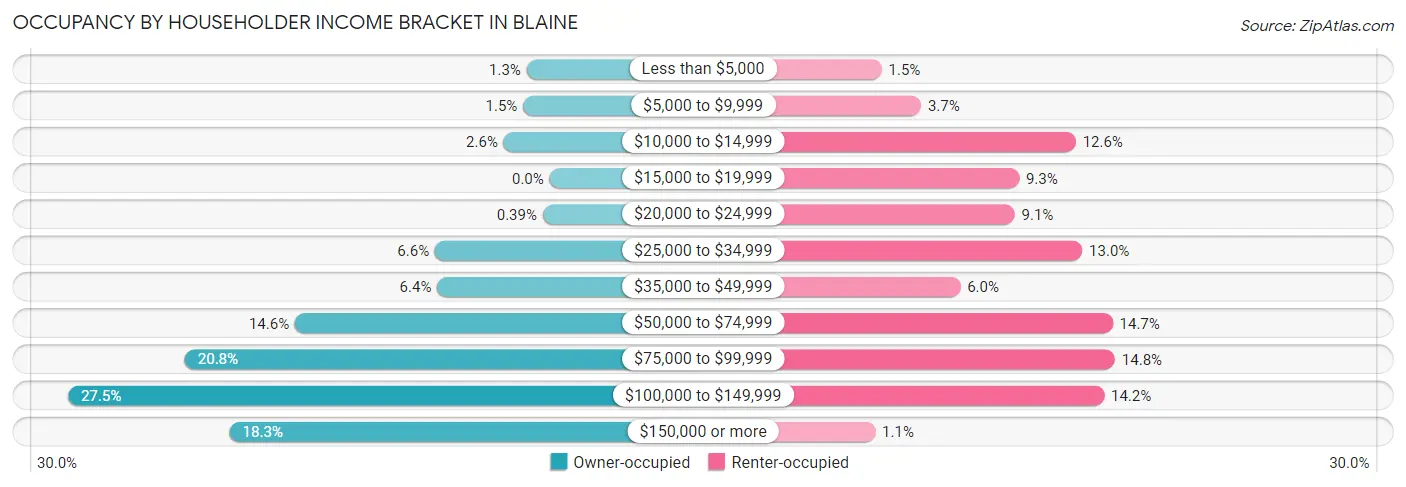
| Income Bracket | Owner-occupied | Renter-occupied |
| Less than $5,000 | 20 (1.3%) | 12 (1.5%) |
| $5,000 to $9,999 | 23 (1.5%) | 30 (3.7%) |
| $10,000 to $14,999 | 40 (2.6%) | 101 (12.6%) |
| $15,000 to $19,999 | 0 (0.0%) | 75 (9.3%) |
| $20,000 to $24,999 | 6 (0.4%) | 73 (9.1%) |
| $25,000 to $34,999 | 100 (6.6%) | 104 (13.0%) |
| $35,000 to $49,999 | 98 (6.4%) | 48 (6.0%) |
| $50,000 to $74,999 | 222 (14.5%) | 118 (14.7%) |
| $75,000 to $99,999 | 318 (20.8%) | 119 (14.8%) |
| $100,000 to $149,999 | 420 (27.5%) | 114 (14.2%) |
| $150,000 or more | 279 (18.3%) | 9 (1.1%) |
| Total | 1,526 (100.0%) | 803 (100.0%) |
Monthly Housing Cost Tiers in Blaine
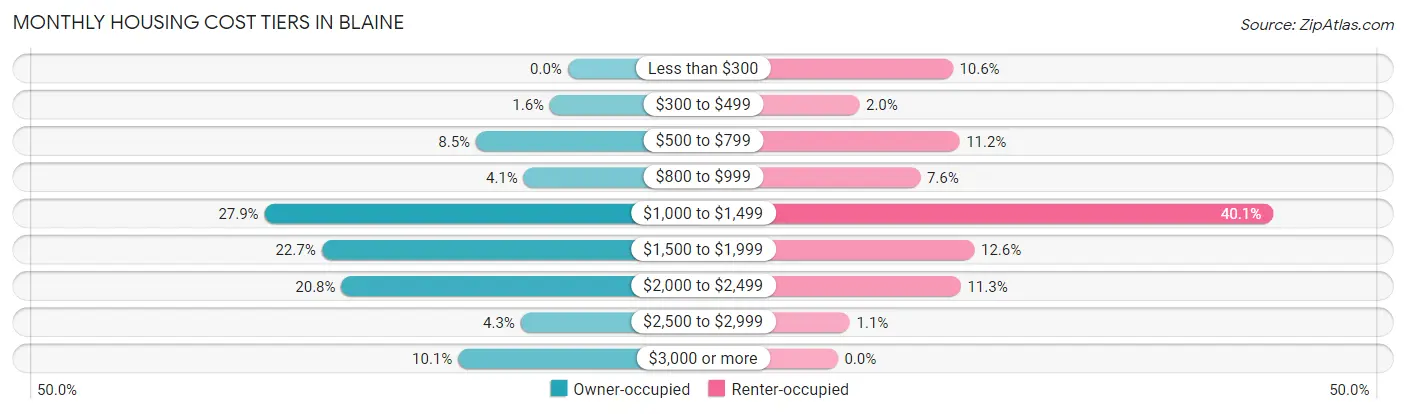
| Monthly Cost | Owner-occupied | Renter-occupied |
| Less than $300 | 0 (0.0%) | 85 (10.6%) |
| $300 to $499 | 25 (1.6%) | 16 (2.0%) |
| $500 to $799 | 129 (8.5%) | 90 (11.2%) |
| $800 to $999 | 62 (4.1%) | 61 (7.6%) |
| $1,000 to $1,499 | 426 (27.9%) | 322 (40.1%) |
| $1,500 to $1,999 | 346 (22.7%) | 101 (12.6%) |
| $2,000 to $2,499 | 318 (20.8%) | 91 (11.3%) |
| $2,500 to $2,999 | 66 (4.3%) | 9 (1.1%) |
| $3,000 or more | 154 (10.1%) | 0 (0.0%) |
| Total | 1,526 (100.0%) | 803 (100.0%) |
Physical Housing Characteristics in Blaine
Housing Structures in Blaine
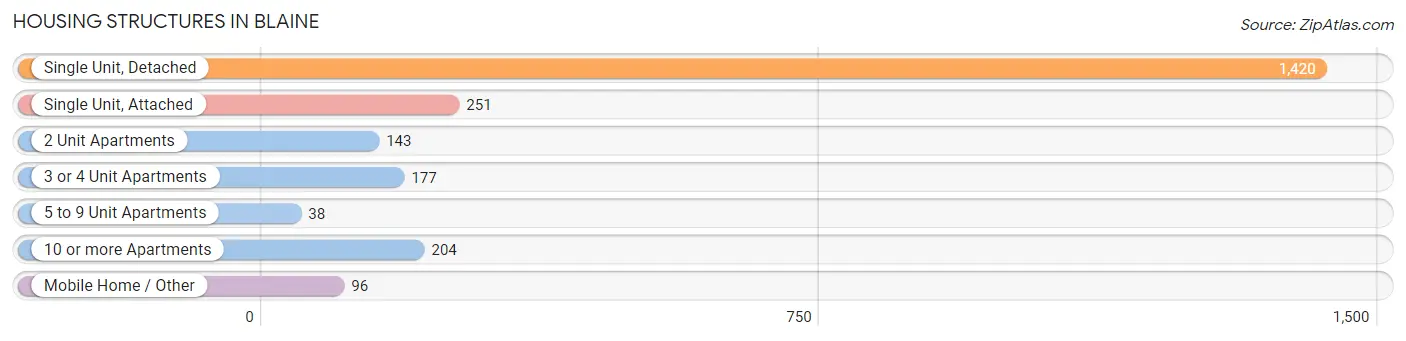
| Structure Type | # Housing Units | % Housing Units |
| Single Unit, Detached | 1,420 | 61.0% |
| Single Unit, Attached | 251 | 10.8% |
| 2 Unit Apartments | 143 | 6.1% |
| 3 or 4 Unit Apartments | 177 | 7.6% |
| 5 to 9 Unit Apartments | 38 | 1.6% |
| 10 or more Apartments | 204 | 8.8% |
| Mobile Home / Other | 96 | 4.1% |
| Total | 2,329 | 100.0% |
Housing Structures by Occupancy in Blaine
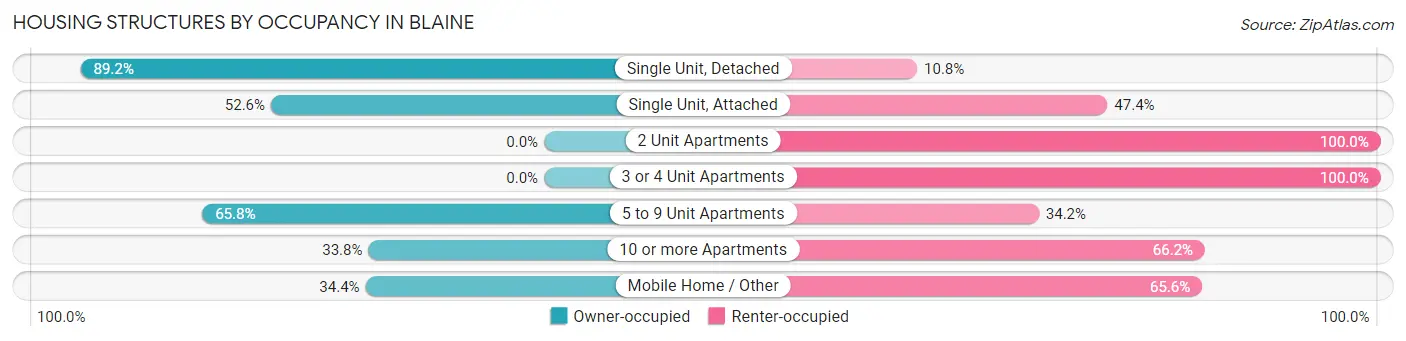
| Structure Type | Owner-occupied | Renter-occupied |
| Single Unit, Detached | 1,267 (89.2%) | 153 (10.8%) |
| Single Unit, Attached | 132 (52.6%) | 119 (47.4%) |
| 2 Unit Apartments | 0 (0.0%) | 143 (100.0%) |
| 3 or 4 Unit Apartments | 0 (0.0%) | 177 (100.0%) |
| 5 to 9 Unit Apartments | 25 (65.8%) | 13 (34.2%) |
| 10 or more Apartments | 69 (33.8%) | 135 (66.2%) |
| Mobile Home / Other | 33 (34.4%) | 63 (65.6%) |
| Total | 1,526 (65.5%) | 803 (34.5%) |
Housing Structures by Number of Rooms in Blaine
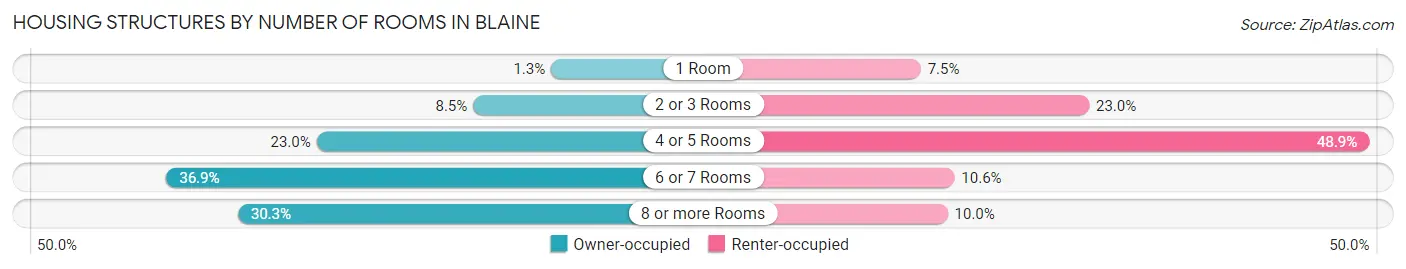
| Number of Rooms | Owner-occupied | Renter-occupied |
| 1 Room | 20 (1.3%) | 60 (7.5%) |
| 2 or 3 Rooms | 130 (8.5%) | 185 (23.0%) |
| 4 or 5 Rooms | 351 (23.0%) | 393 (48.9%) |
| 6 or 7 Rooms | 563 (36.9%) | 85 (10.6%) |
| 8 or more Rooms | 462 (30.3%) | 80 (10.0%) |
| Total | 1,526 (100.0%) | 803 (100.0%) |
Housing Structure by Heating Type in Blaine
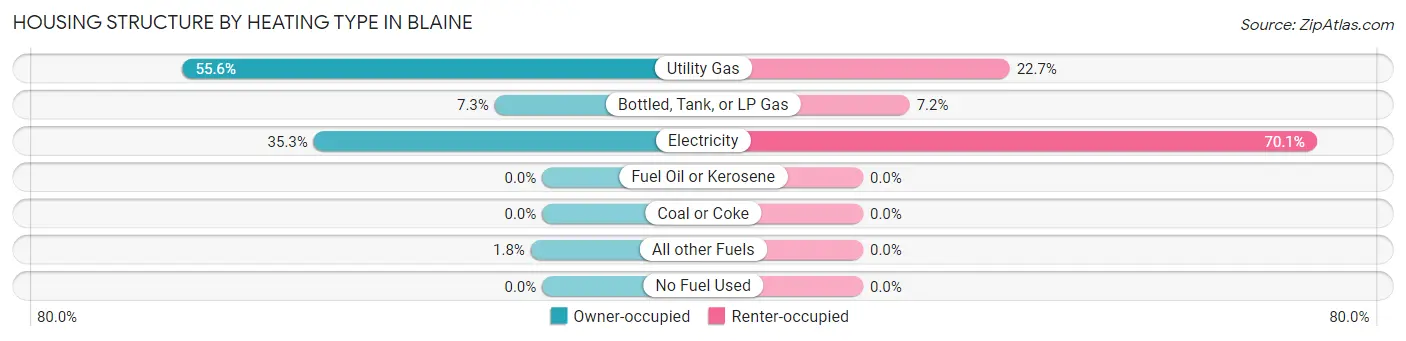
| Heating Type | Owner-occupied | Renter-occupied |
| Utility Gas | 848 (55.6%) | 182 (22.7%) |
| Bottled, Tank, or LP Gas | 112 (7.3%) | 58 (7.2%) |
| Electricity | 539 (35.3%) | 563 (70.1%) |
| Fuel Oil or Kerosene | 0 (0.0%) | 0 (0.0%) |
| Coal or Coke | 0 (0.0%) | 0 (0.0%) |
| All other Fuels | 27 (1.8%) | 0 (0.0%) |
| No Fuel Used | 0 (0.0%) | 0 (0.0%) |
| Total | 1,526 (100.0%) | 803 (100.0%) |
Household Vehicle Usage in Blaine
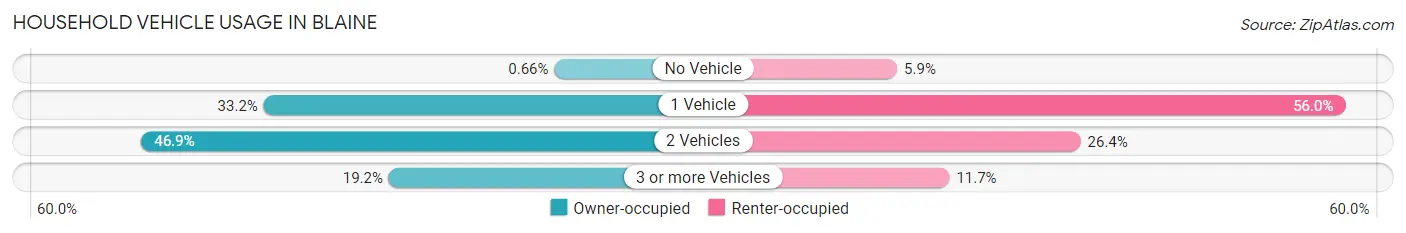
| Vehicles per Household | Owner-occupied | Renter-occupied |
| No Vehicle | 10 (0.7%) | 47 (5.9%) |
| 1 Vehicle | 507 (33.2%) | 450 (56.0%) |
| 2 Vehicles | 716 (46.9%) | 212 (26.4%) |
| 3 or more Vehicles | 293 (19.2%) | 94 (11.7%) |
| Total | 1,526 (100.0%) | 803 (100.0%) |
Real Estate & Mortgages in Blaine
Real Estate and Mortgage Overview in Blaine
| Characteristic | Without Mortgage | With Mortgage |
| Housing Units | 306 | 1,220 |
| Median Property Value | $667,600 | $428,700 |
| Median Household Income | $82,558 | $222 |
| Monthly Housing Costs | $877 | $154 |
| Real Estate Taxes | $4,591 | $48 |
Property Value by Mortgage Status in Blaine
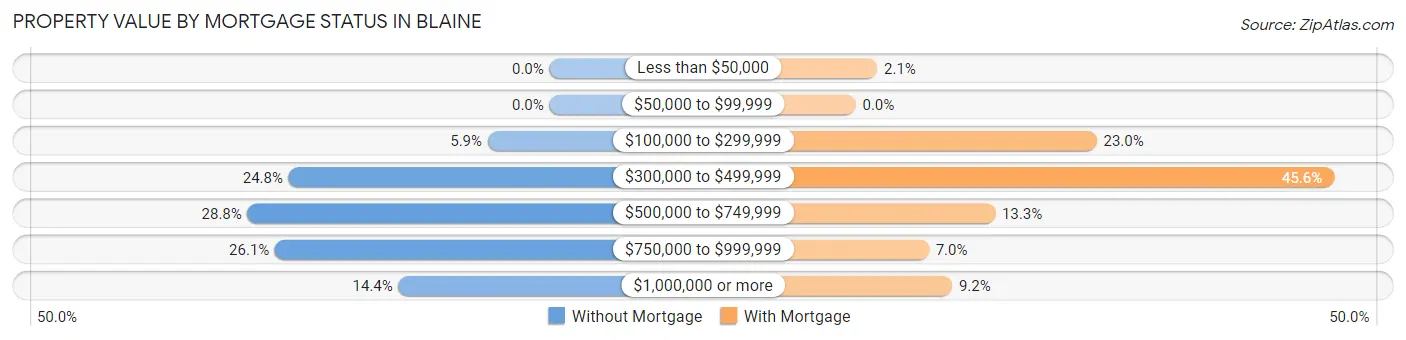
| Property Value | Without Mortgage | With Mortgage |
| Less than $50,000 | 0 (0.0%) | 25 (2.1%) |
| $50,000 to $99,999 | 0 (0.0%) | 0 (0.0%) |
| $100,000 to $299,999 | 18 (5.9%) | 280 (23.0%) |
| $300,000 to $499,999 | 76 (24.8%) | 556 (45.6%) |
| $500,000 to $749,999 | 88 (28.8%) | 162 (13.3%) |
| $750,000 to $999,999 | 80 (26.1%) | 85 (7.0%) |
| $1,000,000 or more | 44 (14.4%) | 112 (9.2%) |
| Total | 306 (100.0%) | 1,220 (100.0%) |
Household Income by Mortgage Status in Blaine
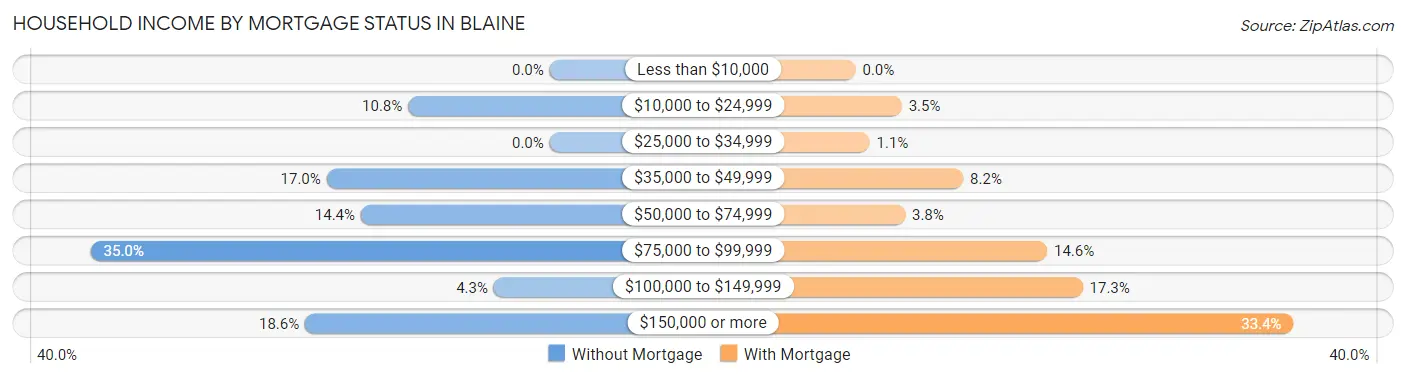
| Household Income | Without Mortgage | With Mortgage |
| Less than $10,000 | 0 (0.0%) | 0 (0.0%) |
| $10,000 to $24,999 | 33 (10.8%) | 43 (3.5%) |
| $25,000 to $34,999 | 0 (0.0%) | 13 (1.1%) |
| $35,000 to $49,999 | 52 (17.0%) | 100 (8.2%) |
| $50,000 to $74,999 | 44 (14.4%) | 46 (3.8%) |
| $75,000 to $99,999 | 107 (35.0%) | 178 (14.6%) |
| $100,000 to $149,999 | 13 (4.3%) | 211 (17.3%) |
| $150,000 or more | 57 (18.6%) | 407 (33.4%) |
| Total | 306 (100.0%) | 1,220 (100.0%) |
Property Value to Household Income Ratio in Blaine
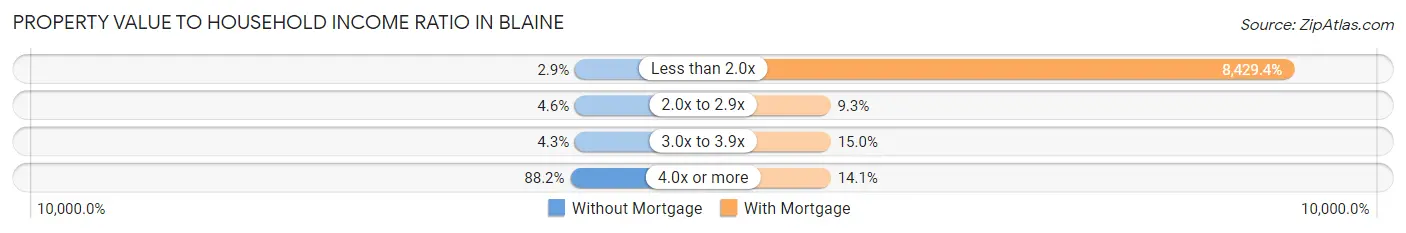
| Value-to-Income Ratio | Without Mortgage | With Mortgage |
| Less than 2.0x | 9 (2.9%) | 102,839 (8,429.4%) |
| 2.0x to 2.9x | 14 (4.6%) | 114 (9.3%) |
| 3.0x to 3.9x | 13 (4.3%) | 183 (15.0%) |
| 4.0x or more | 270 (88.2%) | 172 (14.1%) |
| Total | 306 (100.0%) | 1,220 (100.0%) |
Real Estate Taxes by Mortgage Status in Blaine
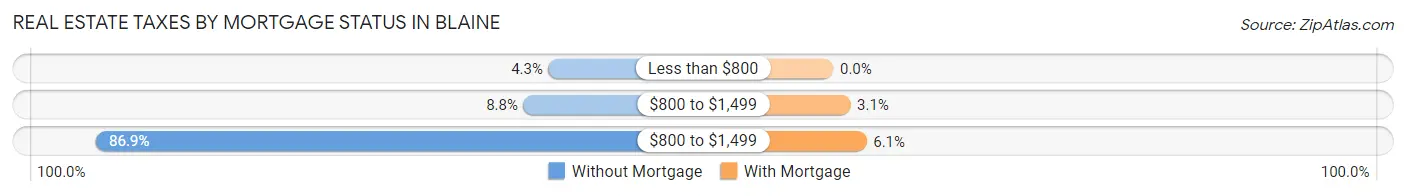
| Property Taxes | Without Mortgage | With Mortgage |
| Less than $800 | 13 (4.3%) | 0 (0.0%) |
| $800 to $1,499 | 27 (8.8%) | 38 (3.1%) |
| $800 to $1,499 | 266 (86.9%) | 74 (6.1%) |
| Total | 306 (100.0%) | 1,220 (100.0%) |
Health & Disability in Blaine
Health Insurance Coverage by Age in Blaine
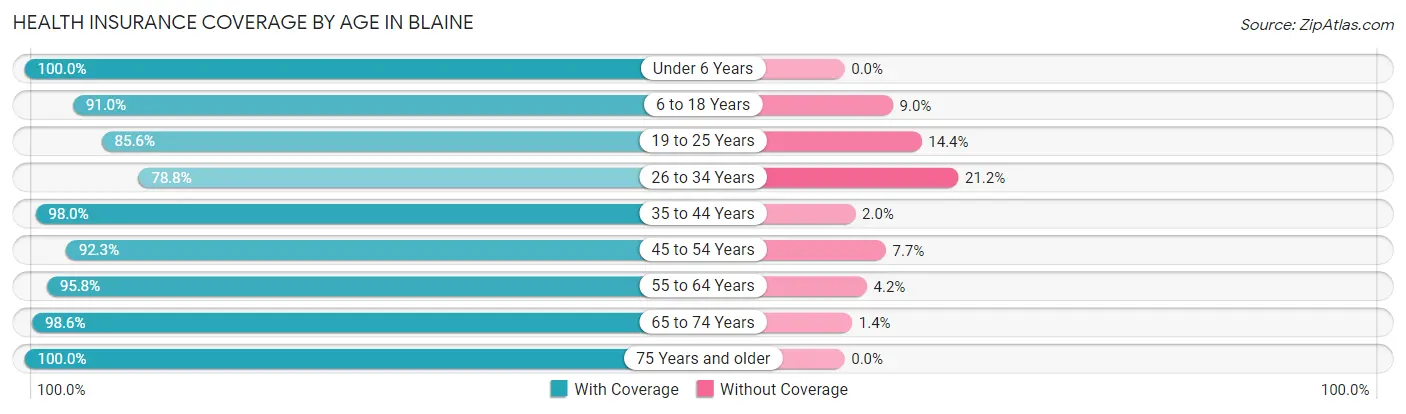
| Age Bracket | With Coverage | Without Coverage |
| Under 6 Years | 404 (100.0%) | 0 (0.0%) |
| 6 to 18 Years | 1,060 (91.0%) | 105 (9.0%) |
| 19 to 25 Years | 429 (85.6%) | 72 (14.4%) |
| 26 to 34 Years | 520 (78.8%) | 140 (21.2%) |
| 35 to 44 Years | 584 (98.0%) | 12 (2.0%) |
| 45 to 54 Years | 600 (92.3%) | 50 (7.7%) |
| 55 to 64 Years | 715 (95.8%) | 31 (4.2%) |
| 65 to 74 Years | 770 (98.6%) | 11 (1.4%) |
| 75 Years and older | 311 (100.0%) | 0 (0.0%) |
| Total | 5,393 (92.8%) | 421 (7.2%) |
Health Insurance Coverage by Citizenship Status in Blaine
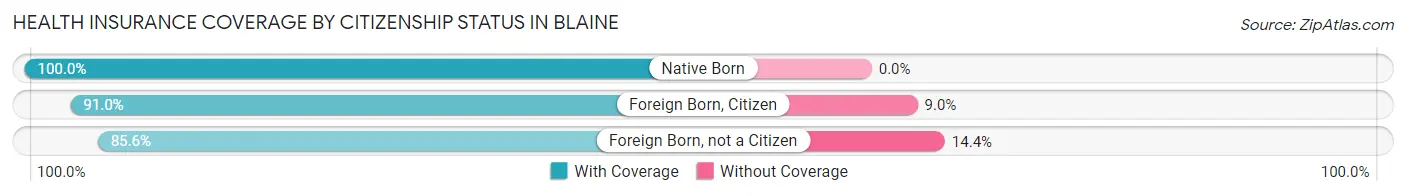
| Citizenship Status | With Coverage | Without Coverage |
| Native Born | 404 (100.0%) | 0 (0.0%) |
| Foreign Born, Citizen | 1,060 (91.0%) | 105 (9.0%) |
| Foreign Born, not a Citizen | 429 (85.6%) | 72 (14.4%) |
Health Insurance Coverage by Household Income in Blaine
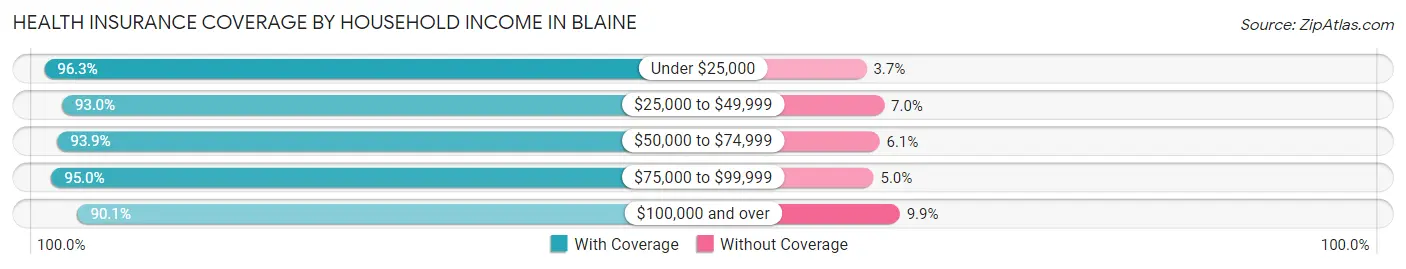
| Household Income | With Coverage | Without Coverage |
| Under $25,000 | 835 (96.3%) | 32 (3.7%) |
| $25,000 to $49,999 | 639 (93.0%) | 48 (7.0%) |
| $50,000 to $74,999 | 841 (93.9%) | 55 (6.1%) |
| $75,000 to $99,999 | 930 (95.0%) | 49 (5.0%) |
| $100,000 and over | 2,145 (90.1%) | 236 (9.9%) |
Public vs Private Health Insurance Coverage by Age in Blaine
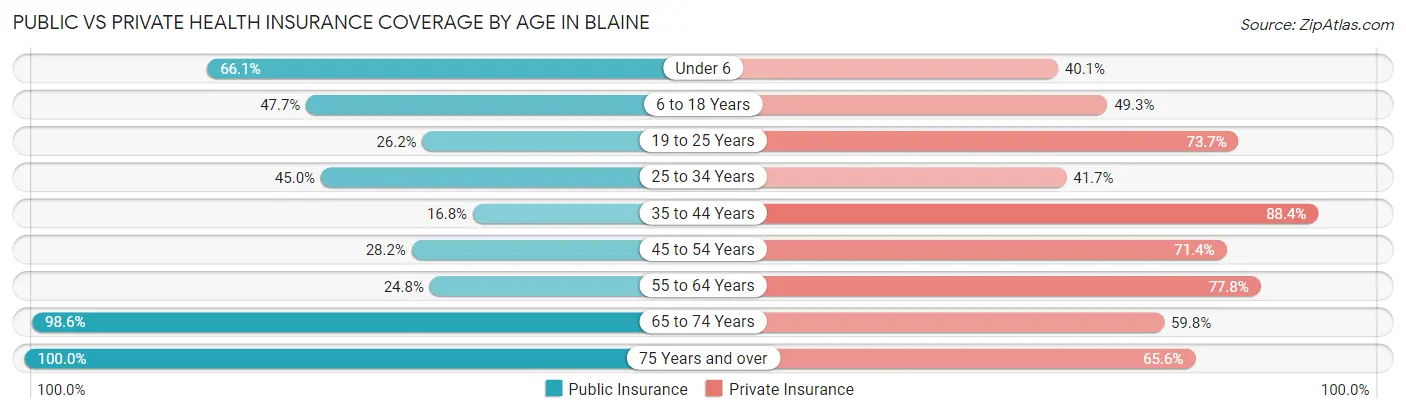
| Age Bracket | Public Insurance | Private Insurance |
| Under 6 | 267 (66.1%) | 162 (40.1%) |
| 6 to 18 Years | 556 (47.7%) | 574 (49.3%) |
| 19 to 25 Years | 131 (26.2%) | 369 (73.7%) |
| 25 to 34 Years | 297 (45.0%) | 275 (41.7%) |
| 35 to 44 Years | 100 (16.8%) | 527 (88.4%) |
| 45 to 54 Years | 183 (28.1%) | 464 (71.4%) |
| 55 to 64 Years | 185 (24.8%) | 580 (77.7%) |
| 65 to 74 Years | 770 (98.6%) | 467 (59.8%) |
| 75 Years and over | 311 (100.0%) | 204 (65.6%) |
| Total | 2,800 (48.2%) | 3,622 (62.3%) |
Disability Status by Sex by Age in Blaine
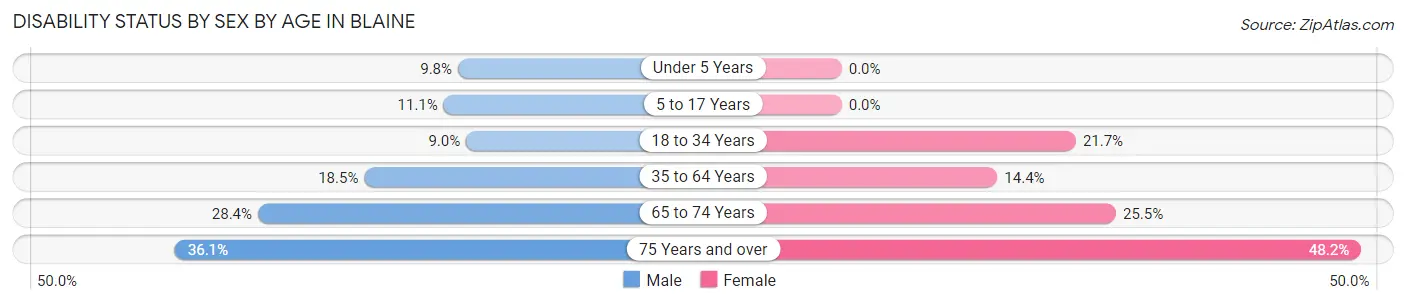
| Age Bracket | Male | Female |
| Under 5 Years | 19 (9.8%) | 0 (0.0%) |
| 5 to 17 Years | 60 (11.1%) | 0 (0.0%) |
| 18 to 34 Years | 51 (9.0%) | 158 (21.7%) |
| 35 to 64 Years | 180 (18.5%) | 147 (14.4%) |
| 65 to 74 Years | 110 (28.3%) | 100 (25.5%) |
| 75 Years and over | 62 (36.0%) | 67 (48.2%) |
Disability Class by Sex by Age in Blaine
Disability Class: Hearing Difficulty
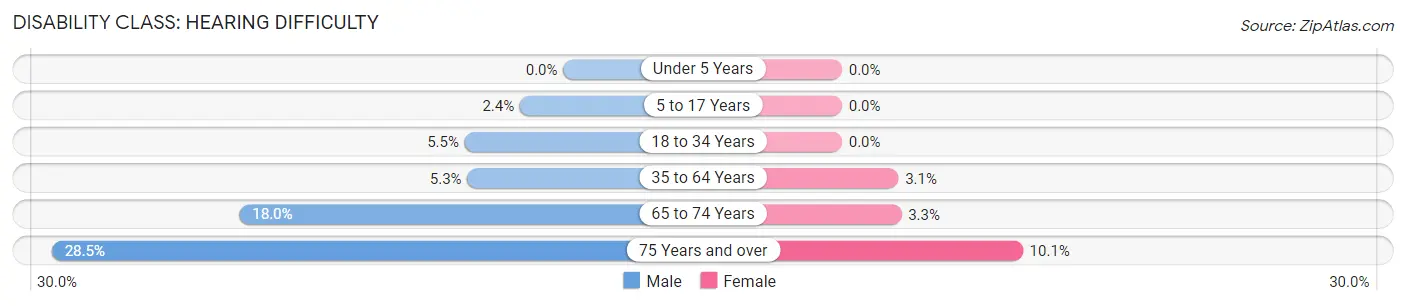
| Age Bracket | Male | Female |
| Under 5 Years | 0 (0.0%) | 0 (0.0%) |
| 5 to 17 Years | 13 (2.4%) | 0 (0.0%) |
| 18 to 34 Years | 31 (5.5%) | 0 (0.0%) |
| 35 to 64 Years | 52 (5.3%) | 32 (3.1%) |
| 65 to 74 Years | 70 (18.0%) | 13 (3.3%) |
| 75 Years and over | 49 (28.5%) | 14 (10.1%) |
Disability Class: Vision Difficulty
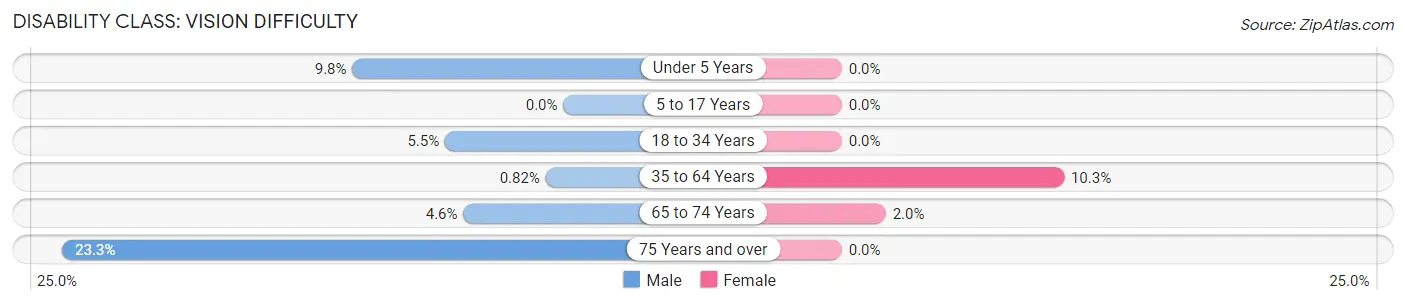
| Age Bracket | Male | Female |
| Under 5 Years | 19 (9.8%) | 0 (0.0%) |
| 5 to 17 Years | 0 (0.0%) | 0 (0.0%) |
| 18 to 34 Years | 31 (5.5%) | 0 (0.0%) |
| 35 to 64 Years | 8 (0.8%) | 105 (10.3%) |
| 65 to 74 Years | 18 (4.6%) | 8 (2.0%) |
| 75 Years and over | 40 (23.3%) | 0 (0.0%) |
Disability Class: Cognitive Difficulty
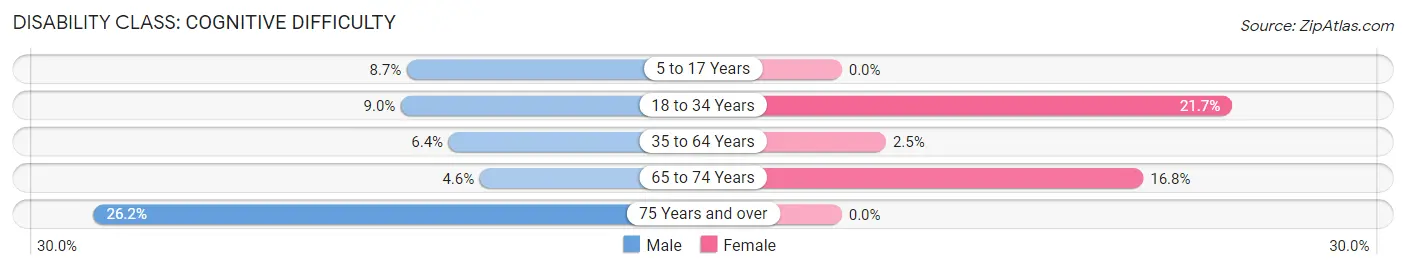
| Age Bracket | Male | Female |
| 5 to 17 Years | 47 (8.7%) | 0 (0.0%) |
| 18 to 34 Years | 51 (9.0%) | 158 (21.7%) |
| 35 to 64 Years | 62 (6.4%) | 25 (2.5%) |
| 65 to 74 Years | 18 (4.6%) | 66 (16.8%) |
| 75 Years and over | 45 (26.2%) | 0 (0.0%) |
Disability Class: Ambulatory Difficulty
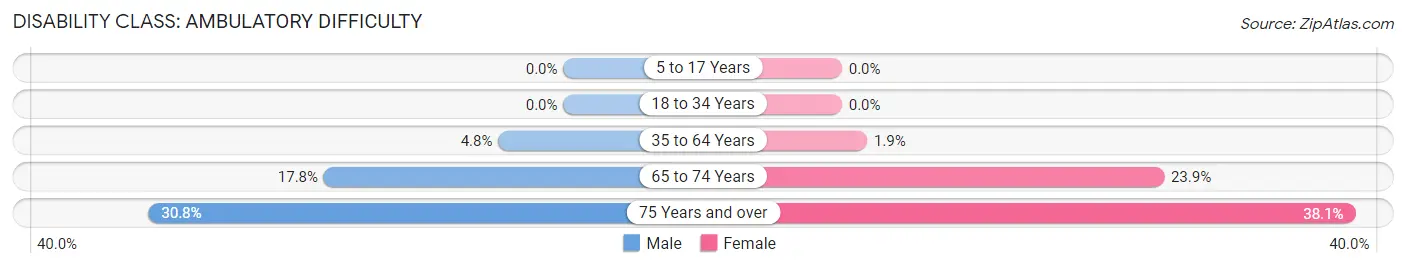
| Age Bracket | Male | Female |
| 5 to 17 Years | 0 (0.0%) | 0 (0.0%) |
| 18 to 34 Years | 0 (0.0%) | 0 (0.0%) |
| 35 to 64 Years | 47 (4.8%) | 19 (1.9%) |
| 65 to 74 Years | 69 (17.8%) | 94 (23.9%) |
| 75 Years and over | 53 (30.8%) | 53 (38.1%) |
Disability Class: Self-Care Difficulty
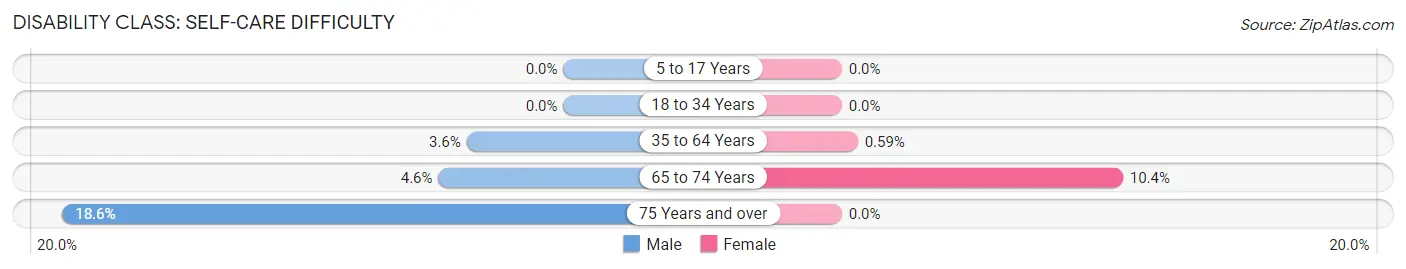
| Age Bracket | Male | Female |
| 5 to 17 Years | 0 (0.0%) | 0 (0.0%) |
| 18 to 34 Years | 0 (0.0%) | 0 (0.0%) |
| 35 to 64 Years | 35 (3.6%) | 6 (0.6%) |
| 65 to 74 Years | 18 (4.6%) | 41 (10.4%) |
| 75 Years and over | 32 (18.6%) | 0 (0.0%) |
Technology Access in Blaine
Computing Device Access in Blaine
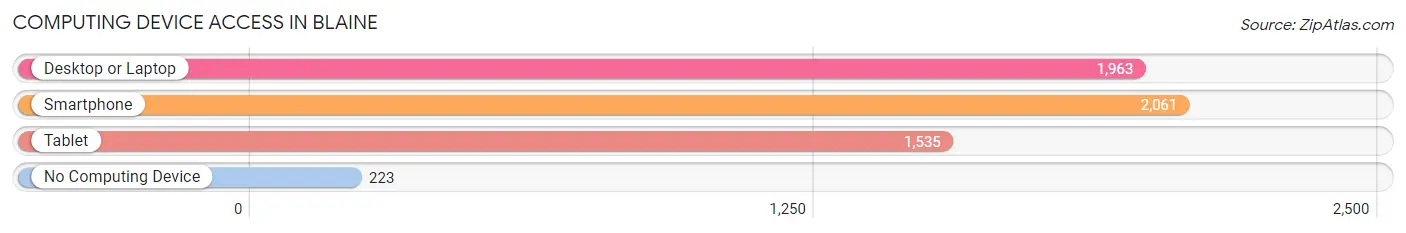
| Device Type | # Households | % Households |
| Desktop or Laptop | 1,963 | 84.3% |
| Smartphone | 2,061 | 88.5% |
| Tablet | 1,535 | 65.9% |
| No Computing Device | 223 | 9.6% |
| Total | 2,329 | 100.0% |
Internet Access in Blaine
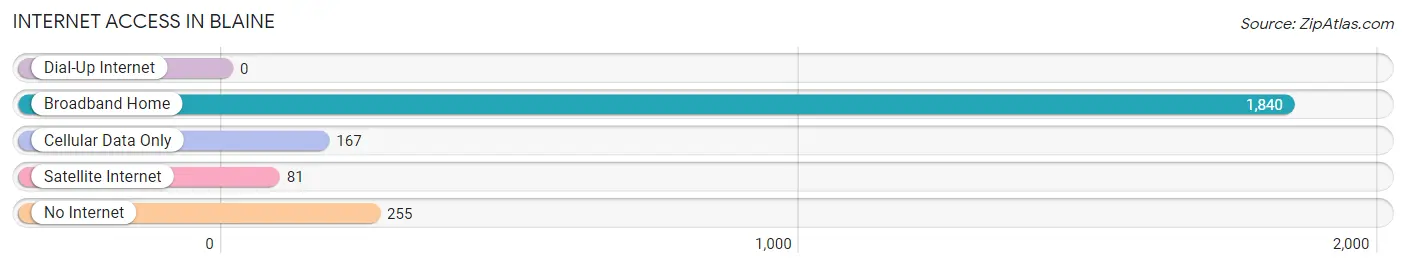
| Internet Type | # Households | % Households |
| Dial-Up Internet | 0 | 0.0% |
| Broadband Home | 1,840 | 79.0% |
| Cellular Data Only | 167 | 7.2% |
| Satellite Internet | 81 | 3.5% |
| No Internet | 255 | 11.0% |
| Total | 2,329 | 100.0% |
Blaine Summary
Blaine, Washington is a small city located in Whatcom County, Washington, United States. It is situated on the northern border of the United States, just south of the Canadian border. The city is located on the shores of Drayton Harbor, a large bay that is part of the Salish Sea. Blaine is the northernmost city in the contiguous United States, and is the only city in the United States that borders Canada.
History
The area that is now Blaine was first inhabited by the Lummi and Semiahmoo Native American tribes. The first European settlers arrived in the area in the late 1800s, and the city was officially incorporated in 1890. The city was named after James G. Blaine, a former United States Secretary of State.
In the early 1900s, Blaine was a major port of entry for immigrants coming to the United States from Canada. The city was also a major center for the fishing industry, and was home to several canneries. In the 1950s, the city began to experience a decline in its fishing industry, and the canneries eventually closed.
Geography
Blaine is located in Whatcom County, Washington, United States. It is situated on the northern border of the United States, just south of the Canadian border. The city is located on the shores of Drayton Harbor, a large bay that is part of the Salish Sea. Blaine is the northernmost city in the contiguous United States, and is the only city in the United States that borders Canada.
The city has a total area of 4.2 square miles, of which 3.9 square miles is land and 0.3 square miles is water. The city is located in a temperate rainforest climate, with mild temperatures and abundant rainfall.
Economy
Blaine’s economy is largely based on tourism and retail. The city is home to several tourist attractions, including the Peace Arch State Park, the Semiahmoo Resort, and the Drayton Harbor Maritime Museum. The city is also home to several retail stores, including a Walmart Supercenter and a Home Depot.
The city is also home to several manufacturing companies, including a paper mill and a boat building company. The city is also home to several seafood processing companies, which process and package seafood for export to other countries.
Demographics
As of the 2010 census, the population of Blaine was 4,684. The racial makeup of the city was 87.3% White, 0.7% African American, 1.2% Native American, 2.2% Asian, 0.2% Pacific Islander, 5.2% from other races, and 3.4% from two or more races. Hispanic or Latino of any race were 11.2% of the population.
The median household income in Blaine was $45,938, and the median family income was $51,944. The per capita income for the city was $22,845. About 11.2% of families and 14.2% of the population were below the poverty line, including 19.2% of those under age 18 and 8.2% of those age 65 or over.
Common Questions
What is Per Capita Income in Blaine?
Per Capita income in Blaine is $37,061.
What is the Median Family Income in Blaine?
Median Family Income in Blaine is $82,616.
What is the Median Household income in Blaine?
Median Household Income in Blaine is $78,633.
What is Income or Wage Gap in Blaine?
Income or Wage Gap in Blaine is 42.2%.
Women in Blaine earn 57.8 cents for every dollar earned by a man.
What is Inequality or Gini Index in Blaine?
Inequality or Gini Index in Blaine is 0.42.
What is the Total Population of Blaine?
Total Population of Blaine is 5,865.
What is the Total Male Population of Blaine?
Total Male Population of Blaine is 2,833.
What is the Total Female Population of Blaine?
Total Female Population of Blaine is 3,032.
What is the Ratio of Males per 100 Females in Blaine?
There are 93.44 Males per 100 Females in Blaine.
What is the Ratio of Females per 100 Males in Blaine?
There are 107.02 Females per 100 Males in Blaine.
What is the Median Population Age in Blaine?
Median Population Age in Blaine is 38.1 Years.
What is the Average Family Size in Blaine
Average Family Size in Blaine is 3.1 People.
What is the Average Household Size in Blaine
Average Household Size in Blaine is 2.5 People.
How Large is the Labor Force in Blaine?
There are 2,553 People in the Labor Forcein in Blaine.
What is the Percentage of People in the Labor Force in Blaine?
54.0% of People are in the Labor Force in Blaine.
What is the Unemployment Rate in Blaine?
Unemployment Rate in Blaine is 9.7%.