Zip Codes with the Highest Percentage of Population Employed in Security & Protection in Kennewick, WA
RELATED REPORTS & OPTIONS
Security & Protection
Kennewick
Compare Zip Codes
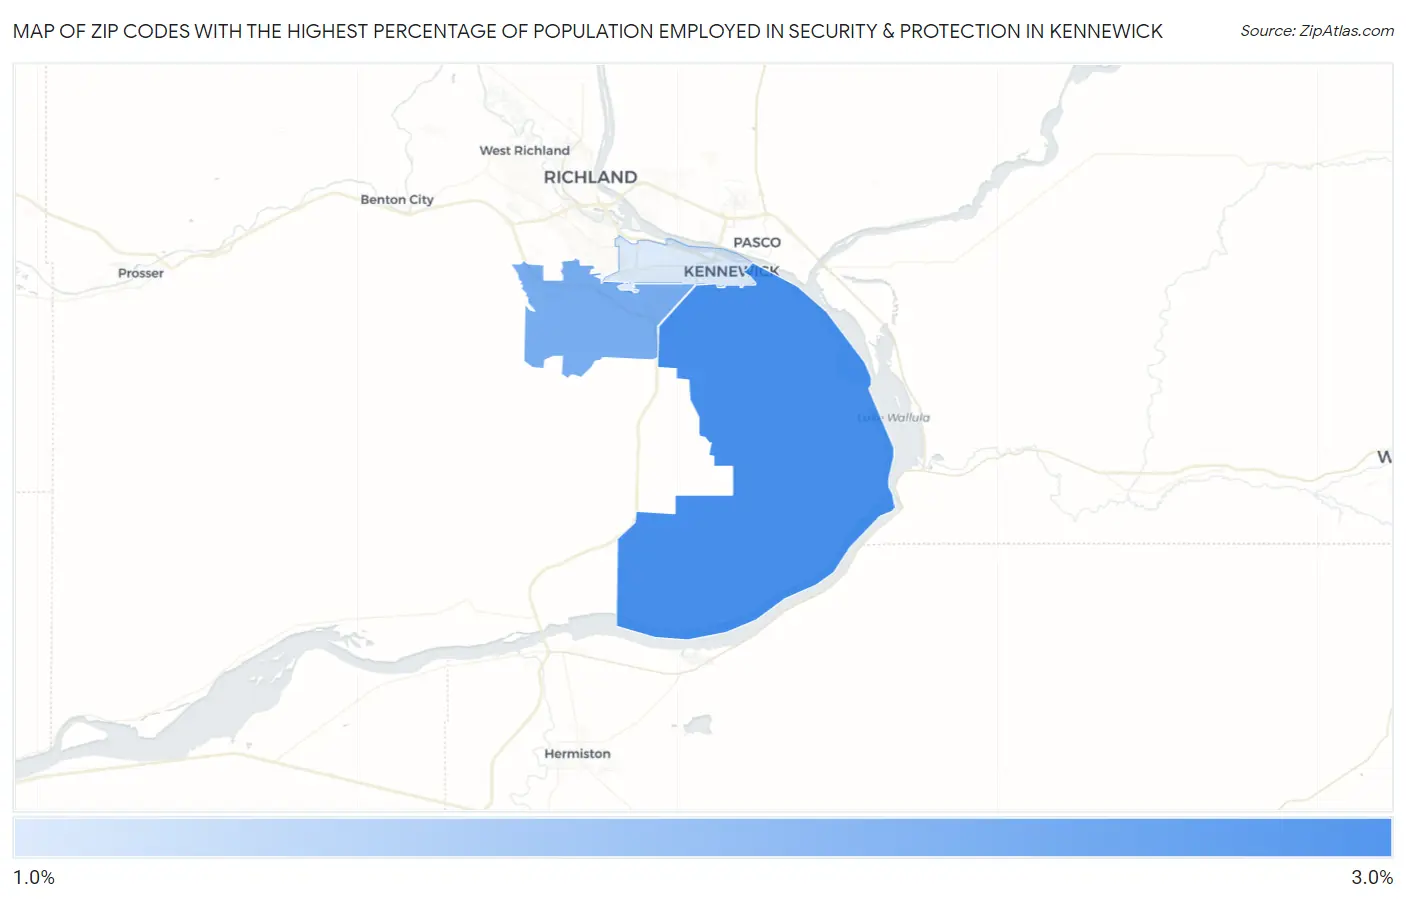
Map of Zip Codes with the Highest Percentage of Population Employed in Security & Protection in Kennewick
1.2%
2.8%
Zip Codes with the Highest Percentage of Population Employed in Security & Protection in Kennewick, WA
| Zip Code | % Employed | vs State | vs National | |
| 1. | 99337 | 2.8% | 1.8%(+1.03)#133 | 2.1%(+0.695)#7,899 |
| 2. | 99338 | 2.3% | 1.8%(+0.494)#190 | 2.1%(+0.159)#10,607 |
| 3. | 99336 | 1.2% | 1.8%(-0.583)#346 | 2.1%(-0.918)#18,278 |
1
Common Questions
What are the Top Zip Codes with the Highest Percentage of Population Employed in Security & Protection in Kennewick, WA?
Top Zip Codes with the Highest Percentage of Population Employed in Security & Protection in Kennewick, WA are:
What zip code has the Highest Percentage of Population Employed in Security & Protection in Kennewick, WA?
99337 has the Highest Percentage of Population Employed in Security & Protection in Kennewick, WA with 2.8%.
What is the Percentage of Population Employed in Security & Protection in Kennewick, WA?
Percentage of Population Employed in Security & Protection in Kennewick is 1.9%.
What is the Percentage of Population Employed in Security & Protection in Washington?
Percentage of Population Employed in Security & Protection in Washington is 1.8%.
What is the Percentage of Population Employed in Security & Protection in the United States?
Percentage of Population Employed in Security & Protection in the United States is 2.1%.