Zip Codes with the Highest Percentage of Population Employed in Security & Protection in Port Angeles, WA
RELATED REPORTS & OPTIONS
Security & Protection
Port Angeles
Compare Zip Codes
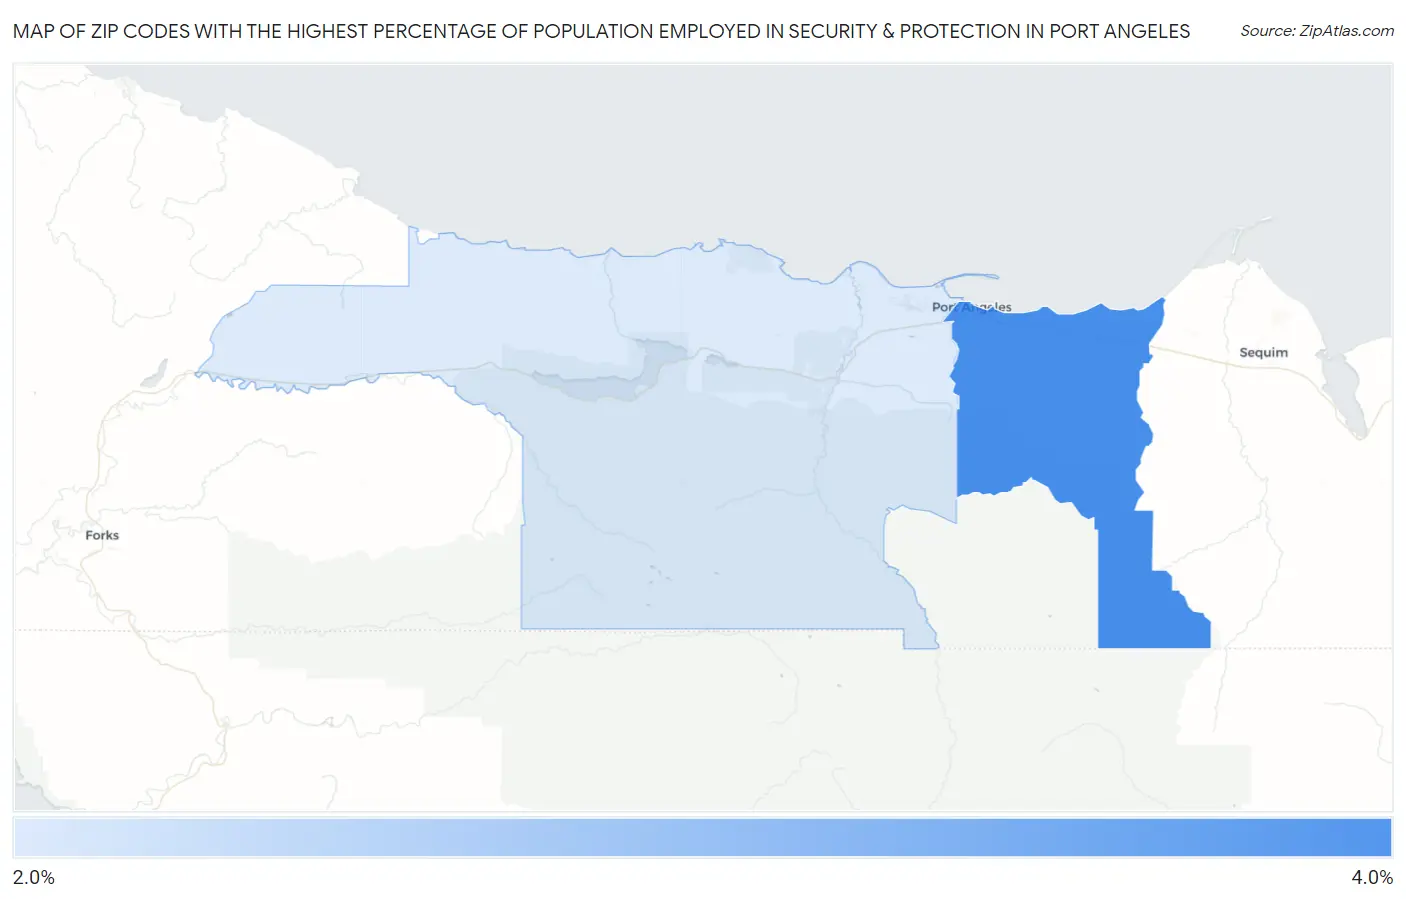
Map of Zip Codes with the Highest Percentage of Population Employed in Security & Protection in Port Angeles
2.5%
3.0%
Zip Codes with the Highest Percentage of Population Employed in Security & Protection in Port Angeles, WA
| Zip Code | % Employed | vs State | vs National | |
| 1. | 98362 | 3.0% | 1.8%(+1.23)#111 | 2.1%(+0.892)#7,068 |
| 2. | 98363 | 2.5% | 1.8%(+0.719)#160 | 2.1%(+0.384)#9,341 |
1
Common Questions
What are the Top Zip Codes with the Highest Percentage of Population Employed in Security & Protection in Port Angeles, WA?
Top Zip Codes with the Highest Percentage of Population Employed in Security & Protection in Port Angeles, WA are:
What zip code has the Highest Percentage of Population Employed in Security & Protection in Port Angeles, WA?
98362 has the Highest Percentage of Population Employed in Security & Protection in Port Angeles, WA with 3.0%.
What is the Percentage of Population Employed in Security & Protection in Port Angeles, WA?
Percentage of Population Employed in Security & Protection in Port Angeles is 3.4%.
What is the Percentage of Population Employed in Security & Protection in Washington?
Percentage of Population Employed in Security & Protection in Washington is 1.8%.
What is the Percentage of Population Employed in Security & Protection in the United States?
Percentage of Population Employed in Security & Protection in the United States is 2.1%.