Hoquiam, WA Map & Demographics
Hoquiam Map
Hoquiam Overview
$31,024
PER CAPITA INCOME
$63,013
AVG FAMILY INCOME
$47,614
AVG HOUSEHOLD INCOME
18.7%
WAGE / INCOME GAP [ % ]
81.3¢/ $1
WAGE / INCOME GAP [ $ ]
0.48
INEQUALITY / GINI INDEX
8,742
TOTAL POPULATION
4,433
MALE POPULATION
4,309
FEMALE POPULATION
102.88
MALES / 100 FEMALES
97.20
FEMALES / 100 MALES
41.4
MEDIAN AGE
3.0
AVG FAMILY SIZE
2.3
AVG HOUSEHOLD SIZE
3,854
LABOR FORCE [ PEOPLE ]
53.7%
PERCENT IN LABOR FORCE
10.0%
UNEMPLOYMENT RATE
Hoquiam Zip Codes
Hoquiam Area Codes
Income in Hoquiam
Income Overview in Hoquiam
Per Capita Income in Hoquiam is $31,024, while median incomes of families and households are $63,013 and $47,614 respectively.
| Characteristic | Number | Measure |
| Per Capita Income | 8,742 | $31,024 |
| Median Family Income | 2,026 | $63,013 |
| Mean Family Income | 2,026 | $90,959 |
| Median Household Income | 3,747 | $47,614 |
| Mean Household Income | 3,747 | $70,675 |
| Income Deficit | 2,026 | $0 |
| Wage / Income Gap (%) | 8,742 | 18.65% |
| Wage / Income Gap ($) | 8,742 | 81.35¢ per $1 |
| Gini / Inequality Index | 8,742 | 0.48 |
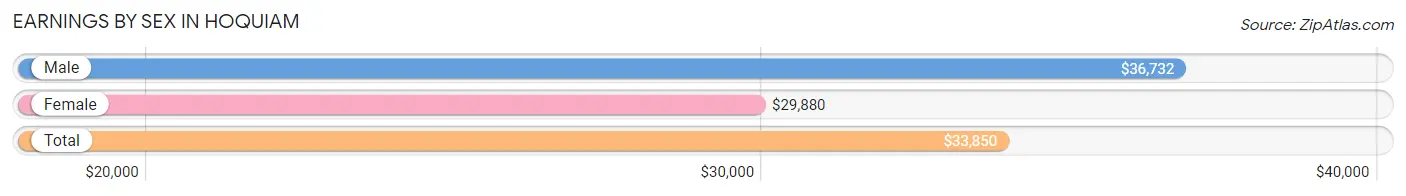
Earnings by Sex in Hoquiam
Average Earnings in Hoquiam are $33,850, $36,732 for men and $29,880 for women, a difference of 18.6%.
| Sex | Number | Average Earnings |
| Male | 2,256 (56.8%) | $36,732 |
| Female | 1,719 (43.2%) | $29,880 |
| Total | 3,975 (100.0%) | $33,850 |
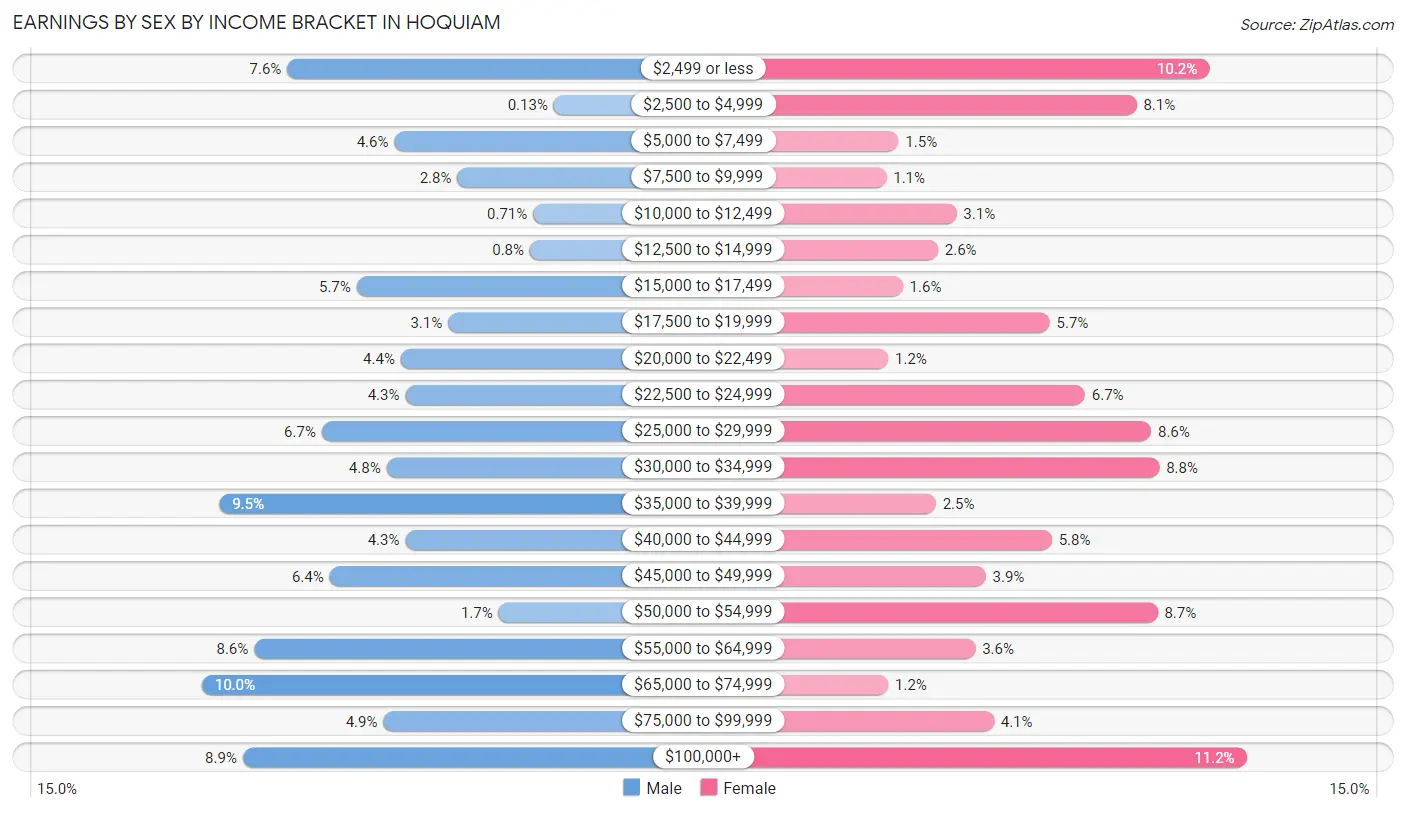
Earnings by Sex by Income Bracket in Hoquiam
The most common earnings brackets in Hoquiam are $65,000 to $74,999 for men (226 | 10.0%) and $100,000+ for women (193 | 11.2%).
| Income | Male | Female |
| $2,499 or less | 172 (7.6%) | 175 (10.2%) |
| $2,500 to $4,999 | 3 (0.1%) | 140 (8.1%) |
| $5,000 to $7,499 | 104 (4.6%) | 25 (1.5%) |
| $7,500 to $9,999 | 64 (2.8%) | 19 (1.1%) |
| $10,000 to $12,499 | 16 (0.7%) | 53 (3.1%) |
| $12,500 to $14,999 | 18 (0.8%) | 44 (2.6%) |
| $15,000 to $17,499 | 128 (5.7%) | 27 (1.6%) |
| $17,500 to $19,999 | 70 (3.1%) | 98 (5.7%) |
| $20,000 to $22,499 | 100 (4.4%) | 20 (1.2%) |
| $22,500 to $24,999 | 97 (4.3%) | 115 (6.7%) |
| $25,000 to $29,999 | 150 (6.7%) | 147 (8.6%) |
| $30,000 to $34,999 | 109 (4.8%) | 151 (8.8%) |
| $35,000 to $39,999 | 215 (9.5%) | 43 (2.5%) |
| $40,000 to $44,999 | 97 (4.3%) | 99 (5.8%) |
| $45,000 to $49,999 | 145 (6.4%) | 67 (3.9%) |
| $50,000 to $54,999 | 38 (1.7%) | 150 (8.7%) |
| $55,000 to $64,999 | 193 (8.6%) | 62 (3.6%) |
| $65,000 to $74,999 | 226 (10.0%) | 20 (1.2%) |
| $75,000 to $99,999 | 111 (4.9%) | 71 (4.1%) |
| $100,000+ | 200 (8.9%) | 193 (11.2%) |
| Total | 2,256 (100.0%) | 1,719 (100.0%) |
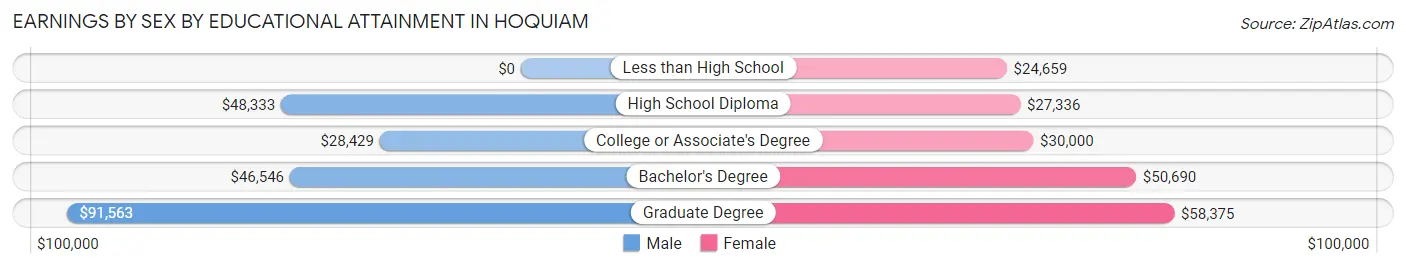
Earnings by Sex by Educational Attainment in Hoquiam
Average earnings in Hoquiam are $39,492 for men and $31,897 for women, a difference of 19.2%. Men with an educational attainment of graduate degree enjoy the highest average annual earnings of $91,563, while those with college or associate's degree education earn the least with $28,429. Women with an educational attainment of graduate degree earn the most with the average annual earnings of $58,375, while those with less than high school education have the smallest earnings of $24,659.
| Educational Attainment | Male Income | Female Income |
| Less than High School | - | - |
| High School Diploma | $48,333 | $27,336 |
| College or Associate's Degree | $28,429 | $30,000 |
| Bachelor's Degree | $46,546 | $50,690 |
| Graduate Degree | $91,563 | $58,375 |
| Total | $39,492 | $31,897 |
Family Income in Hoquiam
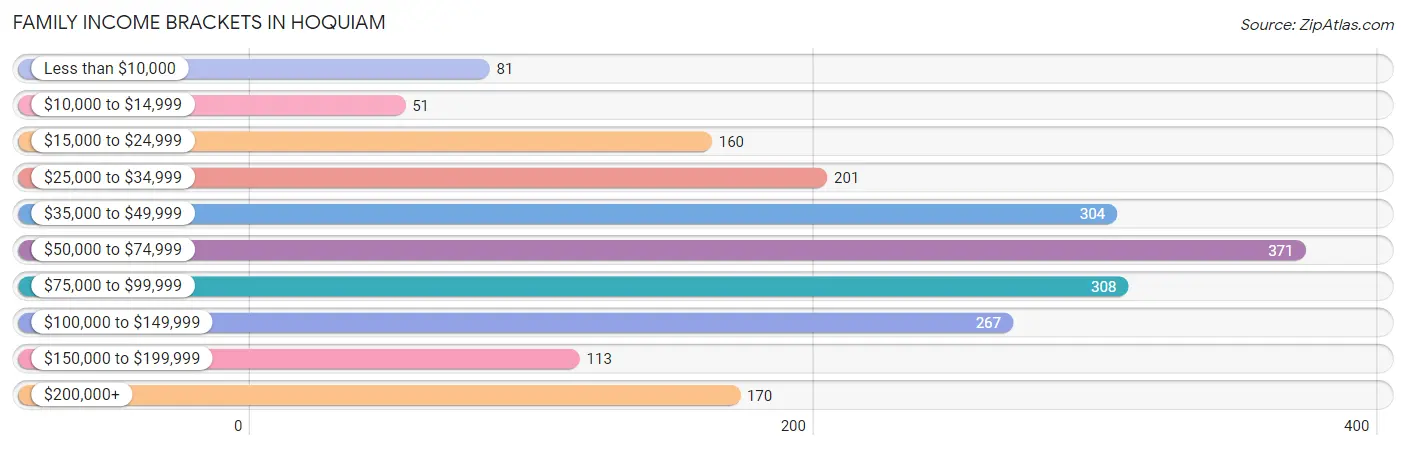
Family Income Brackets in Hoquiam
According to the Hoquiam family income data, there are 371 families falling into the $50,000 to $74,999 income range, which is the most common income bracket and makes up 18.3% of all families. Conversely, the $10,000 to $14,999 income bracket is the least frequent group with only 51 families (2.5%) belonging to this category.
| Income Bracket | # Families | % Families |
| Less than $10,000 | 81 | 4.0% |
| $10,000 to $14,999 | 51 | 2.5% |
| $15,000 to $24,999 | 160 | 7.9% |
| $25,000 to $34,999 | 201 | 9.9% |
| $35,000 to $49,999 | 304 | 15.0% |
| $50,000 to $74,999 | 371 | 18.3% |
| $75,000 to $99,999 | 308 | 15.2% |
| $100,000 to $149,999 | 267 | 13.2% |
| $150,000 to $199,999 | 113 | 5.6% |
| $200,000+ | 170 | 8.4% |
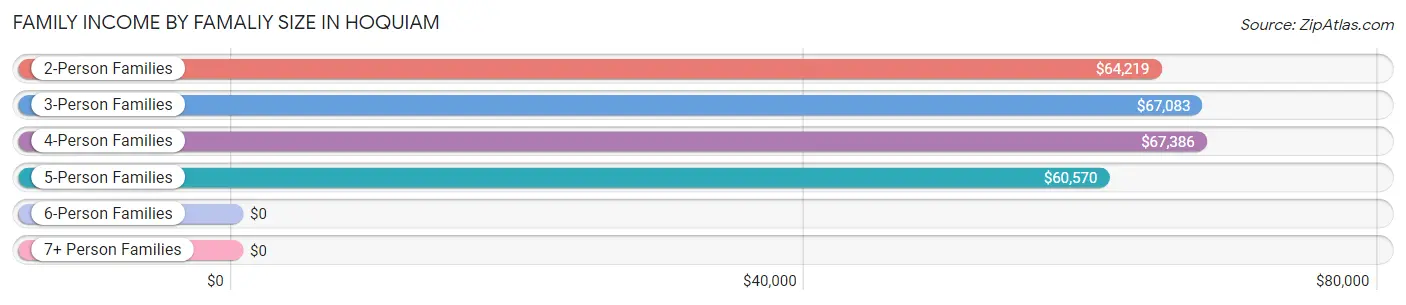
Family Income by Famaliy Size in Hoquiam
4-person families (377 | 18.6%) account for the highest median family income in Hoquiam with $67,386 per family, while 2-person families (1,103 | 54.4%) have the highest median income of $32,110 per family member.
| Income Bracket | # Families | Median Income |
| 2-Person Families | 1,103 (54.4%) | $64,219 |
| 3-Person Families | 252 (12.4%) | $67,083 |
| 4-Person Families | 377 (18.6%) | $67,386 |
| 5-Person Families | 174 (8.6%) | $60,570 |
| 6-Person Families | 102 (5.0%) | $0 |
| 7+ Person Families | 18 (0.9%) | $0 |
| Total | 2,026 (100.0%) | $63,013 |
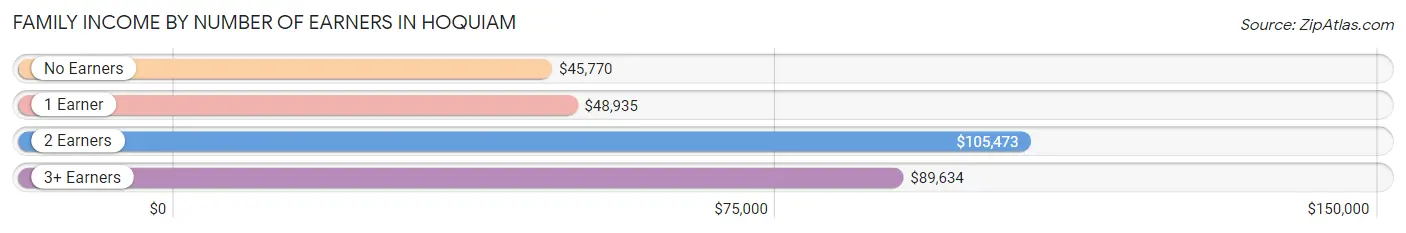
Family Income by Number of Earners in Hoquiam
The median family income in Hoquiam is $63,013, with families comprising 2 earners (654) having the highest median family income of $105,473, while families with no earners (461) have the lowest median family income of $45,770, accounting for 32.3% and 22.8% of families, respectively.
| Number of Earners | # Families | Median Income |
| No Earners | 461 (22.8%) | $45,770 |
| 1 Earner | 791 (39.0%) | $48,935 |
| 2 Earners | 654 (32.3%) | $105,473 |
| 3+ Earners | 120 (5.9%) | $89,634 |
| Total | 2,026 (100.0%) | $63,013 |
Household Income in Hoquiam
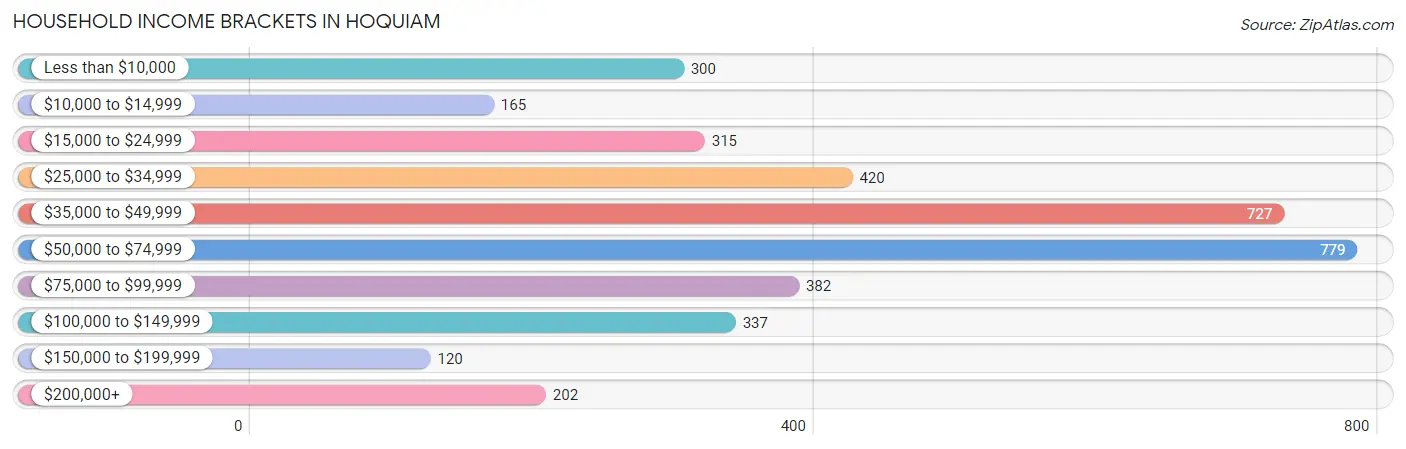
Household Income Brackets in Hoquiam
With 779 households falling in the category, the $50,000 to $74,999 income range is the most frequent in Hoquiam, accounting for 20.8% of all households. In contrast, only 120 households (3.2%) fall into the $150,000 to $199,999 income bracket, making it the least populous group.
| Income Bracket | # Households | % Households |
| Less than $10,000 | 300 | 8.0% |
| $10,000 to $14,999 | 165 | 4.4% |
| $15,000 to $24,999 | 315 | 8.4% |
| $25,000 to $34,999 | 420 | 11.2% |
| $35,000 to $49,999 | 727 | 19.4% |
| $50,000 to $74,999 | 779 | 20.8% |
| $75,000 to $99,999 | 382 | 10.2% |
| $100,000 to $149,999 | 337 | 9.0% |
| $150,000 to $199,999 | 120 | 3.2% |
| $200,000+ | 202 | 5.4% |
Household Income by Householder Age in Hoquiam
The median household income in Hoquiam is $47,614, with the highest median household income of $68,090 found in the 25 to 44 years age bracket for the primary householder. A total of 1,077 households (28.7%) fall into this category. Meanwhile, the 15 to 24 years age bracket for the primary householder has the lowest median household income of $26,394, with 175 households (4.7%) in this group.
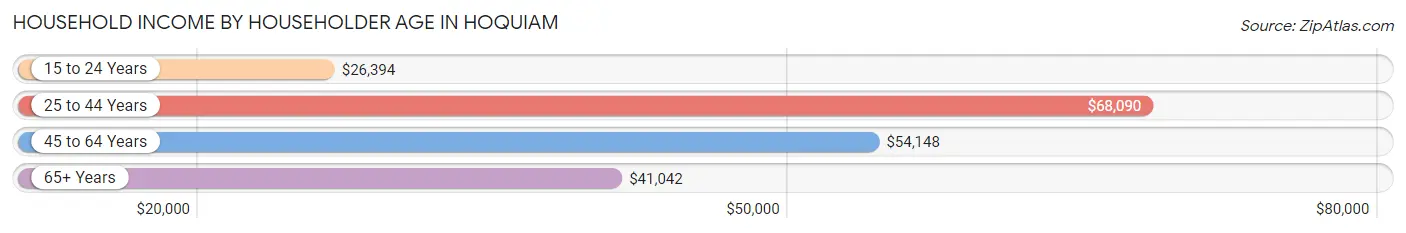
| Income Bracket | # Households | Median Income |
| 15 to 24 Years | 175 (4.7%) | $26,394 |
| 25 to 44 Years | 1,077 (28.7%) | $68,090 |
| 45 to 64 Years | 1,299 (34.7%) | $54,148 |
| 65+ Years | 1,196 (31.9%) | $41,042 |
| Total | 3,747 (100.0%) | $47,614 |
Poverty in Hoquiam
Income Below Poverty by Sex and Age in Hoquiam
With 11.3% poverty level for males and 21.8% for females among the residents of Hoquiam, 12 to 14 year old males and 35 to 44 year old females are the most vulnerable to poverty, with 111 males (64.5%) and 262 females (44.3%) in their respective age groups living below the poverty level.
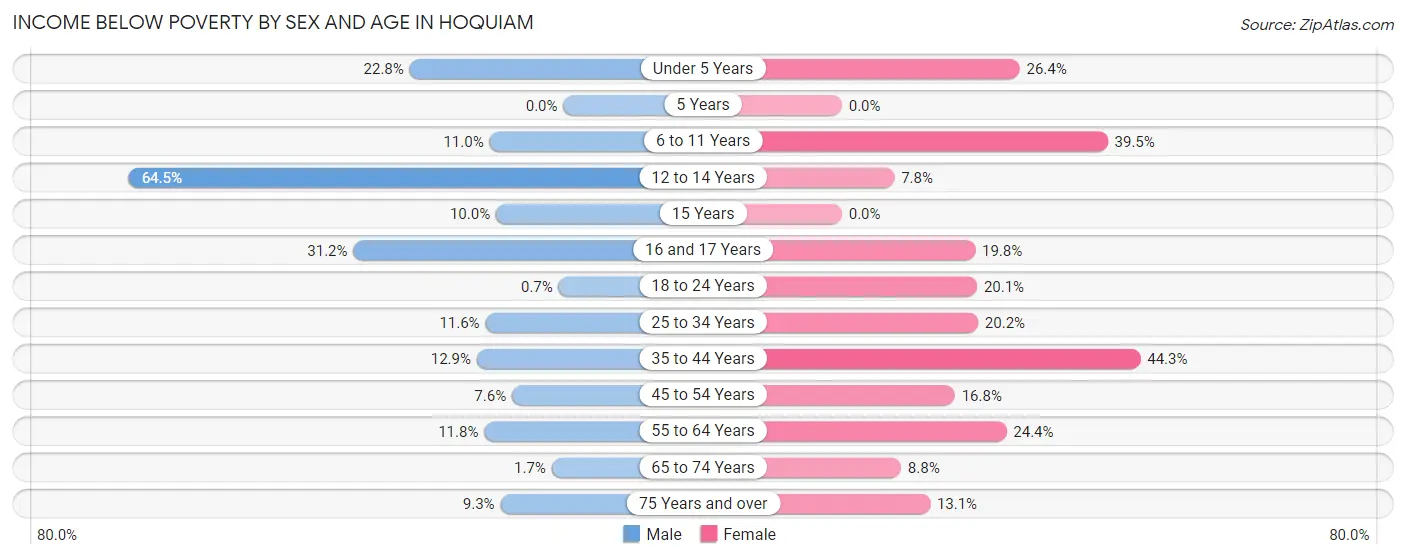
| Age Bracket | Male | Female |
| Under 5 Years | 21 (22.8%) | 47 (26.4%) |
| 5 Years | 0 (0.0%) | 0 (0.0%) |
| 6 to 11 Years | 43 (11.0%) | 105 (39.5%) |
| 12 to 14 Years | 111 (64.5%) | 19 (7.8%) |
| 15 Years | 9 (10.0%) | 0 (0.0%) |
| 16 and 17 Years | 29 (31.2%) | 19 (19.8%) |
| 18 to 24 Years | 3 (0.7%) | 59 (20.1%) |
| 25 to 34 Years | 87 (11.6%) | 96 (20.2%) |
| 35 to 44 Years | 65 (12.9%) | 262 (44.3%) |
| 45 to 54 Years | 40 (7.6%) | 80 (16.8%) |
| 55 to 64 Years | 51 (11.7%) | 143 (24.4%) |
| 65 to 74 Years | 11 (1.7%) | 60 (8.8%) |
| 75 Years and over | 24 (9.3%) | 36 (13.1%) |
| Total | 494 (11.3%) | 926 (21.8%) |
Income Above Poverty by Sex and Age in Hoquiam
According to the poverty statistics in Hoquiam, males aged 5 years and females aged 5 years are the age groups that are most secure financially, with 100.0% of males and 100.0% of females in these age groups living above the poverty line.
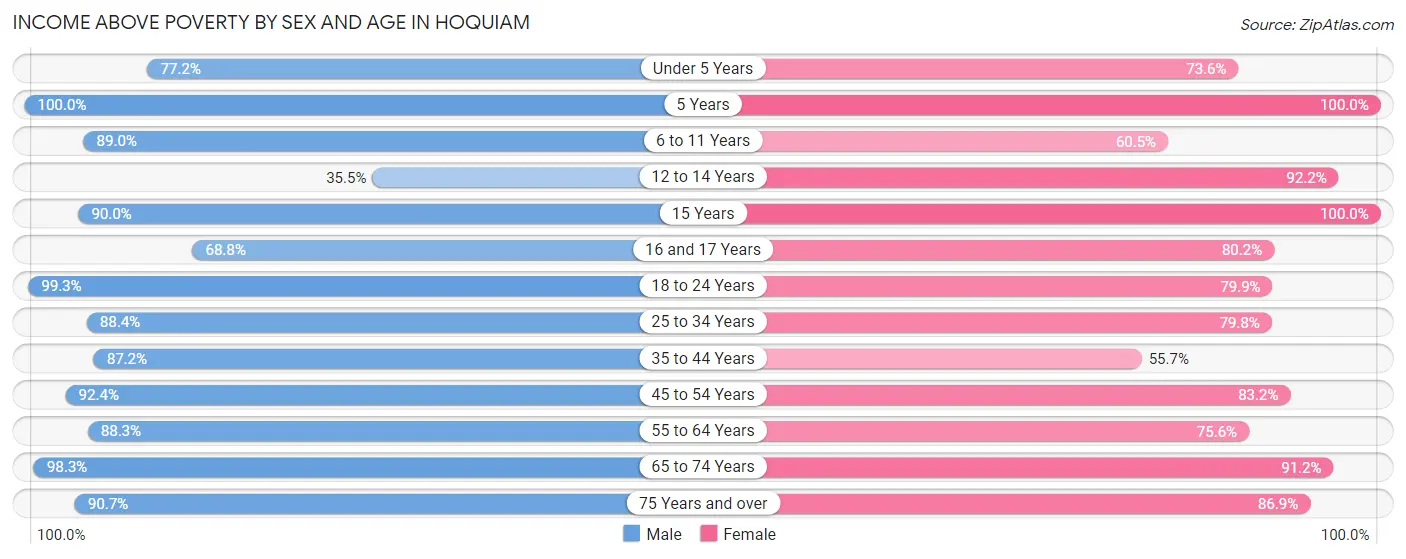
| Age Bracket | Male | Female |
| Under 5 Years | 71 (77.2%) | 131 (73.6%) |
| 5 Years | 15 (100.0%) | 20 (100.0%) |
| 6 to 11 Years | 349 (89.0%) | 161 (60.5%) |
| 12 to 14 Years | 61 (35.5%) | 225 (92.2%) |
| 15 Years | 81 (90.0%) | 63 (100.0%) |
| 16 and 17 Years | 64 (68.8%) | 77 (80.2%) |
| 18 to 24 Years | 423 (99.3%) | 235 (79.9%) |
| 25 to 34 Years | 665 (88.4%) | 379 (79.8%) |
| 35 to 44 Years | 441 (87.2%) | 329 (55.7%) |
| 45 to 54 Years | 484 (92.4%) | 397 (83.2%) |
| 55 to 64 Years | 383 (88.2%) | 442 (75.6%) |
| 65 to 74 Years | 625 (98.3%) | 623 (91.2%) |
| 75 Years and over | 233 (90.7%) | 239 (86.9%) |
| Total | 3,895 (88.7%) | 3,321 (78.2%) |
Income Below Poverty Among Married-Couple Families in Hoquiam
The poverty statistics for married-couple families in Hoquiam show that 4.9% or 66 of the total 1,350 families live below the poverty line. Families with 3 or 4 children have the highest poverty rate of 24.9%, comprising of 46 families. On the other hand, families with 1 or 2 children have the lowest poverty rate of 0.0%, which includes 0 families.
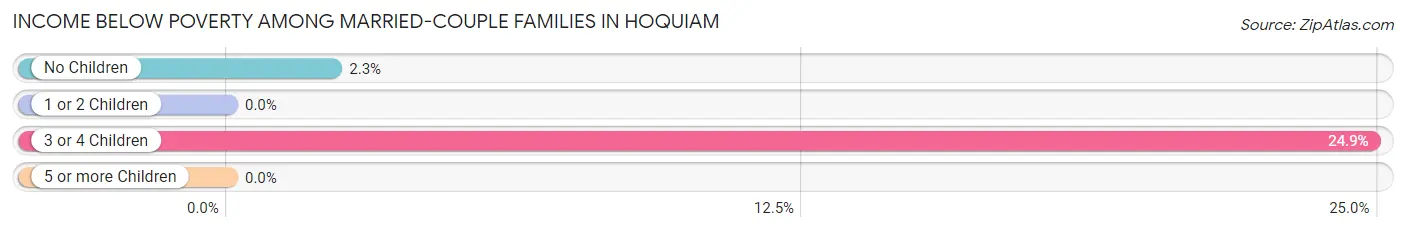
| Children | Above Poverty | Below Poverty |
| No Children | 861 (97.7%) | 20 (2.3%) |
| 1 or 2 Children | 284 (100.0%) | 0 (0.0%) |
| 3 or 4 Children | 139 (75.1%) | 46 (24.9%) |
| 5 or more Children | 0 (0.0%) | 0 (0.0%) |
| Total | 1,284 (95.1%) | 66 (4.9%) |
Income Below Poverty Among Single-Parent Households in Hoquiam
According to the poverty data in Hoquiam, 3.5% or 8 single-father households and 44.0% or 197 single-mother households are living below the poverty line. Among single-father households, those with 3 or 4 children have the highest poverty rate, with 8 households (100.0%) experiencing poverty. Likewise, among single-mother households, those with 3 or 4 children have the highest poverty rate, with 89 households (64.0%) falling below the poverty line.
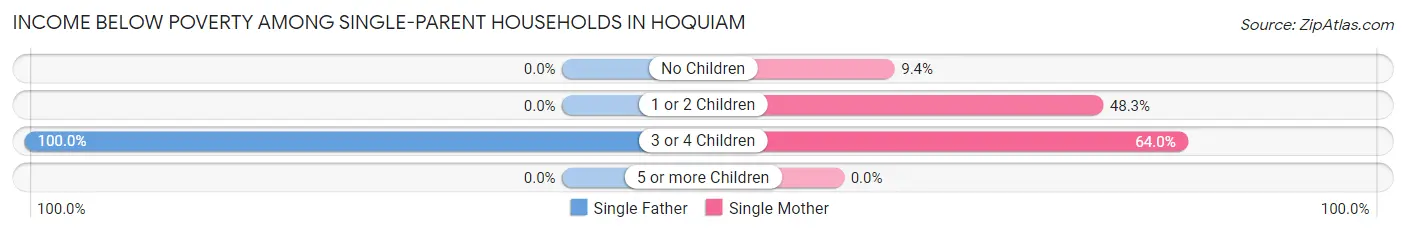
| Children | Single Father | Single Mother |
| No Children | 0 (0.0%) | 10 (9.4%) |
| 1 or 2 Children | 0 (0.0%) | 98 (48.3%) |
| 3 or 4 Children | 8 (100.0%) | 89 (64.0%) |
| 5 or more Children | 0 (0.0%) | 0 (0.0%) |
| Total | 8 (3.5%) | 197 (44.0%) |
Income Below Poverty Among Married-Couple vs Single-Parent Households in Hoquiam
The poverty data for Hoquiam shows that 66 of the married-couple family households (4.9%) and 205 of the single-parent households (30.3%) are living below the poverty level. Within the married-couple family households, those with 3 or 4 children have the highest poverty rate, with 46 households (24.9%) falling below the poverty line. Among the single-parent households, those with 3 or 4 children have the highest poverty rate, with 97 household (66.0%) living below poverty.
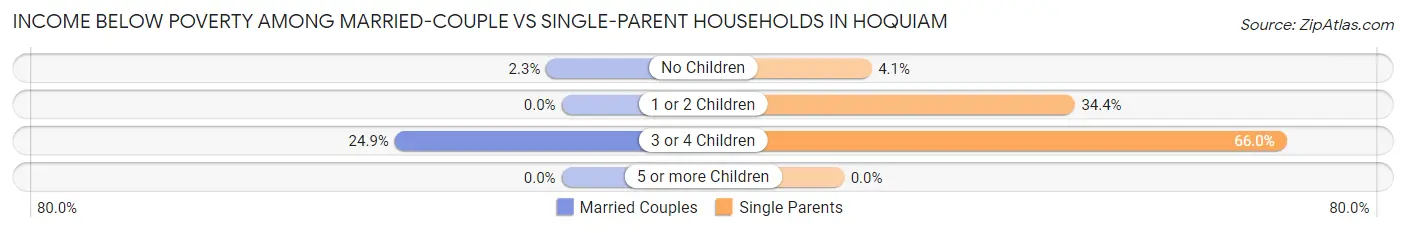
| Children | Married-Couple Families | Single-Parent Households |
| No Children | 20 (2.3%) | 10 (4.1%) |
| 1 or 2 Children | 0 (0.0%) | 98 (34.4%) |
| 3 or 4 Children | 46 (24.9%) | 97 (66.0%) |
| 5 or more Children | 0 (0.0%) | 0 (0.0%) |
| Total | 66 (4.9%) | 205 (30.3%) |
Race in Hoquiam
The most populous races in Hoquiam are White / Caucasian (7,432 | 85.0%), Two or more Races (582 | 6.7%), and Hispanic or Latino (523 | 6.0%).
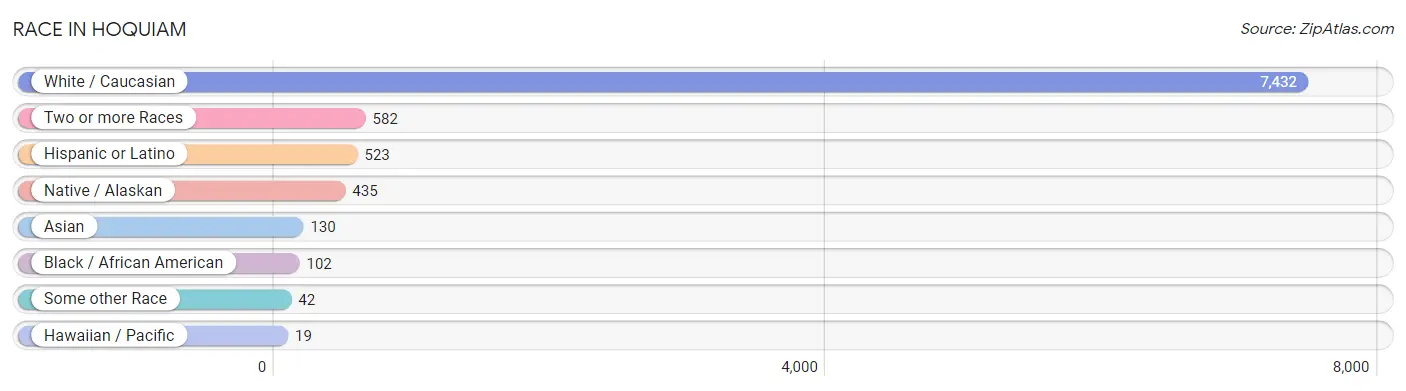
| Race | # Population | % Population |
| Asian | 130 | 1.5% |
| Black / African American | 102 | 1.2% |
| Hawaiian / Pacific | 19 | 0.2% |
| Hispanic or Latino | 523 | 6.0% |
| Native / Alaskan | 435 | 5.0% |
| White / Caucasian | 7,432 | 85.0% |
| Two or more Races | 582 | 6.7% |
| Some other Race | 42 | 0.5% |
| Total | 8,742 | 100.0% |
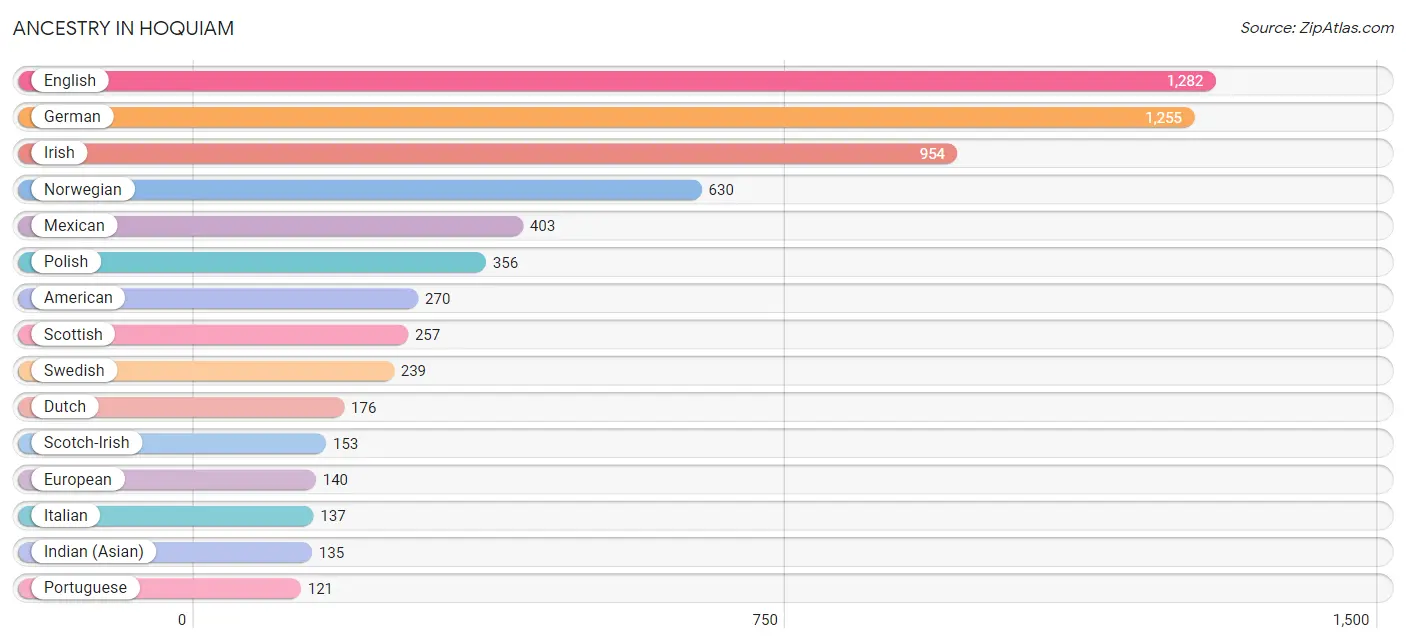
Ancestry in Hoquiam
The most populous ancestries reported in Hoquiam are English (1,282 | 14.7%), German (1,255 | 14.4%), Irish (954 | 10.9%), Norwegian (630 | 7.2%), and Mexican (403 | 4.6%), together accounting for 51.7% of all Hoquiam residents.
| Ancestry | # Population | % Population |
| Aleut | 13 | 0.2% |
| American | 270 | 3.1% |
| Arab | 20 | 0.2% |
| Austrian | 14 | 0.2% |
| Bhutanese | 29 | 0.3% |
| Blackfeet | 9 | 0.1% |
| British | 4 | 0.1% |
| Canadian | 44 | 0.5% |
| Central American | 28 | 0.3% |
| Central American Indian | 4 | 0.1% |
| Cherokee | 13 | 0.2% |
| Choctaw | 1 | 0.0% |
| Croatian | 29 | 0.3% |
| Cuban | 51 | 0.6% |
| Czech | 11 | 0.1% |
| Danish | 58 | 0.7% |
| Dutch | 176 | 2.0% |
| Eastern European | 7 | 0.1% |
| English | 1,282 | 14.7% |
| European | 140 | 1.6% |
| Finnish | 65 | 0.7% |
| French | 95 | 1.1% |
| French American Indian | 86 | 1.0% |
| French Canadian | 30 | 0.3% |
| German | 1,255 | 14.4% |
| Greek | 72 | 0.8% |
| Guamanian / Chamorro | 19 | 0.2% |
| Guatemalan | 28 | 0.3% |
| Hungarian | 8 | 0.1% |
| Icelander | 12 | 0.1% |
| Indian (Asian) | 135 | 1.5% |
| Irish | 954 | 10.9% |
| Italian | 137 | 1.6% |
| Korean | 60 | 0.7% |
| Latvian | 37 | 0.4% |
| Lebanese | 20 | 0.2% |
| Lithuanian | 38 | 0.4% |
| Mexican | 403 | 4.6% |
| Northern European | 8 | 0.1% |
| Norwegian | 630 | 7.2% |
| Pakistani | 11 | 0.1% |
| Polish | 356 | 4.1% |
| Portuguese | 121 | 1.4% |
| Potawatomi | 8 | 0.1% |
| Pueblo | 34 | 0.4% |
| Puerto Rican | 9 | 0.1% |
| Russian | 47 | 0.5% |
| Scandinavian | 104 | 1.2% |
| Scotch-Irish | 153 | 1.8% |
| Scottish | 257 | 2.9% |
| Shoshone | 1 | 0.0% |
| Spaniard | 11 | 0.1% |
| Sri Lankan | 6 | 0.1% |
| Swedish | 239 | 2.7% |
| Swiss | 36 | 0.4% |
| Thai | 51 | 0.6% |
| Welsh | 111 | 1.3% |
| West Indian | 4 | 0.1% |
| Yugoslavian | 8 | 0.1% | View All 59 Rows |
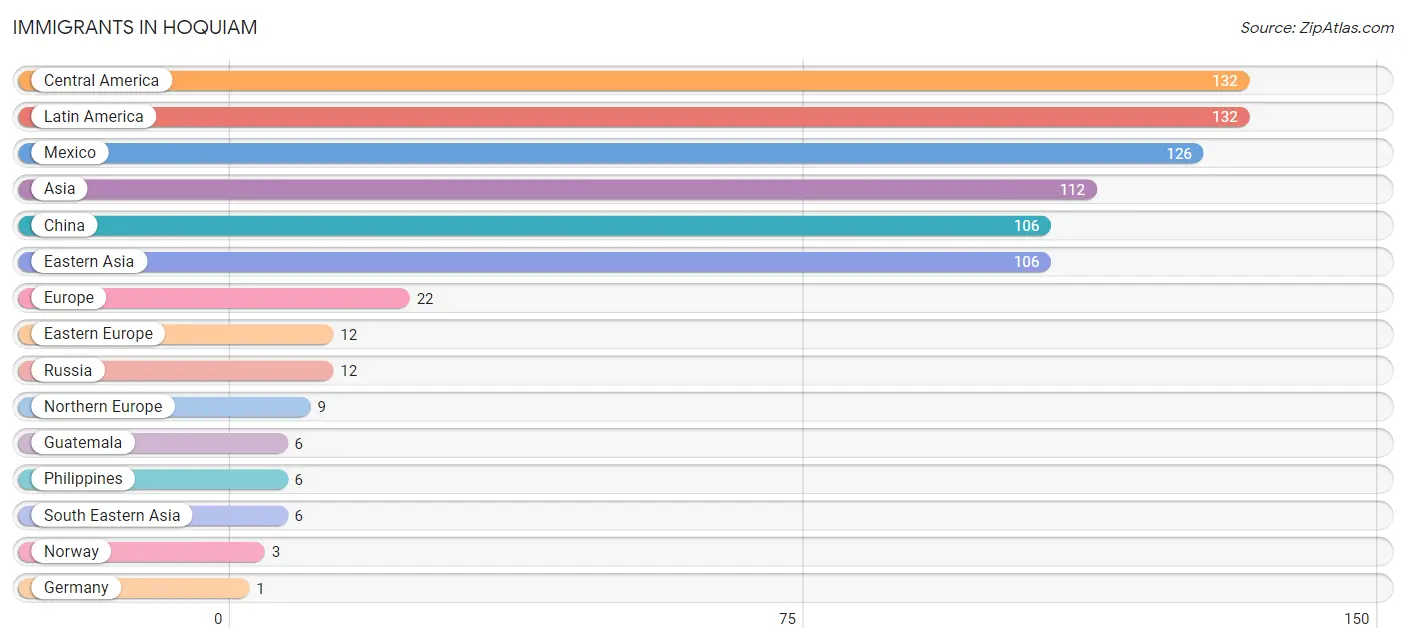
Immigrants in Hoquiam
The most numerous immigrant groups reported in Hoquiam came from Central America (132 | 1.5%), Latin America (132 | 1.5%), Mexico (126 | 1.4%), Asia (112 | 1.3%), and China (106 | 1.2%), together accounting for 7.0% of all Hoquiam residents.
| Immigration Origin | # Population | % Population |
| Asia | 112 | 1.3% |
| Central America | 132 | 1.5% |
| China | 106 | 1.2% |
| Eastern Asia | 106 | 1.2% |
| Eastern Europe | 12 | 0.1% |
| Europe | 22 | 0.3% |
| Germany | 1 | 0.0% |
| Guatemala | 6 | 0.1% |
| Latin America | 132 | 1.5% |
| Mexico | 126 | 1.4% |
| Northern Europe | 9 | 0.1% |
| Norway | 3 | 0.0% |
| Philippines | 6 | 0.1% |
| Russia | 12 | 0.1% |
| South Eastern Asia | 6 | 0.1% |
| Western Europe | 1 | 0.0% | View All 16 Rows |
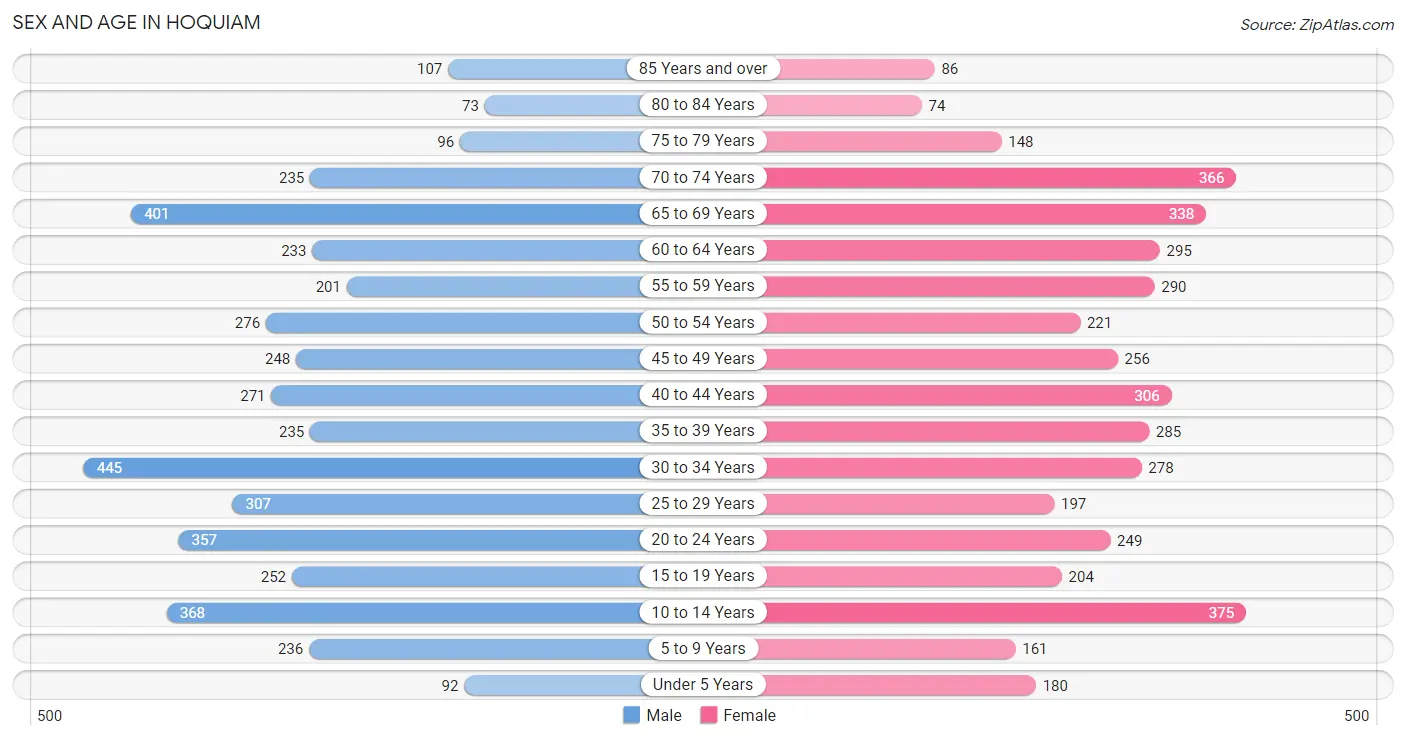
Sex and Age in Hoquiam
Sex and Age in Hoquiam
The most populous age groups in Hoquiam are 30 to 34 Years (445 | 10.0%) for men and 10 to 14 Years (375 | 8.7%) for women.
| Age Bracket | Male | Female |
| Under 5 Years | 92 (2.1%) | 180 (4.2%) |
| 5 to 9 Years | 236 (5.3%) | 161 (3.7%) |
| 10 to 14 Years | 368 (8.3%) | 375 (8.7%) |
| 15 to 19 Years | 252 (5.7%) | 204 (4.7%) |
| 20 to 24 Years | 357 (8.1%) | 249 (5.8%) |
| 25 to 29 Years | 307 (6.9%) | 197 (4.6%) |
| 30 to 34 Years | 445 (10.0%) | 278 (6.5%) |
| 35 to 39 Years | 235 (5.3%) | 285 (6.6%) |
| 40 to 44 Years | 271 (6.1%) | 306 (7.1%) |
| 45 to 49 Years | 248 (5.6%) | 256 (5.9%) |
| 50 to 54 Years | 276 (6.2%) | 221 (5.1%) |
| 55 to 59 Years | 201 (4.5%) | 290 (6.7%) |
| 60 to 64 Years | 233 (5.3%) | 295 (6.9%) |
| 65 to 69 Years | 401 (9.0%) | 338 (7.8%) |
| 70 to 74 Years | 235 (5.3%) | 366 (8.5%) |
| 75 to 79 Years | 96 (2.2%) | 148 (3.4%) |
| 80 to 84 Years | 73 (1.7%) | 74 (1.7%) |
| 85 Years and over | 107 (2.4%) | 86 (2.0%) |
| Total | 4,433 (100.0%) | 4,309 (100.0%) |
Families and Households in Hoquiam
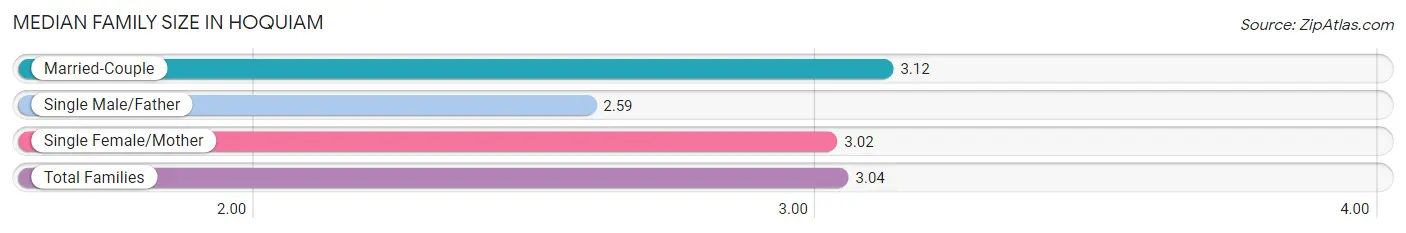
Median Family Size in Hoquiam
The median family size in Hoquiam is 3.04 persons per family, with married-couple families (1,350 | 66.6%) accounting for the largest median family size of 3.12 persons per family. On the other hand, single male/father families (228 | 11.3%) represent the smallest median family size with 2.59 persons per family.
| Family Type | # Families | Family Size |
| Married-Couple | 1,350 (66.6%) | 3.12 |
| Single Male/Father | 228 (11.3%) | 2.59 |
| Single Female/Mother | 448 (22.1%) | 3.02 |
| Total Families | 2,026 (100.0%) | 3.04 |
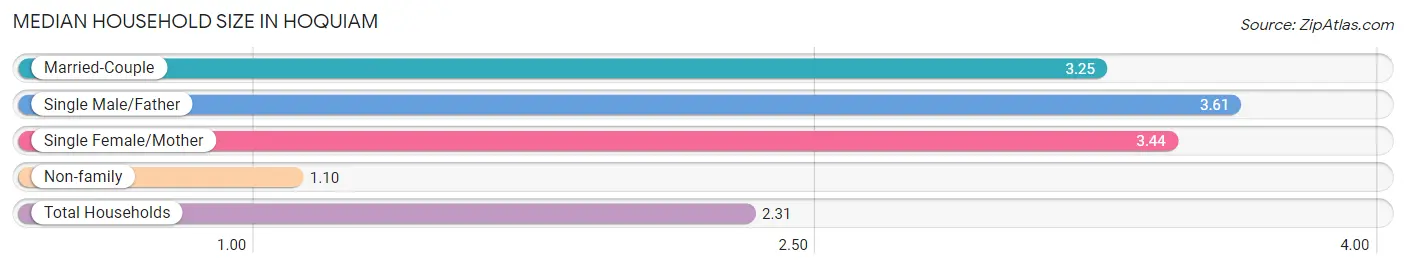
Median Household Size in Hoquiam
The median household size in Hoquiam is 2.31 persons per household, with single male/father households (228 | 6.1%) accounting for the largest median household size of 3.61 persons per household. non-family households (1,721 | 45.9%) represent the smallest median household size with 1.10 persons per household.
| Household Type | # Households | Household Size |
| Married-Couple | 1,350 (36.0%) | 3.25 |
| Single Male/Father | 228 (6.1%) | 3.61 |
| Single Female/Mother | 448 (12.0%) | 3.44 |
| Non-family | 1,721 (45.9%) | 1.10 |
| Total Households | 3,747 (100.0%) | 2.31 |
Household Size by Marriage Status in Hoquiam
Out of a total of 3,747 households in Hoquiam, 2,026 (54.1%) are family households, while 1,721 (45.9%) are nonfamily households. The most numerous type of family households are 2-person households, comprising 968, and the most common type of nonfamily households are 1-person households, comprising 1,574.
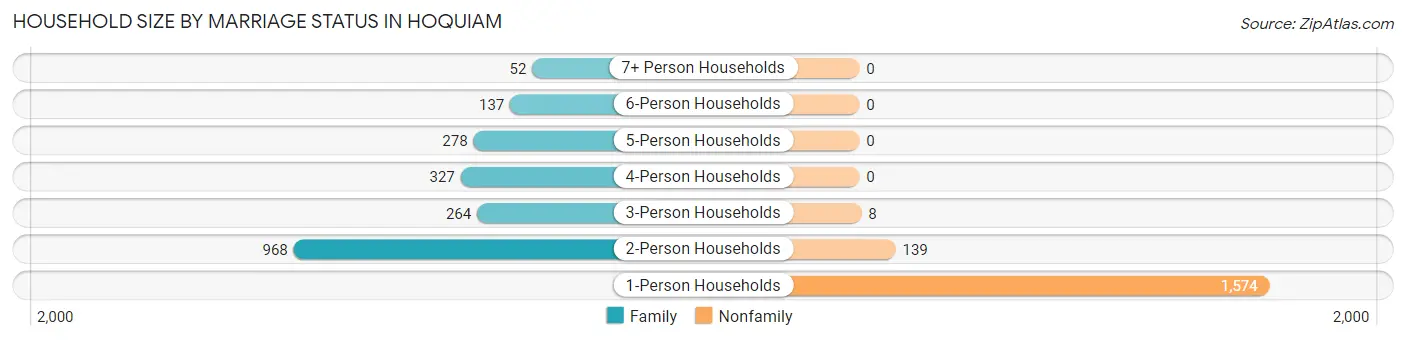
| Household Size | Family Households | Nonfamily Households |
| 1-Person Households | - | 1,574 (42.0%) |
| 2-Person Households | 968 (25.8%) | 139 (3.7%) |
| 3-Person Households | 264 (7.0%) | 8 (0.2%) |
| 4-Person Households | 327 (8.7%) | 0 (0.0%) |
| 5-Person Households | 278 (7.4%) | 0 (0.0%) |
| 6-Person Households | 137 (3.7%) | 0 (0.0%) |
| 7+ Person Households | 52 (1.4%) | 0 (0.0%) |
| Total | 2,026 (54.1%) | 1,721 (45.9%) |
Female Fertility in Hoquiam
Fertility by Age in Hoquiam
Average fertility rate in Hoquiam is 51.0 births per 1,000 women. Women in the age bracket of 20 to 34 years have the highest fertility rate with 93.0 births per 1,000 women. Women in the age bracket of 20 to 34 years acount for 72.0% of all women with births.
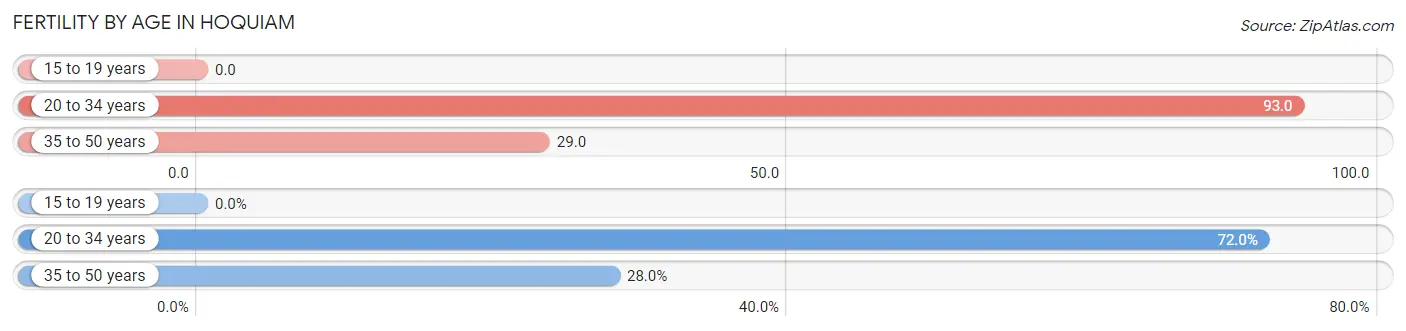
| Age Bracket | Women with Births | Births / 1,000 Women |
| 15 to 19 years | 0 (0.0%) | 0.0 |
| 20 to 34 years | 67 (72.0%) | 93.0 |
| 35 to 50 years | 26 (28.0%) | 29.0 |
| Total | 93 (100.0%) | 51.0 |
Fertility by Age by Marriage Status in Hoquiam
52.7% of women with births (93) in Hoquiam are married. The highest percentage of unmarried women with births falls into 35 to 50 years age bracket with 73.1% of them unmarried at the time of birth, while the lowest percentage of unmarried women with births belong to 20 to 34 years age bracket with 37.3% of them unmarried.
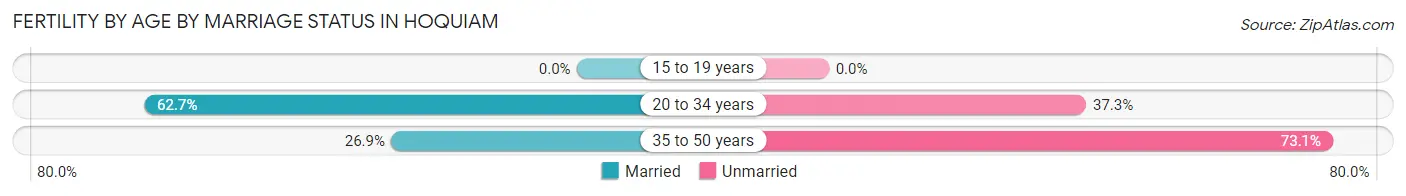
| Age Bracket | Married | Unmarried |
| 15 to 19 years | 0 (0.0%) | 0 (0.0%) |
| 20 to 34 years | 42 (62.7%) | 25 (37.3%) |
| 35 to 50 years | 7 (26.9%) | 19 (73.1%) |
| Total | 49 (52.7%) | 44 (47.3%) |
Fertility by Education in Hoquiam
Average fertility rate in Hoquiam is 51.0 births per 1,000 women. Women with the education attainment of graduate degree have the highest fertility rate of 98.0 births per 1,000 women, while women with the education attainment of bachelor's degree have the lowest fertility at 35.0 births per 1,000 women. Women with the education attainment of high school diploma represent 37.6% of all women with births.
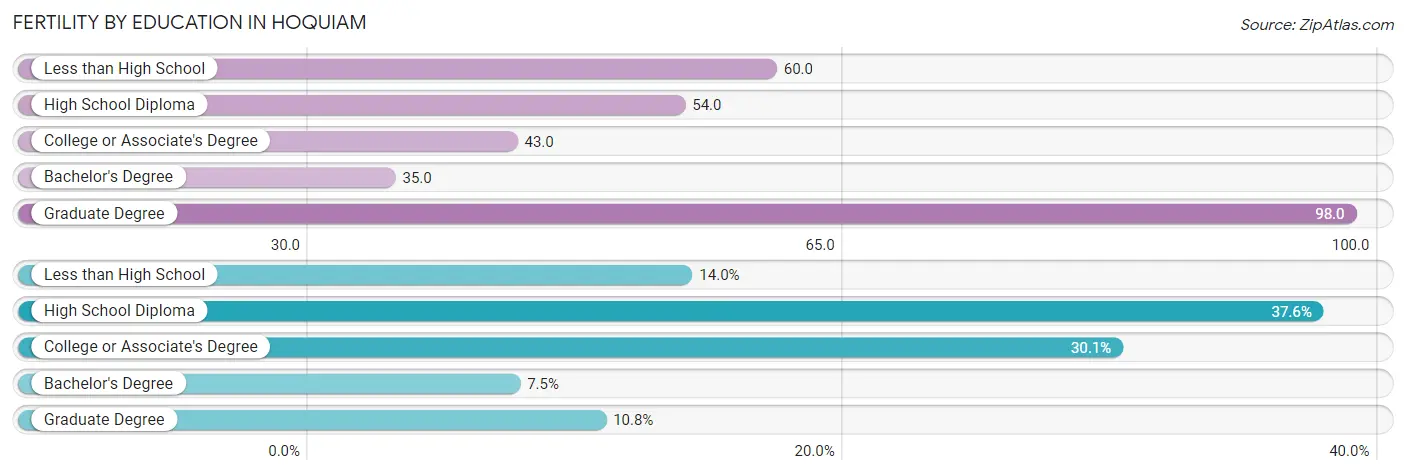
| Educational Attainment | Women with Births | Births / 1,000 Women |
| Less than High School | 13 (14.0%) | 60.0 |
| High School Diploma | 35 (37.6%) | 54.0 |
| College or Associate's Degree | 28 (30.1%) | 43.0 |
| Bachelor's Degree | 7 (7.5%) | 35.0 |
| Graduate Degree | 10 (10.7%) | 98.0 |
| Total | 93 (100.0%) | 51.0 |
Fertility by Education by Marriage Status in Hoquiam
47.3% of women with births in Hoquiam are unmarried. Women with the educational attainment of bachelor's degree are most likely to be married with 100.0% of them married at childbirth, while women with the educational attainment of less than high school are least likely to be married with 100.0% of them unmarried at childbirth.
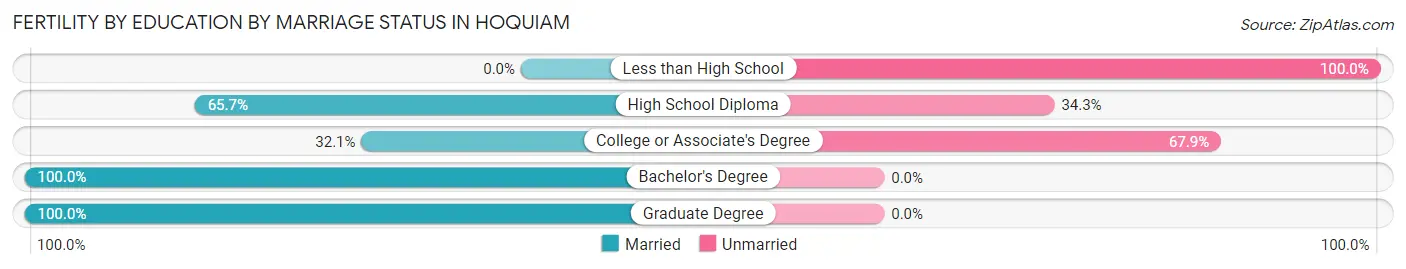
| Educational Attainment | Married | Unmarried |
| Less than High School | 0 (0.0%) | 13 (100.0%) |
| High School Diploma | 23 (65.7%) | 12 (34.3%) |
| College or Associate's Degree | 9 (32.1%) | 19 (67.9%) |
| Bachelor's Degree | 7 (100.0%) | 0 (0.0%) |
| Graduate Degree | 10 (100.0%) | 0 (0.0%) |
| Total | 49 (52.7%) | 44 (47.3%) |
Employment Characteristics in Hoquiam
Employment by Class of Employer in Hoquiam
Among the 3,431 employed individuals in Hoquiam, private company employees (1,963 | 57.2%), local government employees (418 | 12.2%), and state government employees (405 | 11.8%) make up the most common classes of employment.
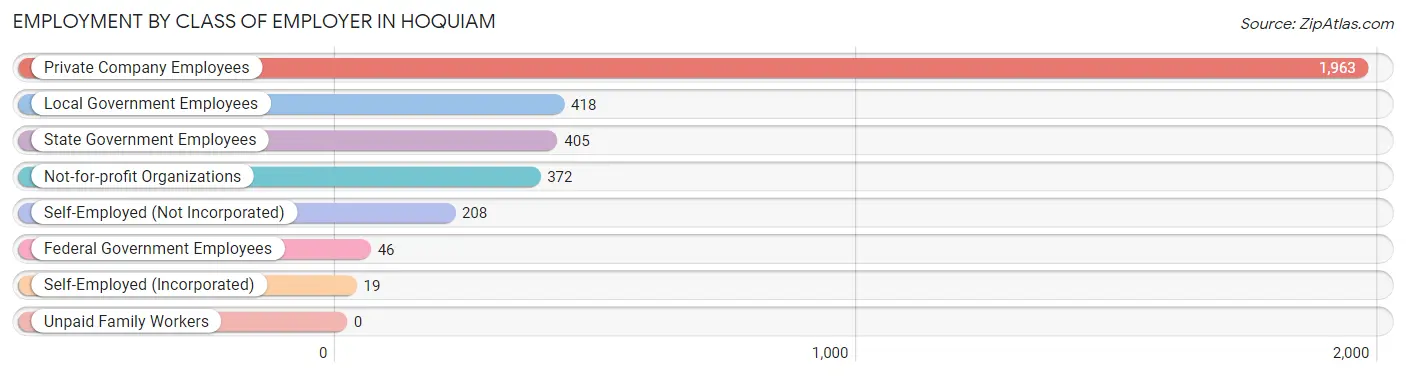
| Employer Class | # Employees | % Employees |
| Private Company Employees | 1,963 | 57.2% |
| Self-Employed (Incorporated) | 19 | 0.5% |
| Self-Employed (Not Incorporated) | 208 | 6.1% |
| Not-for-profit Organizations | 372 | 10.8% |
| Local Government Employees | 418 | 12.2% |
| State Government Employees | 405 | 11.8% |
| Federal Government Employees | 46 | 1.3% |
| Unpaid Family Workers | 0 | 0.0% |
| Total | 3,431 | 100.0% |
Employment Status by Age in Hoquiam
According to the labor force statistics for Hoquiam, out of the total population over 16 years of age (7,177), 53.7% or 3,854 individuals are in the labor force, with 10.0% or 385 of them unemployed. The age group with the highest labor force participation rate is 25 to 29 years, with 86.5% or 436 individuals in the labor force. Within the labor force, the 30 to 34 years age range has the highest percentage of unemployed individuals, with 27.5% or 170 of them being unemployed.
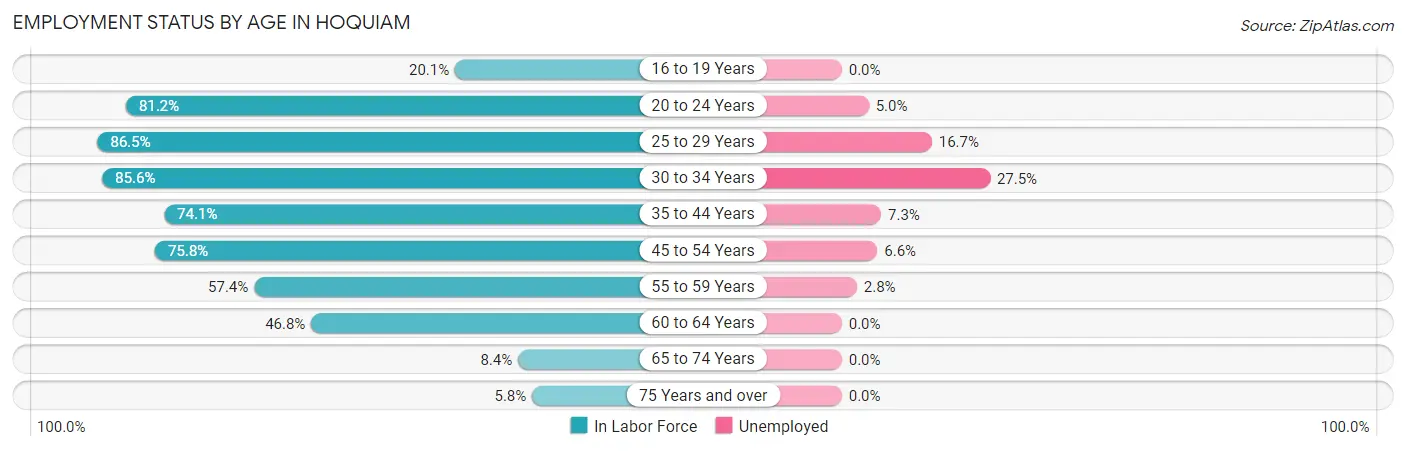
| Age Bracket | In Labor Force | Unemployed |
| 16 to 19 Years | 61 (20.1%) | 0 (0.0%) |
| 20 to 24 Years | 492 (81.2%) | 25 (5.0%) |
| 25 to 29 Years | 436 (86.5%) | 73 (16.7%) |
| 30 to 34 Years | 619 (85.6%) | 170 (27.5%) |
| 35 to 44 Years | 813 (74.1%) | 59 (7.3%) |
| 45 to 54 Years | 759 (75.8%) | 50 (6.6%) |
| 55 to 59 Years | 282 (57.4%) | 8 (2.8%) |
| 60 to 64 Years | 247 (46.8%) | 0 (0.0%) |
| 65 to 74 Years | 113 (8.4%) | 0 (0.0%) |
| 75 Years and over | 34 (5.8%) | 0 (0.0%) |
| Total | 3,854 (53.7%) | 385 (10.0%) |
Employment Status by Educational Attainment in Hoquiam
According to labor force statistics for Hoquiam, 72.7% of individuals (3,158) out of the total population between 25 and 64 years of age (4,344) are in the labor force, with 11.4% or 360 of them being unemployed. The group with the highest labor force participation rate are those with the educational attainment of bachelor's degree or higher, with 89.3% or 768 individuals in the labor force. Within the labor force, individuals with less than high school education have the highest percentage of unemployment, with 51.1% or 68 of them being unemployed.
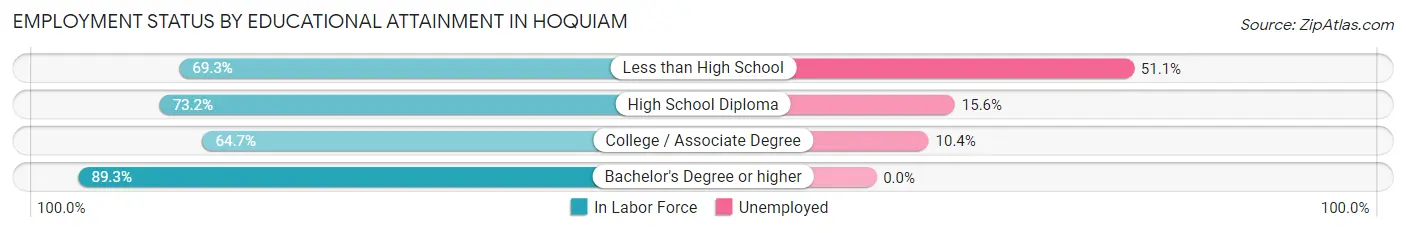
| Educational Attainment | In Labor Force | Unemployed |
| Less than High School | 133 (69.3%) | 98 (51.1%) |
| High School Diploma | 1,088 (73.2%) | 232 (15.6%) |
| College / Associate Degree | 1,168 (64.7%) | 188 (10.4%) |
| Bachelor's Degree or higher | 768 (89.3%) | 0 (0.0%) |
| Total | 3,158 (72.7%) | 495 (11.4%) |
Employment Occupations by Sex in Hoquiam
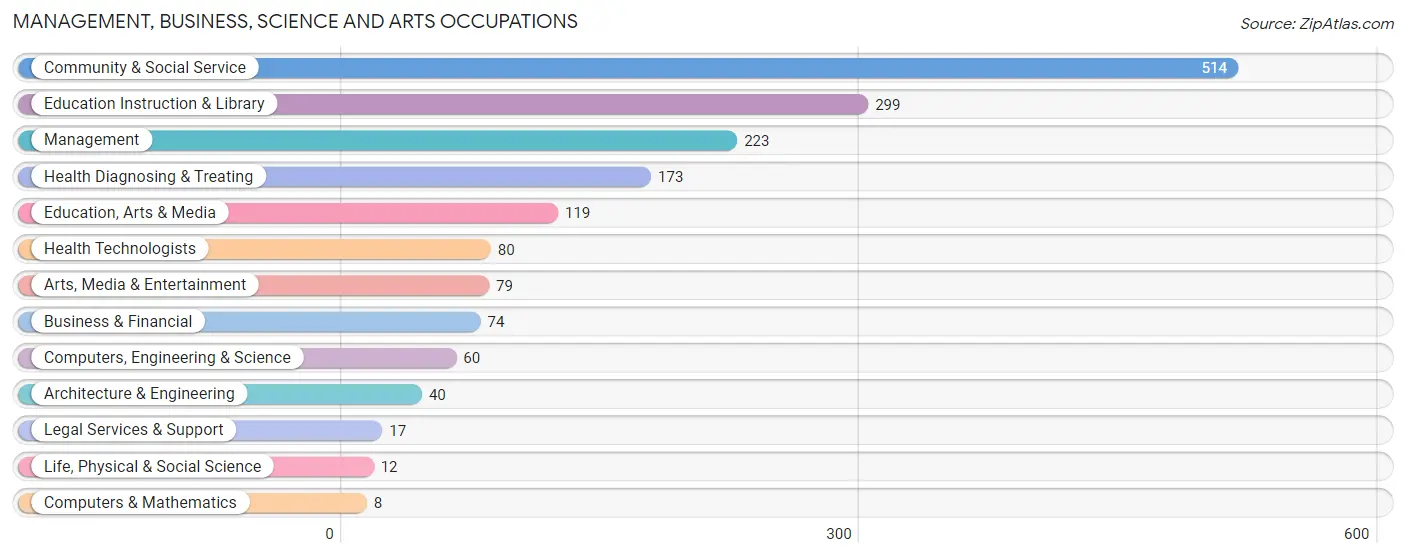
Management, Business, Science and Arts Occupations
The most common Management, Business, Science and Arts occupations in Hoquiam are Community & Social Service (514 | 14.9%), Education Instruction & Library (299 | 8.6%), Management (223 | 6.5%), Health Diagnosing & Treating (173 | 5.0%), and Education, Arts & Media (119 | 3.4%).
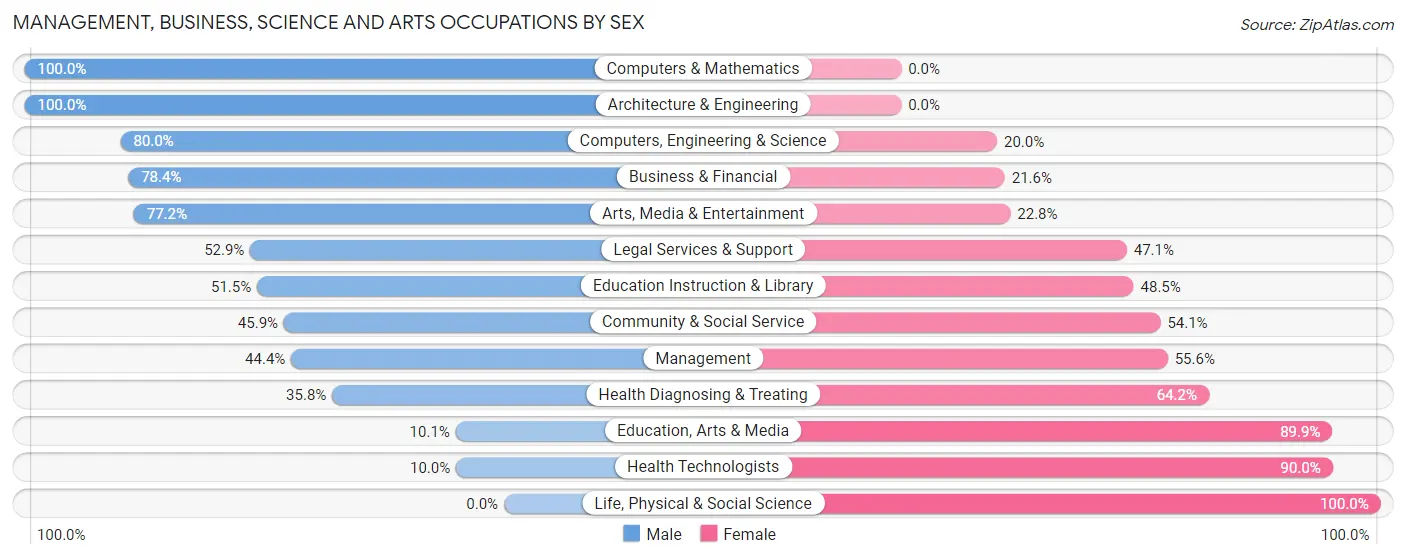
Management, Business, Science and Arts Occupations by Sex
Within the Management, Business, Science and Arts occupations in Hoquiam, the most male-oriented occupations are Computers & Mathematics (100.0%), Architecture & Engineering (100.0%), and Computers, Engineering & Science (80.0%), while the most female-oriented occupations are Life, Physical & Social Science (100.0%), Health Technologists (90.0%), and Education, Arts & Media (89.9%).
| Occupation | Male | Female |
| Management | 99 (44.4%) | 124 (55.6%) |
| Business & Financial | 58 (78.4%) | 16 (21.6%) |
| Computers, Engineering & Science | 48 (80.0%) | 12 (20.0%) |
| Computers & Mathematics | 8 (100.0%) | 0 (0.0%) |
| Architecture & Engineering | 40 (100.0%) | 0 (0.0%) |
| Life, Physical & Social Science | 0 (0.0%) | 12 (100.0%) |
| Community & Social Service | 236 (45.9%) | 278 (54.1%) |
| Education, Arts & Media | 12 (10.1%) | 107 (89.9%) |
| Legal Services & Support | 9 (52.9%) | 8 (47.1%) |
| Education Instruction & Library | 154 (51.5%) | 145 (48.5%) |
| Arts, Media & Entertainment | 61 (77.2%) | 18 (22.8%) |
| Health Diagnosing & Treating | 62 (35.8%) | 111 (64.2%) |
| Health Technologists | 8 (10.0%) | 72 (90.0%) |
| Total (Category) | 503 (48.2%) | 541 (51.8%) |
| Total (Overall) | 1,933 (55.9%) | 1,522 (44.1%) |
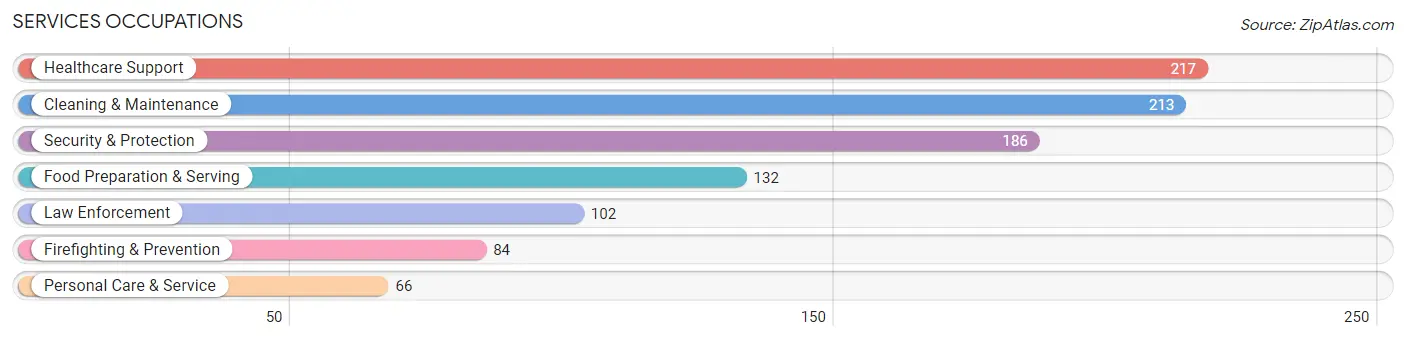
Services Occupations
The most common Services occupations in Hoquiam are Healthcare Support (217 | 6.3%), Cleaning & Maintenance (213 | 6.2%), Security & Protection (186 | 5.4%), Food Preparation & Serving (132 | 3.8%), and Law Enforcement (102 | 2.9%).
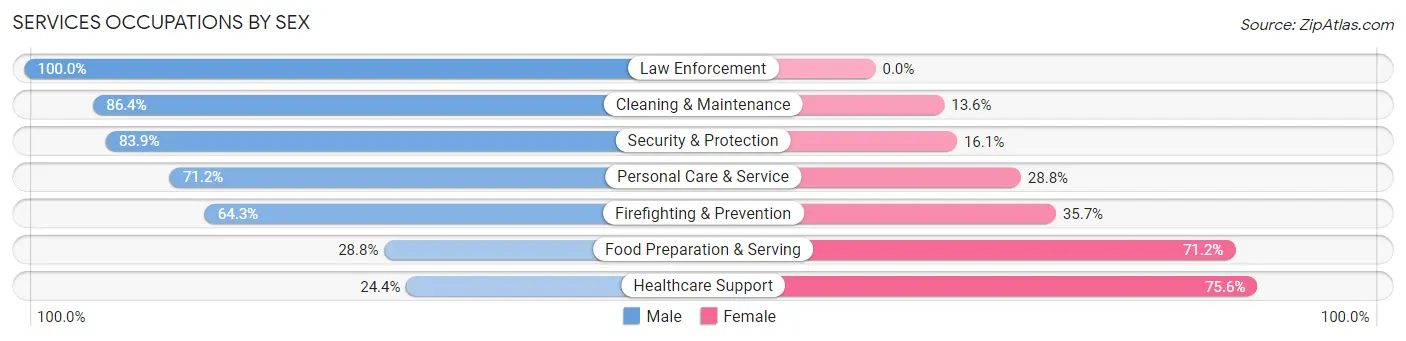
Services Occupations by Sex
Within the Services occupations in Hoquiam, the most male-oriented occupations are Law Enforcement (100.0%), Cleaning & Maintenance (86.4%), and Security & Protection (83.9%), while the most female-oriented occupations are Healthcare Support (75.6%), Food Preparation & Serving (71.2%), and Firefighting & Prevention (35.7%).
| Occupation | Male | Female |
| Healthcare Support | 53 (24.4%) | 164 (75.6%) |
| Security & Protection | 156 (83.9%) | 30 (16.1%) |
| Firefighting & Prevention | 54 (64.3%) | 30 (35.7%) |
| Law Enforcement | 102 (100.0%) | 0 (0.0%) |
| Food Preparation & Serving | 38 (28.8%) | 94 (71.2%) |
| Cleaning & Maintenance | 184 (86.4%) | 29 (13.6%) |
| Personal Care & Service | 47 (71.2%) | 19 (28.8%) |
| Total (Category) | 478 (58.7%) | 336 (41.3%) |
| Total (Overall) | 1,933 (55.9%) | 1,522 (44.1%) |
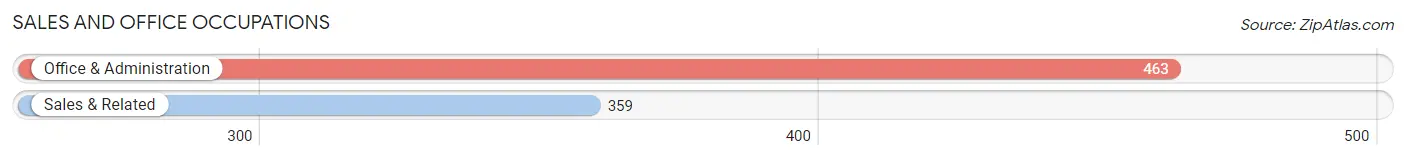
Sales and Office Occupations
The most common Sales and Office occupations in Hoquiam are Office & Administration (463 | 13.4%), and Sales & Related (359 | 10.4%).
Sales and Office Occupations by Sex
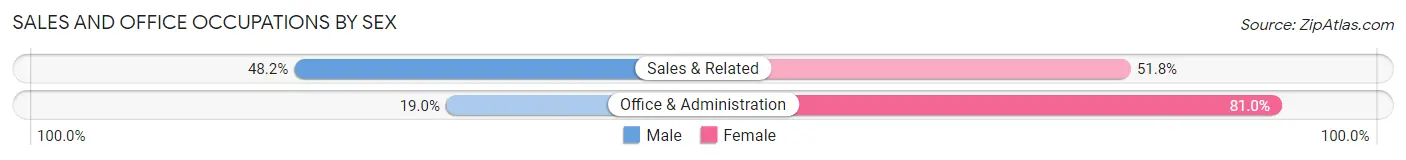
| Occupation | Male | Female |
| Sales & Related | 173 (48.2%) | 186 (51.8%) |
| Office & Administration | 88 (19.0%) | 375 (81.0%) |
| Total (Category) | 261 (31.8%) | 561 (68.2%) |
| Total (Overall) | 1,933 (55.9%) | 1,522 (44.1%) |
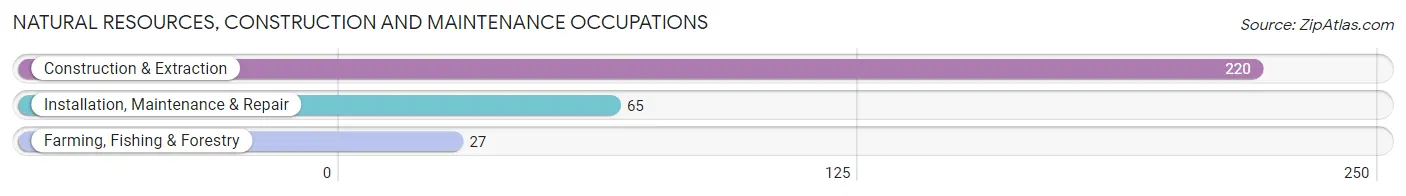
Natural Resources, Construction and Maintenance Occupations
The most common Natural Resources, Construction and Maintenance occupations in Hoquiam are Construction & Extraction (220 | 6.4%), Installation, Maintenance & Repair (65 | 1.9%), and Farming, Fishing & Forestry (27 | 0.8%).
Natural Resources, Construction and Maintenance Occupations by Sex
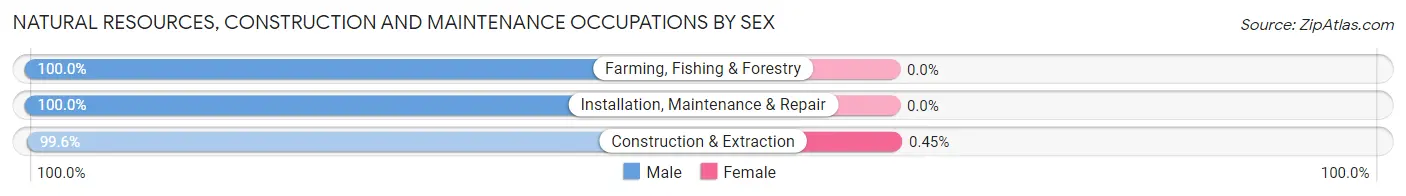
| Occupation | Male | Female |
| Farming, Fishing & Forestry | 27 (100.0%) | 0 (0.0%) |
| Construction & Extraction | 219 (99.6%) | 1 (0.4%) |
| Installation, Maintenance & Repair | 65 (100.0%) | 0 (0.0%) |
| Total (Category) | 311 (99.7%) | 1 (0.3%) |
| Total (Overall) | 1,933 (55.9%) | 1,522 (44.1%) |
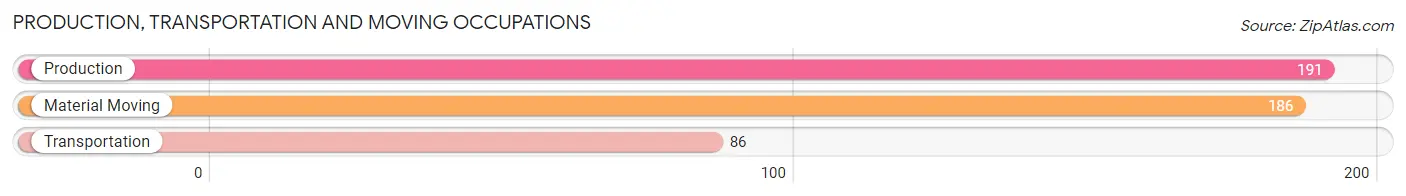
Production, Transportation and Moving Occupations
The most common Production, Transportation and Moving occupations in Hoquiam are Production (191 | 5.5%), Material Moving (186 | 5.4%), and Transportation (86 | 2.5%).
Production, Transportation and Moving Occupations by Sex
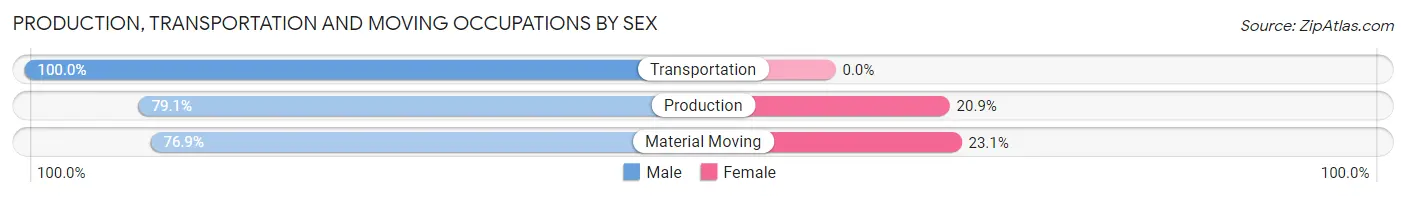
| Occupation | Male | Female |
| Production | 151 (79.1%) | 40 (20.9%) |
| Transportation | 86 (100.0%) | 0 (0.0%) |
| Material Moving | 143 (76.9%) | 43 (23.1%) |
| Total (Category) | 380 (82.1%) | 83 (17.9%) |
| Total (Overall) | 1,933 (55.9%) | 1,522 (44.1%) |
Employment Industries by Sex in Hoquiam
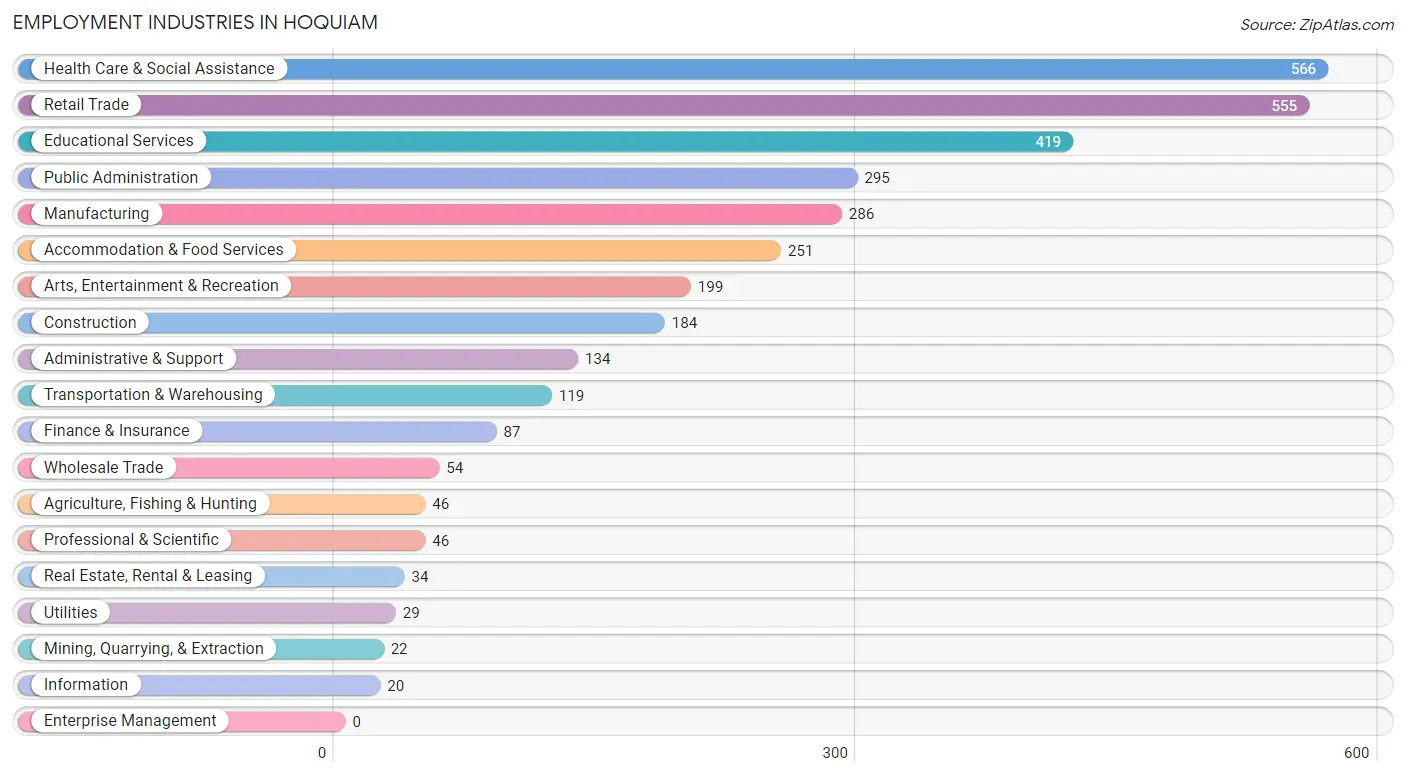
Employment Industries in Hoquiam
The major employment industries in Hoquiam include Health Care & Social Assistance (566 | 16.4%), Retail Trade (555 | 16.1%), Educational Services (419 | 12.1%), Public Administration (295 | 8.5%), and Manufacturing (286 | 8.3%).
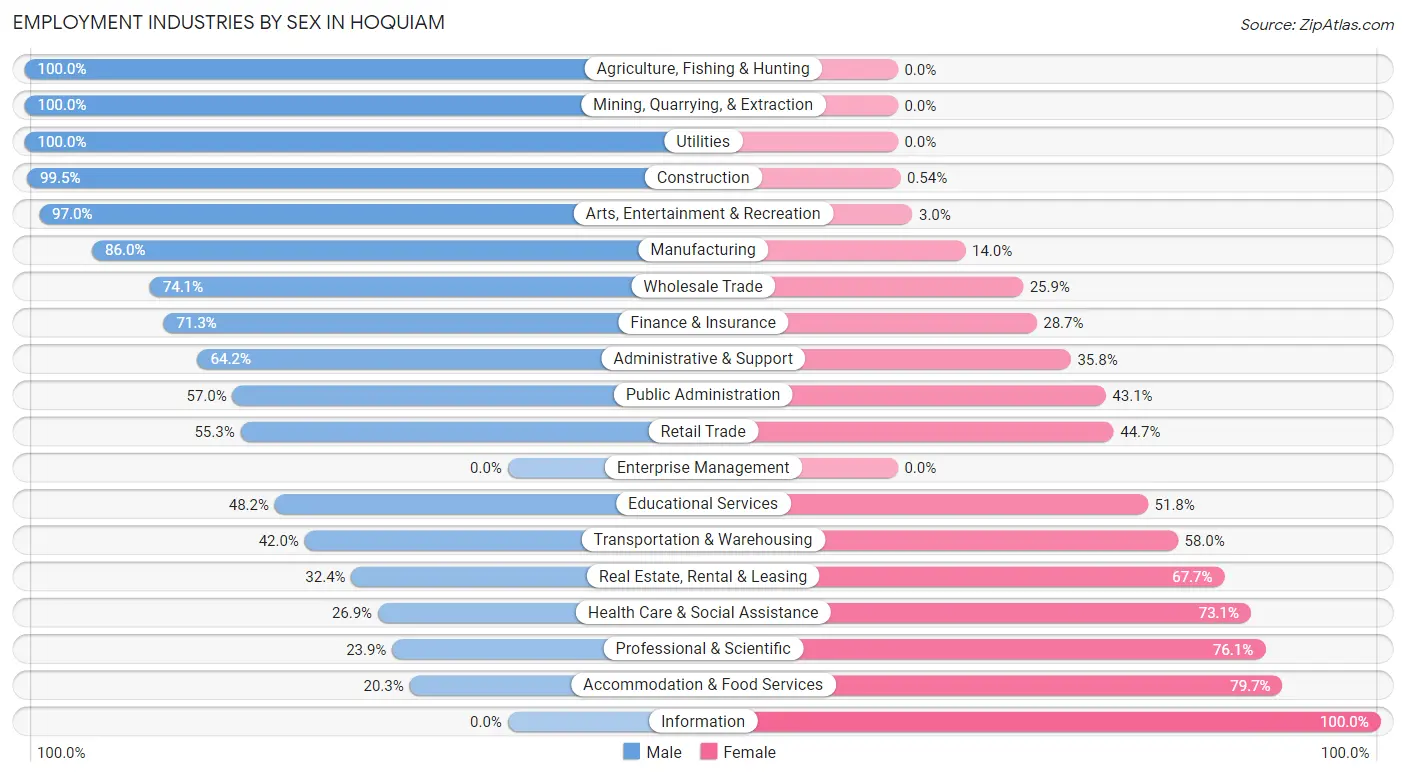
Employment Industries by Sex in Hoquiam
The Hoquiam industries that see more men than women are Agriculture, Fishing & Hunting (100.0%), Mining, Quarrying, & Extraction (100.0%), and Utilities (100.0%), whereas the industries that tend to have a higher number of women are Information (100.0%), Accommodation & Food Services (79.7%), and Professional & Scientific (76.1%).
| Industry | Male | Female |
| Agriculture, Fishing & Hunting | 46 (100.0%) | 0 (0.0%) |
| Mining, Quarrying, & Extraction | 22 (100.0%) | 0 (0.0%) |
| Construction | 183 (99.5%) | 1 (0.5%) |
| Manufacturing | 246 (86.0%) | 40 (14.0%) |
| Wholesale Trade | 40 (74.1%) | 14 (25.9%) |
| Retail Trade | 307 (55.3%) | 248 (44.7%) |
| Transportation & Warehousing | 50 (42.0%) | 69 (58.0%) |
| Utilities | 29 (100.0%) | 0 (0.0%) |
| Information | 0 (0.0%) | 20 (100.0%) |
| Finance & Insurance | 62 (71.3%) | 25 (28.7%) |
| Real Estate, Rental & Leasing | 11 (32.4%) | 23 (67.6%) |
| Professional & Scientific | 11 (23.9%) | 35 (76.1%) |
| Enterprise Management | 0 (0.0%) | 0 (0.0%) |
| Administrative & Support | 86 (64.2%) | 48 (35.8%) |
| Educational Services | 202 (48.2%) | 217 (51.8%) |
| Health Care & Social Assistance | 152 (26.9%) | 414 (73.1%) |
| Arts, Entertainment & Recreation | 193 (97.0%) | 6 (3.0%) |
| Accommodation & Food Services | 51 (20.3%) | 200 (79.7%) |
| Public Administration | 168 (57.0%) | 127 (43.0%) |
| Total | 1,933 (55.9%) | 1,522 (44.1%) |
Education in Hoquiam
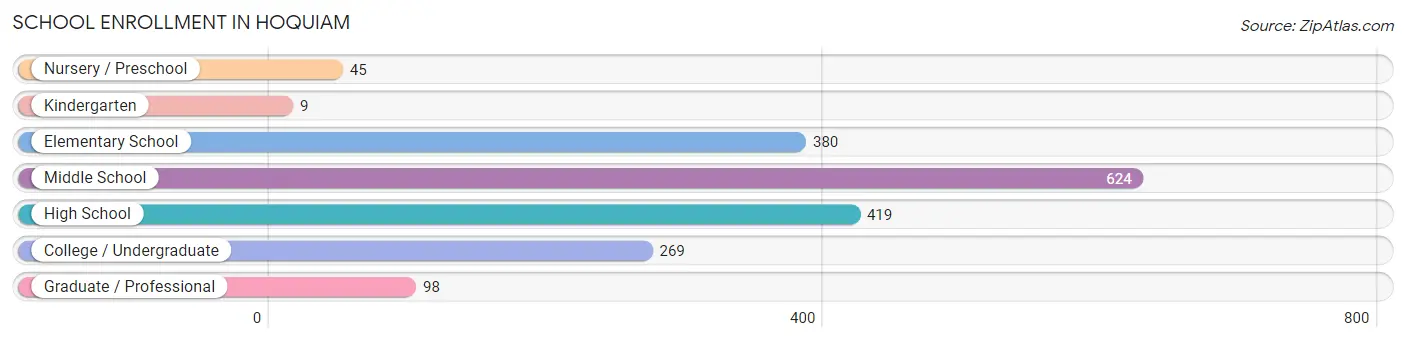
School Enrollment in Hoquiam
The most common levels of schooling among the 1,844 students in Hoquiam are middle school (624 | 33.8%), high school (419 | 22.7%), and elementary school (380 | 20.6%).
| School Level | # Students | % Students |
| Nursery / Preschool | 45 | 2.4% |
| Kindergarten | 9 | 0.5% |
| Elementary School | 380 | 20.6% |
| Middle School | 624 | 33.8% |
| High School | 419 | 22.7% |
| College / Undergraduate | 269 | 14.6% |
| Graduate / Professional | 98 | 5.3% |
| Total | 1,844 | 100.0% |
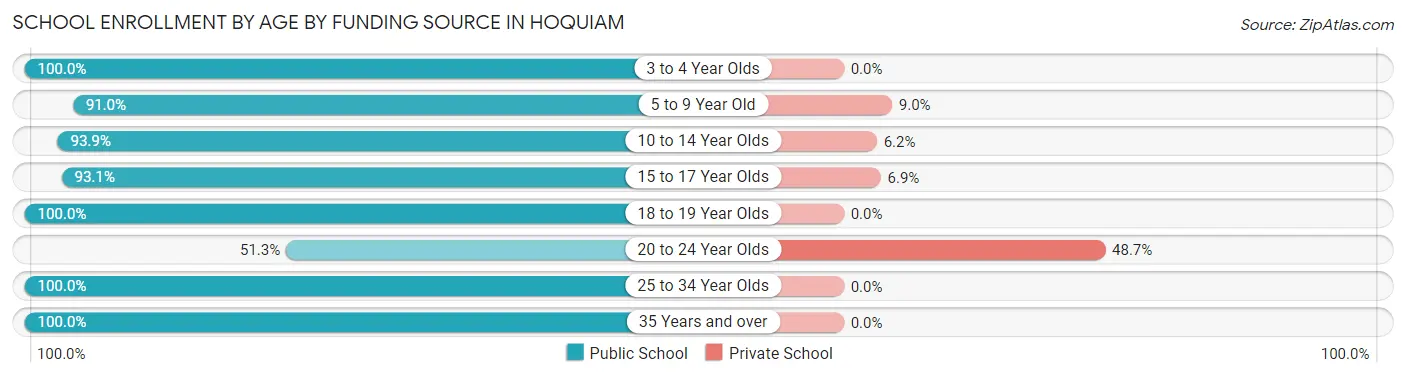
School Enrollment by Age by Funding Source in Hoquiam
Out of a total of 1,844 students who are enrolled in schools in Hoquiam, 151 (8.2%) attend a private institution, while the remaining 1,693 (91.8%) are enrolled in public schools. The age group of 20 to 24 year olds has the highest likelihood of being enrolled in private schools, with 56 (48.7% in the age bracket) enrolled. Conversely, the age group of 3 to 4 year olds has the lowest likelihood of being enrolled in a private school, with 38 (100.0% in the age bracket) attending a public institution.
| Age Bracket | Public School | Private School |
| 3 to 4 Year Olds | 38 (100.0%) | 0 (0.0%) |
| 5 to 9 Year Old | 304 (91.0%) | 30 (9.0%) |
| 10 to 14 Year Olds | 671 (93.9%) | 44 (6.1%) |
| 15 to 17 Year Olds | 298 (93.1%) | 22 (6.9%) |
| 18 to 19 Year Olds | 73 (100.0%) | 0 (0.0%) |
| 20 to 24 Year Olds | 59 (51.3%) | 56 (48.7%) |
| 25 to 34 Year Olds | 129 (100.0%) | 0 (0.0%) |
| 35 Years and over | 120 (100.0%) | 0 (0.0%) |
| Total | 1,693 (91.8%) | 151 (8.2%) |
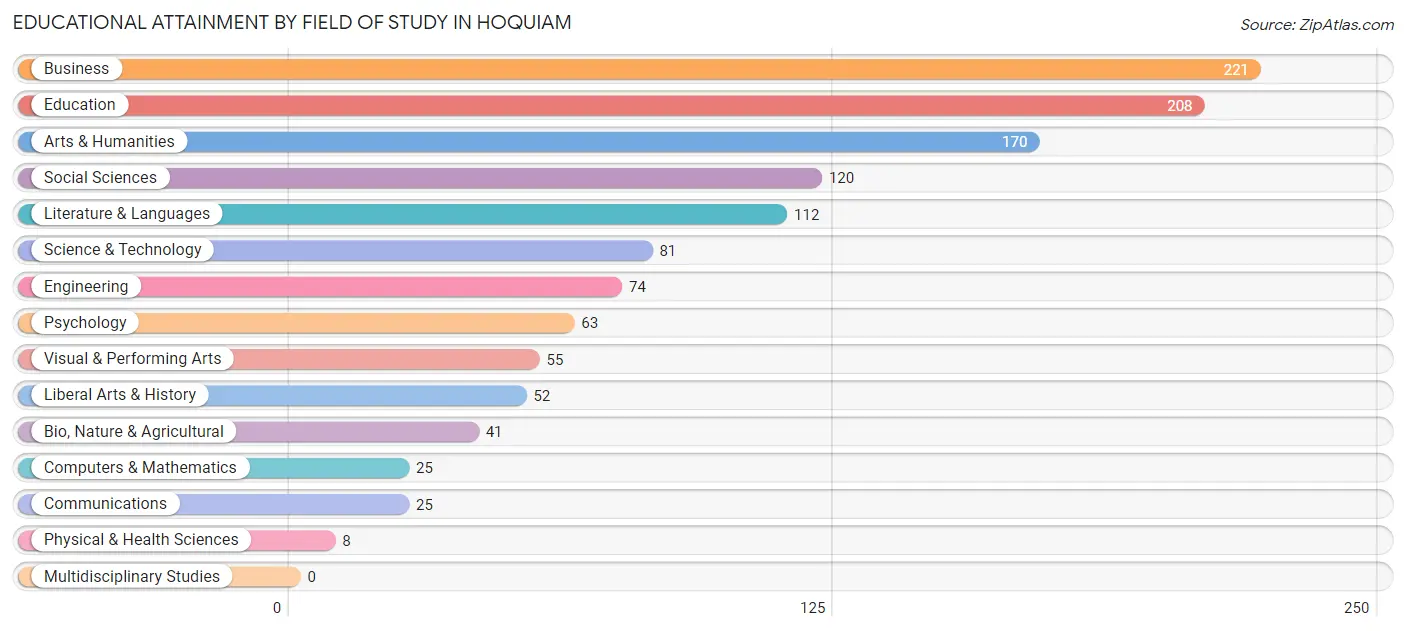
Educational Attainment by Field of Study in Hoquiam
Business (221 | 17.6%), education (208 | 16.6%), arts & humanities (170 | 13.6%), social sciences (120 | 9.6%), and literature & languages (112 | 8.9%) are the most common fields of study among 1,255 individuals in Hoquiam who have obtained a bachelor's degree or higher.
| Field of Study | # Graduates | % Graduates |
| Computers & Mathematics | 25 | 2.0% |
| Bio, Nature & Agricultural | 41 | 3.3% |
| Physical & Health Sciences | 8 | 0.6% |
| Psychology | 63 | 5.0% |
| Social Sciences | 120 | 9.6% |
| Engineering | 74 | 5.9% |
| Multidisciplinary Studies | 0 | 0.0% |
| Science & Technology | 81 | 6.5% |
| Business | 221 | 17.6% |
| Education | 208 | 16.6% |
| Literature & Languages | 112 | 8.9% |
| Liberal Arts & History | 52 | 4.1% |
| Visual & Performing Arts | 55 | 4.4% |
| Communications | 25 | 2.0% |
| Arts & Humanities | 170 | 13.6% |
| Total | 1,255 | 100.0% |
Transportation & Commute in Hoquiam
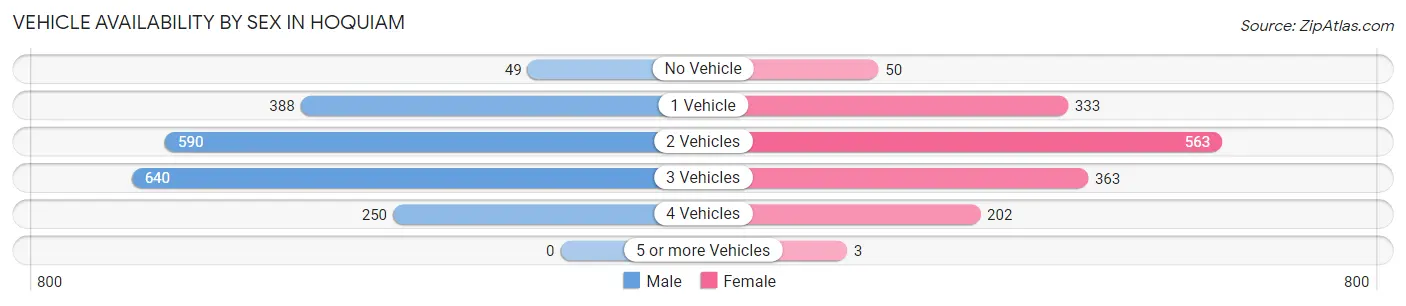
Vehicle Availability by Sex in Hoquiam
The most prevalent vehicle ownership categories in Hoquiam are males with 3 vehicles (640, accounting for 33.4%) and females with 3 vehicles (363, making up 42.3%).
| Vehicles Available | Male | Female |
| No Vehicle | 49 (2.6%) | 50 (3.3%) |
| 1 Vehicle | 388 (20.2%) | 333 (22.0%) |
| 2 Vehicles | 590 (30.8%) | 563 (37.2%) |
| 3 Vehicles | 640 (33.4%) | 363 (24.0%) |
| 4 Vehicles | 250 (13.0%) | 202 (13.3%) |
| 5 or more Vehicles | 0 (0.0%) | 3 (0.2%) |
| Total | 1,917 (100.0%) | 1,514 (100.0%) |
Commute Time in Hoquiam
The most frequently occuring commute durations in Hoquiam are 5 to 9 minutes (891 commuters, 26.7%), 15 to 19 minutes (557 commuters, 16.7%), and 10 to 14 minutes (477 commuters, 14.3%).
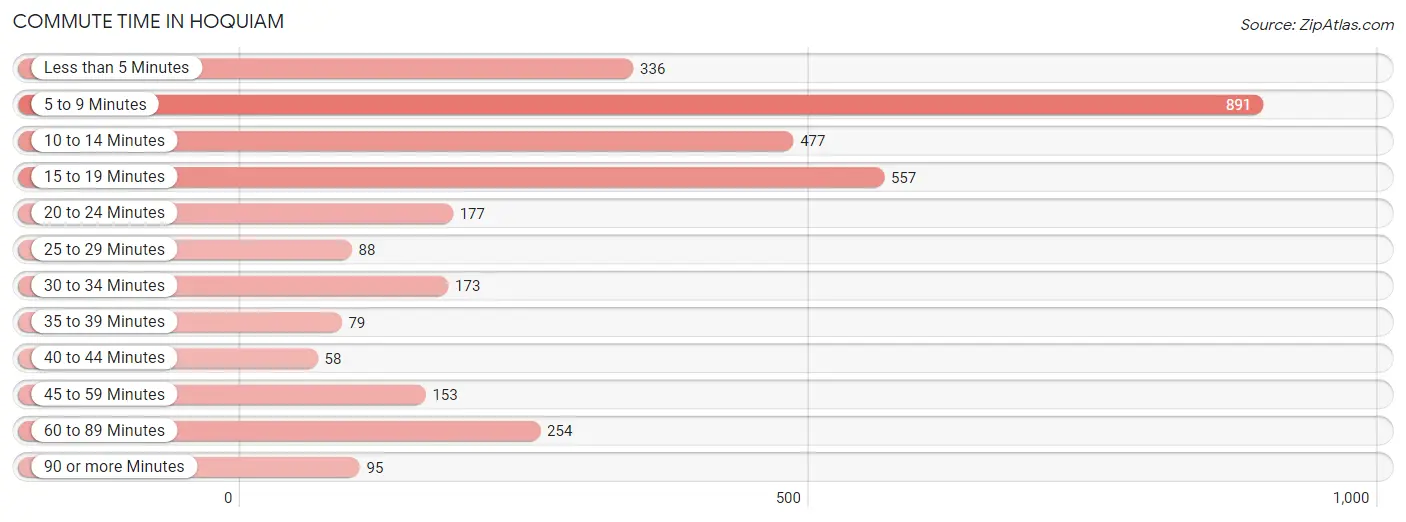
| Commute Time | # Commuters | % Commuters |
| Less than 5 Minutes | 336 | 10.1% |
| 5 to 9 Minutes | 891 | 26.7% |
| 10 to 14 Minutes | 477 | 14.3% |
| 15 to 19 Minutes | 557 | 16.7% |
| 20 to 24 Minutes | 177 | 5.3% |
| 25 to 29 Minutes | 88 | 2.6% |
| 30 to 34 Minutes | 173 | 5.2% |
| 35 to 39 Minutes | 79 | 2.4% |
| 40 to 44 Minutes | 58 | 1.7% |
| 45 to 59 Minutes | 153 | 4.6% |
| 60 to 89 Minutes | 254 | 7.6% |
| 90 or more Minutes | 95 | 2.9% |
Commute Time by Sex in Hoquiam
The most common commute times in Hoquiam are 5 to 9 minutes (554 commuters, 29.6%) for males and 5 to 9 minutes (337 commuters, 23.0%) for females.
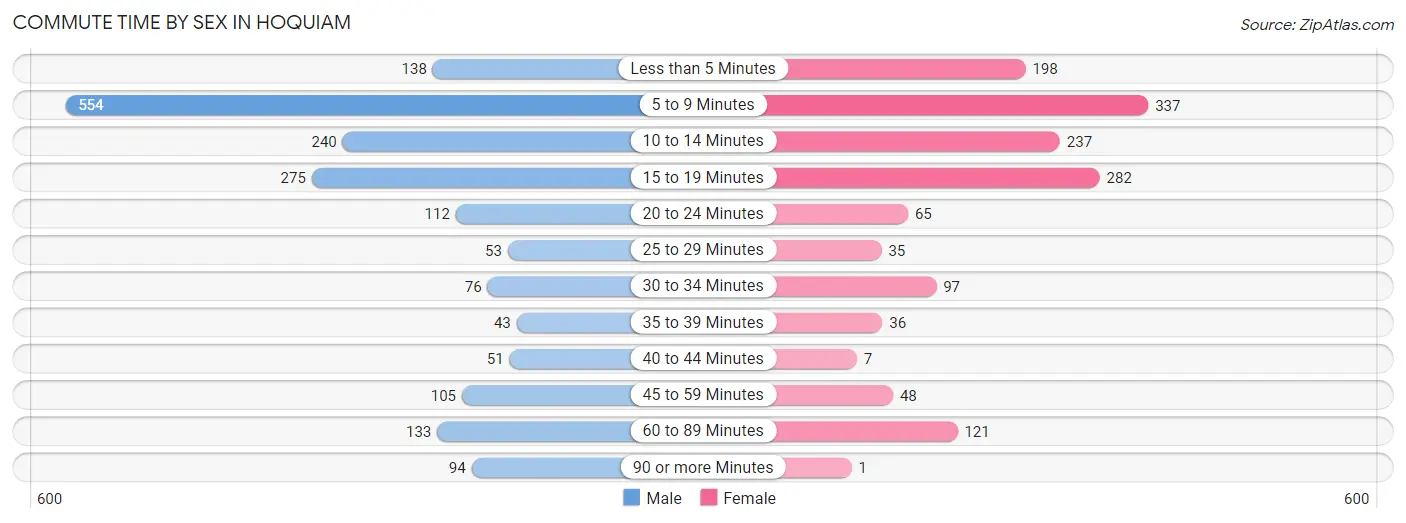
| Commute Time | Male | Female |
| Less than 5 Minutes | 138 (7.4%) | 198 (13.5%) |
| 5 to 9 Minutes | 554 (29.6%) | 337 (23.0%) |
| 10 to 14 Minutes | 240 (12.8%) | 237 (16.2%) |
| 15 to 19 Minutes | 275 (14.7%) | 282 (19.3%) |
| 20 to 24 Minutes | 112 (6.0%) | 65 (4.4%) |
| 25 to 29 Minutes | 53 (2.8%) | 35 (2.4%) |
| 30 to 34 Minutes | 76 (4.1%) | 97 (6.6%) |
| 35 to 39 Minutes | 43 (2.3%) | 36 (2.5%) |
| 40 to 44 Minutes | 51 (2.7%) | 7 (0.5%) |
| 45 to 59 Minutes | 105 (5.6%) | 48 (3.3%) |
| 60 to 89 Minutes | 133 (7.1%) | 121 (8.3%) |
| 90 or more Minutes | 94 (5.0%) | 1 (0.1%) |
Time of Departure to Work by Sex in Hoquiam
The most frequent times of departure to work in Hoquiam are 7:00 AM to 7:29 AM (342, 18.2%) for males and 7:30 AM to 7:59 AM (273, 18.6%) for females.
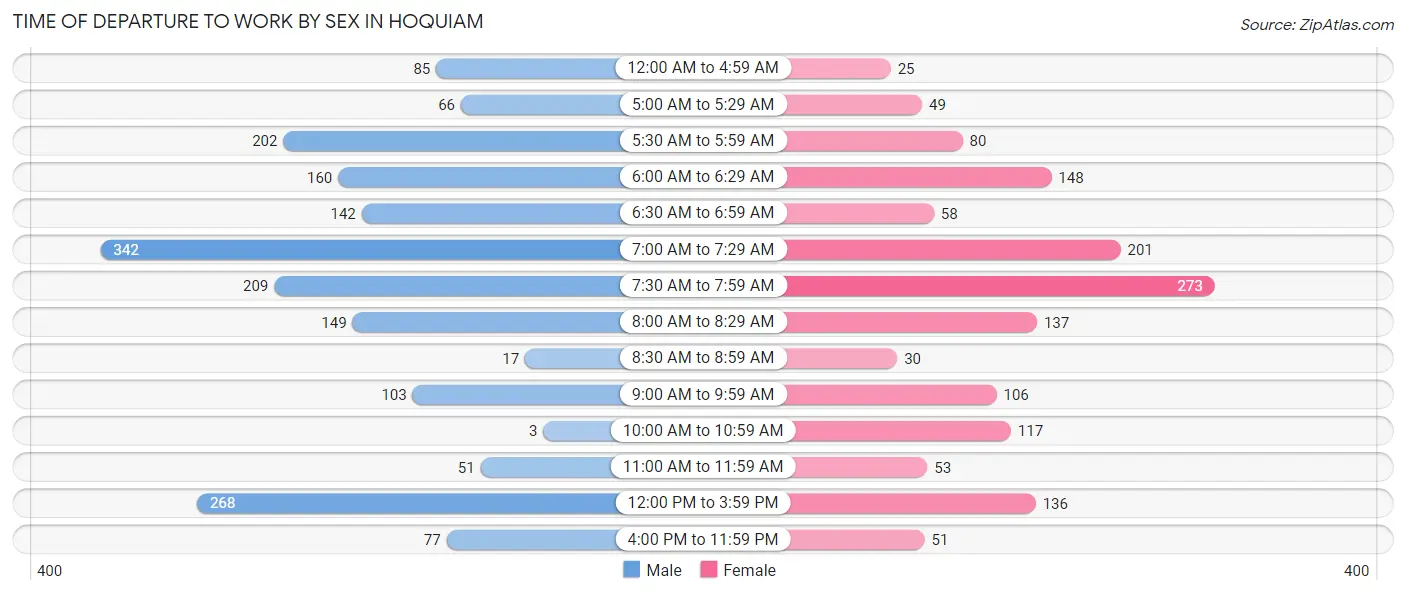
| Time of Departure | Male | Female |
| 12:00 AM to 4:59 AM | 85 (4.5%) | 25 (1.7%) |
| 5:00 AM to 5:29 AM | 66 (3.5%) | 49 (3.4%) |
| 5:30 AM to 5:59 AM | 202 (10.8%) | 80 (5.5%) |
| 6:00 AM to 6:29 AM | 160 (8.5%) | 148 (10.1%) |
| 6:30 AM to 6:59 AM | 142 (7.6%) | 58 (4.0%) |
| 7:00 AM to 7:29 AM | 342 (18.2%) | 201 (13.7%) |
| 7:30 AM to 7:59 AM | 209 (11.2%) | 273 (18.6%) |
| 8:00 AM to 8:29 AM | 149 (8.0%) | 137 (9.4%) |
| 8:30 AM to 8:59 AM | 17 (0.9%) | 30 (2.1%) |
| 9:00 AM to 9:59 AM | 103 (5.5%) | 106 (7.2%) |
| 10:00 AM to 10:59 AM | 3 (0.2%) | 117 (8.0%) |
| 11:00 AM to 11:59 AM | 51 (2.7%) | 53 (3.6%) |
| 12:00 PM to 3:59 PM | 268 (14.3%) | 136 (9.3%) |
| 4:00 PM to 11:59 PM | 77 (4.1%) | 51 (3.5%) |
| Total | 1,874 (100.0%) | 1,464 (100.0%) |
Housing Occupancy in Hoquiam
Occupancy by Ownership in Hoquiam
Of the total 3,747 dwellings in Hoquiam, owner-occupied units account for 2,141 (57.1%), while renter-occupied units make up 1,606 (42.9%).
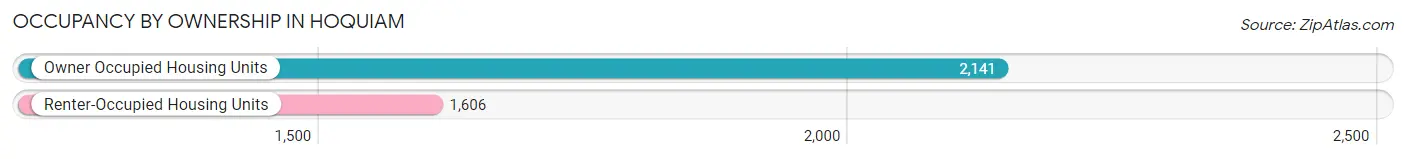
| Occupancy | # Housing Units | % Housing Units |
| Owner Occupied Housing Units | 2,141 | 57.1% |
| Renter-Occupied Housing Units | 1,606 | 42.9% |
| Total Occupied Housing Units | 3,747 | 100.0% |
Occupancy by Household Size in Hoquiam
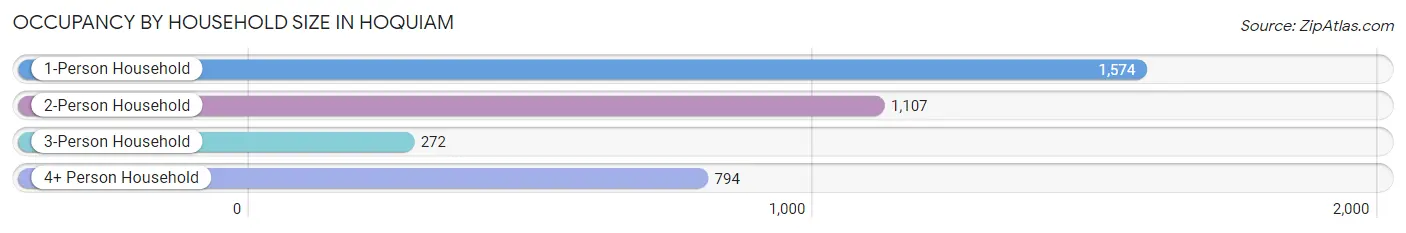
| Household Size | # Housing Units | % Housing Units |
| 1-Person Household | 1,574 | 42.0% |
| 2-Person Household | 1,107 | 29.5% |
| 3-Person Household | 272 | 7.3% |
| 4+ Person Household | 794 | 21.2% |
| Total Housing Units | 3,747 | 100.0% |
Occupancy by Ownership by Household Size in Hoquiam
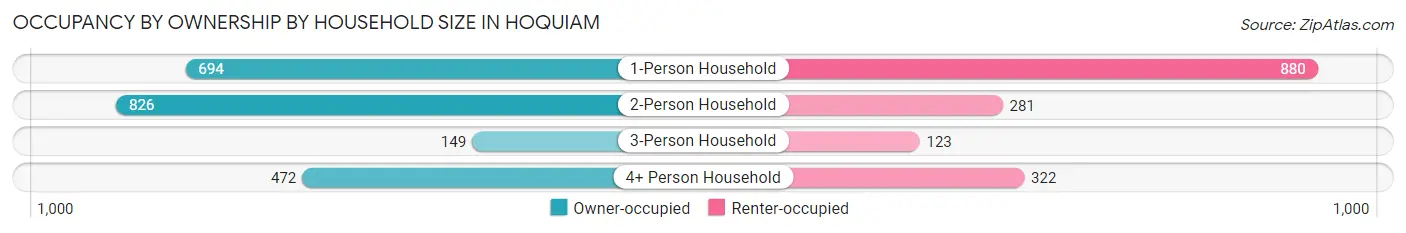
| Household Size | Owner-occupied | Renter-occupied |
| 1-Person Household | 694 (44.1%) | 880 (55.9%) |
| 2-Person Household | 826 (74.6%) | 281 (25.4%) |
| 3-Person Household | 149 (54.8%) | 123 (45.2%) |
| 4+ Person Household | 472 (59.5%) | 322 (40.6%) |
| Total Housing Units | 2,141 (57.1%) | 1,606 (42.9%) |
Occupancy by Educational Attainment in Hoquiam
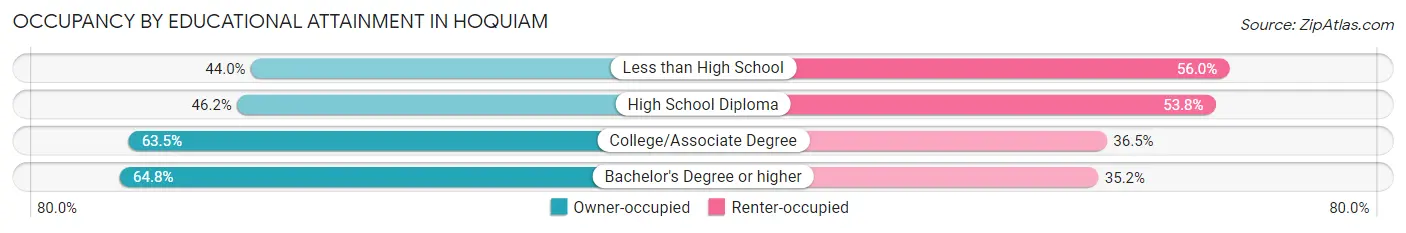
| Household Size | Owner-occupied | Renter-occupied |
| Less than High School | 59 (44.0%) | 75 (56.0%) |
| High School Diploma | 592 (46.2%) | 689 (53.8%) |
| College/Associate Degree | 1,029 (63.5%) | 592 (36.5%) |
| Bachelor's Degree or higher | 461 (64.8%) | 250 (35.2%) |
Occupancy by Age of Householder in Hoquiam
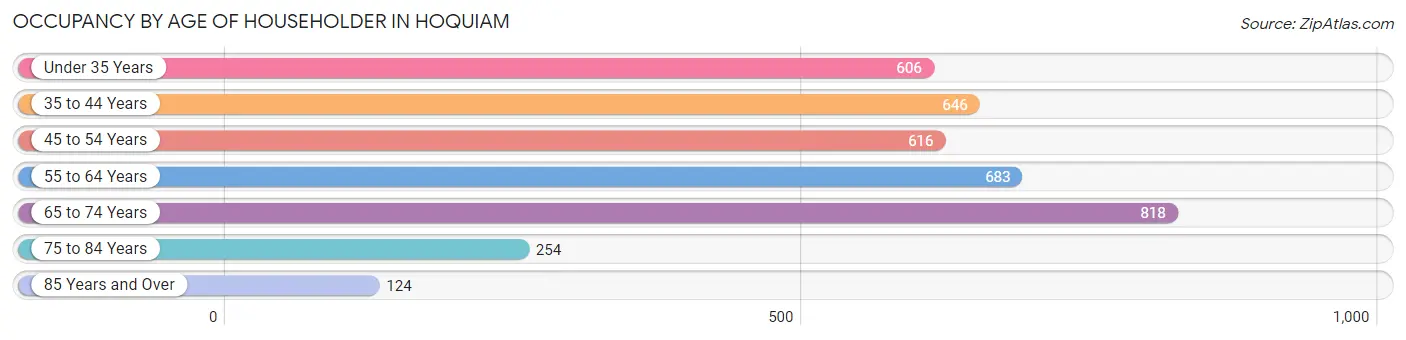
| Age Bracket | # Households | % Households |
| Under 35 Years | 606 | 16.2% |
| 35 to 44 Years | 646 | 17.2% |
| 45 to 54 Years | 616 | 16.4% |
| 55 to 64 Years | 683 | 18.2% |
| 65 to 74 Years | 818 | 21.8% |
| 75 to 84 Years | 254 | 6.8% |
| 85 Years and Over | 124 | 3.3% |
| Total | 3,747 | 100.0% |
Housing Finances in Hoquiam
Median Income by Occupancy in Hoquiam
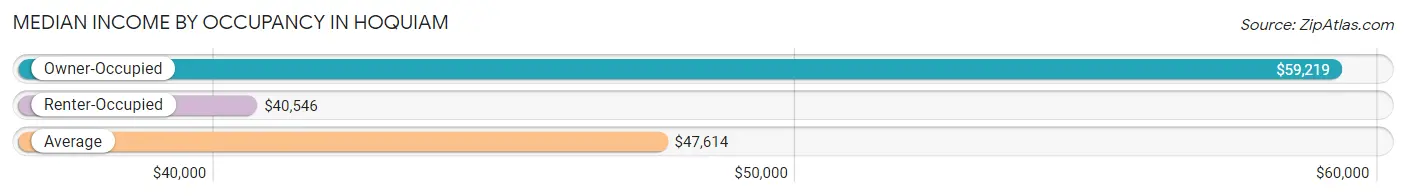
| Occupancy Type | # Households | Median Income |
| Owner-Occupied | 2,141 (57.1%) | $59,219 |
| Renter-Occupied | 1,606 (42.9%) | $40,546 |
| Average | 3,747 (100.0%) | $47,614 |
Occupancy by Householder Income Bracket in Hoquiam
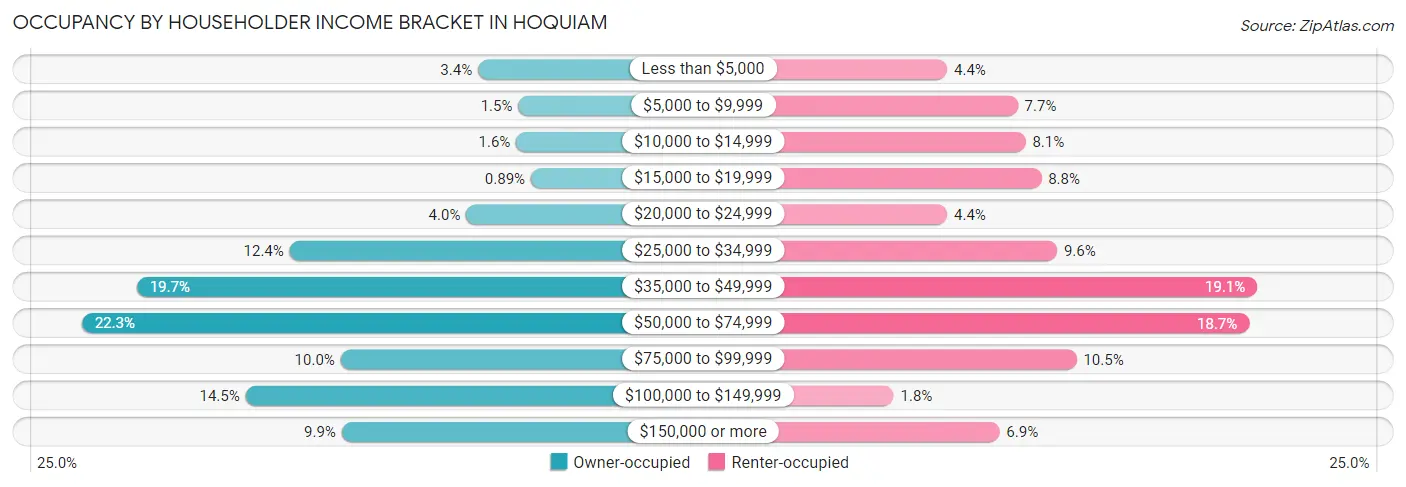
| Income Bracket | Owner-occupied | Renter-occupied |
| Less than $5,000 | 73 (3.4%) | 70 (4.4%) |
| $5,000 to $9,999 | 32 (1.5%) | 124 (7.7%) |
| $10,000 to $14,999 | 34 (1.6%) | 130 (8.1%) |
| $15,000 to $19,999 | 19 (0.9%) | 142 (8.8%) |
| $20,000 to $24,999 | 85 (4.0%) | 70 (4.4%) |
| $25,000 to $34,999 | 265 (12.4%) | 154 (9.6%) |
| $35,000 to $49,999 | 421 (19.7%) | 307 (19.1%) |
| $50,000 to $74,999 | 477 (22.3%) | 301 (18.7%) |
| $75,000 to $99,999 | 213 (10.0%) | 169 (10.5%) |
| $100,000 to $149,999 | 310 (14.5%) | 29 (1.8%) |
| $150,000 or more | 212 (9.9%) | 110 (6.9%) |
| Total | 2,141 (100.0%) | 1,606 (100.0%) |
Monthly Housing Cost Tiers in Hoquiam
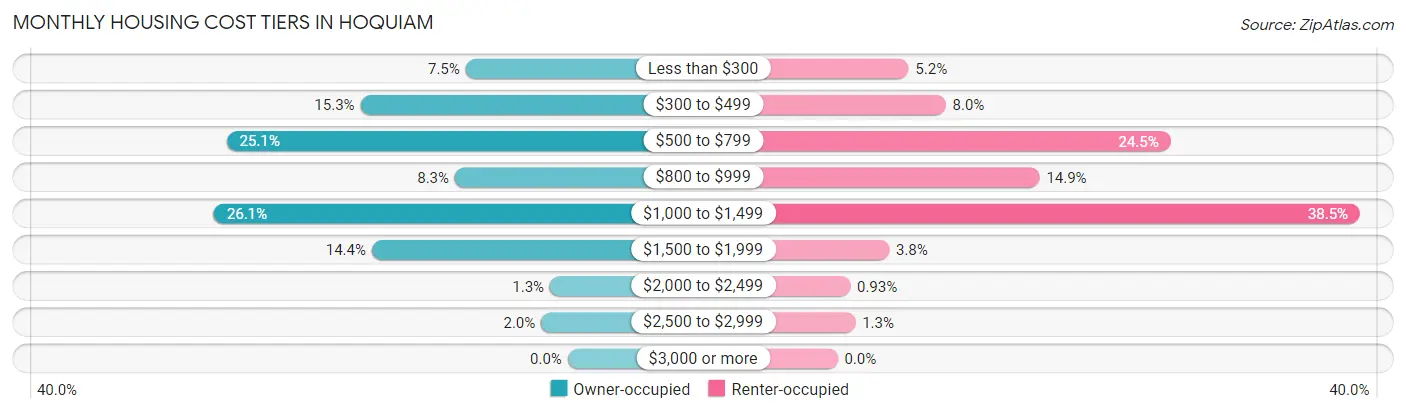
| Monthly Cost | Owner-occupied | Renter-occupied |
| Less than $300 | 161 (7.5%) | 84 (5.2%) |
| $300 to $499 | 327 (15.3%) | 128 (8.0%) |
| $500 to $799 | 538 (25.1%) | 394 (24.5%) |
| $800 to $999 | 178 (8.3%) | 239 (14.9%) |
| $1,000 to $1,499 | 558 (26.1%) | 618 (38.5%) |
| $1,500 to $1,999 | 309 (14.4%) | 61 (3.8%) |
| $2,000 to $2,499 | 28 (1.3%) | 15 (0.9%) |
| $2,500 to $2,999 | 42 (2.0%) | 21 (1.3%) |
| $3,000 or more | 0 (0.0%) | 0 (0.0%) |
| Total | 2,141 (100.0%) | 1,606 (100.0%) |
Physical Housing Characteristics in Hoquiam
Housing Structures in Hoquiam
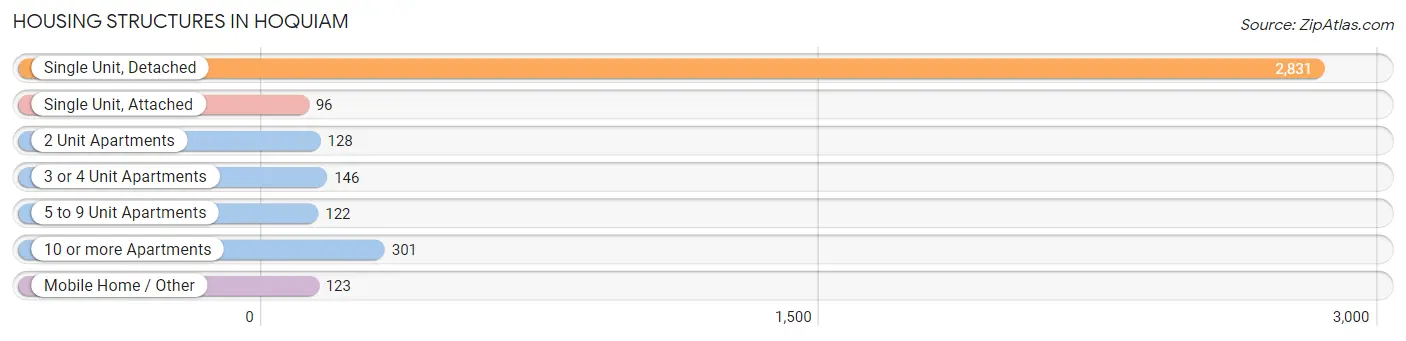
| Structure Type | # Housing Units | % Housing Units |
| Single Unit, Detached | 2,831 | 75.5% |
| Single Unit, Attached | 96 | 2.6% |
| 2 Unit Apartments | 128 | 3.4% |
| 3 or 4 Unit Apartments | 146 | 3.9% |
| 5 to 9 Unit Apartments | 122 | 3.3% |
| 10 or more Apartments | 301 | 8.0% |
| Mobile Home / Other | 123 | 3.3% |
| Total | 3,747 | 100.0% |
Housing Structures by Occupancy in Hoquiam
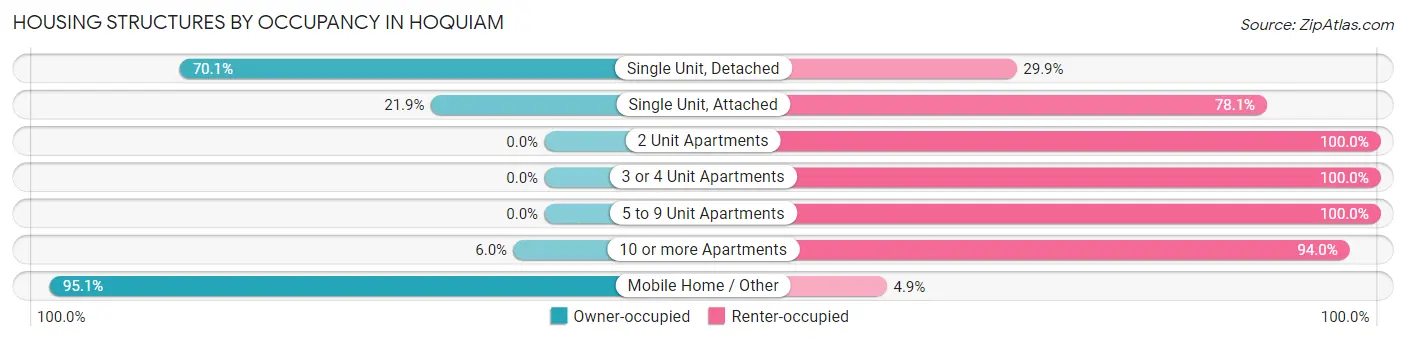
| Structure Type | Owner-occupied | Renter-occupied |
| Single Unit, Detached | 1,985 (70.1%) | 846 (29.9%) |
| Single Unit, Attached | 21 (21.9%) | 75 (78.1%) |
| 2 Unit Apartments | 0 (0.0%) | 128 (100.0%) |
| 3 or 4 Unit Apartments | 0 (0.0%) | 146 (100.0%) |
| 5 to 9 Unit Apartments | 0 (0.0%) | 122 (100.0%) |
| 10 or more Apartments | 18 (6.0%) | 283 (94.0%) |
| Mobile Home / Other | 117 (95.1%) | 6 (4.9%) |
| Total | 2,141 (57.1%) | 1,606 (42.9%) |
Housing Structures by Number of Rooms in Hoquiam
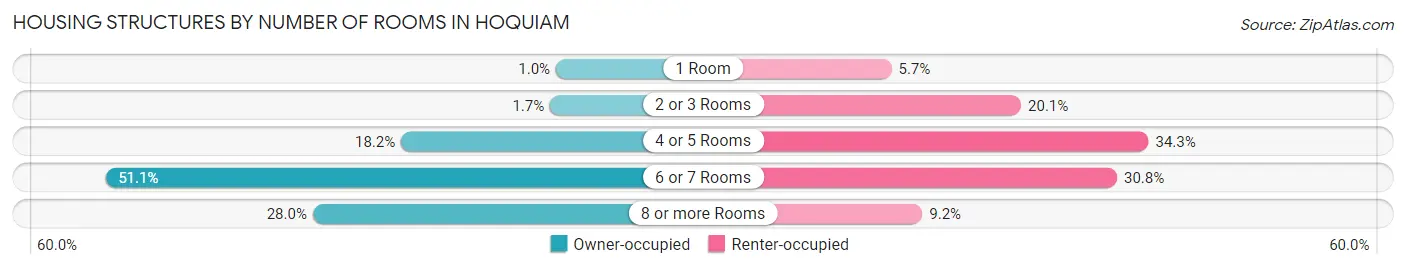
| Number of Rooms | Owner-occupied | Renter-occupied |
| 1 Room | 22 (1.0%) | 92 (5.7%) |
| 2 or 3 Rooms | 36 (1.7%) | 323 (20.1%) |
| 4 or 5 Rooms | 390 (18.2%) | 550 (34.3%) |
| 6 or 7 Rooms | 1,093 (51.0%) | 494 (30.8%) |
| 8 or more Rooms | 600 (28.0%) | 147 (9.1%) |
| Total | 2,141 (100.0%) | 1,606 (100.0%) |
Housing Structure by Heating Type in Hoquiam
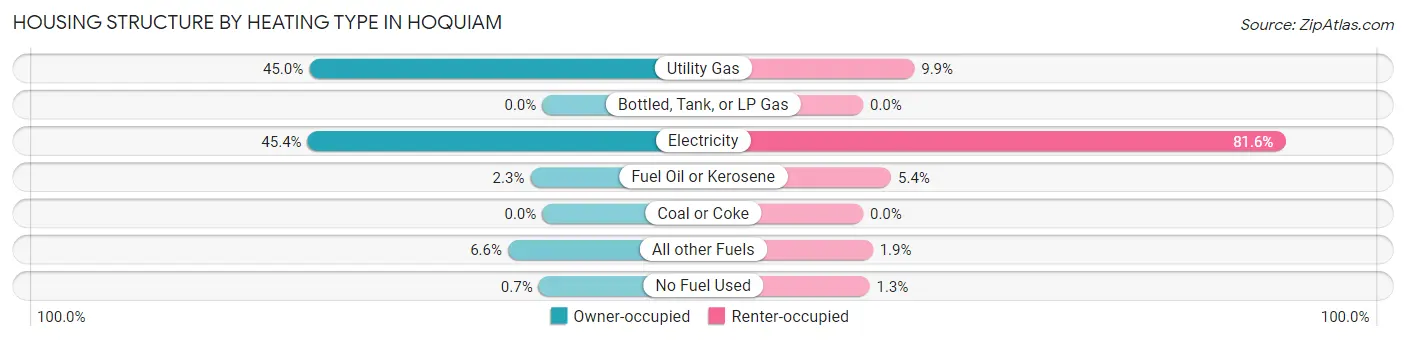
| Heating Type | Owner-occupied | Renter-occupied |
| Utility Gas | 964 (45.0%) | 159 (9.9%) |
| Bottled, Tank, or LP Gas | 0 (0.0%) | 0 (0.0%) |
| Electricity | 971 (45.4%) | 1,310 (81.6%) |
| Fuel Oil or Kerosene | 49 (2.3%) | 87 (5.4%) |
| Coal or Coke | 0 (0.0%) | 0 (0.0%) |
| All other Fuels | 142 (6.6%) | 30 (1.9%) |
| No Fuel Used | 15 (0.7%) | 20 (1.3%) |
| Total | 2,141 (100.0%) | 1,606 (100.0%) |
Household Vehicle Usage in Hoquiam
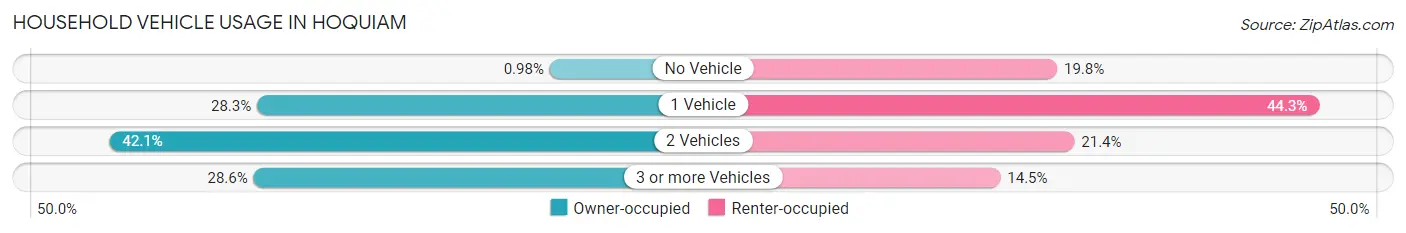
| Vehicles per Household | Owner-occupied | Renter-occupied |
| No Vehicle | 21 (1.0%) | 318 (19.8%) |
| 1 Vehicle | 606 (28.3%) | 711 (44.3%) |
| 2 Vehicles | 901 (42.1%) | 344 (21.4%) |
| 3 or more Vehicles | 613 (28.6%) | 233 (14.5%) |
| Total | 2,141 (100.0%) | 1,606 (100.0%) |
Real Estate & Mortgages in Hoquiam
Real Estate and Mortgage Overview in Hoquiam
| Characteristic | Without Mortgage | With Mortgage |
| Housing Units | 1,070 | 1,071 |
| Median Property Value | $142,100 | $183,800 |
| Median Household Income | $45,328 | $140 |
| Monthly Housing Costs | $528 | $0 |
| Real Estate Taxes | $1,372 | $17 |
Property Value by Mortgage Status in Hoquiam
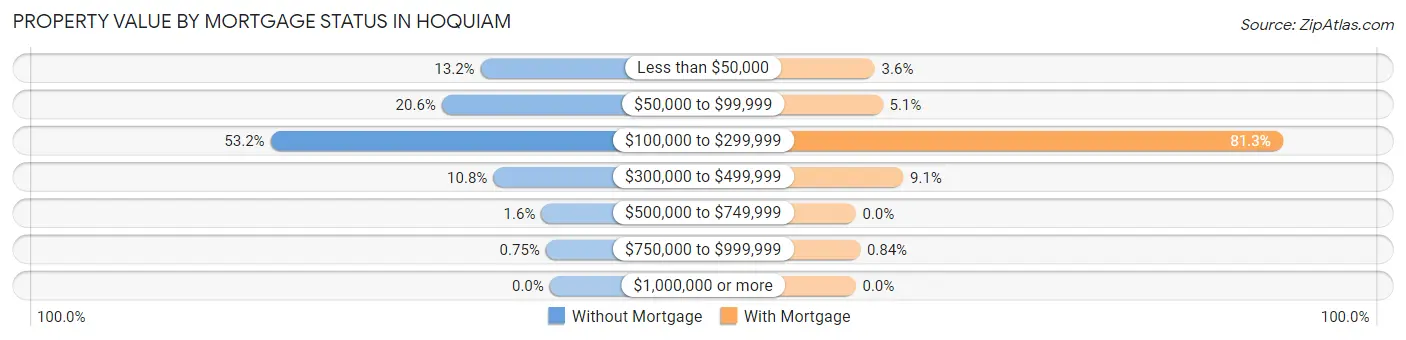
| Property Value | Without Mortgage | With Mortgage |
| Less than $50,000 | 141 (13.2%) | 39 (3.6%) |
| $50,000 to $99,999 | 220 (20.6%) | 55 (5.1%) |
| $100,000 to $299,999 | 569 (53.2%) | 871 (81.3%) |
| $300,000 to $499,999 | 115 (10.7%) | 97 (9.1%) |
| $500,000 to $749,999 | 17 (1.6%) | 0 (0.0%) |
| $750,000 to $999,999 | 8 (0.7%) | 9 (0.8%) |
| $1,000,000 or more | 0 (0.0%) | 0 (0.0%) |
| Total | 1,070 (100.0%) | 1,071 (100.0%) |
Household Income by Mortgage Status in Hoquiam
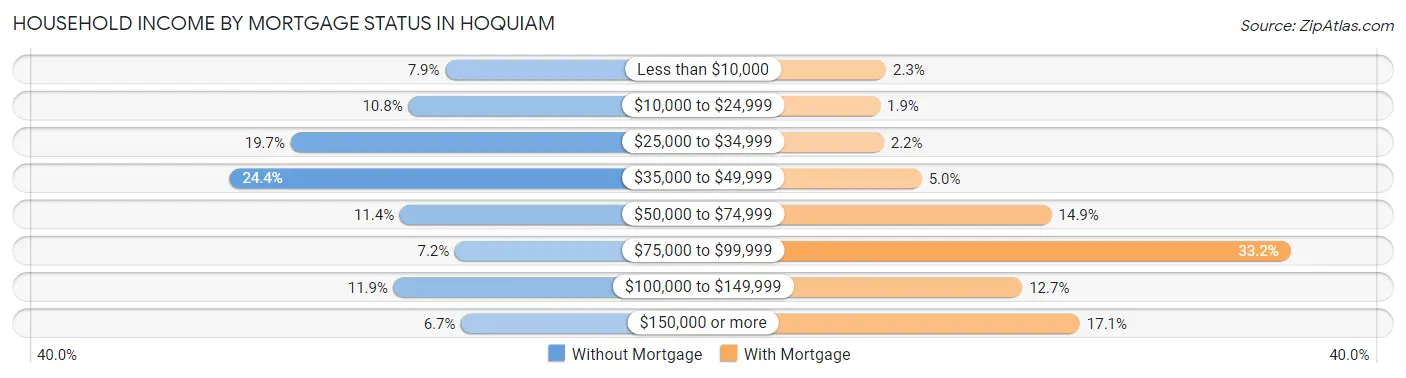
| Household Income | Without Mortgage | With Mortgage |
| Less than $10,000 | 85 (7.9%) | 25 (2.3%) |
| $10,000 to $24,999 | 115 (10.7%) | 20 (1.9%) |
| $25,000 to $34,999 | 211 (19.7%) | 23 (2.1%) |
| $35,000 to $49,999 | 261 (24.4%) | 54 (5.0%) |
| $50,000 to $74,999 | 122 (11.4%) | 160 (14.9%) |
| $75,000 to $99,999 | 77 (7.2%) | 355 (33.2%) |
| $100,000 to $149,999 | 127 (11.9%) | 136 (12.7%) |
| $150,000 or more | 72 (6.7%) | 183 (17.1%) |
| Total | 1,070 (100.0%) | 1,071 (100.0%) |
Property Value to Household Income Ratio in Hoquiam
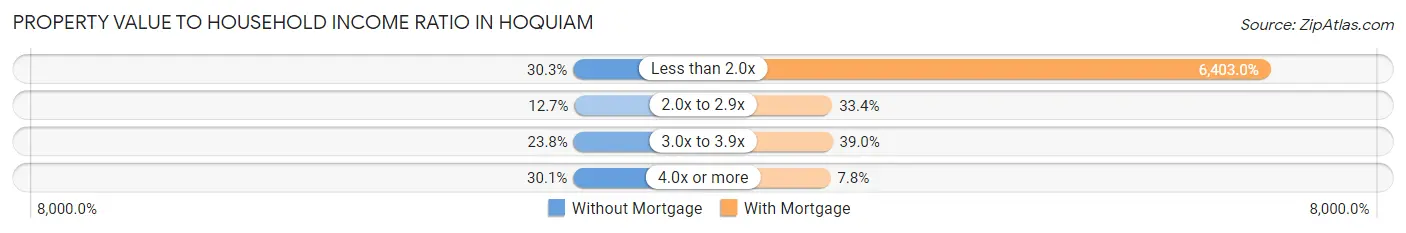
| Value-to-Income Ratio | Without Mortgage | With Mortgage |
| Less than 2.0x | 324 (30.3%) | 68,576 (6,403.0%) |
| 2.0x to 2.9x | 136 (12.7%) | 358 (33.4%) |
| 3.0x to 3.9x | 255 (23.8%) | 418 (39.0%) |
| 4.0x or more | 322 (30.1%) | 83 (7.7%) |
| Total | 1,070 (100.0%) | 1,071 (100.0%) |
Real Estate Taxes by Mortgage Status in Hoquiam
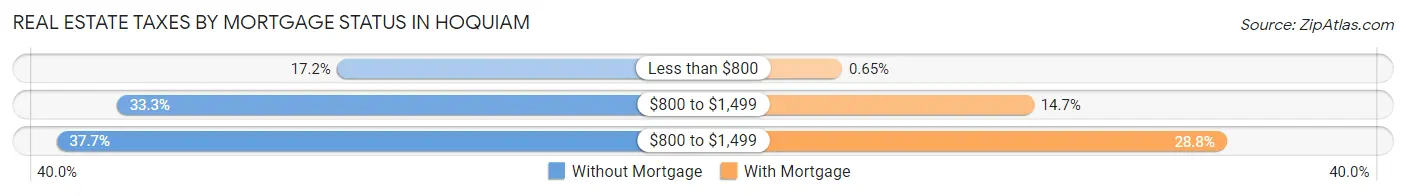
| Property Taxes | Without Mortgage | With Mortgage |
| Less than $800 | 184 (17.2%) | 7 (0.6%) |
| $800 to $1,499 | 356 (33.3%) | 157 (14.7%) |
| $800 to $1,499 | 403 (37.7%) | 308 (28.8%) |
| Total | 1,070 (100.0%) | 1,071 (100.0%) |
Health & Disability in Hoquiam
Health Insurance Coverage by Age in Hoquiam
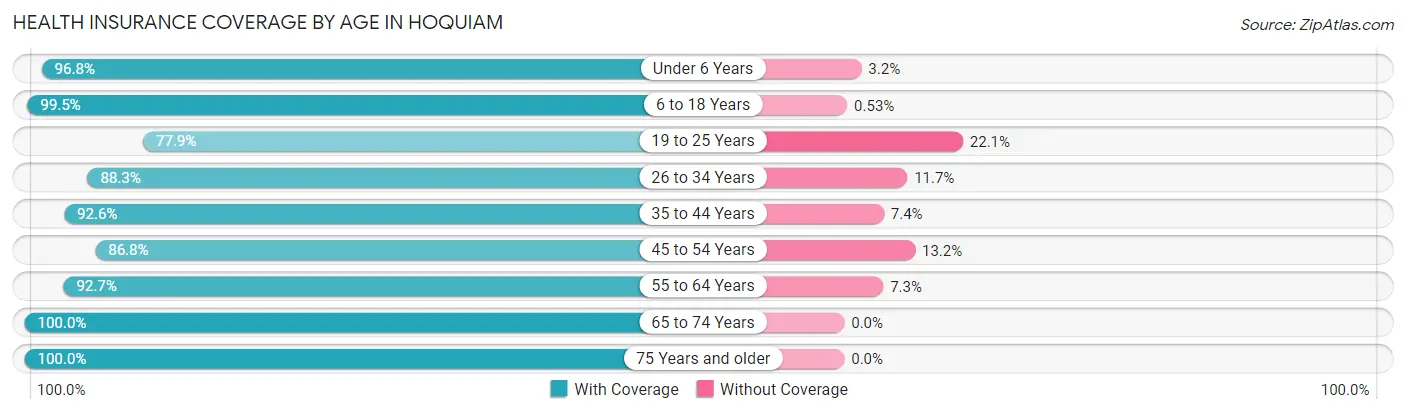
| Age Bracket | With Coverage | Without Coverage |
| Under 6 Years | 303 (96.8%) | 10 (3.2%) |
| 6 to 18 Years | 1,503 (99.5%) | 8 (0.5%) |
| 19 to 25 Years | 518 (77.9%) | 147 (22.1%) |
| 26 to 34 Years | 1,054 (88.3%) | 140 (11.7%) |
| 35 to 44 Years | 1,016 (92.6%) | 81 (7.4%) |
| 45 to 54 Years | 869 (86.8%) | 132 (13.2%) |
| 55 to 64 Years | 945 (92.7%) | 74 (7.3%) |
| 65 to 74 Years | 1,319 (100.0%) | 0 (0.0%) |
| 75 Years and older | 532 (100.0%) | 0 (0.0%) |
| Total | 8,059 (93.2%) | 592 (6.8%) |
Health Insurance Coverage by Citizenship Status in Hoquiam
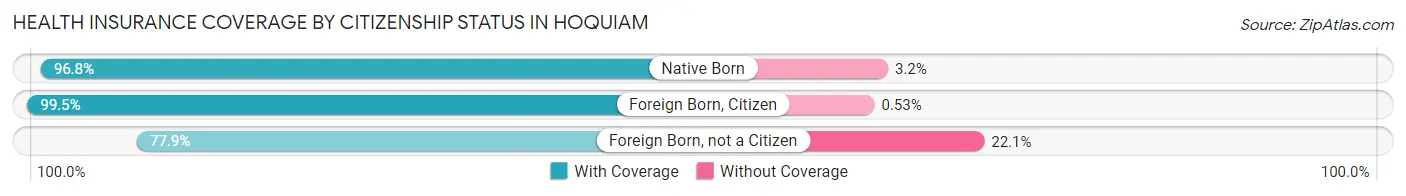
| Citizenship Status | With Coverage | Without Coverage |
| Native Born | 303 (96.8%) | 10 (3.2%) |
| Foreign Born, Citizen | 1,503 (99.5%) | 8 (0.5%) |
| Foreign Born, not a Citizen | 518 (77.9%) | 147 (22.1%) |
Health Insurance Coverage by Household Income in Hoquiam
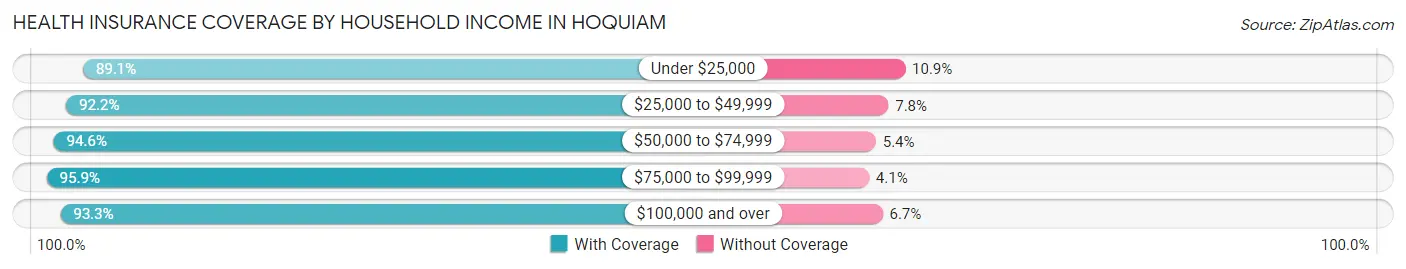
| Household Income | With Coverage | Without Coverage |
| Under $25,000 | 848 (89.1%) | 104 (10.9%) |
| $25,000 to $49,999 | 2,220 (92.2%) | 187 (7.8%) |
| $50,000 to $74,999 | 2,004 (94.6%) | 115 (5.4%) |
| $75,000 to $99,999 | 1,226 (95.9%) | 53 (4.1%) |
| $100,000 and over | 1,743 (93.3%) | 125 (6.7%) |
Public vs Private Health Insurance Coverage by Age in Hoquiam
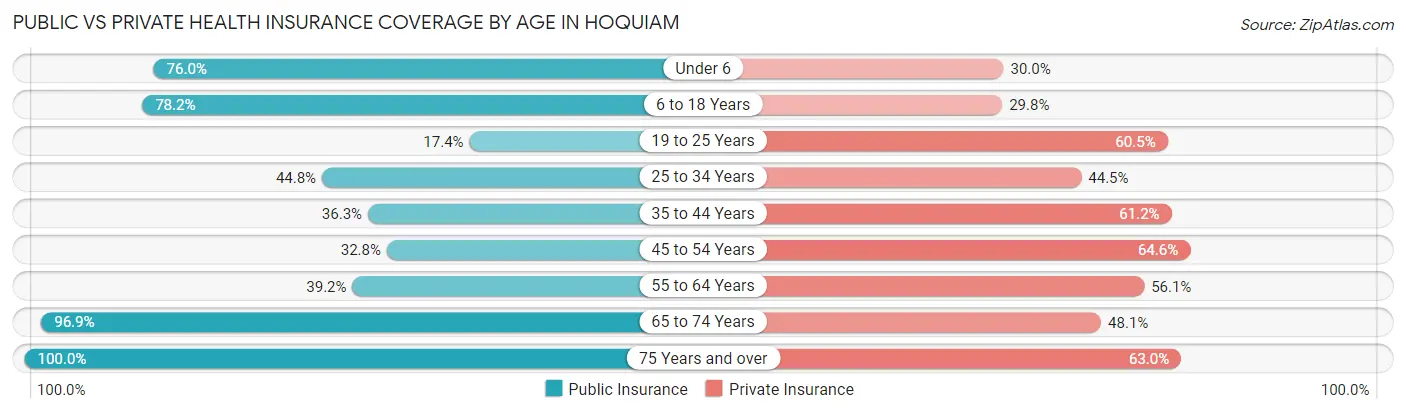
| Age Bracket | Public Insurance | Private Insurance |
| Under 6 | 238 (76.0%) | 94 (30.0%) |
| 6 to 18 Years | 1,181 (78.2%) | 450 (29.8%) |
| 19 to 25 Years | 116 (17.4%) | 402 (60.5%) |
| 25 to 34 Years | 535 (44.8%) | 531 (44.5%) |
| 35 to 44 Years | 398 (36.3%) | 671 (61.2%) |
| 45 to 54 Years | 328 (32.8%) | 647 (64.6%) |
| 55 to 64 Years | 399 (39.2%) | 572 (56.1%) |
| 65 to 74 Years | 1,278 (96.9%) | 635 (48.1%) |
| 75 Years and over | 532 (100.0%) | 335 (63.0%) |
| Total | 5,005 (57.9%) | 4,337 (50.1%) |
Disability Status by Sex by Age in Hoquiam
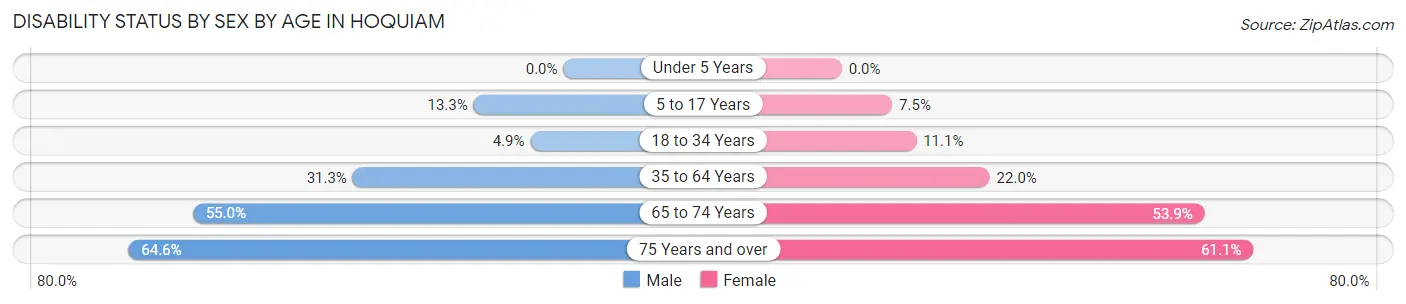
| Age Bracket | Male | Female |
| Under 5 Years | 0 (0.0%) | 0 (0.0%) |
| 5 to 17 Years | 105 (13.3%) | 52 (7.5%) |
| 18 to 34 Years | 57 (4.9%) | 85 (11.1%) |
| 35 to 64 Years | 458 (31.3%) | 363 (22.0%) |
| 65 to 74 Years | 350 (55.0%) | 368 (53.9%) |
| 75 Years and over | 166 (64.6%) | 168 (61.1%) |
Disability Class by Sex by Age in Hoquiam
Disability Class: Hearing Difficulty
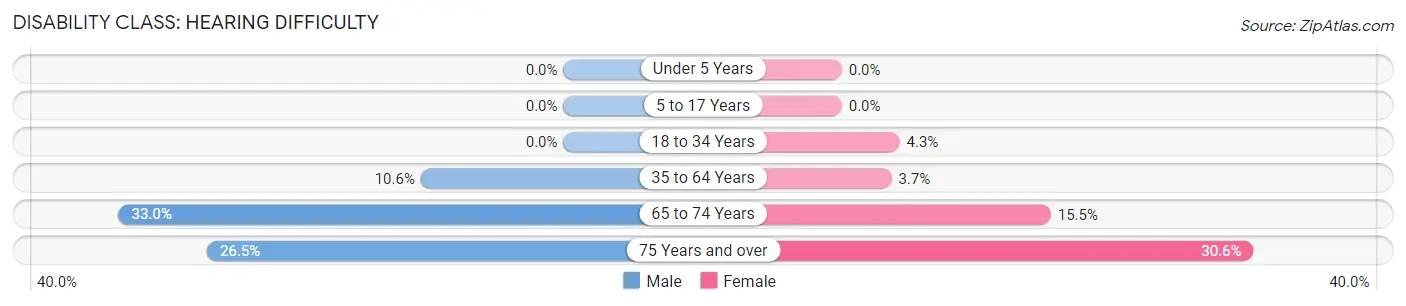
| Age Bracket | Male | Female |
| Under 5 Years | 0 (0.0%) | 0 (0.0%) |
| 5 to 17 Years | 0 (0.0%) | 0 (0.0%) |
| 18 to 34 Years | 0 (0.0%) | 33 (4.3%) |
| 35 to 64 Years | 155 (10.6%) | 61 (3.7%) |
| 65 to 74 Years | 210 (33.0%) | 106 (15.5%) |
| 75 Years and over | 68 (26.5%) | 84 (30.5%) |
Disability Class: Vision Difficulty
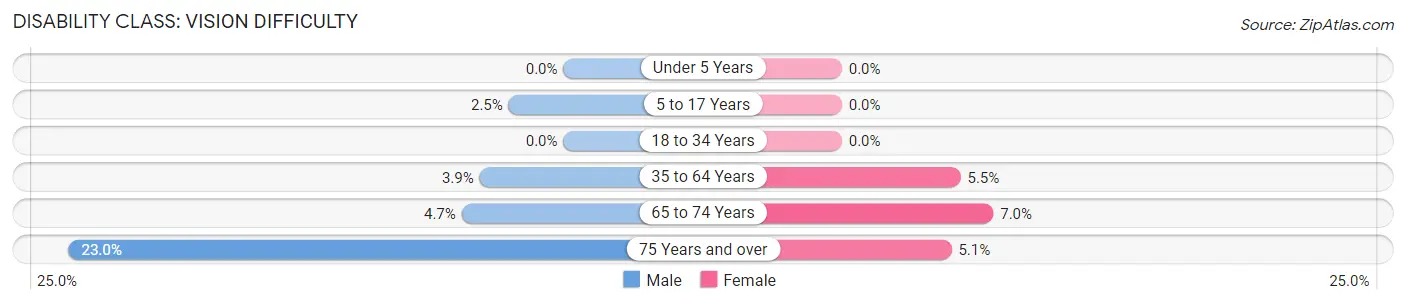
| Age Bracket | Male | Female |
| Under 5 Years | 0 (0.0%) | 0 (0.0%) |
| 5 to 17 Years | 20 (2.5%) | 0 (0.0%) |
| 18 to 34 Years | 0 (0.0%) | 0 (0.0%) |
| 35 to 64 Years | 57 (3.9%) | 91 (5.5%) |
| 65 to 74 Years | 30 (4.7%) | 48 (7.0%) |
| 75 Years and over | 59 (23.0%) | 14 (5.1%) |
Disability Class: Cognitive Difficulty
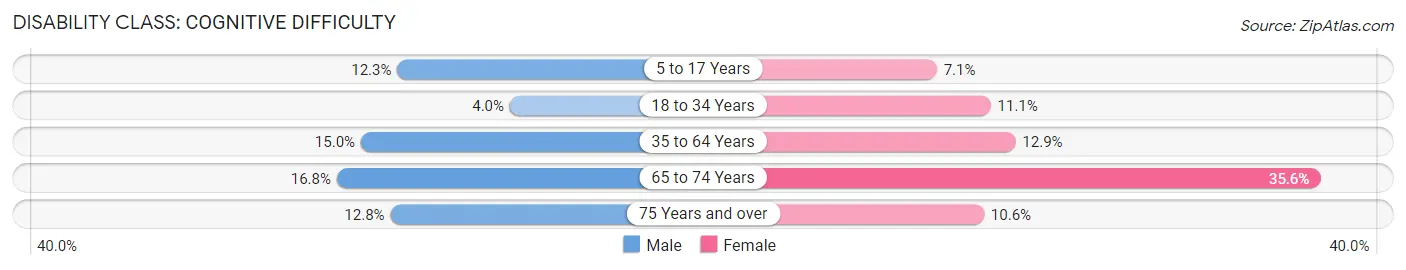
| Age Bracket | Male | Female |
| 5 to 17 Years | 97 (12.3%) | 49 (7.0%) |
| 18 to 34 Years | 46 (4.0%) | 85 (11.1%) |
| 35 to 64 Years | 220 (15.0%) | 213 (12.9%) |
| 65 to 74 Years | 107 (16.8%) | 243 (35.6%) |
| 75 Years and over | 33 (12.8%) | 29 (10.5%) |
Disability Class: Ambulatory Difficulty
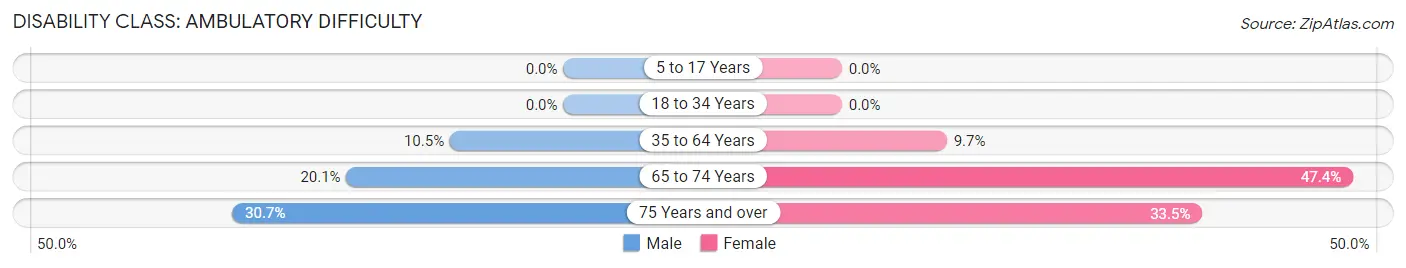
| Age Bracket | Male | Female |
| 5 to 17 Years | 0 (0.0%) | 0 (0.0%) |
| 18 to 34 Years | 0 (0.0%) | 0 (0.0%) |
| 35 to 64 Years | 154 (10.5%) | 161 (9.7%) |
| 65 to 74 Years | 128 (20.1%) | 324 (47.4%) |
| 75 Years and over | 79 (30.7%) | 92 (33.5%) |
Disability Class: Self-Care Difficulty
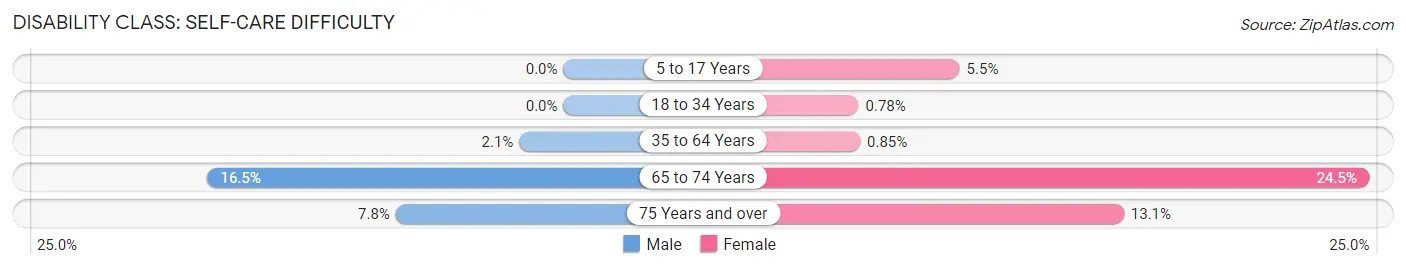
| Age Bracket | Male | Female |
| 5 to 17 Years | 0 (0.0%) | 38 (5.5%) |
| 18 to 34 Years | 0 (0.0%) | 6 (0.8%) |
| 35 to 64 Years | 30 (2.1%) | 14 (0.9%) |
| 65 to 74 Years | 105 (16.5%) | 167 (24.4%) |
| 75 Years and over | 20 (7.8%) | 36 (13.1%) |
Technology Access in Hoquiam
Computing Device Access in Hoquiam
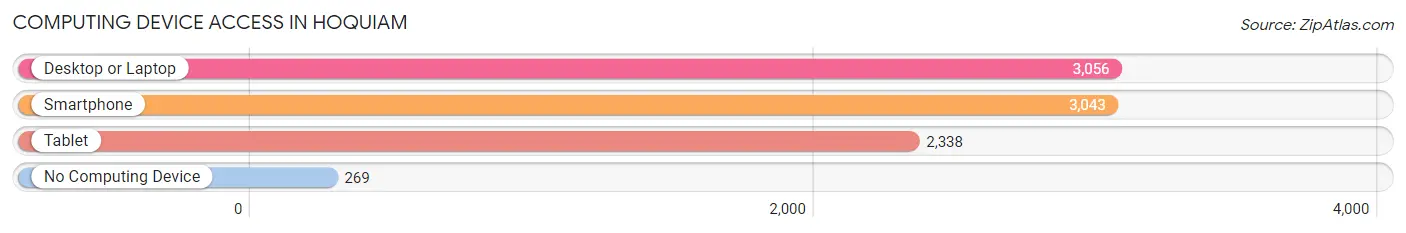
| Device Type | # Households | % Households |
| Desktop or Laptop | 3,056 | 81.6% |
| Smartphone | 3,043 | 81.2% |
| Tablet | 2,338 | 62.4% |
| No Computing Device | 269 | 7.2% |
| Total | 3,747 | 100.0% |
Internet Access in Hoquiam
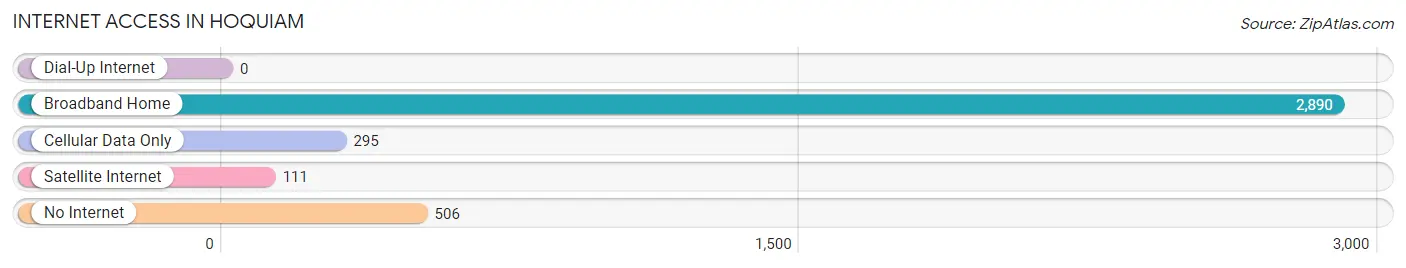
| Internet Type | # Households | % Households |
| Dial-Up Internet | 0 | 0.0% |
| Broadband Home | 2,890 | 77.1% |
| Cellular Data Only | 295 | 7.9% |
| Satellite Internet | 111 | 3.0% |
| No Internet | 506 | 13.5% |
| Total | 3,747 | 100.0% |
Hoquiam Summary
Hoquiam is a city located in Grays Harbor County, Washington, United States. It is the largest city in the county, with a population of 8,726 as of the 2010 census. The city is located on the north bank of the Hoquiam River, near the mouth of the Chehalis River. It is the county seat of Grays Harbor County.
History
Hoquiam was founded in 1858 by Captain William F. Tolmie, a Scottish-born physician and fur trader. The city was named after the Chehalis Indian word for "hungry for wood," referring to the abundance of trees in the area. The city was incorporated in 1890 and was the first incorporated city in Grays Harbor County.
In the late 19th century, Hoquiam was a major lumber port, with several sawmills located along the Hoquiam River. The city was also home to a number of canneries, which processed salmon and other fish caught in the nearby waters.
In the early 20th century, Hoquiam was a major center for shipbuilding, with several shipyards located along the Hoquiam River. The city was also home to a number of other industries, including a paper mill, a brickyard, and a tannery.
Geography
Hoquiam is located at 46°58'N 123°50'W (46.967, -123.833). It is situated on the north bank of the Hoquiam River, near the mouth of the Chehalis River. The city is located in the Olympic Rainforest, and is surrounded by dense forests of Douglas fir, western hemlock, and western red cedar.
The city has a total area of 5.3 square miles, of which 5.2 square miles is land and 0.1 square miles is water.
Economy
Hoquiam's economy is largely based on the timber industry. The city is home to several sawmills and lumber mills, as well as a paper mill. The city is also home to a number of other industries, including a shipyard, a brickyard, and a tannery.
The city is also home to a number of retail stores, restaurants, and other businesses. The city is served by the Port of Grays Harbor, which is located just south of the city.
Demographics
As of the 2010 census, there were 8,726 people, 3,541 households, and 2,092 families residing in the city. The population density was 1,664.7 people per square mile. The racial makeup of the city was 87.2% White, 0.7% African American, 2.2% Native American, 0.9% Asian, 0.1% Pacific Islander, 5.3% from other races, and 3.6% from two or more races. Hispanic or Latino of any race were 10.2% of the population.
The median income for a household in the city was $33,958, and the median income for a family was $41,944. The per capita income for the city was $17,845. About 16.2% of families and 19.7% of the population were below the poverty line, including 28.2% of those under age 18 and 10.2% of those age 65 or over.
Common Questions
What is Per Capita Income in Hoquiam?
Per Capita income in Hoquiam is $31,024.
What is the Median Family Income in Hoquiam?
Median Family Income in Hoquiam is $63,013.
What is the Median Household income in Hoquiam?
Median Household Income in Hoquiam is $47,614.
What is Income or Wage Gap in Hoquiam?
Income or Wage Gap in Hoquiam is 18.7%.
Women in Hoquiam earn 81.3 cents for every dollar earned by a man.
What is Inequality or Gini Index in Hoquiam?
Inequality or Gini Index in Hoquiam is 0.48.
What is the Total Population of Hoquiam?
Total Population of Hoquiam is 8,742.
What is the Total Male Population of Hoquiam?
Total Male Population of Hoquiam is 4,433.
What is the Total Female Population of Hoquiam?
Total Female Population of Hoquiam is 4,309.
What is the Ratio of Males per 100 Females in Hoquiam?
There are 102.88 Males per 100 Females in Hoquiam.
What is the Ratio of Females per 100 Males in Hoquiam?
There are 97.20 Females per 100 Males in Hoquiam.
What is the Median Population Age in Hoquiam?
Median Population Age in Hoquiam is 41.4 Years.
What is the Average Family Size in Hoquiam
Average Family Size in Hoquiam is 3.0 People.
What is the Average Household Size in Hoquiam
Average Household Size in Hoquiam is 2.3 People.
How Large is the Labor Force in Hoquiam?
There are 3,854 People in the Labor Forcein in Hoquiam.
What is the Percentage of People in the Labor Force in Hoquiam?
53.7% of People are in the Labor Force in Hoquiam.
What is the Unemployment Rate in Hoquiam?
Unemployment Rate in Hoquiam is 10.0%.