Birch Bay, WA Map & Demographics
Birch Bay Map
Birch Bay Overview
$41,895
PER CAPITA INCOME
$86,183
AVG FAMILY INCOME
$78,172
AVG HOUSEHOLD INCOME
34.3%
WAGE / INCOME GAP [ % ]
65.7¢/ $1
WAGE / INCOME GAP [ $ ]
$8,316
FAMILY INCOME DEFICIT
0.43
INEQUALITY / GINI INDEX
11,142
TOTAL POPULATION
6,000
MALE POPULATION
5,142
FEMALE POPULATION
116.69
MALES / 100 FEMALES
85.70
FEMALES / 100 MALES
44.9
MEDIAN AGE
2.9
AVG FAMILY SIZE
2.3
AVG HOUSEHOLD SIZE
4,778
LABOR FORCE [ PEOPLE ]
52.0%
PERCENT IN LABOR FORCE
5.3%
UNEMPLOYMENT RATE
Income in Birch Bay
Income Overview in Birch Bay
Per Capita Income in Birch Bay is $41,895, while median incomes of families and households are $86,183 and $78,172 respectively.
| Characteristic | Number | Measure |
| Per Capita Income | 11,142 | $41,895 |
| Median Family Income | 3,072 | $86,183 |
| Mean Family Income | 3,072 | $104,271 |
| Median Household Income | 4,846 | $78,172 |
| Mean Household Income | 4,846 | $92,379 |
| Income Deficit | 3,072 | $8,316 |
| Wage / Income Gap (%) | 11,142 | 34.33% |
| Wage / Income Gap ($) | 11,142 | 65.67¢ per $1 |
| Gini / Inequality Index | 11,142 | 0.43 |
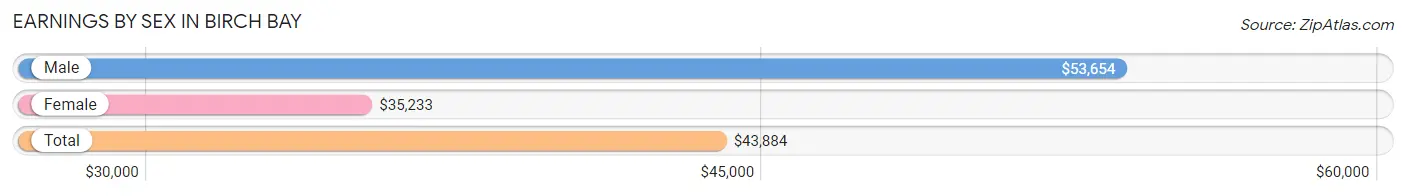
Earnings by Sex in Birch Bay
Average Earnings in Birch Bay are $43,884, $53,654 for men and $35,233 for women, a difference of 34.3%.
| Sex | Number | Average Earnings |
| Male | 3,092 (58.4%) | $53,654 |
| Female | 2,207 (41.6%) | $35,233 |
| Total | 5,299 (100.0%) | $43,884 |
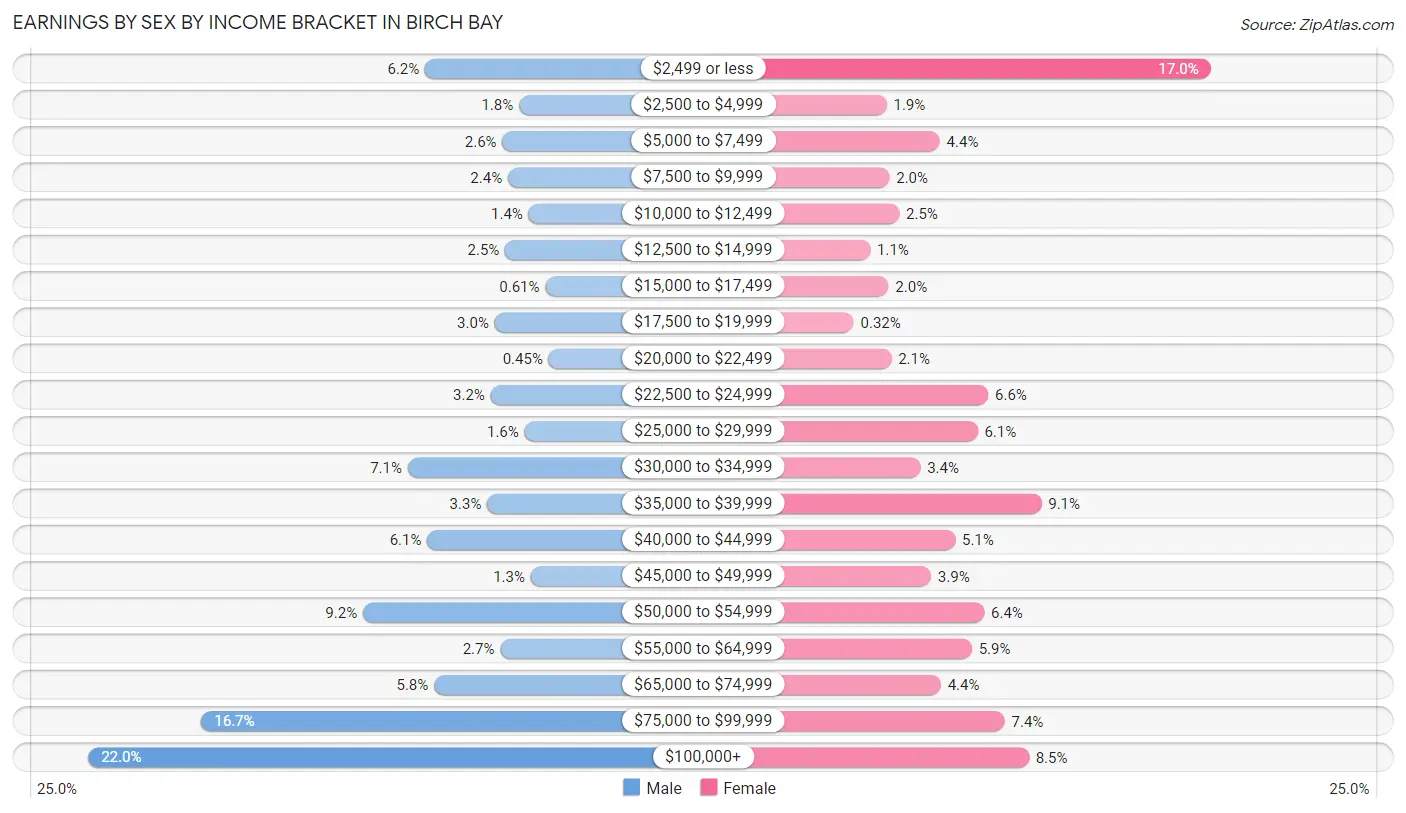
Earnings by Sex by Income Bracket in Birch Bay
The most common earnings brackets in Birch Bay are $100,000+ for men (681 | 22.0%) and $2,499 or less for women (376 | 17.0%).
| Income | Male | Female |
| $2,499 or less | 193 (6.2%) | 376 (17.0%) |
| $2,500 to $4,999 | 57 (1.8%) | 41 (1.9%) |
| $5,000 to $7,499 | 81 (2.6%) | 96 (4.3%) |
| $7,500 to $9,999 | 73 (2.4%) | 44 (2.0%) |
| $10,000 to $12,499 | 43 (1.4%) | 54 (2.5%) |
| $12,500 to $14,999 | 77 (2.5%) | 24 (1.1%) |
| $15,000 to $17,499 | 19 (0.6%) | 43 (1.9%) |
| $17,500 to $19,999 | 92 (3.0%) | 7 (0.3%) |
| $20,000 to $22,499 | 14 (0.4%) | 46 (2.1%) |
| $22,500 to $24,999 | 98 (3.2%) | 146 (6.6%) |
| $25,000 to $29,999 | 49 (1.6%) | 135 (6.1%) |
| $30,000 to $34,999 | 218 (7.0%) | 76 (3.4%) |
| $35,000 to $39,999 | 103 (3.3%) | 201 (9.1%) |
| $40,000 to $44,999 | 190 (6.1%) | 112 (5.1%) |
| $45,000 to $49,999 | 40 (1.3%) | 87 (3.9%) |
| $50,000 to $54,999 | 283 (9.1%) | 142 (6.4%) |
| $55,000 to $64,999 | 84 (2.7%) | 129 (5.9%) |
| $65,000 to $74,999 | 180 (5.8%) | 97 (4.4%) |
| $75,000 to $99,999 | 517 (16.7%) | 163 (7.4%) |
| $100,000+ | 681 (22.0%) | 188 (8.5%) |
| Total | 3,092 (100.0%) | 2,207 (100.0%) |
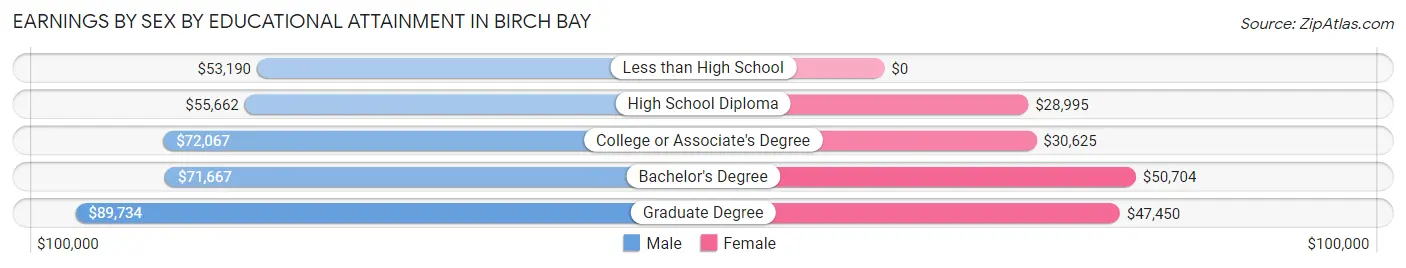
Earnings by Sex by Educational Attainment in Birch Bay
Average earnings in Birch Bay are $68,598 for men and $36,814 for women, a difference of 46.3%. Men with an educational attainment of graduate degree enjoy the highest average annual earnings of $89,734, while those with less than high school education earn the least with $53,190. Women with an educational attainment of bachelor's degree earn the most with the average annual earnings of $50,704, while those with high school diploma education have the smallest earnings of $28,995.
| Educational Attainment | Male Income | Female Income |
| Less than High School | $53,190 | $0 |
| High School Diploma | $55,662 | $28,995 |
| College or Associate's Degree | $72,067 | $30,625 |
| Bachelor's Degree | $71,667 | $50,704 |
| Graduate Degree | $89,734 | $47,450 |
| Total | $68,598 | $36,814 |
Family Income in Birch Bay
Family Income Brackets in Birch Bay
According to the Birch Bay family income data, there are 743 families falling into the $75,000 to $99,999 income range, which is the most common income bracket and makes up 24.2% of all families. Conversely, the $10,000 to $14,999 income bracket is the least frequent group with only 49 families (1.6%) belonging to this category.
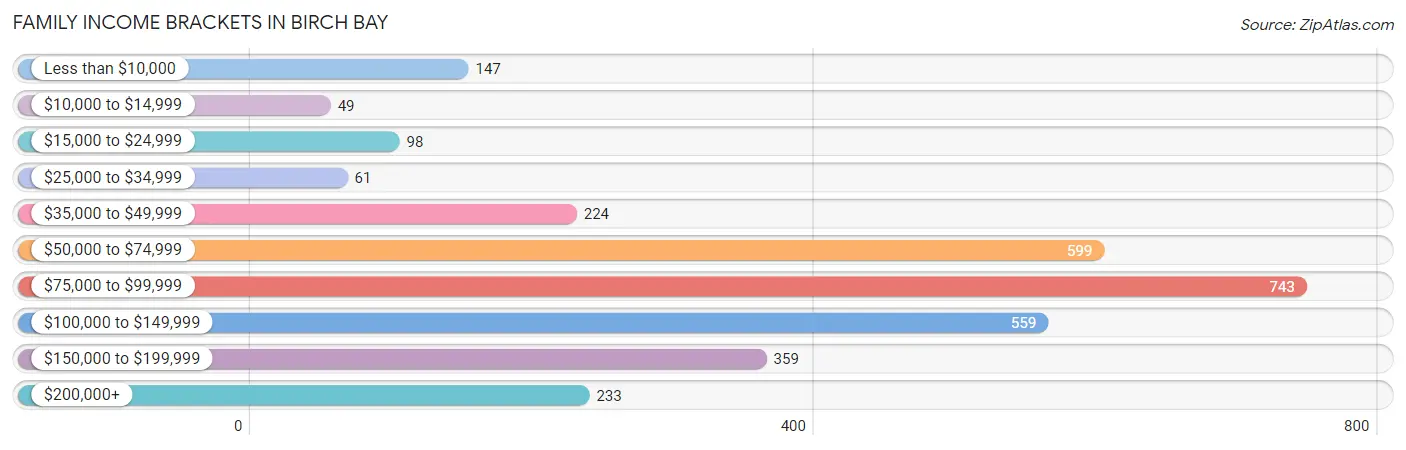
| Income Bracket | # Families | % Families |
| Less than $10,000 | 147 | 4.8% |
| $10,000 to $14,999 | 49 | 1.6% |
| $15,000 to $24,999 | 98 | 3.2% |
| $25,000 to $34,999 | 61 | 2.0% |
| $35,000 to $49,999 | 224 | 7.3% |
| $50,000 to $74,999 | 599 | 19.5% |
| $75,000 to $99,999 | 743 | 24.2% |
| $100,000 to $149,999 | 559 | 18.2% |
| $150,000 to $199,999 | 359 | 11.7% |
| $200,000+ | 233 | 7.6% |
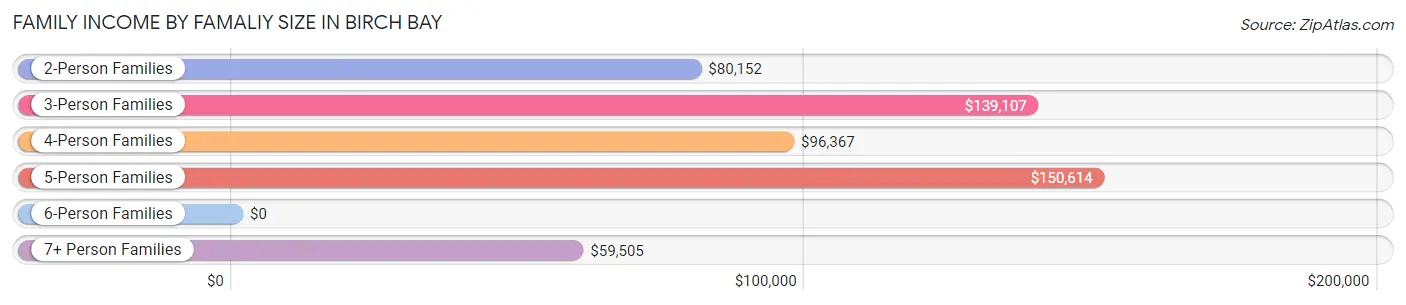
Family Income by Famaliy Size in Birch Bay
5-person families (210 | 6.8%) account for the highest median family income in Birch Bay with $150,614 per family, while 3-person families (283 | 9.2%) have the highest median income of $46,369 per family member.
| Income Bracket | # Families | Median Income |
| 2-Person Families | 1,962 (63.9%) | $80,152 |
| 3-Person Families | 283 (9.2%) | $139,107 |
| 4-Person Families | 473 (15.4%) | $96,367 |
| 5-Person Families | 210 (6.8%) | $150,614 |
| 6-Person Families | 59 (1.9%) | $0 |
| 7+ Person Families | 85 (2.8%) | $59,505 |
| Total | 3,072 (100.0%) | $86,183 |
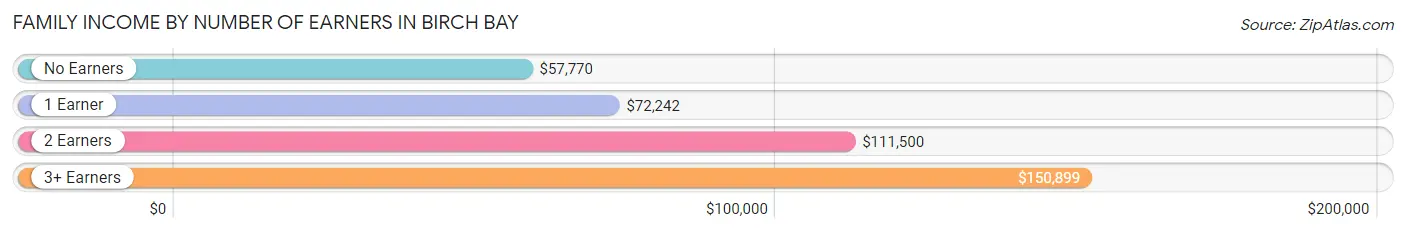
Family Income by Number of Earners in Birch Bay
The median family income in Birch Bay is $86,183, with families comprising 3+ earners (191) having the highest median family income of $150,899, while families with no earners (650) have the lowest median family income of $57,770, accounting for 6.2% and 21.2% of families, respectively.
| Number of Earners | # Families | Median Income |
| No Earners | 650 (21.2%) | $57,770 |
| 1 Earner | 1,077 (35.1%) | $72,242 |
| 2 Earners | 1,154 (37.6%) | $111,500 |
| 3+ Earners | 191 (6.2%) | $150,899 |
| Total | 3,072 (100.0%) | $86,183 |
Household Income in Birch Bay
Household Income Brackets in Birch Bay
With 863 households falling in the category, the $100,000 to $149,999 income range is the most frequent in Birch Bay, accounting for 17.8% of all households. In contrast, only 194 households (4.0%) fall into the $25,000 to $34,999 income bracket, making it the least populous group.
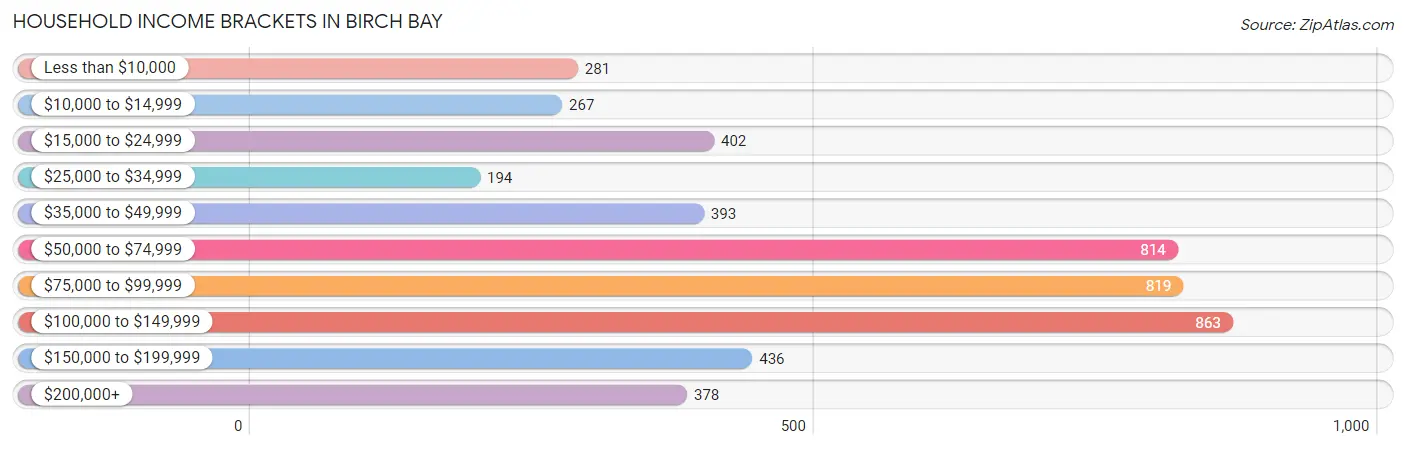
| Income Bracket | # Households | % Households |
| Less than $10,000 | 281 | 5.8% |
| $10,000 to $14,999 | 267 | 5.5% |
| $15,000 to $24,999 | 402 | 8.3% |
| $25,000 to $34,999 | 194 | 4.0% |
| $35,000 to $49,999 | 393 | 8.1% |
| $50,000 to $74,999 | 814 | 16.8% |
| $75,000 to $99,999 | 819 | 16.9% |
| $100,000 to $149,999 | 863 | 17.8% |
| $150,000 to $199,999 | 436 | 9.0% |
| $200,000+ | 378 | 7.8% |
Household Income by Householder Age in Birch Bay
The median household income in Birch Bay is $78,172, with the highest median household income of $97,476 found in the 25 to 44 years age bracket for the primary householder. A total of 1,173 households (24.2%) fall into this category. Meanwhile, the 15 to 24 years age bracket for the primary householder has the lowest median household income of $0, with 127 households (2.6%) in this group.
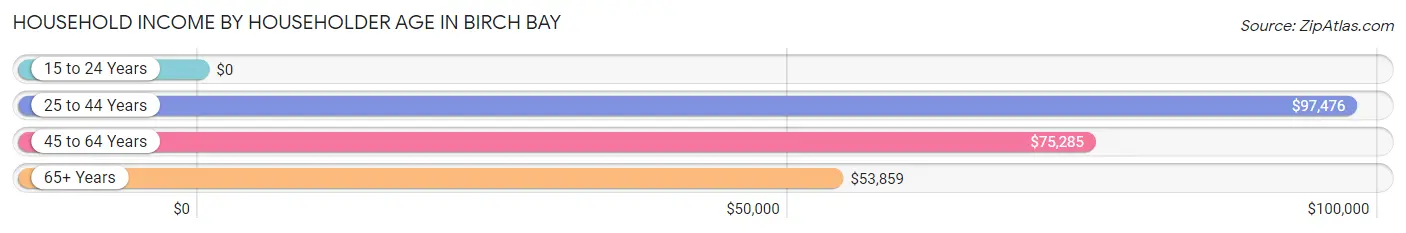
| Income Bracket | # Households | Median Income |
| 15 to 24 Years | 127 (2.6%) | $0 |
| 25 to 44 Years | 1,173 (24.2%) | $97,476 |
| 45 to 64 Years | 1,631 (33.7%) | $75,285 |
| 65+ Years | 1,915 (39.5%) | $53,859 |
| Total | 4,846 (100.0%) | $78,172 |
Poverty in Birch Bay
Income Below Poverty by Sex and Age in Birch Bay
With 10.8% poverty level for males and 9.5% for females among the residents of Birch Bay, 15 year old males and 16 and 17 year old females are the most vulnerable to poverty, with 15 males (28.3%) and 34 females (40.0%) in their respective age groups living below the poverty level.
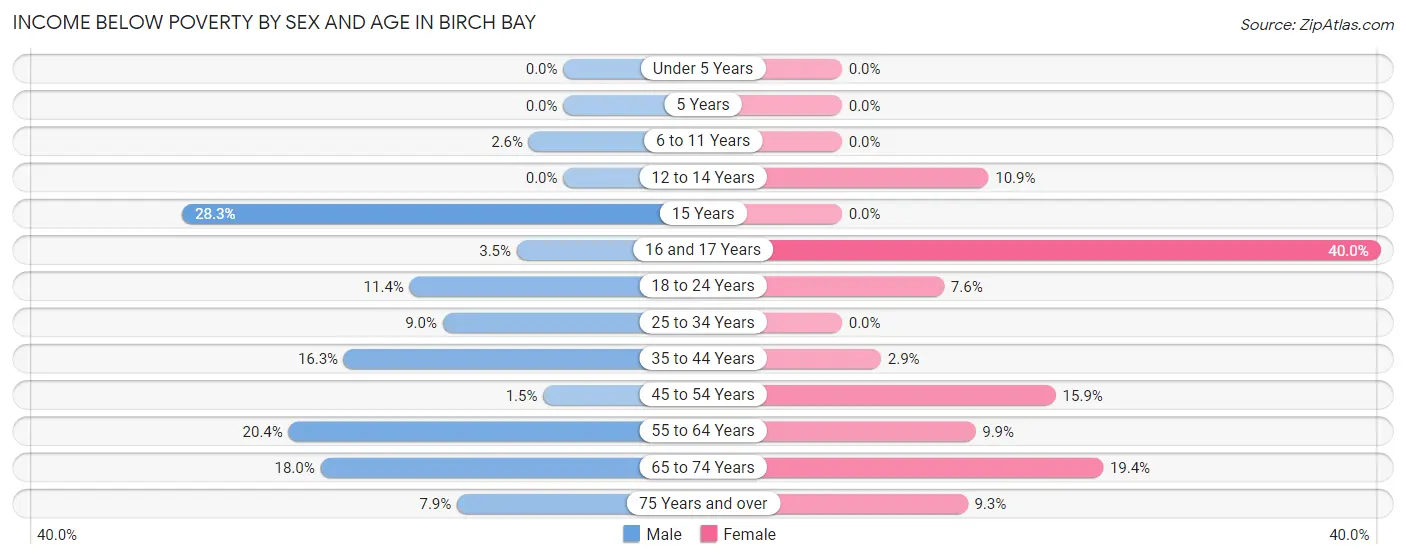
| Age Bracket | Male | Female |
| Under 5 Years | 0 (0.0%) | 0 (0.0%) |
| 5 Years | 0 (0.0%) | 0 (0.0%) |
| 6 to 11 Years | 11 (2.6%) | 0 (0.0%) |
| 12 to 14 Years | 0 (0.0%) | 16 (10.9%) |
| 15 Years | 15 (28.3%) | 0 (0.0%) |
| 16 and 17 Years | 5 (3.5%) | 34 (40.0%) |
| 18 to 24 Years | 59 (11.4%) | 30 (7.6%) |
| 25 to 34 Years | 69 (8.9%) | 0 (0.0%) |
| 35 to 44 Years | 115 (16.3%) | 17 (2.9%) |
| 45 to 54 Years | 9 (1.5%) | 94 (15.9%) |
| 55 to 64 Years | 185 (20.4%) | 75 (9.9%) |
| 65 to 74 Years | 134 (18.0%) | 178 (19.4%) |
| 75 Years and over | 45 (7.9%) | 43 (9.3%) |
| Total | 647 (10.8%) | 487 (9.5%) |
Income Above Poverty by Sex and Age in Birch Bay
According to the poverty statistics in Birch Bay, males aged under 5 years and females aged under 5 years are the age groups that are most secure financially, with 100.0% of males and 100.0% of females in these age groups living above the poverty line.
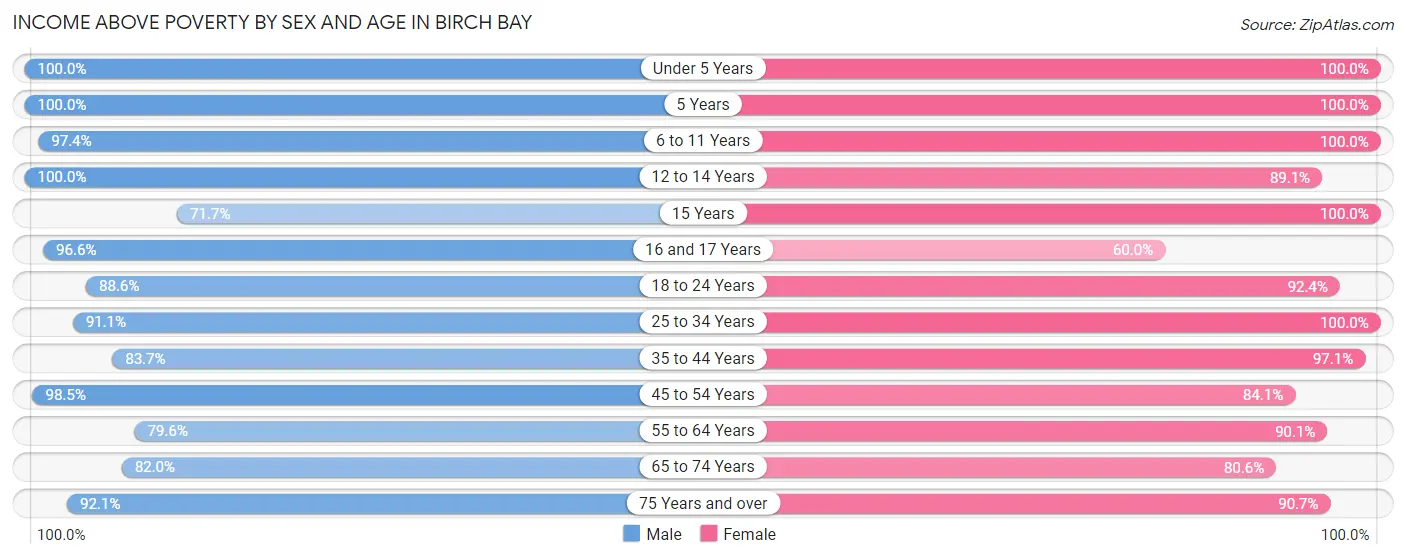
| Age Bracket | Male | Female |
| Under 5 Years | 178 (100.0%) | 442 (100.0%) |
| 5 Years | 87 (100.0%) | 50 (100.0%) |
| 6 to 11 Years | 418 (97.4%) | 266 (100.0%) |
| 12 to 14 Years | 288 (100.0%) | 131 (89.1%) |
| 15 Years | 38 (71.7%) | 14 (100.0%) |
| 16 and 17 Years | 140 (96.6%) | 51 (60.0%) |
| 18 to 24 Years | 458 (88.6%) | 366 (92.4%) |
| 25 to 34 Years | 702 (91.0%) | 427 (100.0%) |
| 35 to 44 Years | 591 (83.7%) | 570 (97.1%) |
| 45 to 54 Years | 596 (98.5%) | 498 (84.1%) |
| 55 to 64 Years | 722 (79.6%) | 682 (90.1%) |
| 65 to 74 Years | 609 (82.0%) | 740 (80.6%) |
| 75 Years and over | 525 (92.1%) | 418 (90.7%) |
| Total | 5,352 (89.2%) | 4,655 (90.5%) |
Income Below Poverty Among Married-Couple Families in Birch Bay
The poverty statistics for married-couple families in Birch Bay show that 5.7% or 143 of the total 2,507 families live below the poverty line. Families with no children have the highest poverty rate of 7.8%, comprising of 130 families. On the other hand, families with 3 or 4 children have the lowest poverty rate of 0.0%, which includes 0 families.
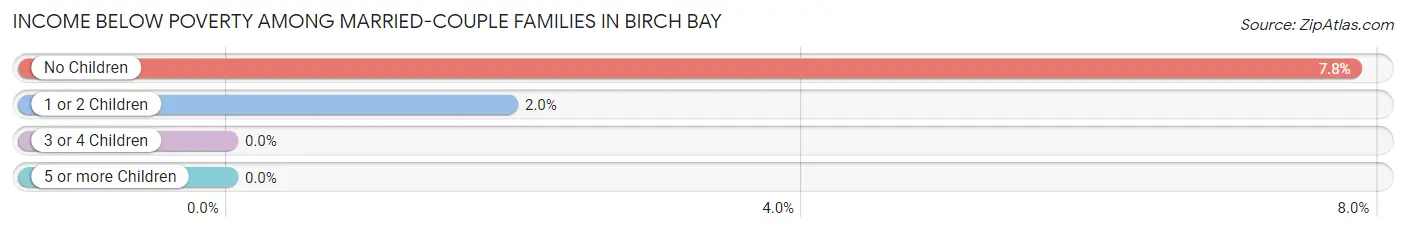
| Children | Above Poverty | Below Poverty |
| No Children | 1,531 (92.2%) | 130 (7.8%) |
| 1 or 2 Children | 652 (98.1%) | 13 (1.9%) |
| 3 or 4 Children | 163 (100.0%) | 0 (0.0%) |
| 5 or more Children | 18 (100.0%) | 0 (0.0%) |
| Total | 2,364 (94.3%) | 143 (5.7%) |
Income Below Poverty Among Single-Parent Households in Birch Bay
According to the poverty data in Birch Bay, 12.3% or 33 single-father households and 27.3% or 81 single-mother households are living below the poverty line. Among single-father households, those with no children have the highest poverty rate, with 23 households (25.8%) experiencing poverty. Likewise, among single-mother households, those with 1 or 2 children have the highest poverty rate, with 56 households (70.0%) falling below the poverty line.
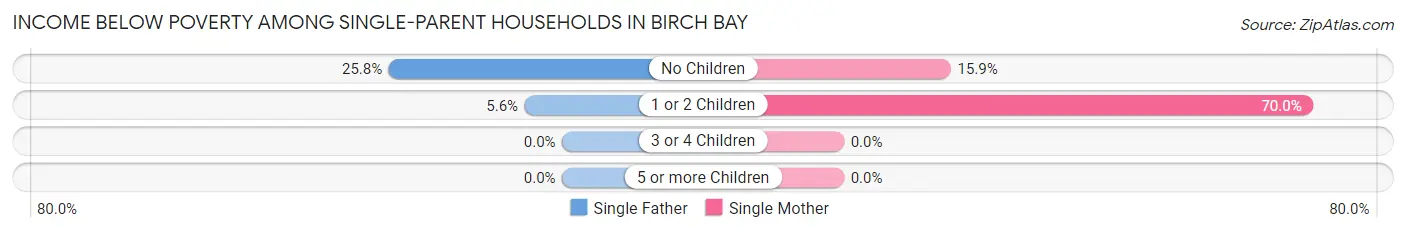
| Children | Single Father | Single Mother |
| No Children | 23 (25.8%) | 25 (15.9%) |
| 1 or 2 Children | 10 (5.6%) | 56 (70.0%) |
| 3 or 4 Children | 0 (0.0%) | 0 (0.0%) |
| 5 or more Children | 0 (0.0%) | 0 (0.0%) |
| Total | 33 (12.3%) | 81 (27.3%) |
Income Below Poverty Among Married-Couple vs Single-Parent Households in Birch Bay
The poverty data for Birch Bay shows that 143 of the married-couple family households (5.7%) and 114 of the single-parent households (20.2%) are living below the poverty level. Within the married-couple family households, those with no children have the highest poverty rate, with 130 households (7.8%) falling below the poverty line. Among the single-parent households, those with 1 or 2 children have the highest poverty rate, with 66 household (25.5%) living below poverty.
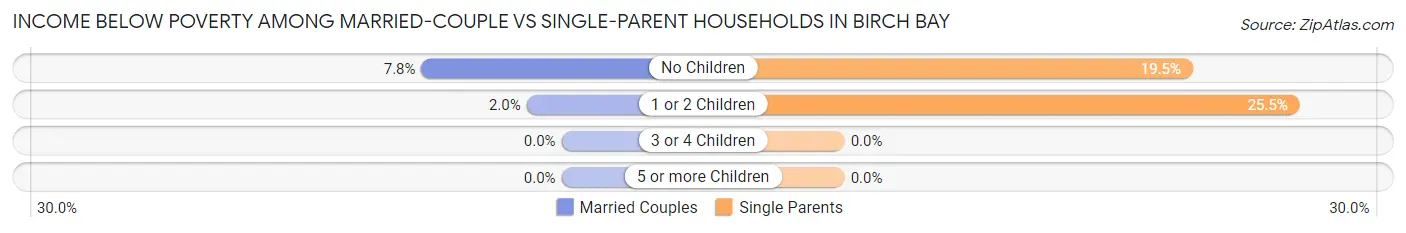
| Children | Married-Couple Families | Single-Parent Households |
| No Children | 130 (7.8%) | 48 (19.5%) |
| 1 or 2 Children | 13 (1.9%) | 66 (25.5%) |
| 3 or 4 Children | 0 (0.0%) | 0 (0.0%) |
| 5 or more Children | 0 (0.0%) | 0 (0.0%) |
| Total | 143 (5.7%) | 114 (20.2%) |
Race in Birch Bay
The most populous races in Birch Bay are White / Caucasian (9,000 | 80.8%), Two or more Races (1,332 | 11.9%), and Hispanic or Latino (877 | 7.9%).
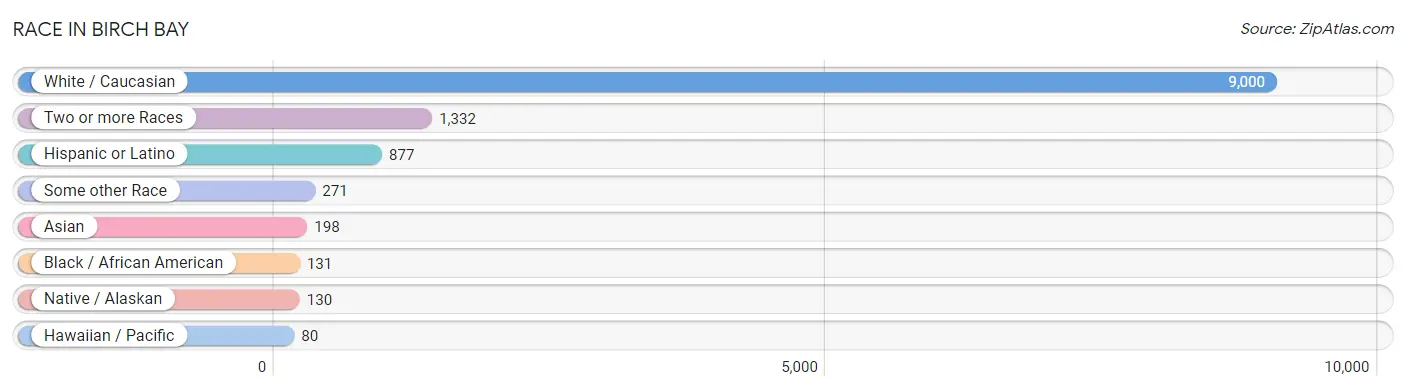
| Race | # Population | % Population |
| Asian | 198 | 1.8% |
| Black / African American | 131 | 1.2% |
| Hawaiian / Pacific | 80 | 0.7% |
| Hispanic or Latino | 877 | 7.9% |
| Native / Alaskan | 130 | 1.2% |
| White / Caucasian | 9,000 | 80.8% |
| Two or more Races | 1,332 | 11.9% |
| Some other Race | 271 | 2.4% |
| Total | 11,142 | 100.0% |
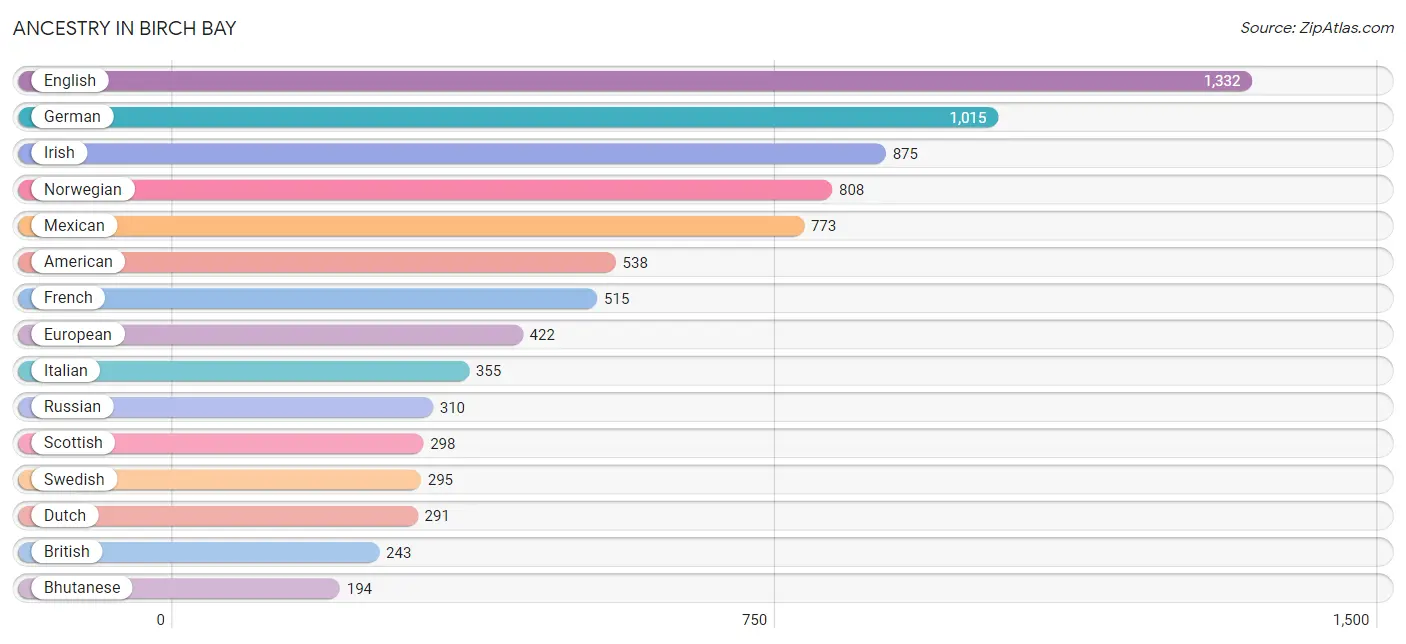
Ancestry in Birch Bay
The most populous ancestries reported in Birch Bay are English (1,332 | 11.9%), German (1,015 | 9.1%), Irish (875 | 7.9%), Norwegian (808 | 7.2%), and Mexican (773 | 6.9%), together accounting for 43.1% of all Birch Bay residents.
| Ancestry | # Population | % Population |
| Aleut | 17 | 0.2% |
| American | 538 | 4.8% |
| Austrian | 17 | 0.2% |
| Bhutanese | 194 | 1.7% |
| Bolivian | 19 | 0.2% |
| British | 243 | 2.2% |
| Bulgarian | 11 | 0.1% |
| Burmese | 72 | 0.6% |
| Canadian | 177 | 1.6% |
| Central American | 32 | 0.3% |
| Cherokee | 18 | 0.2% |
| Czech | 50 | 0.4% |
| Czechoslovakian | 5 | 0.0% |
| Danish | 80 | 0.7% |
| Dutch | 291 | 2.6% |
| Eastern European | 20 | 0.2% |
| English | 1,332 | 11.9% |
| European | 422 | 3.8% |
| Filipino | 40 | 0.4% |
| Finnish | 44 | 0.4% |
| French | 515 | 4.6% |
| French American Indian | 13 | 0.1% |
| French Canadian | 154 | 1.4% |
| German | 1,015 | 9.1% |
| German Russian | 30 | 0.3% |
| Greek | 38 | 0.3% |
| Guamanian / Chamorro | 7 | 0.1% |
| Icelander | 31 | 0.3% |
| Indian (Asian) | 20 | 0.2% |
| Iranian | 10 | 0.1% |
| Irish | 875 | 7.9% |
| Iroquois | 30 | 0.3% |
| Israeli | 14 | 0.1% |
| Italian | 355 | 3.2% |
| Japanese | 15 | 0.1% |
| Korean | 103 | 0.9% |
| Malaysian | 71 | 0.6% |
| Mexican | 773 | 6.9% |
| Northern European | 154 | 1.4% |
| Norwegian | 808 | 7.2% |
| Pakistani | 25 | 0.2% |
| Pennsylvania German | 47 | 0.4% |
| Polish | 59 | 0.5% |
| Portuguese | 32 | 0.3% |
| Puget Sound Salish | 6 | 0.1% |
| Romanian | 29 | 0.3% |
| Russian | 310 | 2.8% |
| Salvadoran | 32 | 0.3% |
| Scandinavian | 99 | 0.9% |
| Scotch-Irish | 113 | 1.0% |
| Scottish | 298 | 2.7% |
| Slavic | 10 | 0.1% |
| South American | 19 | 0.2% |
| Spaniard | 43 | 0.4% |
| Spanish | 10 | 0.1% |
| Sri Lankan | 13 | 0.1% |
| Subsaharan African | 38 | 0.3% |
| Swedish | 295 | 2.6% |
| Swiss | 24 | 0.2% |
| Thai | 16 | 0.1% |
| Ukrainian | 11 | 0.1% |
| Welsh | 87 | 0.8% | View All 62 Rows |
Immigrants in Birch Bay
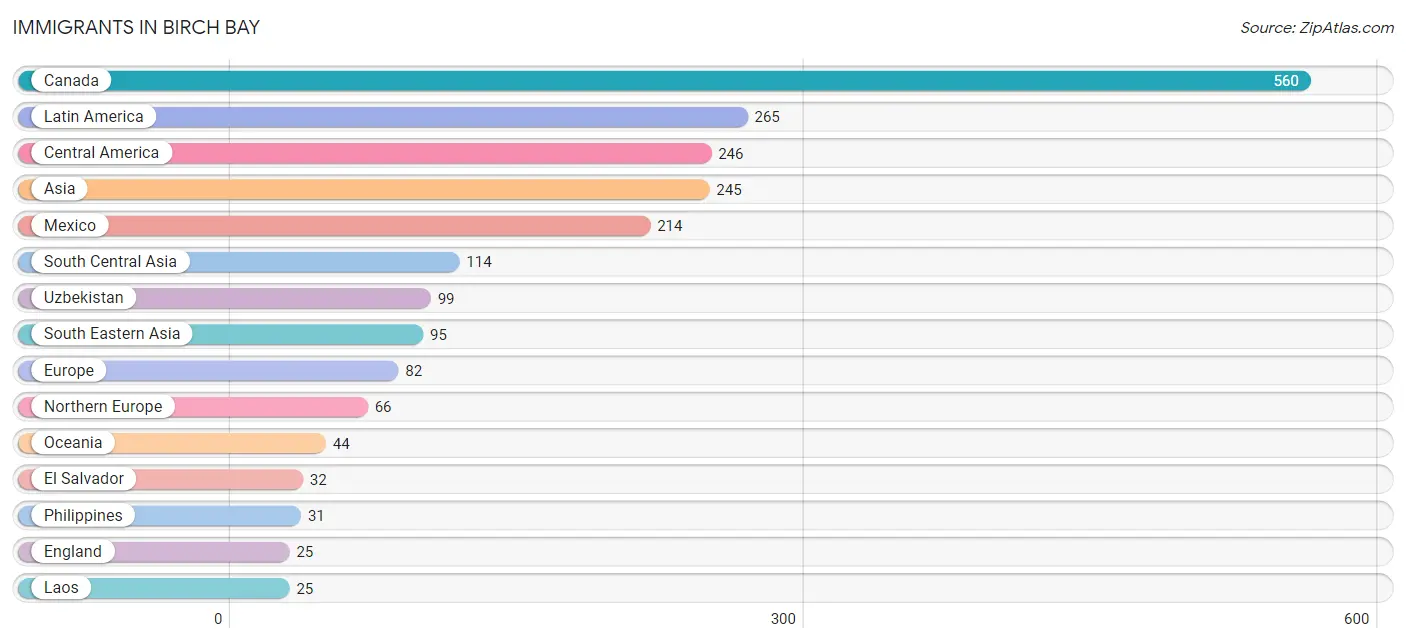
The most numerous immigrant groups reported in Birch Bay came from Canada (560 | 5.0%), Latin America (265 | 2.4%), Central America (246 | 2.2%), Asia (245 | 2.2%), and Mexico (214 | 1.9%), together accounting for 13.7% of all Birch Bay residents.
| Immigration Origin | # Population | % Population |
| Africa | 24 | 0.2% |
| Asia | 245 | 2.2% |
| Bolivia | 19 | 0.2% |
| Canada | 560 | 5.0% |
| Central America | 246 | 2.2% |
| China | 24 | 0.2% |
| Eastern Africa | 11 | 0.1% |
| Eastern Asia | 24 | 0.2% |
| Eastern Europe | 6 | 0.1% |
| Egypt | 13 | 0.1% |
| El Salvador | 32 | 0.3% |
| England | 25 | 0.2% |
| Europe | 82 | 0.7% |
| Greece | 10 | 0.1% |
| India | 5 | 0.0% |
| Iran | 10 | 0.1% |
| Israel | 12 | 0.1% |
| Kenya | 11 | 0.1% |
| Laos | 25 | 0.2% |
| Latin America | 265 | 2.4% |
| Mexico | 214 | 1.9% |
| Northern Africa | 13 | 0.1% |
| Northern Europe | 66 | 0.6% |
| Oceania | 44 | 0.4% |
| Philippines | 31 | 0.3% |
| Russia | 6 | 0.1% |
| South America | 19 | 0.2% |
| South Central Asia | 114 | 1.0% |
| South Eastern Asia | 95 | 0.9% |
| Southern Europe | 10 | 0.1% |
| Taiwan | 24 | 0.2% |
| Thailand | 14 | 0.1% |
| Uzbekistan | 99 | 0.9% |
| Vietnam | 25 | 0.2% |
| Western Asia | 12 | 0.1% | View All 35 Rows |
Sex and Age in Birch Bay
Sex and Age in Birch Bay
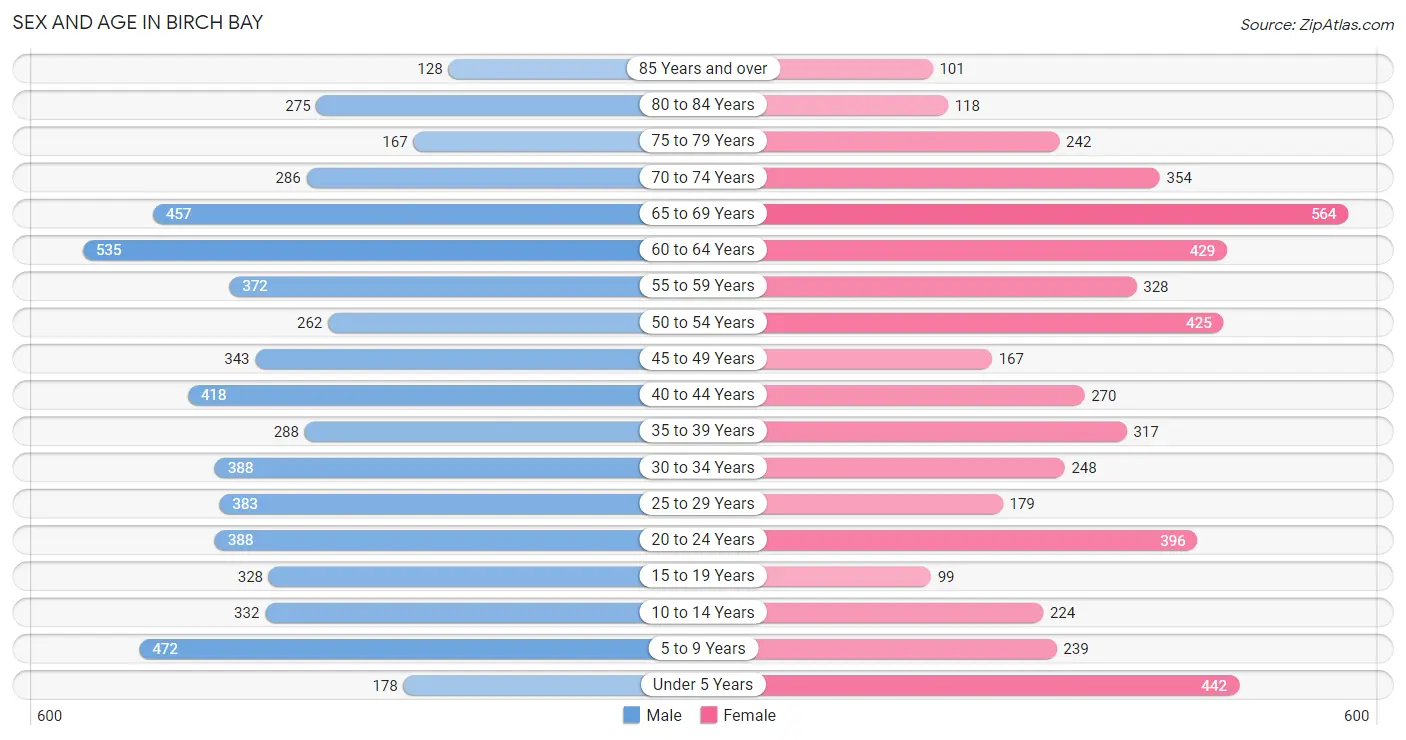
The most populous age groups in Birch Bay are 60 to 64 Years (535 | 8.9%) for men and 65 to 69 Years (564 | 11.0%) for women.
| Age Bracket | Male | Female |
| Under 5 Years | 178 (3.0%) | 442 (8.6%) |
| 5 to 9 Years | 472 (7.9%) | 239 (4.6%) |
| 10 to 14 Years | 332 (5.5%) | 224 (4.4%) |
| 15 to 19 Years | 328 (5.5%) | 99 (1.9%) |
| 20 to 24 Years | 388 (6.5%) | 396 (7.7%) |
| 25 to 29 Years | 383 (6.4%) | 179 (3.5%) |
| 30 to 34 Years | 388 (6.5%) | 248 (4.8%) |
| 35 to 39 Years | 288 (4.8%) | 317 (6.2%) |
| 40 to 44 Years | 418 (7.0%) | 270 (5.2%) |
| 45 to 49 Years | 343 (5.7%) | 167 (3.3%) |
| 50 to 54 Years | 262 (4.4%) | 425 (8.3%) |
| 55 to 59 Years | 372 (6.2%) | 328 (6.4%) |
| 60 to 64 Years | 535 (8.9%) | 429 (8.3%) |
| 65 to 69 Years | 457 (7.6%) | 564 (11.0%) |
| 70 to 74 Years | 286 (4.8%) | 354 (6.9%) |
| 75 to 79 Years | 167 (2.8%) | 242 (4.7%) |
| 80 to 84 Years | 275 (4.6%) | 118 (2.3%) |
| 85 Years and over | 128 (2.1%) | 101 (2.0%) |
| Total | 6,000 (100.0%) | 5,142 (100.0%) |
Families and Households in Birch Bay
Median Family Size in Birch Bay
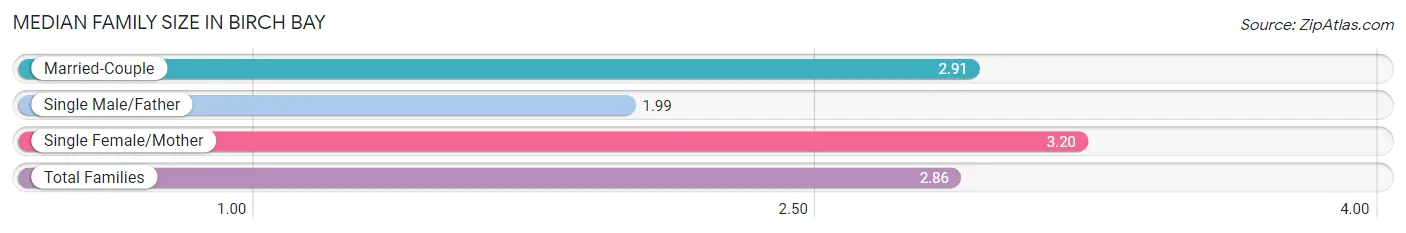
The median family size in Birch Bay is 2.86 persons per family, with single female/mother families (297 | 9.7%) accounting for the largest median family size of 3.2 persons per family. On the other hand, single male/father families (268 | 8.7%) represent the smallest median family size with 1.99 persons per family.
| Family Type | # Families | Family Size |
| Married-Couple | 2,507 (81.6%) | 2.91 |
| Single Male/Father | 268 (8.7%) | 1.99 |
| Single Female/Mother | 297 (9.7%) | 3.20 |
| Total Families | 3,072 (100.0%) | 2.86 |
Median Household Size in Birch Bay
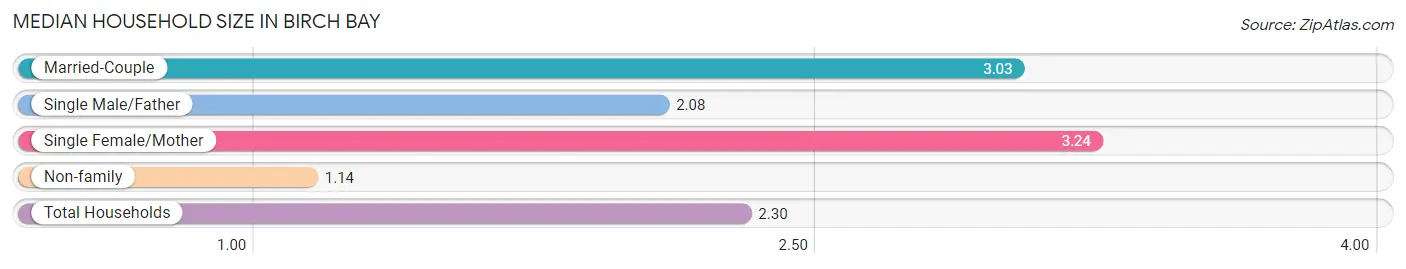
The median household size in Birch Bay is 2.30 persons per household, with single female/mother households (297 | 6.1%) accounting for the largest median household size of 3.24 persons per household. non-family households (1,774 | 36.6%) represent the smallest median household size with 1.14 persons per household.
| Household Type | # Households | Household Size |
| Married-Couple | 2,507 (51.7%) | 3.03 |
| Single Male/Father | 268 (5.5%) | 2.08 |
| Single Female/Mother | 297 (6.1%) | 3.24 |
| Non-family | 1,774 (36.6%) | 1.14 |
| Total Households | 4,846 (100.0%) | 2.30 |
Household Size by Marriage Status in Birch Bay
Out of a total of 4,846 households in Birch Bay, 3,072 (63.4%) are family households, while 1,774 (36.6%) are nonfamily households. The most numerous type of family households are 2-person households, comprising 1,852, and the most common type of nonfamily households are 1-person households, comprising 1,610.
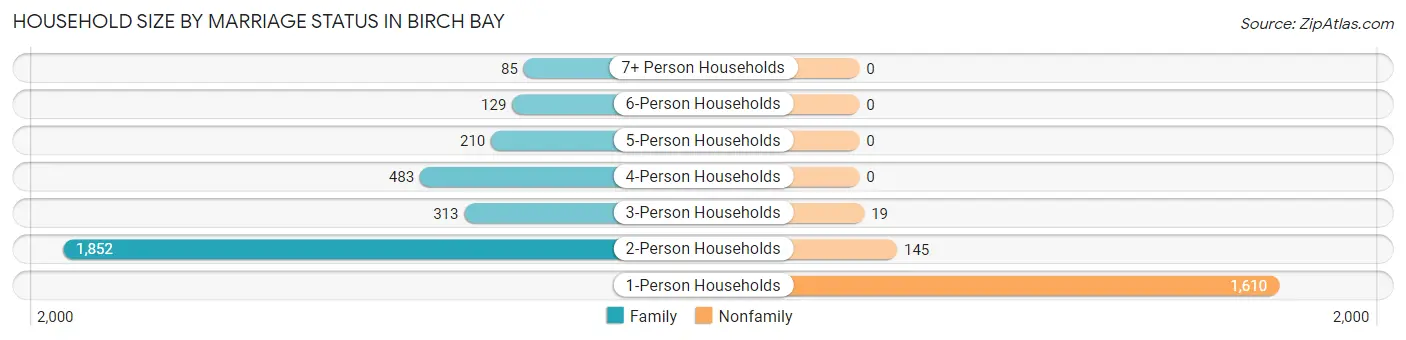
| Household Size | Family Households | Nonfamily Households |
| 1-Person Households | - | 1,610 (33.2%) |
| 2-Person Households | 1,852 (38.2%) | 145 (3.0%) |
| 3-Person Households | 313 (6.5%) | 19 (0.4%) |
| 4-Person Households | 483 (10.0%) | 0 (0.0%) |
| 5-Person Households | 210 (4.3%) | 0 (0.0%) |
| 6-Person Households | 129 (2.7%) | 0 (0.0%) |
| 7+ Person Households | 85 (1.8%) | 0 (0.0%) |
| Total | 3,072 (63.4%) | 1,774 (36.6%) |
Female Fertility in Birch Bay
Fertility by Age in Birch Bay
Average fertility rate in Birch Bay is 115.0 births per 1,000 women. Women in the age bracket of 35 to 50 years have the highest fertility rate with 135.0 births per 1,000 women. Women in the age bracket of 35 to 50 years acount for 58.4% of all women with births.
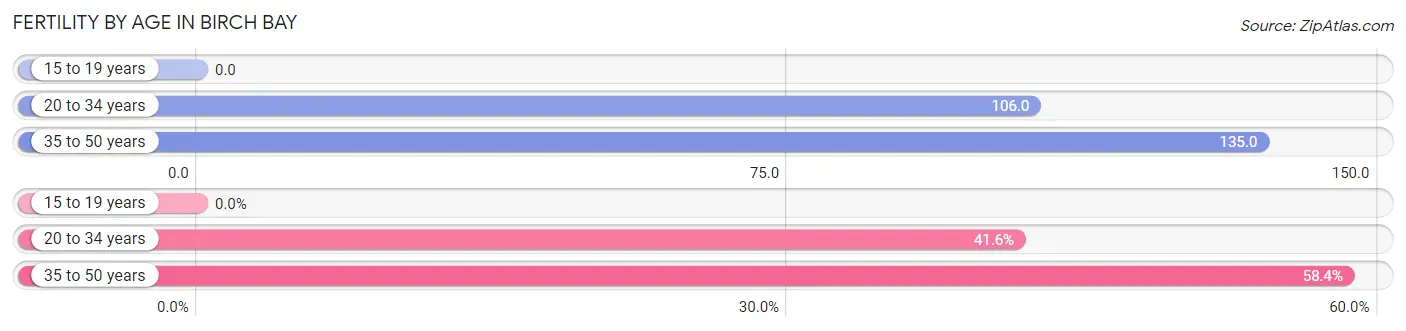
| Age Bracket | Women with Births | Births / 1,000 Women |
| 15 to 19 years | 0 (0.0%) | 0.0 |
| 20 to 34 years | 87 (41.6%) | 106.0 |
| 35 to 50 years | 122 (58.4%) | 135.0 |
| Total | 209 (100.0%) | 115.0 |
Fertility by Age by Marriage Status in Birch Bay
63.6% of women with births (209) in Birch Bay are married. The highest percentage of unmarried women with births falls into 35 to 50 years age bracket with 62.3% of them unmarried at the time of birth, while the lowest percentage of unmarried women with births belong to 20 to 34 years age bracket with 0.0% of them unmarried.
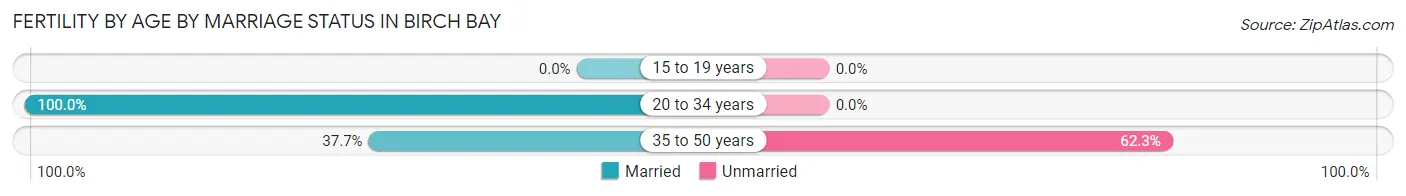
| Age Bracket | Married | Unmarried |
| 15 to 19 years | 0 (0.0%) | 0 (0.0%) |
| 20 to 34 years | 87 (100.0%) | 0 (0.0%) |
| 35 to 50 years | 46 (37.7%) | 76 (62.3%) |
| Total | 133 (63.6%) | 76 (36.4%) |
Fertility by Education in Birch Bay
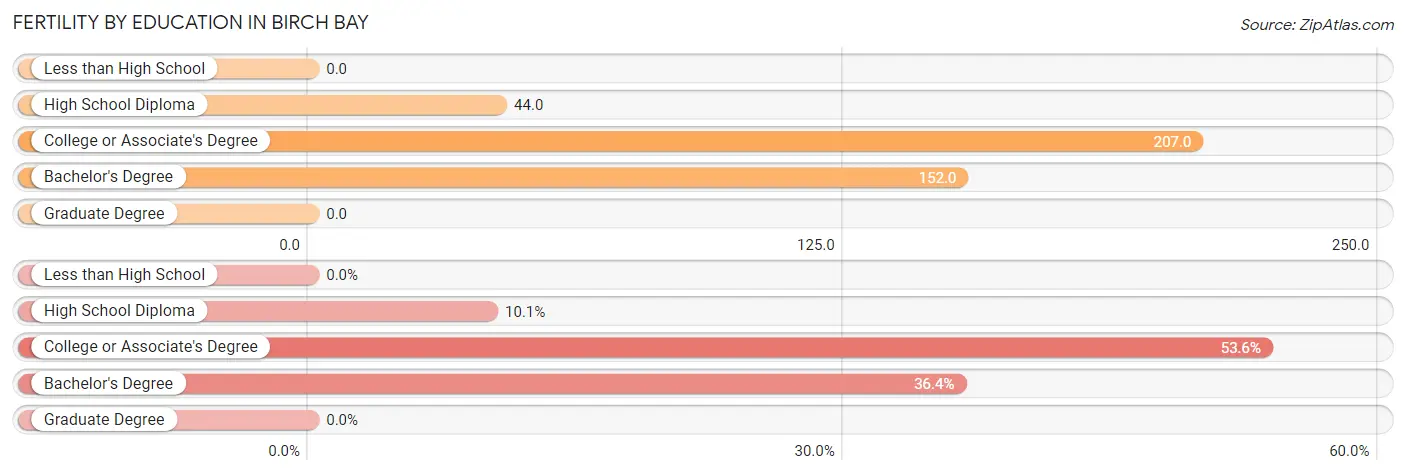
| Educational Attainment | Women with Births | Births / 1,000 Women |
| Less than High School | 0 (0.0%) | 0.0 |
| High School Diploma | 21 (10.1%) | 44.0 |
| College or Associate's Degree | 112 (53.6%) | 207.0 |
| Bachelor's Degree | 76 (36.4%) | 152.0 |
| Graduate Degree | 0 (0.0%) | 0.0 |
| Total | 209 (100.0%) | 115.0 |
Fertility by Education by Marriage Status in Birch Bay
36.4% of women with births in Birch Bay are unmarried. Women with the educational attainment of high school diploma are most likely to be married with 100.0% of them married at childbirth, while women with the educational attainment of bachelor's degree are least likely to be married with 100.0% of them unmarried at childbirth.
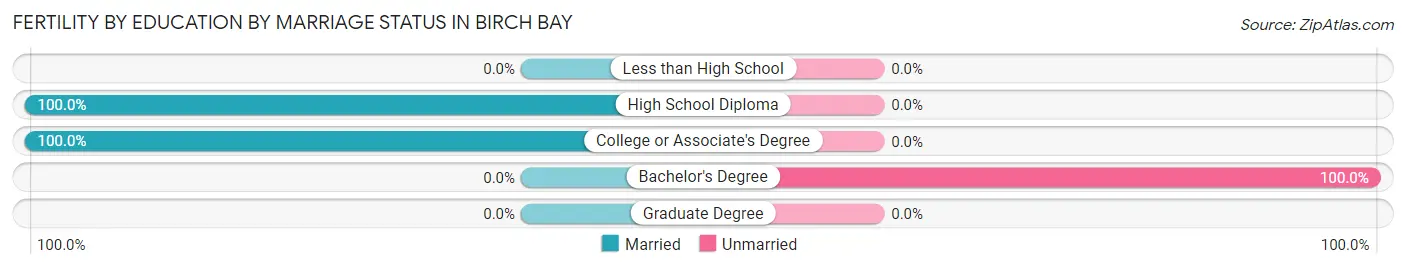
| Educational Attainment | Married | Unmarried |
| Less than High School | 0 (0.0%) | 0 (0.0%) |
| High School Diploma | 21 (100.0%) | 0 (0.0%) |
| College or Associate's Degree | 112 (100.0%) | 0 (0.0%) |
| Bachelor's Degree | 0 (0.0%) | 76 (100.0%) |
| Graduate Degree | 0 (0.0%) | 0 (0.0%) |
| Total | 133 (63.6%) | 76 (36.4%) |
Employment Characteristics in Birch Bay
Employment by Class of Employer in Birch Bay
Among the 4,460 employed individuals in Birch Bay, private company employees (2,660 | 59.6%), self-employed (incorporated) (395 | 8.9%), and local government employees (345 | 7.7%) make up the most common classes of employment.
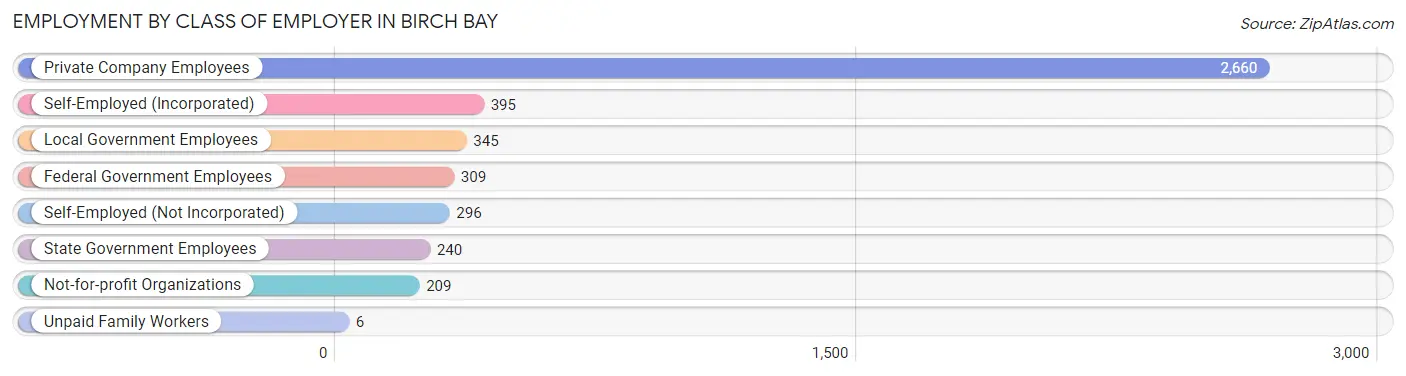
| Employer Class | # Employees | % Employees |
| Private Company Employees | 2,660 | 59.6% |
| Self-Employed (Incorporated) | 395 | 8.9% |
| Self-Employed (Not Incorporated) | 296 | 6.6% |
| Not-for-profit Organizations | 209 | 4.7% |
| Local Government Employees | 345 | 7.7% |
| State Government Employees | 240 | 5.4% |
| Federal Government Employees | 309 | 6.9% |
| Unpaid Family Workers | 6 | 0.1% |
| Total | 4,460 | 100.0% |
Employment Status by Age in Birch Bay
According to the labor force statistics for Birch Bay, out of the total population over 16 years of age (9,188), 52.0% or 4,778 individuals are in the labor force, with 5.3% or 253 of them unemployed. The age group with the highest labor force participation rate is 45 to 54 years, with 85.2% or 1,020 individuals in the labor force. Within the labor force, the 65 to 74 years age range has the highest percentage of unemployed individuals, with 19.5% or 51 of them being unemployed.
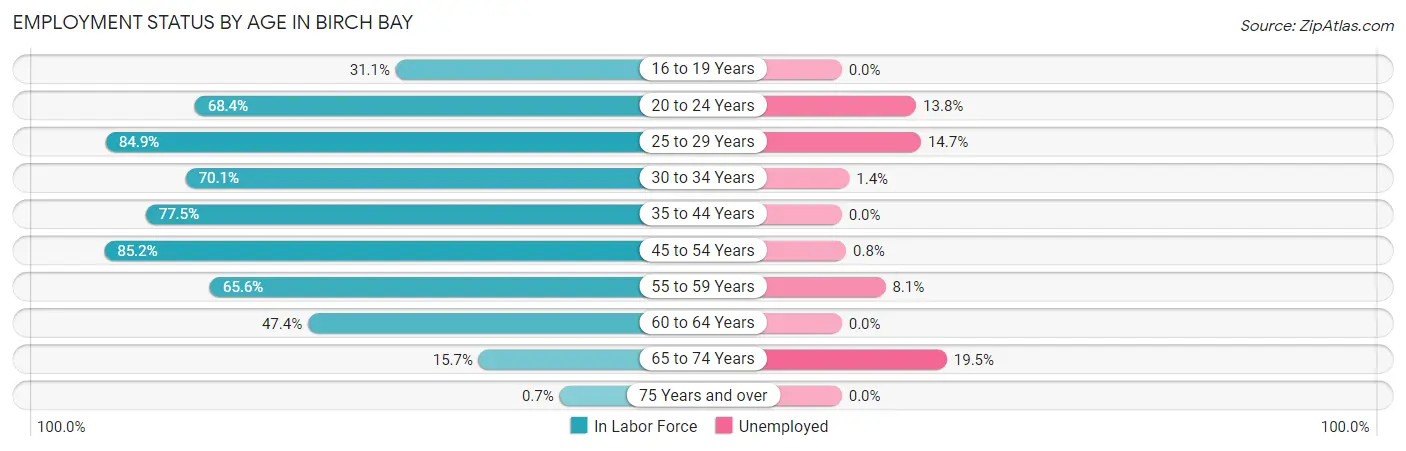
| Age Bracket | In Labor Force | Unemployed |
| 16 to 19 Years | 112 (31.1%) | 0 (0.0%) |
| 20 to 24 Years | 536 (68.4%) | 74 (13.8%) |
| 25 to 29 Years | 477 (84.9%) | 70 (14.7%) |
| 30 to 34 Years | 446 (70.1%) | 6 (1.4%) |
| 35 to 44 Years | 1,002 (77.5%) | 0 (0.0%) |
| 45 to 54 Years | 1,020 (85.2%) | 8 (0.8%) |
| 55 to 59 Years | 459 (65.6%) | 37 (8.1%) |
| 60 to 64 Years | 457 (47.4%) | 0 (0.0%) |
| 65 to 74 Years | 261 (15.7%) | 51 (19.5%) |
| 75 Years and over | 7 (0.7%) | 0 (0.0%) |
| Total | 4,778 (52.0%) | 253 (5.3%) |
Employment Status by Educational Attainment in Birch Bay
According to labor force statistics for Birch Bay, 72.1% of individuals (3,859) out of the total population between 25 and 64 years of age (5,352) are in the labor force, with 3.2% or 123 of them being unemployed. The group with the highest labor force participation rate are those with the educational attainment of less than high school, with 94.2% or 390 individuals in the labor force. Within the labor force, individuals with high school diploma education have the highest percentage of unemployment, with 7.4% or 74 of them being unemployed.
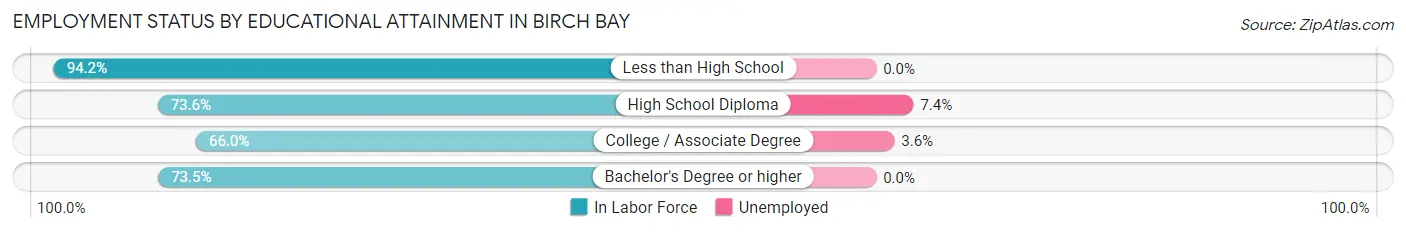
| Educational Attainment | In Labor Force | Unemployed |
| Less than High School | 390 (94.2%) | 0 (0.0%) |
| High School Diploma | 994 (73.6%) | 100 (7.4%) |
| College / Associate Degree | 1,398 (66.0%) | 76 (3.6%) |
| Bachelor's Degree or higher | 1,080 (73.5%) | 0 (0.0%) |
| Total | 3,859 (72.1%) | 171 (3.2%) |
Employment Occupations by Sex in Birch Bay
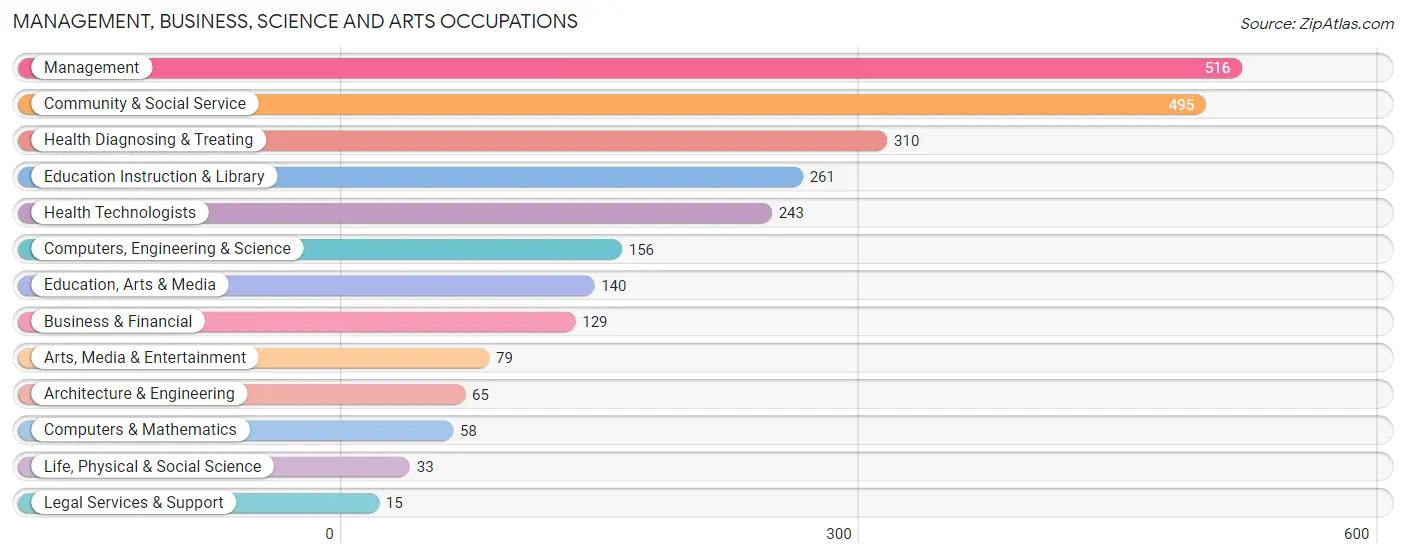
Management, Business, Science and Arts Occupations
The most common Management, Business, Science and Arts occupations in Birch Bay are Management (516 | 11.6%), Community & Social Service (495 | 11.2%), Health Diagnosing & Treating (310 | 7.0%), Education Instruction & Library (261 | 5.9%), and Health Technologists (243 | 5.5%).
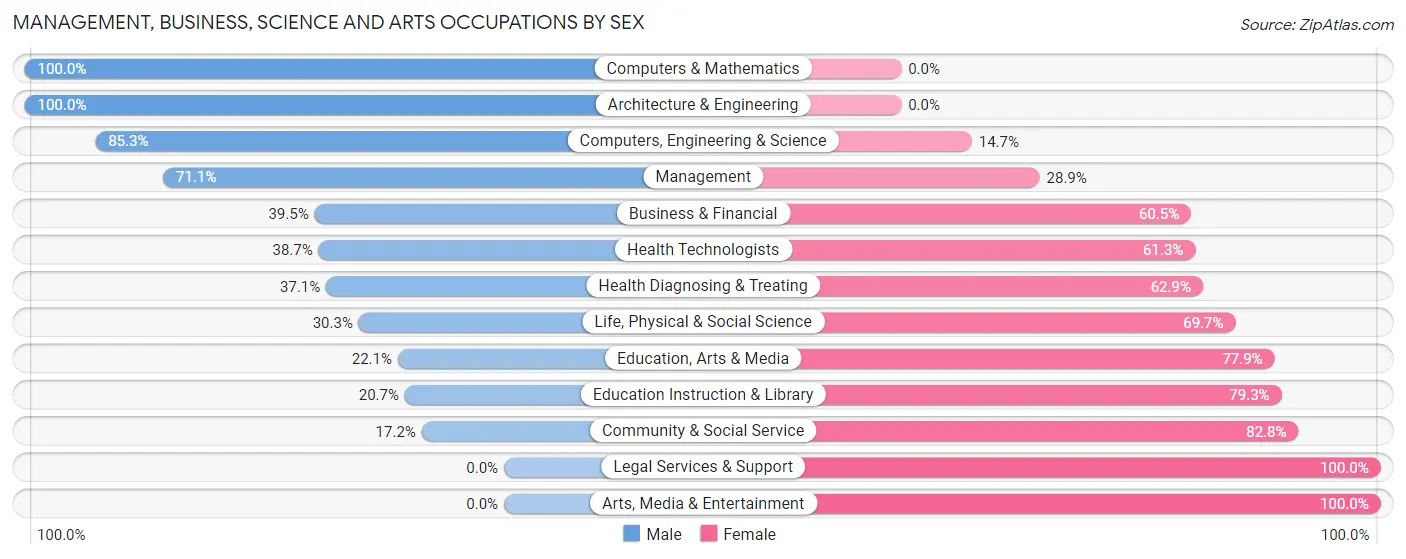
Management, Business, Science and Arts Occupations by Sex
Within the Management, Business, Science and Arts occupations in Birch Bay, the most male-oriented occupations are Computers & Mathematics (100.0%), Architecture & Engineering (100.0%), and Computers, Engineering & Science (85.3%), while the most female-oriented occupations are Legal Services & Support (100.0%), Arts, Media & Entertainment (100.0%), and Community & Social Service (82.8%).
| Occupation | Male | Female |
| Management | 367 (71.1%) | 149 (28.9%) |
| Business & Financial | 51 (39.5%) | 78 (60.5%) |
| Computers, Engineering & Science | 133 (85.3%) | 23 (14.7%) |
| Computers & Mathematics | 58 (100.0%) | 0 (0.0%) |
| Architecture & Engineering | 65 (100.0%) | 0 (0.0%) |
| Life, Physical & Social Science | 10 (30.3%) | 23 (69.7%) |
| Community & Social Service | 85 (17.2%) | 410 (82.8%) |
| Education, Arts & Media | 31 (22.1%) | 109 (77.9%) |
| Legal Services & Support | 0 (0.0%) | 15 (100.0%) |
| Education Instruction & Library | 54 (20.7%) | 207 (79.3%) |
| Arts, Media & Entertainment | 0 (0.0%) | 79 (100.0%) |
| Health Diagnosing & Treating | 115 (37.1%) | 195 (62.9%) |
| Health Technologists | 94 (38.7%) | 149 (61.3%) |
| Total (Category) | 751 (46.8%) | 855 (53.2%) |
| Total (Overall) | 2,529 (57.0%) | 1,909 (43.0%) |
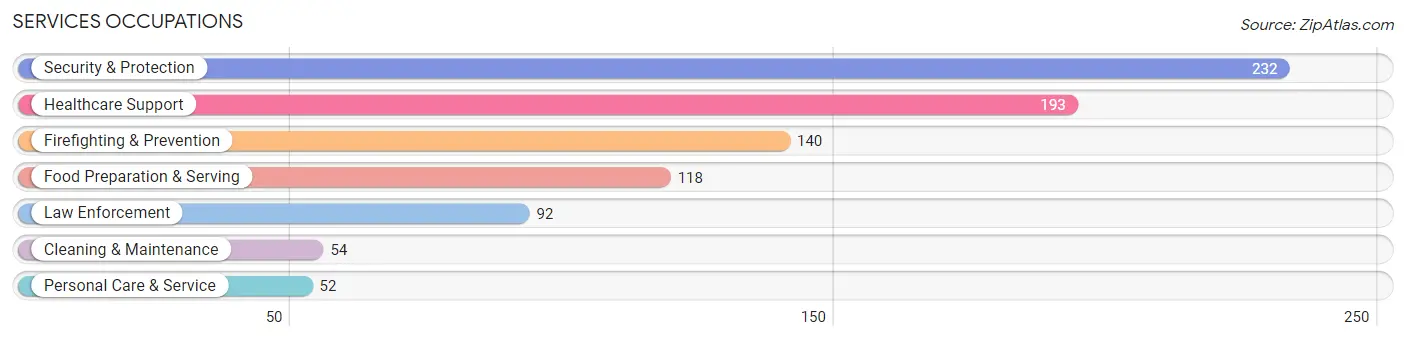
Services Occupations
The most common Services occupations in Birch Bay are Security & Protection (232 | 5.2%), Healthcare Support (193 | 4.3%), Firefighting & Prevention (140 | 3.2%), Food Preparation & Serving (118 | 2.7%), and Law Enforcement (92 | 2.1%).
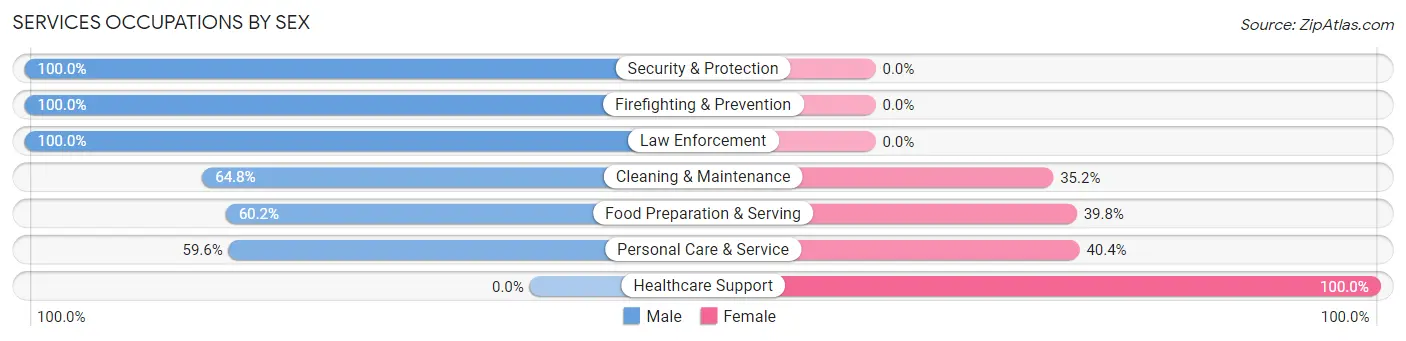
Services Occupations by Sex
Within the Services occupations in Birch Bay, the most male-oriented occupations are Security & Protection (100.0%), Firefighting & Prevention (100.0%), and Law Enforcement (100.0%), while the most female-oriented occupations are Healthcare Support (100.0%), Personal Care & Service (40.4%), and Food Preparation & Serving (39.8%).
| Occupation | Male | Female |
| Healthcare Support | 0 (0.0%) | 193 (100.0%) |
| Security & Protection | 232 (100.0%) | 0 (0.0%) |
| Firefighting & Prevention | 140 (100.0%) | 0 (0.0%) |
| Law Enforcement | 92 (100.0%) | 0 (0.0%) |
| Food Preparation & Serving | 71 (60.2%) | 47 (39.8%) |
| Cleaning & Maintenance | 35 (64.8%) | 19 (35.2%) |
| Personal Care & Service | 31 (59.6%) | 21 (40.4%) |
| Total (Category) | 369 (56.9%) | 280 (43.1%) |
| Total (Overall) | 2,529 (57.0%) | 1,909 (43.0%) |
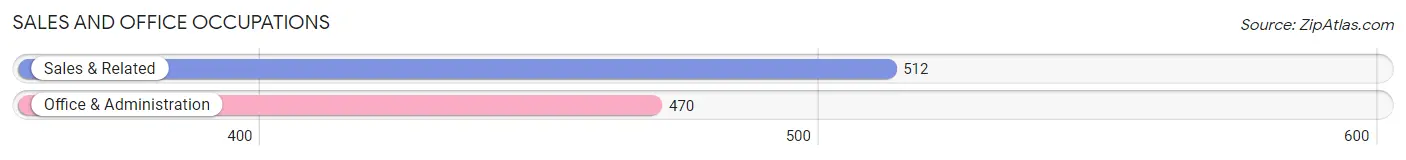
Sales and Office Occupations
The most common Sales and Office occupations in Birch Bay are Sales & Related (512 | 11.5%), and Office & Administration (470 | 10.6%).
Sales and Office Occupations by Sex
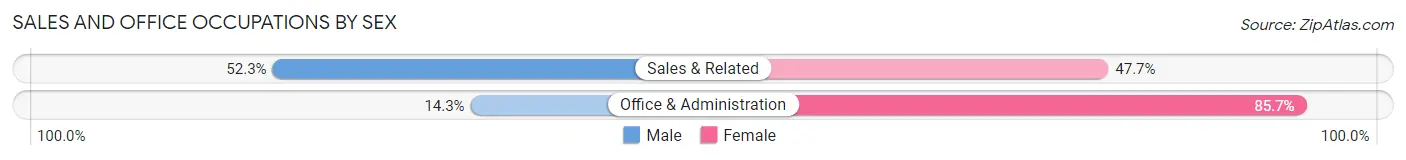
| Occupation | Male | Female |
| Sales & Related | 268 (52.3%) | 244 (47.7%) |
| Office & Administration | 67 (14.3%) | 403 (85.7%) |
| Total (Category) | 335 (34.1%) | 647 (65.9%) |
| Total (Overall) | 2,529 (57.0%) | 1,909 (43.0%) |
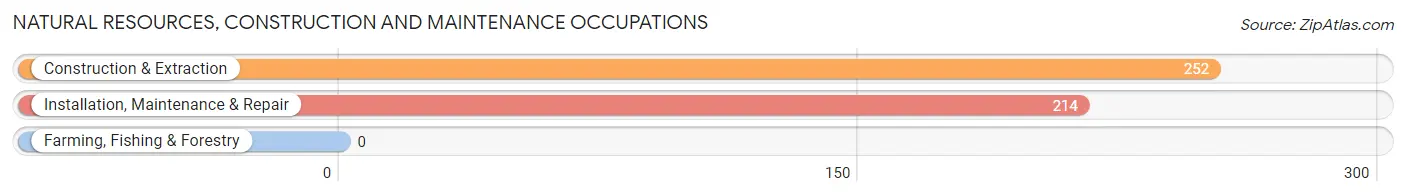
Natural Resources, Construction and Maintenance Occupations
The most common Natural Resources, Construction and Maintenance occupations in Birch Bay are Construction & Extraction (252 | 5.7%), and Installation, Maintenance & Repair (214 | 4.8%).
Natural Resources, Construction and Maintenance Occupations by Sex
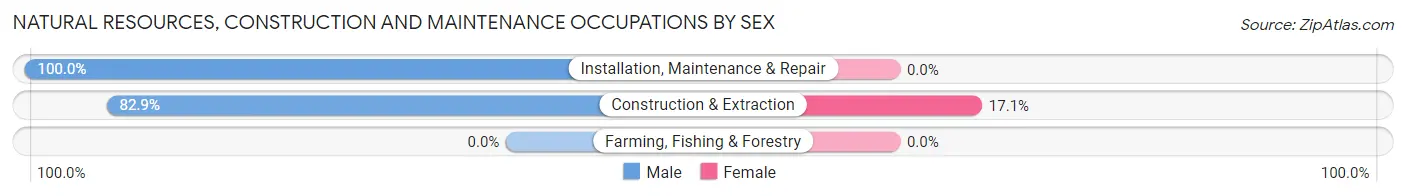
| Occupation | Male | Female |
| Farming, Fishing & Forestry | 0 (0.0%) | 0 (0.0%) |
| Construction & Extraction | 209 (82.9%) | 43 (17.1%) |
| Installation, Maintenance & Repair | 214 (100.0%) | 0 (0.0%) |
| Total (Category) | 423 (90.8%) | 43 (9.2%) |
| Total (Overall) | 2,529 (57.0%) | 1,909 (43.0%) |
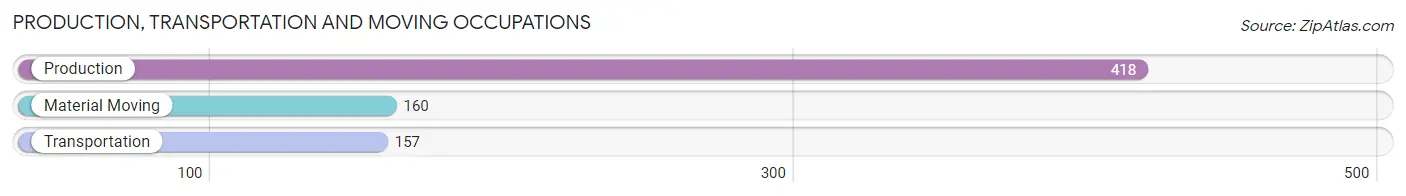
Production, Transportation and Moving Occupations
The most common Production, Transportation and Moving occupations in Birch Bay are Production (418 | 9.4%), Material Moving (160 | 3.6%), and Transportation (157 | 3.5%).
Production, Transportation and Moving Occupations by Sex
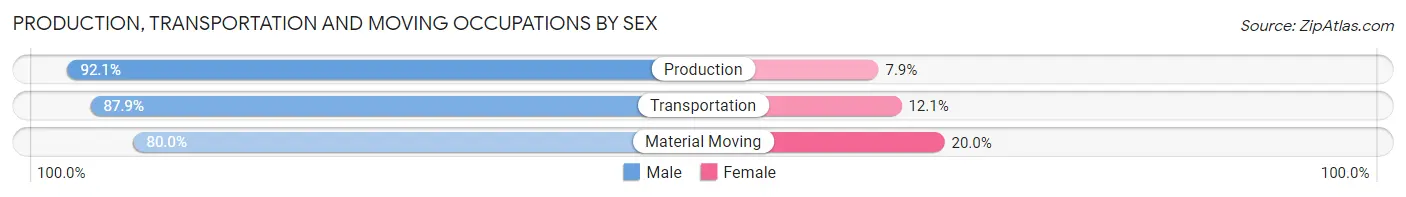
| Occupation | Male | Female |
| Production | 385 (92.1%) | 33 (7.9%) |
| Transportation | 138 (87.9%) | 19 (12.1%) |
| Material Moving | 128 (80.0%) | 32 (20.0%) |
| Total (Category) | 651 (88.6%) | 84 (11.4%) |
| Total (Overall) | 2,529 (57.0%) | 1,909 (43.0%) |
Employment Industries by Sex in Birch Bay
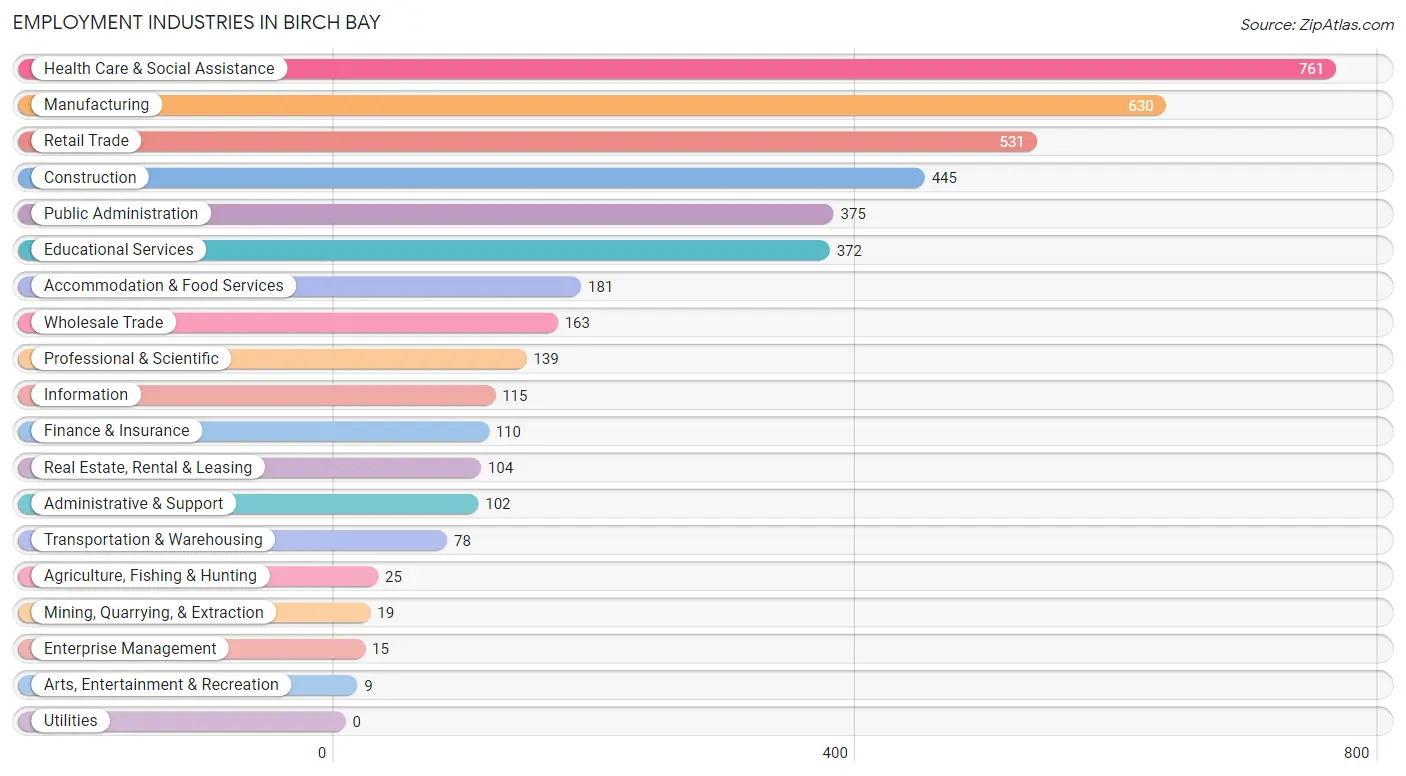
Employment Industries in Birch Bay
The major employment industries in Birch Bay include Health Care & Social Assistance (761 | 17.2%), Manufacturing (630 | 14.2%), Retail Trade (531 | 12.0%), Construction (445 | 10.0%), and Public Administration (375 | 8.5%).
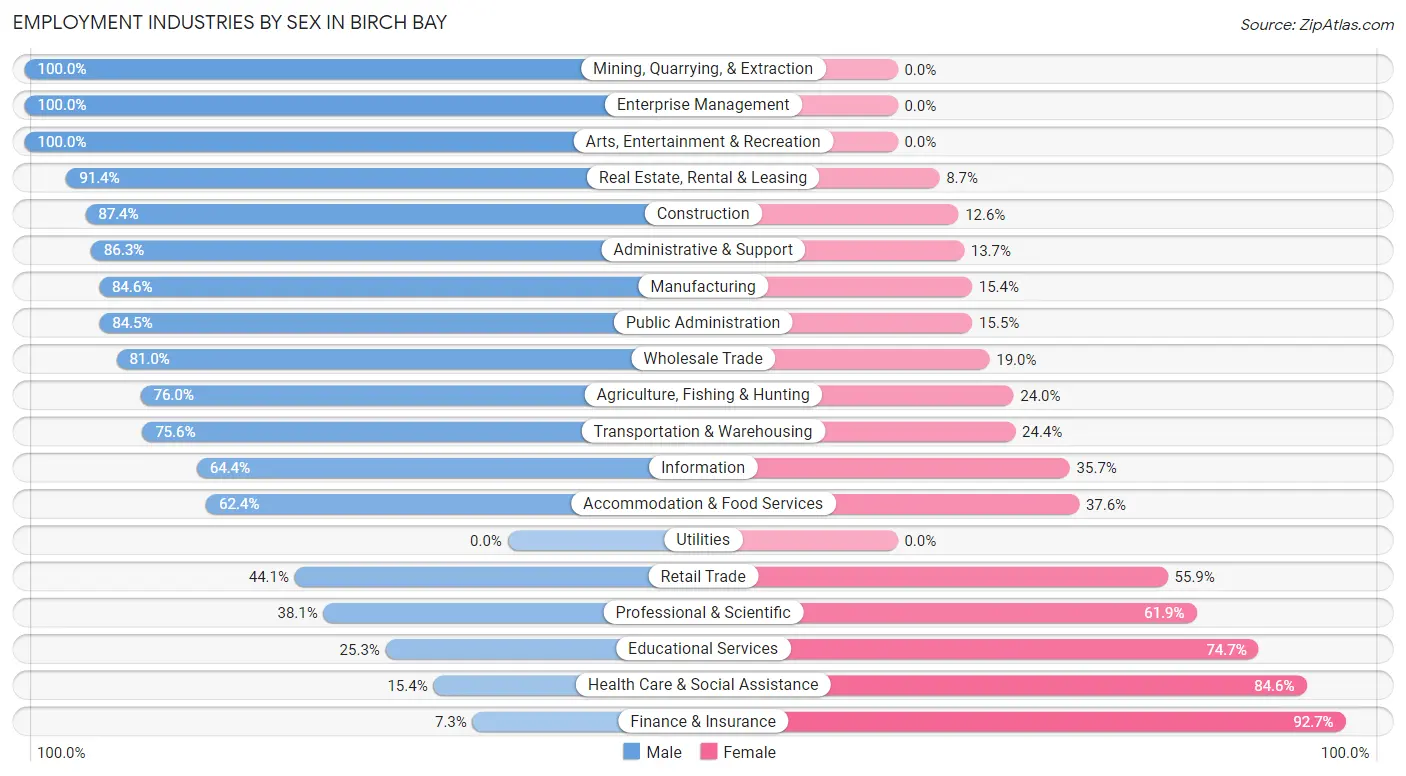
Employment Industries by Sex in Birch Bay
The Birch Bay industries that see more men than women are Mining, Quarrying, & Extraction (100.0%), Enterprise Management (100.0%), and Arts, Entertainment & Recreation (100.0%), whereas the industries that tend to have a higher number of women are Finance & Insurance (92.7%), Health Care & Social Assistance (84.6%), and Educational Services (74.7%).
| Industry | Male | Female |
| Agriculture, Fishing & Hunting | 19 (76.0%) | 6 (24.0%) |
| Mining, Quarrying, & Extraction | 19 (100.0%) | 0 (0.0%) |
| Construction | 389 (87.4%) | 56 (12.6%) |
| Manufacturing | 533 (84.6%) | 97 (15.4%) |
| Wholesale Trade | 132 (81.0%) | 31 (19.0%) |
| Retail Trade | 234 (44.1%) | 297 (55.9%) |
| Transportation & Warehousing | 59 (75.6%) | 19 (24.4%) |
| Utilities | 0 (0.0%) | 0 (0.0%) |
| Information | 74 (64.3%) | 41 (35.6%) |
| Finance & Insurance | 8 (7.3%) | 102 (92.7%) |
| Real Estate, Rental & Leasing | 95 (91.3%) | 9 (8.6%) |
| Professional & Scientific | 53 (38.1%) | 86 (61.9%) |
| Enterprise Management | 15 (100.0%) | 0 (0.0%) |
| Administrative & Support | 88 (86.3%) | 14 (13.7%) |
| Educational Services | 94 (25.3%) | 278 (74.7%) |
| Health Care & Social Assistance | 117 (15.4%) | 644 (84.6%) |
| Arts, Entertainment & Recreation | 9 (100.0%) | 0 (0.0%) |
| Accommodation & Food Services | 113 (62.4%) | 68 (37.6%) |
| Public Administration | 317 (84.5%) | 58 (15.5%) |
| Total | 2,529 (57.0%) | 1,909 (43.0%) |
Education in Birch Bay
School Enrollment in Birch Bay
The most common levels of schooling among the 1,997 students in Birch Bay are elementary school (492 | 24.6%), middle school (448 | 22.4%), and high school (408 | 20.4%).
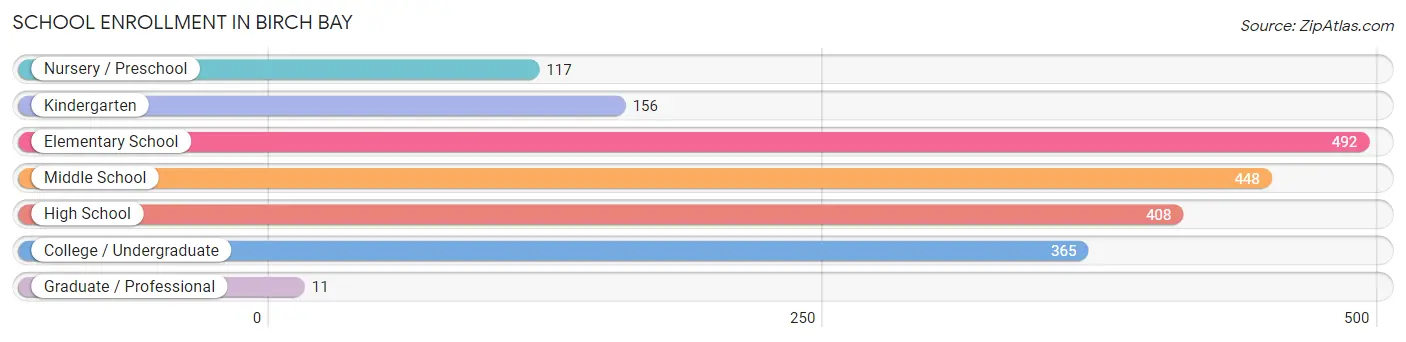
| School Level | # Students | % Students |
| Nursery / Preschool | 117 | 5.9% |
| Kindergarten | 156 | 7.8% |
| Elementary School | 492 | 24.6% |
| Middle School | 448 | 22.4% |
| High School | 408 | 20.4% |
| College / Undergraduate | 365 | 18.3% |
| Graduate / Professional | 11 | 0.5% |
| Total | 1,997 | 100.0% |
School Enrollment by Age by Funding Source in Birch Bay
Out of a total of 1,997 students who are enrolled in schools in Birch Bay, 304 (15.2%) attend a private institution, while the remaining 1,693 (84.8%) are enrolled in public schools. The age group of 3 to 4 year olds has the highest likelihood of being enrolled in private schools, with 38 (55.9% in the age bracket) enrolled. Conversely, the age group of 18 to 19 year olds has the lowest likelihood of being enrolled in a private school, with 29 (100.0% in the age bracket) attending a public institution.
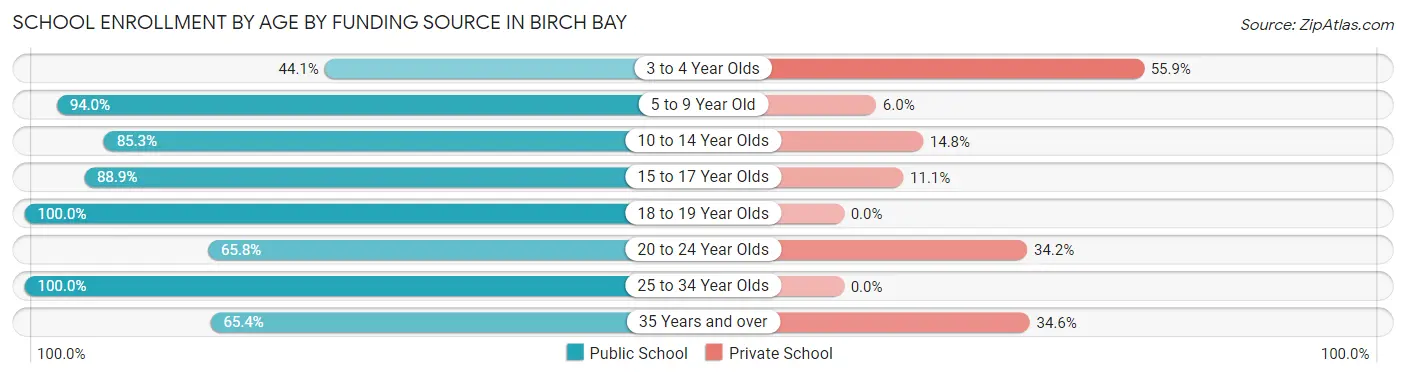
| Age Bracket | Public School | Private School |
| 3 to 4 Year Olds | 30 (44.1%) | 38 (55.9%) |
| 5 to 9 Year Old | 627 (94.0%) | 40 (6.0%) |
| 10 to 14 Year Olds | 474 (85.3%) | 82 (14.7%) |
| 15 to 17 Year Olds | 265 (88.9%) | 33 (11.1%) |
| 18 to 19 Year Olds | 29 (100.0%) | 0 (0.0%) |
| 20 to 24 Year Olds | 160 (65.8%) | 83 (34.2%) |
| 25 to 34 Year Olds | 58 (100.0%) | 0 (0.0%) |
| 35 Years and over | 51 (65.4%) | 27 (34.6%) |
| Total | 1,693 (84.8%) | 304 (15.2%) |
Educational Attainment by Field of Study in Birch Bay
Social sciences (405 | 14.9%), liberal arts & history (374 | 13.7%), communications (301 | 11.1%), business (272 | 10.0%), and literature & languages (244 | 9.0%) are the most common fields of study among 2,723 individuals in Birch Bay who have obtained a bachelor's degree or higher.
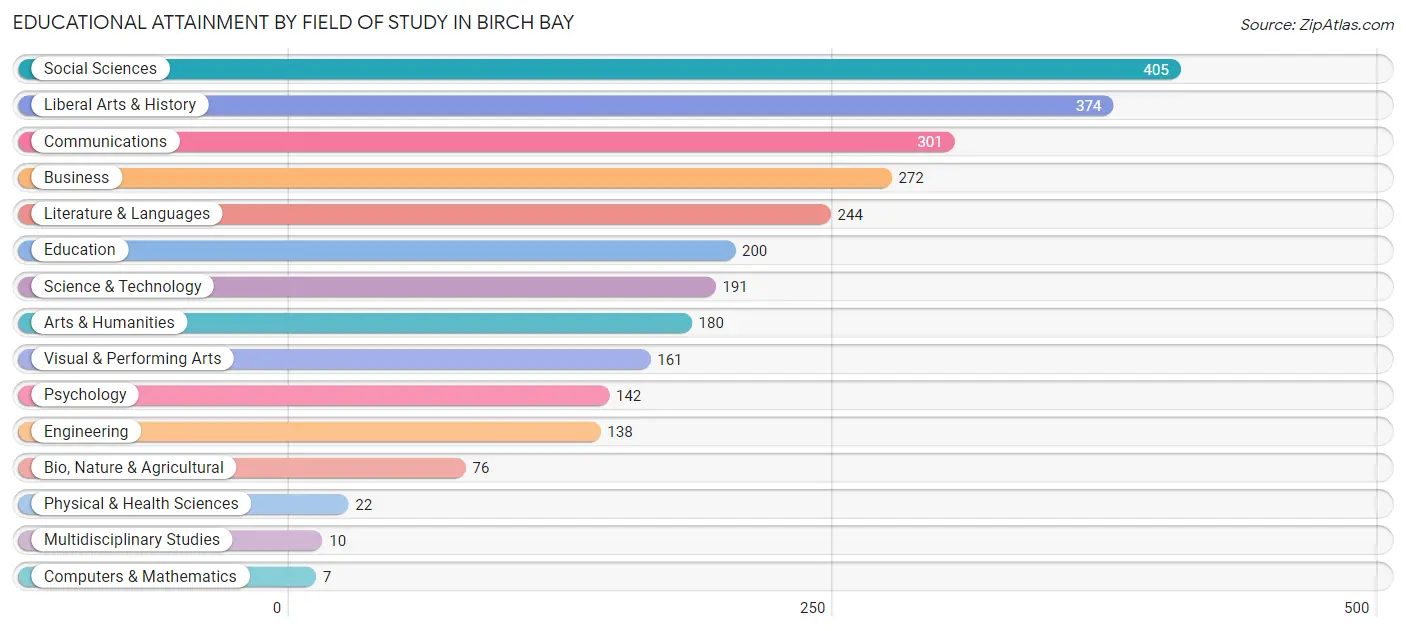
| Field of Study | # Graduates | % Graduates |
| Computers & Mathematics | 7 | 0.3% |
| Bio, Nature & Agricultural | 76 | 2.8% |
| Physical & Health Sciences | 22 | 0.8% |
| Psychology | 142 | 5.2% |
| Social Sciences | 405 | 14.9% |
| Engineering | 138 | 5.1% |
| Multidisciplinary Studies | 10 | 0.4% |
| Science & Technology | 191 | 7.0% |
| Business | 272 | 10.0% |
| Education | 200 | 7.3% |
| Literature & Languages | 244 | 9.0% |
| Liberal Arts & History | 374 | 13.7% |
| Visual & Performing Arts | 161 | 5.9% |
| Communications | 301 | 11.1% |
| Arts & Humanities | 180 | 6.6% |
| Total | 2,723 | 100.0% |
Transportation & Commute in Birch Bay
Vehicle Availability by Sex in Birch Bay
The most prevalent vehicle ownership categories in Birch Bay are males with 2 vehicles (883, accounting for 35.0%) and females with 2 vehicles (732, making up 45.7%).
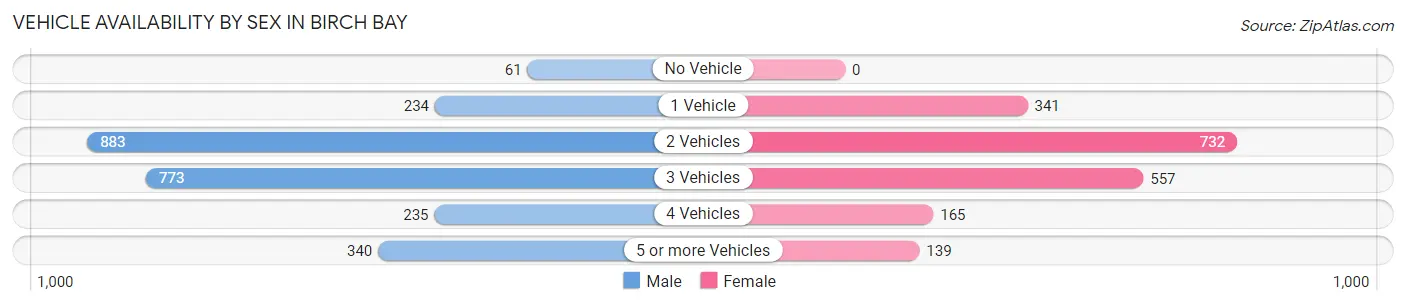
| Vehicles Available | Male | Female |
| No Vehicle | 61 (2.4%) | 0 (0.0%) |
| 1 Vehicle | 234 (9.3%) | 341 (17.6%) |
| 2 Vehicles | 883 (35.0%) | 732 (37.9%) |
| 3 Vehicles | 773 (30.6%) | 557 (28.8%) |
| 4 Vehicles | 235 (9.3%) | 165 (8.5%) |
| 5 or more Vehicles | 340 (13.5%) | 139 (7.2%) |
| Total | 2,526 (100.0%) | 1,934 (100.0%) |
Commute Time in Birch Bay
The most frequently occuring commute durations in Birch Bay are 30 to 34 minutes (813 commuters, 19.9%), 10 to 14 minutes (754 commuters, 18.4%), and 25 to 29 minutes (703 commuters, 17.2%).
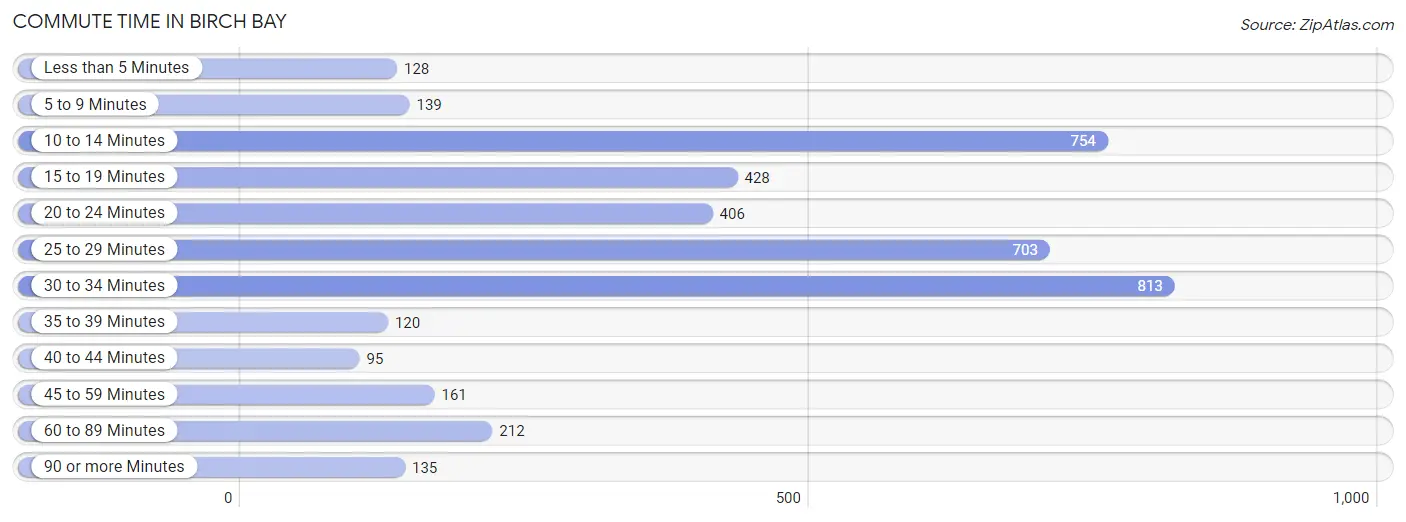
| Commute Time | # Commuters | % Commuters |
| Less than 5 Minutes | 128 | 3.1% |
| 5 to 9 Minutes | 139 | 3.4% |
| 10 to 14 Minutes | 754 | 18.4% |
| 15 to 19 Minutes | 428 | 10.4% |
| 20 to 24 Minutes | 406 | 9.9% |
| 25 to 29 Minutes | 703 | 17.2% |
| 30 to 34 Minutes | 813 | 19.9% |
| 35 to 39 Minutes | 120 | 2.9% |
| 40 to 44 Minutes | 95 | 2.3% |
| 45 to 59 Minutes | 161 | 3.9% |
| 60 to 89 Minutes | 212 | 5.2% |
| 90 or more Minutes | 135 | 3.3% |
Commute Time by Sex in Birch Bay
The most common commute times in Birch Bay are 10 to 14 minutes (634 commuters, 27.2%) for males and 30 to 34 minutes (403 commuters, 22.9%) for females.
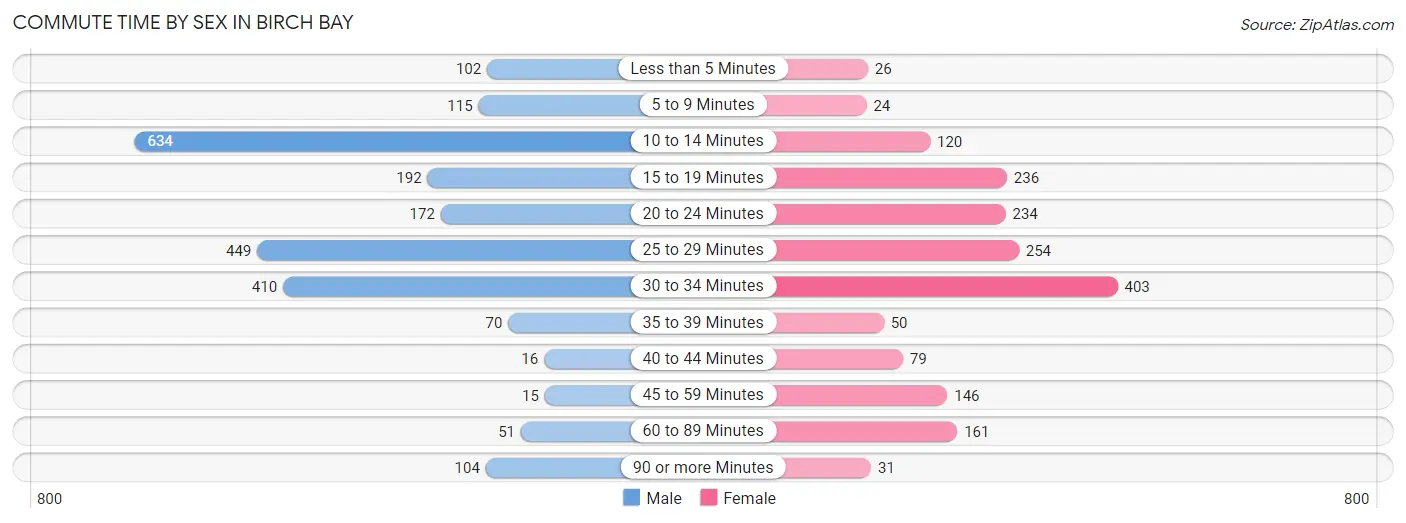
| Commute Time | Male | Female |
| Less than 5 Minutes | 102 (4.4%) | 26 (1.5%) |
| 5 to 9 Minutes | 115 (4.9%) | 24 (1.4%) |
| 10 to 14 Minutes | 634 (27.2%) | 120 (6.8%) |
| 15 to 19 Minutes | 192 (8.2%) | 236 (13.4%) |
| 20 to 24 Minutes | 172 (7.4%) | 234 (13.3%) |
| 25 to 29 Minutes | 449 (19.3%) | 254 (14.4%) |
| 30 to 34 Minutes | 410 (17.6%) | 403 (22.9%) |
| 35 to 39 Minutes | 70 (3.0%) | 50 (2.8%) |
| 40 to 44 Minutes | 16 (0.7%) | 79 (4.5%) |
| 45 to 59 Minutes | 15 (0.6%) | 146 (8.3%) |
| 60 to 89 Minutes | 51 (2.2%) | 161 (9.1%) |
| 90 or more Minutes | 104 (4.5%) | 31 (1.8%) |
Time of Departure to Work by Sex in Birch Bay
The most frequent times of departure to work in Birch Bay are 6:30 AM to 6:59 AM (389, 16.7%) for males and 7:30 AM to 7:59 AM (321, 18.2%) for females.
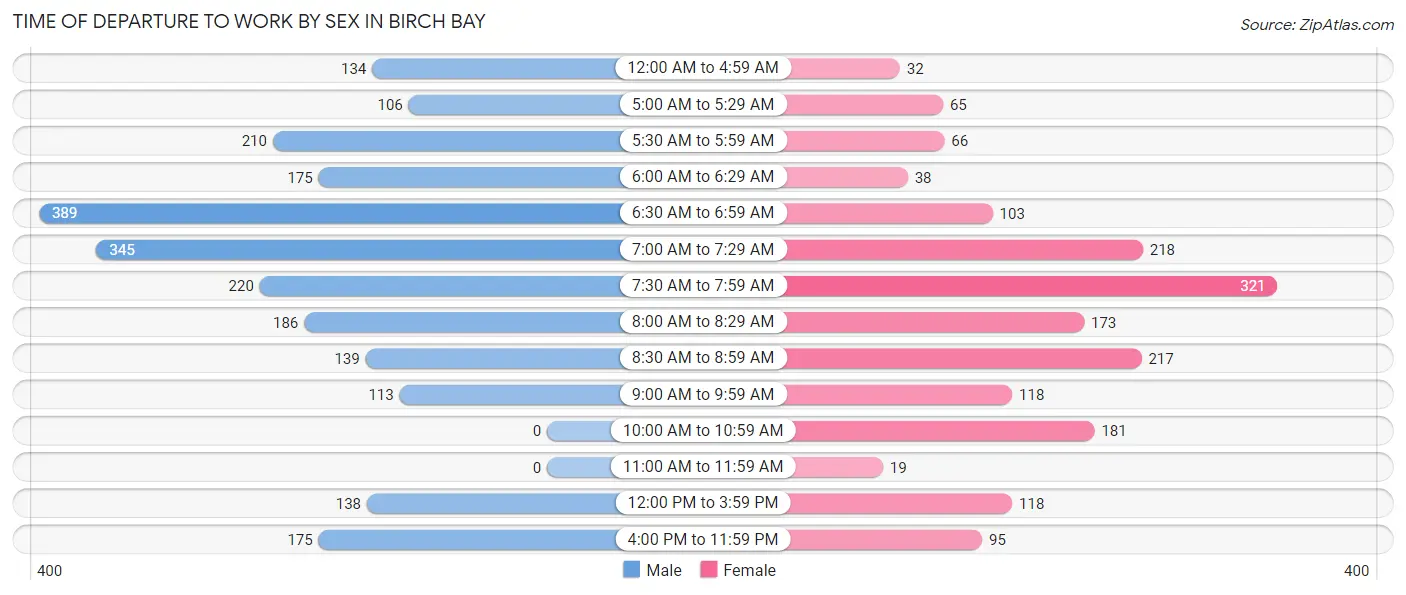
| Time of Departure | Male | Female |
| 12:00 AM to 4:59 AM | 134 (5.8%) | 32 (1.8%) |
| 5:00 AM to 5:29 AM | 106 (4.5%) | 65 (3.7%) |
| 5:30 AM to 5:59 AM | 210 (9.0%) | 66 (3.7%) |
| 6:00 AM to 6:29 AM | 175 (7.5%) | 38 (2.1%) |
| 6:30 AM to 6:59 AM | 389 (16.7%) | 103 (5.8%) |
| 7:00 AM to 7:29 AM | 345 (14.8%) | 218 (12.4%) |
| 7:30 AM to 7:59 AM | 220 (9.4%) | 321 (18.2%) |
| 8:00 AM to 8:29 AM | 186 (8.0%) | 173 (9.8%) |
| 8:30 AM to 8:59 AM | 139 (6.0%) | 217 (12.3%) |
| 9:00 AM to 9:59 AM | 113 (4.9%) | 118 (6.7%) |
| 10:00 AM to 10:59 AM | 0 (0.0%) | 181 (10.3%) |
| 11:00 AM to 11:59 AM | 0 (0.0%) | 19 (1.1%) |
| 12:00 PM to 3:59 PM | 138 (5.9%) | 118 (6.7%) |
| 4:00 PM to 11:59 PM | 175 (7.5%) | 95 (5.4%) |
| Total | 2,330 (100.0%) | 1,764 (100.0%) |
Housing Occupancy in Birch Bay
Occupancy by Ownership in Birch Bay
Of the total 4,846 dwellings in Birch Bay, owner-occupied units account for 3,974 (82.0%), while renter-occupied units make up 872 (18.0%).
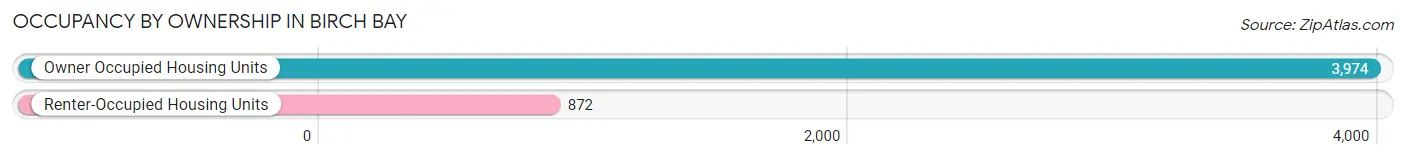
| Occupancy | # Housing Units | % Housing Units |
| Owner Occupied Housing Units | 3,974 | 82.0% |
| Renter-Occupied Housing Units | 872 | 18.0% |
| Total Occupied Housing Units | 4,846 | 100.0% |
Occupancy by Household Size in Birch Bay
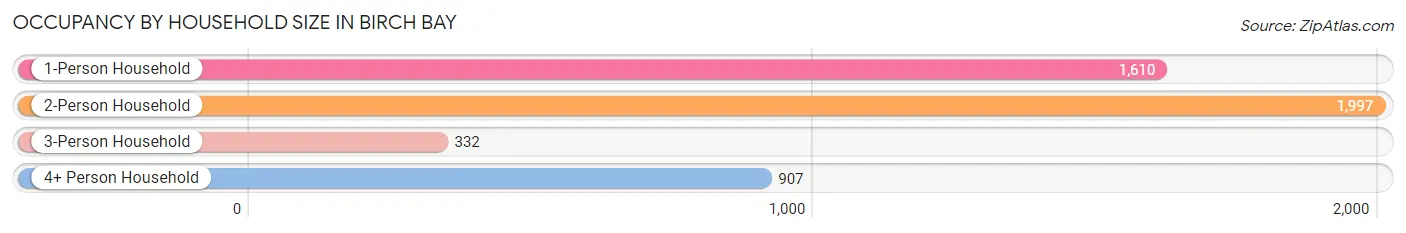
| Household Size | # Housing Units | % Housing Units |
| 1-Person Household | 1,610 | 33.2% |
| 2-Person Household | 1,997 | 41.2% |
| 3-Person Household | 332 | 6.9% |
| 4+ Person Household | 907 | 18.7% |
| Total Housing Units | 4,846 | 100.0% |
Occupancy by Ownership by Household Size in Birch Bay
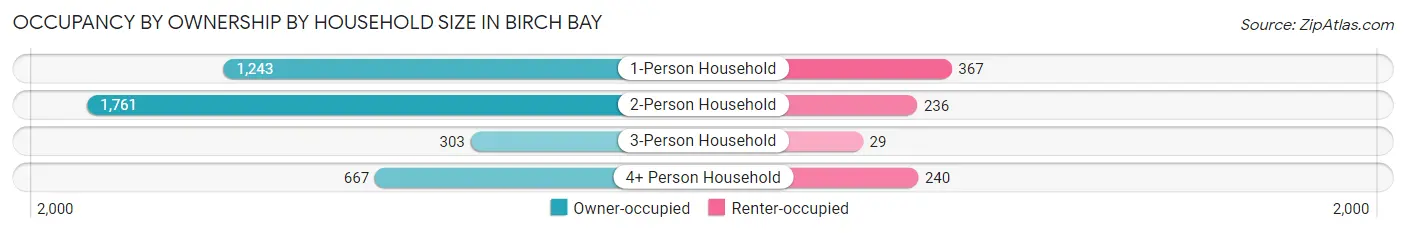
| Household Size | Owner-occupied | Renter-occupied |
| 1-Person Household | 1,243 (77.2%) | 367 (22.8%) |
| 2-Person Household | 1,761 (88.2%) | 236 (11.8%) |
| 3-Person Household | 303 (91.3%) | 29 (8.7%) |
| 4+ Person Household | 667 (73.5%) | 240 (26.5%) |
| Total Housing Units | 3,974 (82.0%) | 872 (18.0%) |
Occupancy by Educational Attainment in Birch Bay
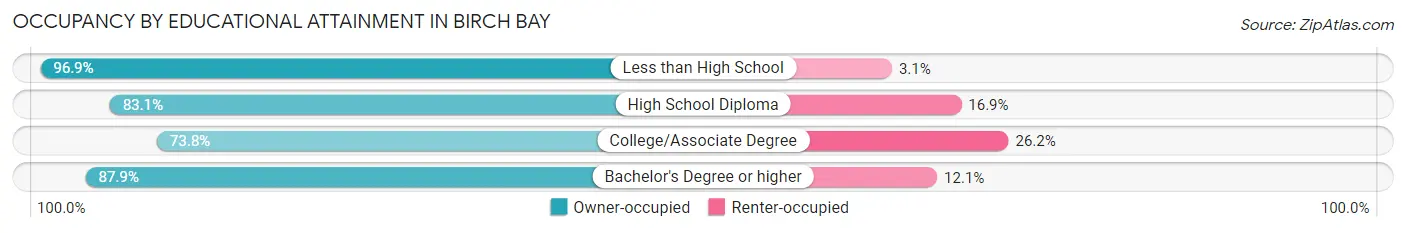
| Household Size | Owner-occupied | Renter-occupied |
| Less than High School | 309 (96.9%) | 10 (3.1%) |
| High School Diploma | 817 (83.1%) | 166 (16.9%) |
| College/Associate Degree | 1,394 (73.8%) | 496 (26.2%) |
| Bachelor's Degree or higher | 1,454 (87.9%) | 200 (12.1%) |
Occupancy by Age of Householder in Birch Bay
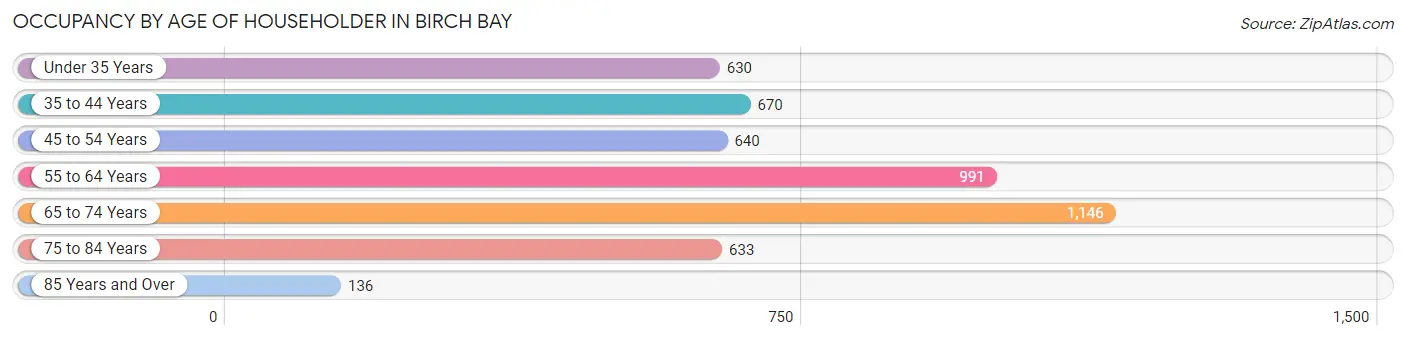
| Age Bracket | # Households | % Households |
| Under 35 Years | 630 | 13.0% |
| 35 to 44 Years | 670 | 13.8% |
| 45 to 54 Years | 640 | 13.2% |
| 55 to 64 Years | 991 | 20.4% |
| 65 to 74 Years | 1,146 | 23.6% |
| 75 to 84 Years | 633 | 13.1% |
| 85 Years and Over | 136 | 2.8% |
| Total | 4,846 | 100.0% |
Housing Finances in Birch Bay
Median Income by Occupancy in Birch Bay
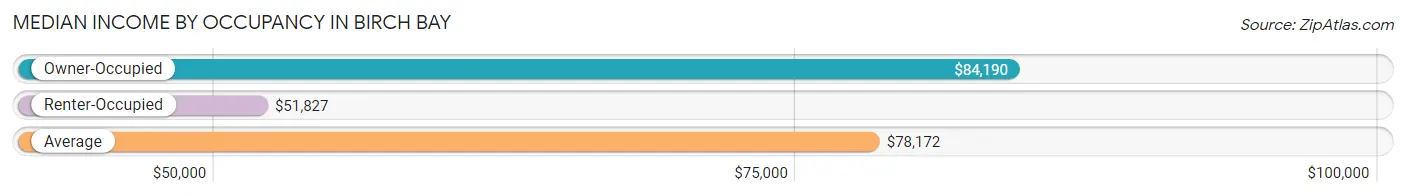
| Occupancy Type | # Households | Median Income |
| Owner-Occupied | 3,974 (82.0%) | $84,190 |
| Renter-Occupied | 872 (18.0%) | $51,827 |
| Average | 4,846 (100.0%) | $78,172 |
Occupancy by Householder Income Bracket in Birch Bay
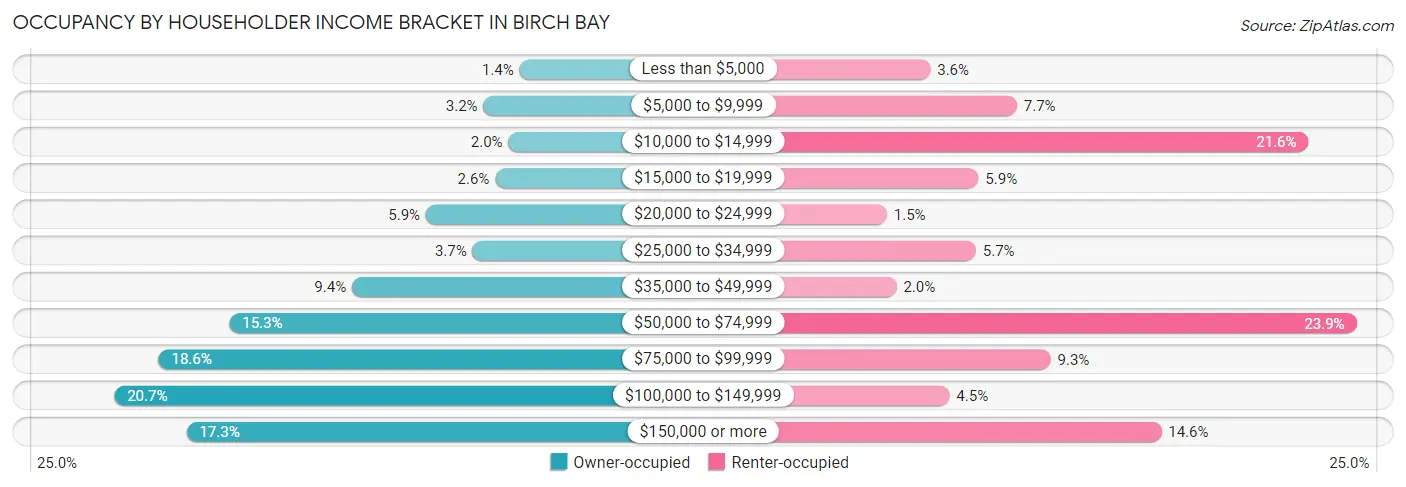
| Income Bracket | Owner-occupied | Renter-occupied |
| Less than $5,000 | 57 (1.4%) | 31 (3.6%) |
| $5,000 to $9,999 | 125 (3.2%) | 67 (7.7%) |
| $10,000 to $14,999 | 78 (2.0%) | 188 (21.6%) |
| $15,000 to $19,999 | 103 (2.6%) | 51 (5.9%) |
| $20,000 to $24,999 | 234 (5.9%) | 13 (1.5%) |
| $25,000 to $34,999 | 146 (3.7%) | 50 (5.7%) |
| $35,000 to $49,999 | 374 (9.4%) | 17 (1.9%) |
| $50,000 to $74,999 | 606 (15.2%) | 208 (23.8%) |
| $75,000 to $99,999 | 740 (18.6%) | 81 (9.3%) |
| $100,000 to $149,999 | 824 (20.7%) | 39 (4.5%) |
| $150,000 or more | 687 (17.3%) | 127 (14.6%) |
| Total | 3,974 (100.0%) | 872 (100.0%) |
Monthly Housing Cost Tiers in Birch Bay
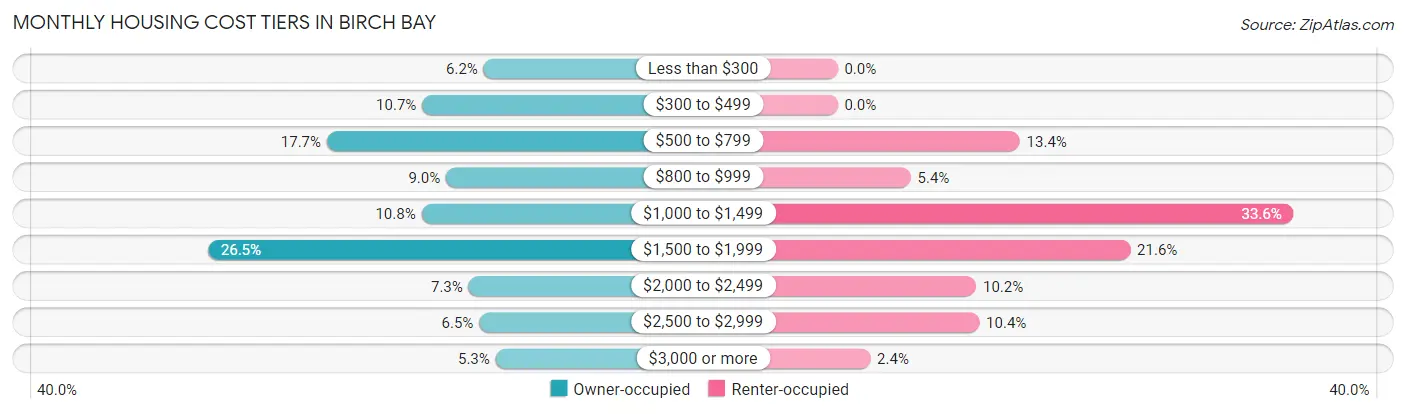
| Monthly Cost | Owner-occupied | Renter-occupied |
| Less than $300 | 246 (6.2%) | 0 (0.0%) |
| $300 to $499 | 426 (10.7%) | 0 (0.0%) |
| $500 to $799 | 705 (17.7%) | 117 (13.4%) |
| $800 to $999 | 356 (9.0%) | 47 (5.4%) |
| $1,000 to $1,499 | 428 (10.8%) | 293 (33.6%) |
| $1,500 to $1,999 | 1,053 (26.5%) | 188 (21.6%) |
| $2,000 to $2,499 | 290 (7.3%) | 89 (10.2%) |
| $2,500 to $2,999 | 259 (6.5%) | 91 (10.4%) |
| $3,000 or more | 211 (5.3%) | 21 (2.4%) |
| Total | 3,974 (100.0%) | 872 (100.0%) |
Physical Housing Characteristics in Birch Bay
Housing Structures in Birch Bay
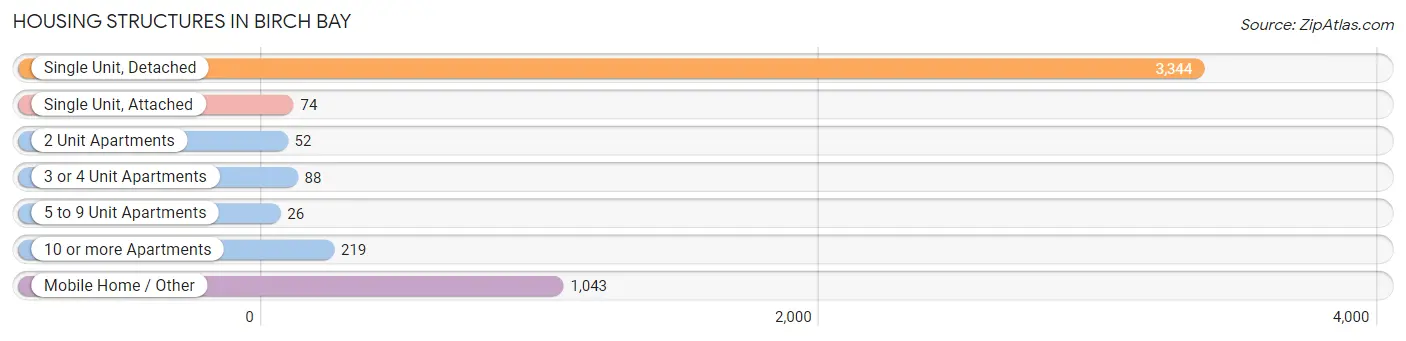
| Structure Type | # Housing Units | % Housing Units |
| Single Unit, Detached | 3,344 | 69.0% |
| Single Unit, Attached | 74 | 1.5% |
| 2 Unit Apartments | 52 | 1.1% |
| 3 or 4 Unit Apartments | 88 | 1.8% |
| 5 to 9 Unit Apartments | 26 | 0.5% |
| 10 or more Apartments | 219 | 4.5% |
| Mobile Home / Other | 1,043 | 21.5% |
| Total | 4,846 | 100.0% |
Housing Structures by Occupancy in Birch Bay
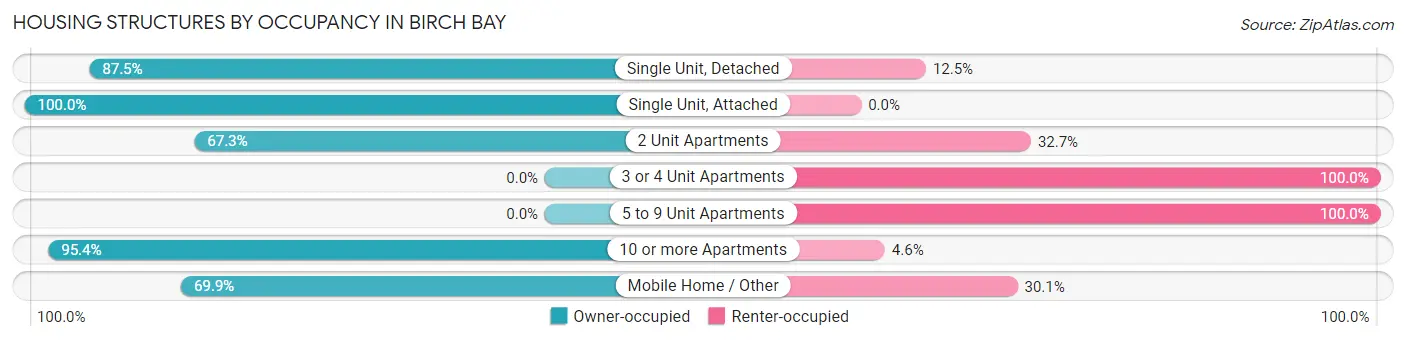
| Structure Type | Owner-occupied | Renter-occupied |
| Single Unit, Detached | 2,927 (87.5%) | 417 (12.5%) |
| Single Unit, Attached | 74 (100.0%) | 0 (0.0%) |
| 2 Unit Apartments | 35 (67.3%) | 17 (32.7%) |
| 3 or 4 Unit Apartments | 0 (0.0%) | 88 (100.0%) |
| 5 to 9 Unit Apartments | 0 (0.0%) | 26 (100.0%) |
| 10 or more Apartments | 209 (95.4%) | 10 (4.6%) |
| Mobile Home / Other | 729 (69.9%) | 314 (30.1%) |
| Total | 3,974 (82.0%) | 872 (18.0%) |
Housing Structures by Number of Rooms in Birch Bay
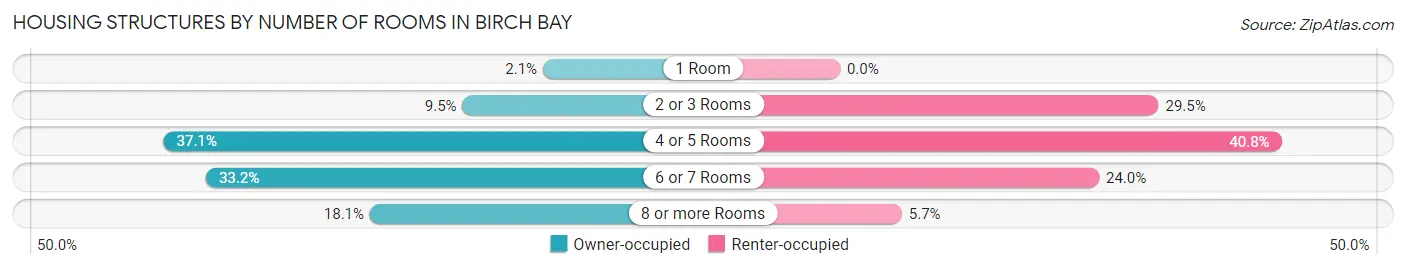
| Number of Rooms | Owner-occupied | Renter-occupied |
| 1 Room | 82 (2.1%) | 0 (0.0%) |
| 2 or 3 Rooms | 378 (9.5%) | 257 (29.5%) |
| 4 or 5 Rooms | 1,476 (37.1%) | 356 (40.8%) |
| 6 or 7 Rooms | 1,320 (33.2%) | 209 (24.0%) |
| 8 or more Rooms | 718 (18.1%) | 50 (5.7%) |
| Total | 3,974 (100.0%) | 872 (100.0%) |
Housing Structure by Heating Type in Birch Bay
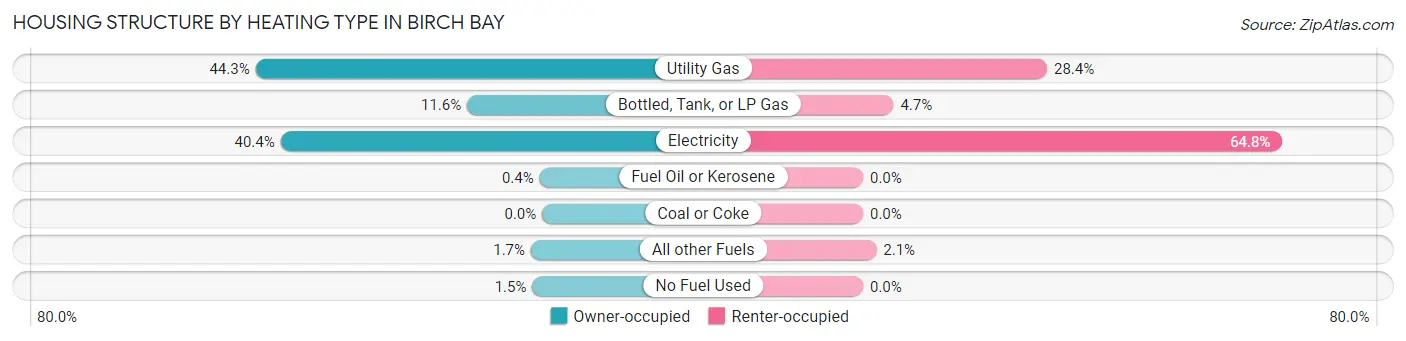
| Heating Type | Owner-occupied | Renter-occupied |
| Utility Gas | 1,761 (44.3%) | 248 (28.4%) |
| Bottled, Tank, or LP Gas | 461 (11.6%) | 41 (4.7%) |
| Electricity | 1,607 (40.4%) | 565 (64.8%) |
| Fuel Oil or Kerosene | 16 (0.4%) | 0 (0.0%) |
| Coal or Coke | 0 (0.0%) | 0 (0.0%) |
| All other Fuels | 69 (1.7%) | 18 (2.1%) |
| No Fuel Used | 60 (1.5%) | 0 (0.0%) |
| Total | 3,974 (100.0%) | 872 (100.0%) |
Household Vehicle Usage in Birch Bay
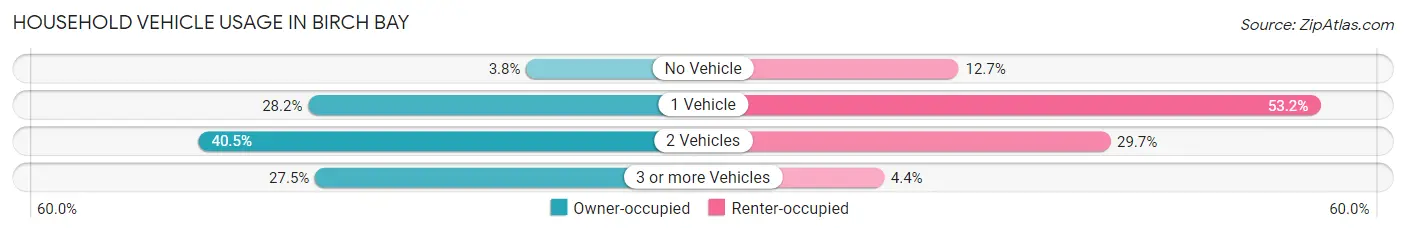
| Vehicles per Household | Owner-occupied | Renter-occupied |
| No Vehicle | 151 (3.8%) | 111 (12.7%) |
| 1 Vehicle | 1,122 (28.2%) | 464 (53.2%) |
| 2 Vehicles | 1,610 (40.5%) | 259 (29.7%) |
| 3 or more Vehicles | 1,091 (27.5%) | 38 (4.4%) |
| Total | 3,974 (100.0%) | 872 (100.0%) |
Real Estate & Mortgages in Birch Bay
Real Estate and Mortgage Overview in Birch Bay
| Characteristic | Without Mortgage | With Mortgage |
| Housing Units | 1,609 | 2,365 |
| Median Property Value | $370,300 | $387,200 |
| Median Household Income | $74,648 | $464 |
| Monthly Housing Costs | $548 | $198 |
| Real Estate Taxes | $2,295 | $140 |
Property Value by Mortgage Status in Birch Bay
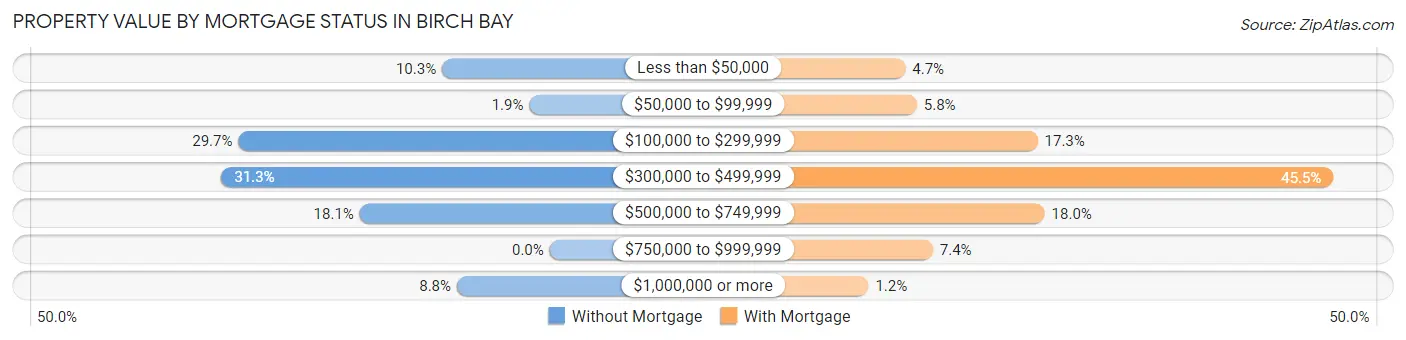
| Property Value | Without Mortgage | With Mortgage |
| Less than $50,000 | 165 (10.2%) | 112 (4.7%) |
| $50,000 to $99,999 | 31 (1.9%) | 138 (5.8%) |
| $100,000 to $299,999 | 477 (29.6%) | 410 (17.3%) |
| $300,000 to $499,999 | 503 (31.3%) | 1,076 (45.5%) |
| $500,000 to $749,999 | 291 (18.1%) | 426 (18.0%) |
| $750,000 to $999,999 | 0 (0.0%) | 174 (7.4%) |
| $1,000,000 or more | 142 (8.8%) | 29 (1.2%) |
| Total | 1,609 (100.0%) | 2,365 (100.0%) |
Household Income by Mortgage Status in Birch Bay
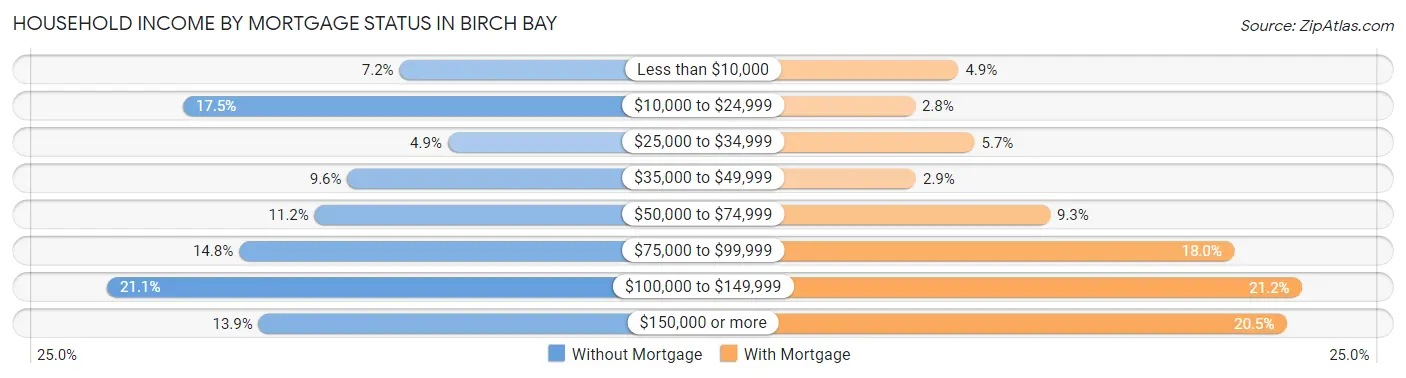
| Household Income | Without Mortgage | With Mortgage |
| Less than $10,000 | 115 (7.1%) | 116 (4.9%) |
| $10,000 to $24,999 | 281 (17.5%) | 67 (2.8%) |
| $25,000 to $34,999 | 78 (4.9%) | 134 (5.7%) |
| $35,000 to $49,999 | 155 (9.6%) | 68 (2.9%) |
| $50,000 to $74,999 | 180 (11.2%) | 219 (9.3%) |
| $75,000 to $99,999 | 238 (14.8%) | 426 (18.0%) |
| $100,000 to $149,999 | 339 (21.1%) | 502 (21.2%) |
| $150,000 or more | 223 (13.9%) | 485 (20.5%) |
| Total | 1,609 (100.0%) | 2,365 (100.0%) |
Property Value to Household Income Ratio in Birch Bay
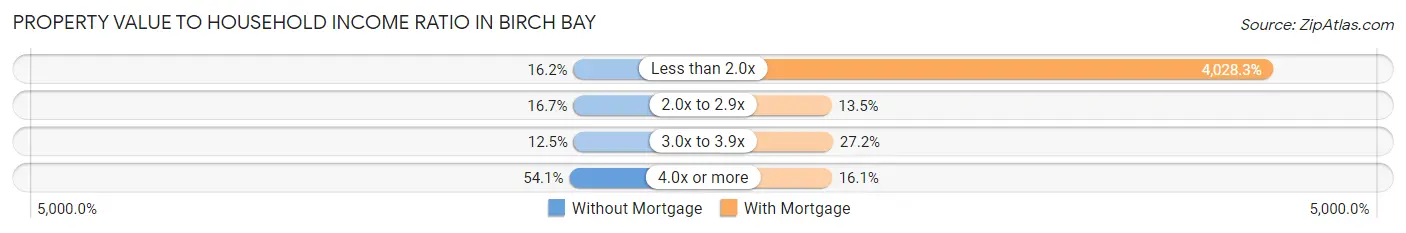
| Value-to-Income Ratio | Without Mortgage | With Mortgage |
| Less than 2.0x | 261 (16.2%) | 95,268 (4,028.2%) |
| 2.0x to 2.9x | 269 (16.7%) | 320 (13.5%) |
| 3.0x to 3.9x | 201 (12.5%) | 643 (27.2%) |
| 4.0x or more | 871 (54.1%) | 381 (16.1%) |
| Total | 1,609 (100.0%) | 2,365 (100.0%) |
Real Estate Taxes by Mortgage Status in Birch Bay
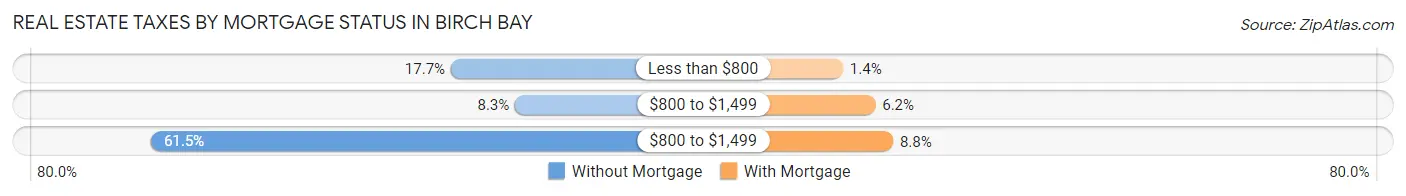
| Property Taxes | Without Mortgage | With Mortgage |
| Less than $800 | 285 (17.7%) | 34 (1.4%) |
| $800 to $1,499 | 134 (8.3%) | 146 (6.2%) |
| $800 to $1,499 | 990 (61.5%) | 207 (8.7%) |
| Total | 1,609 (100.0%) | 2,365 (100.0%) |
Health & Disability in Birch Bay
Health Insurance Coverage by Age in Birch Bay
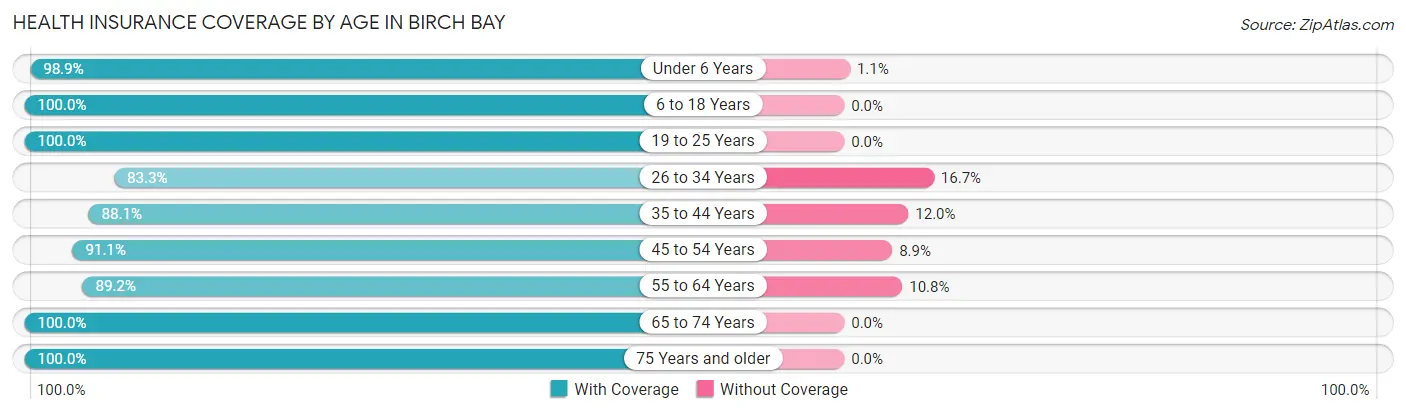
| Age Bracket | With Coverage | Without Coverage |
| Under 6 Years | 749 (98.9%) | 8 (1.1%) |
| 6 to 18 Years | 1,497 (100.0%) | 0 (0.0%) |
| 19 to 25 Years | 903 (100.0%) | 0 (0.0%) |
| 26 to 34 Years | 937 (83.3%) | 188 (16.7%) |
| 35 to 44 Years | 1,068 (88.0%) | 145 (11.9%) |
| 45 to 54 Years | 1,090 (91.1%) | 107 (8.9%) |
| 55 to 64 Years | 1,484 (89.2%) | 180 (10.8%) |
| 65 to 74 Years | 1,661 (100.0%) | 0 (0.0%) |
| 75 Years and older | 1,031 (100.0%) | 0 (0.0%) |
| Total | 10,420 (94.3%) | 628 (5.7%) |
Health Insurance Coverage by Citizenship Status in Birch Bay
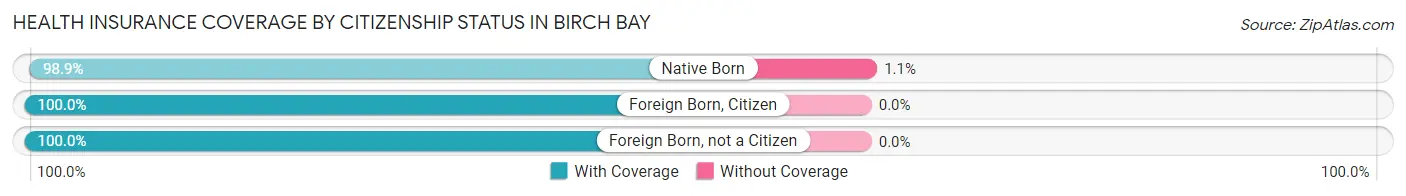
| Citizenship Status | With Coverage | Without Coverage |
| Native Born | 749 (98.9%) | 8 (1.1%) |
| Foreign Born, Citizen | 1,497 (100.0%) | 0 (0.0%) |
| Foreign Born, not a Citizen | 903 (100.0%) | 0 (0.0%) |
Health Insurance Coverage by Household Income in Birch Bay
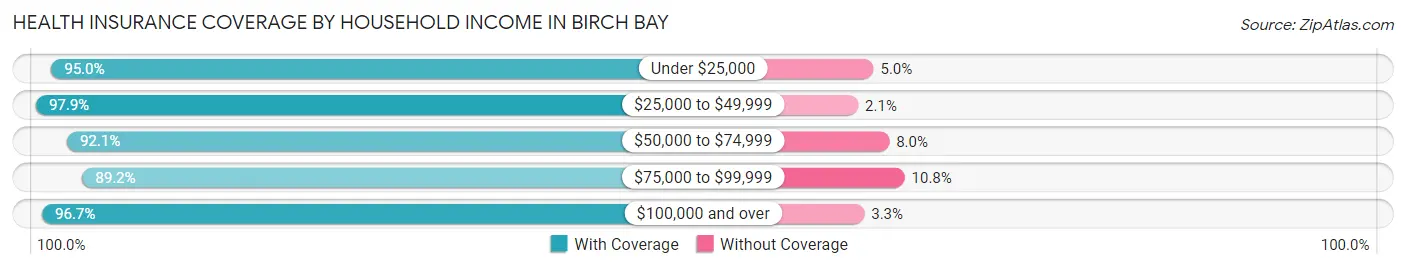
| Household Income | With Coverage | Without Coverage |
| Under $25,000 | 1,213 (95.0%) | 64 (5.0%) |
| $25,000 to $49,999 | 1,103 (97.9%) | 24 (2.1%) |
| $50,000 to $74,999 | 1,680 (92.0%) | 145 (8.0%) |
| $75,000 to $99,999 | 2,025 (89.2%) | 246 (10.8%) |
| $100,000 and over | 4,391 (96.7%) | 149 (3.3%) |
Public vs Private Health Insurance Coverage by Age in Birch Bay
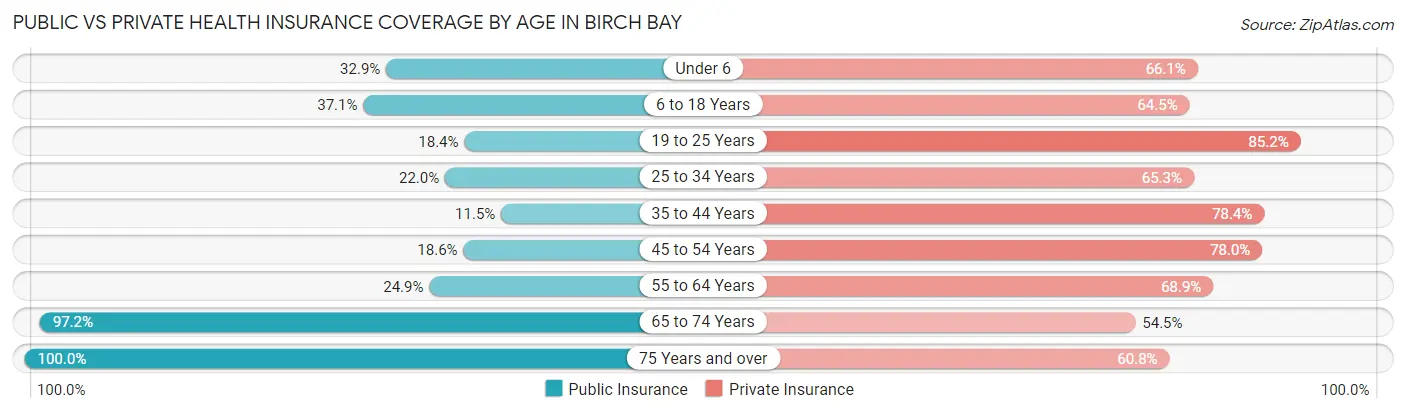
| Age Bracket | Public Insurance | Private Insurance |
| Under 6 | 249 (32.9%) | 500 (66.0%) |
| 6 to 18 Years | 556 (37.1%) | 966 (64.5%) |
| 19 to 25 Years | 166 (18.4%) | 769 (85.2%) |
| 25 to 34 Years | 247 (22.0%) | 735 (65.3%) |
| 35 to 44 Years | 140 (11.5%) | 951 (78.4%) |
| 45 to 54 Years | 222 (18.5%) | 934 (78.0%) |
| 55 to 64 Years | 414 (24.9%) | 1,147 (68.9%) |
| 65 to 74 Years | 1,614 (97.2%) | 905 (54.5%) |
| 75 Years and over | 1,031 (100.0%) | 627 (60.8%) |
| Total | 4,639 (42.0%) | 7,534 (68.2%) |
Disability Status by Sex by Age in Birch Bay
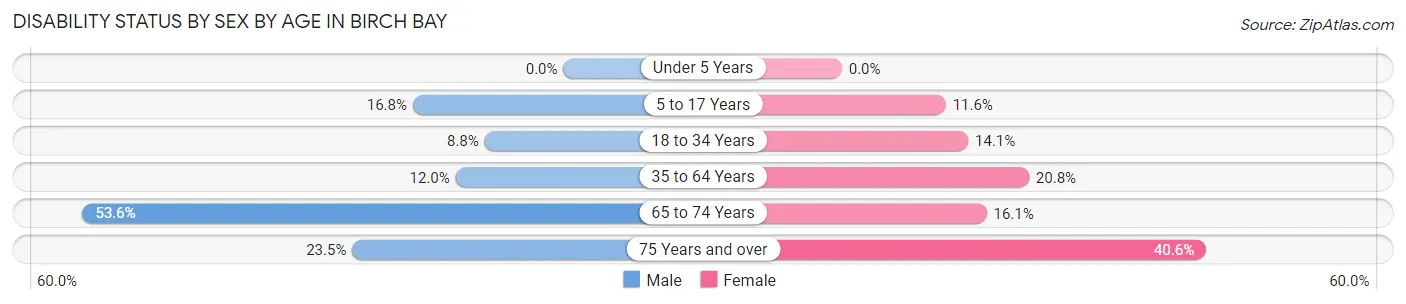
| Age Bracket | Male | Female |
| Under 5 Years | 0 (0.0%) | 0 (0.0%) |
| 5 to 17 Years | 168 (16.8%) | 65 (11.6%) |
| 18 to 34 Years | 113 (8.8%) | 114 (14.1%) |
| 35 to 64 Years | 258 (12.0%) | 401 (20.8%) |
| 65 to 74 Years | 398 (53.6%) | 148 (16.1%) |
| 75 Years and over | 134 (23.5%) | 187 (40.6%) |
Disability Class by Sex by Age in Birch Bay
Disability Class: Hearing Difficulty
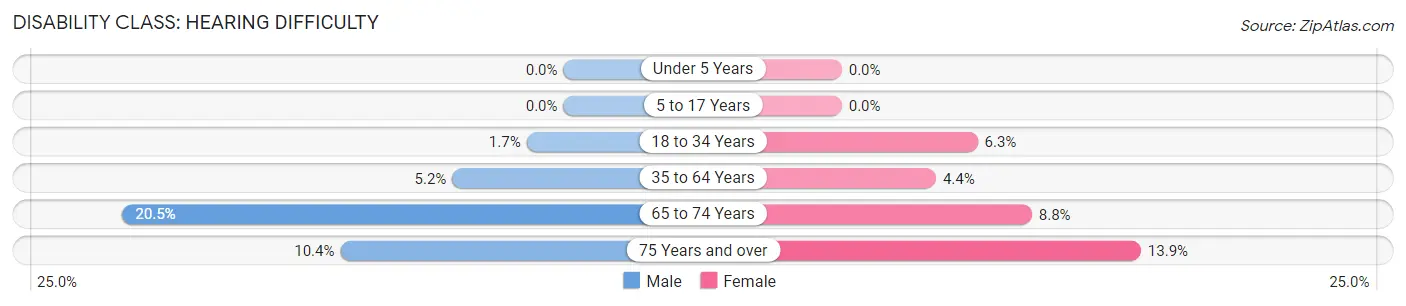
| Age Bracket | Male | Female |
| Under 5 Years | 0 (0.0%) | 0 (0.0%) |
| 5 to 17 Years | 0 (0.0%) | 0 (0.0%) |
| 18 to 34 Years | 22 (1.7%) | 51 (6.3%) |
| 35 to 64 Years | 111 (5.2%) | 84 (4.4%) |
| 65 to 74 Years | 152 (20.5%) | 81 (8.8%) |
| 75 Years and over | 59 (10.3%) | 64 (13.9%) |
Disability Class: Vision Difficulty
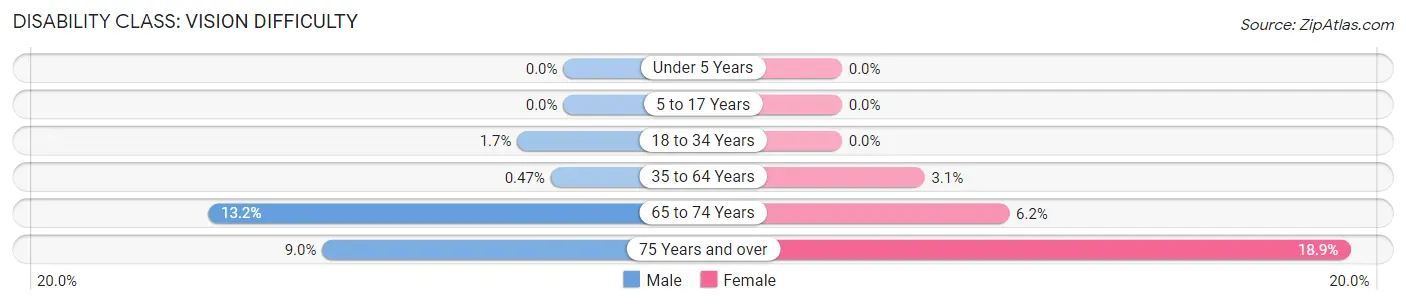
| Age Bracket | Male | Female |
| Under 5 Years | 0 (0.0%) | 0 (0.0%) |
| 5 to 17 Years | 0 (0.0%) | 0 (0.0%) |
| 18 to 34 Years | 22 (1.7%) | 0 (0.0%) |
| 35 to 64 Years | 10 (0.5%) | 59 (3.1%) |
| 65 to 74 Years | 98 (13.2%) | 57 (6.2%) |
| 75 Years and over | 51 (8.9%) | 87 (18.9%) |
Disability Class: Cognitive Difficulty
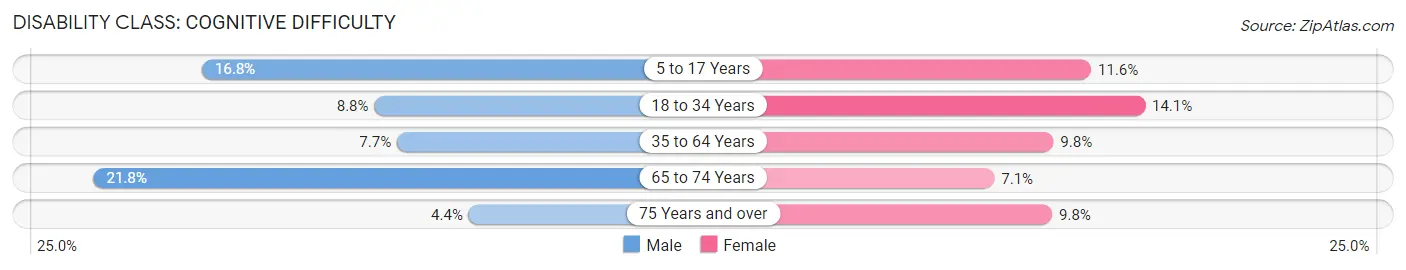
| Age Bracket | Male | Female |
| 5 to 17 Years | 168 (16.8%) | 65 (11.6%) |
| 18 to 34 Years | 113 (8.8%) | 114 (14.1%) |
| 35 to 64 Years | 166 (7.7%) | 189 (9.8%) |
| 65 to 74 Years | 162 (21.8%) | 65 (7.1%) |
| 75 Years and over | 25 (4.4%) | 45 (9.8%) |
Disability Class: Ambulatory Difficulty
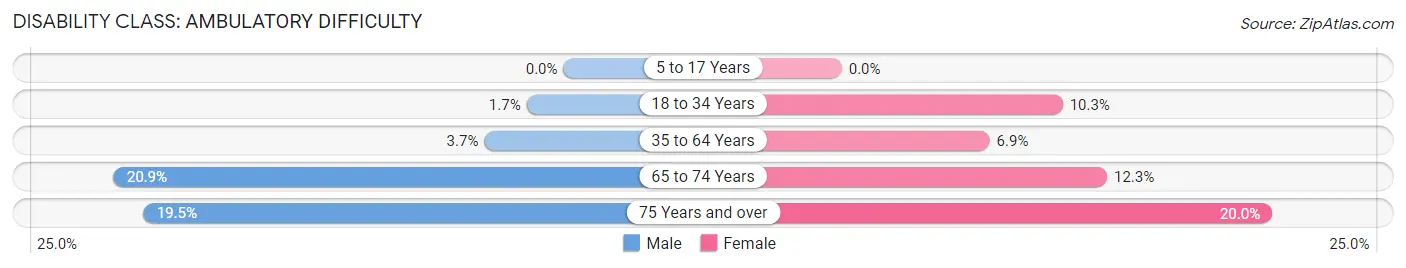
| Age Bracket | Male | Female |
| 5 to 17 Years | 0 (0.0%) | 0 (0.0%) |
| 18 to 34 Years | 22 (1.7%) | 83 (10.2%) |
| 35 to 64 Years | 79 (3.7%) | 132 (6.9%) |
| 65 to 74 Years | 155 (20.9%) | 113 (12.3%) |
| 75 Years and over | 111 (19.5%) | 92 (20.0%) |
Disability Class: Self-Care Difficulty
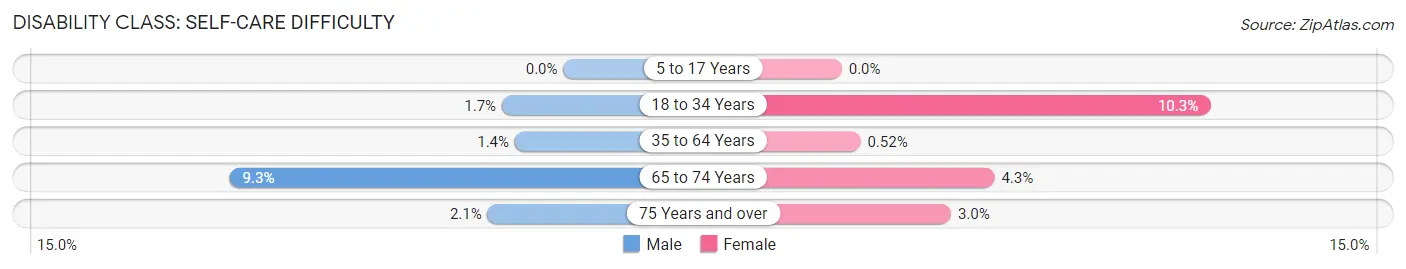
| Age Bracket | Male | Female |
| 5 to 17 Years | 0 (0.0%) | 0 (0.0%) |
| 18 to 34 Years | 22 (1.7%) | 83 (10.2%) |
| 35 to 64 Years | 29 (1.3%) | 10 (0.5%) |
| 65 to 74 Years | 69 (9.3%) | 39 (4.3%) |
| 75 Years and over | 12 (2.1%) | 14 (3.0%) |
Technology Access in Birch Bay
Computing Device Access in Birch Bay
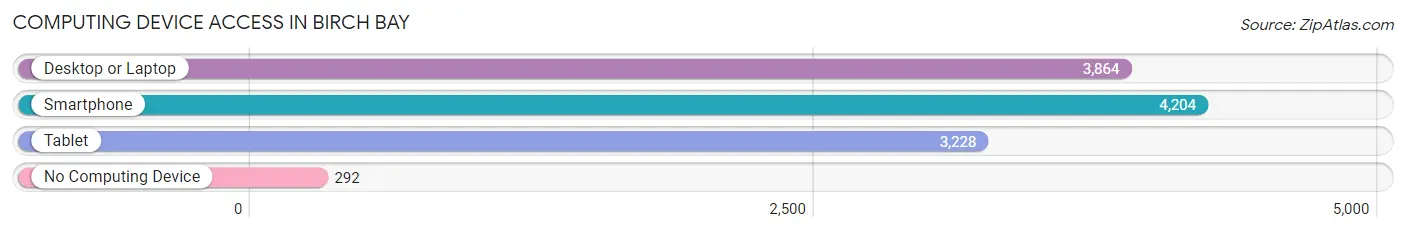
| Device Type | # Households | % Households |
| Desktop or Laptop | 3,864 | 79.7% |
| Smartphone | 4,204 | 86.8% |
| Tablet | 3,228 | 66.6% |
| No Computing Device | 292 | 6.0% |
| Total | 4,846 | 100.0% |
Internet Access in Birch Bay
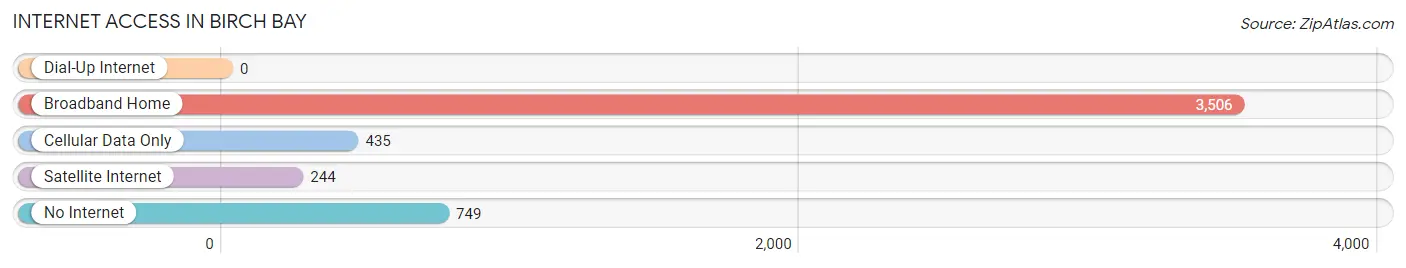
| Internet Type | # Households | % Households |
| Dial-Up Internet | 0 | 0.0% |
| Broadband Home | 3,506 | 72.4% |
| Cellular Data Only | 435 | 9.0% |
| Satellite Internet | 244 | 5.0% |
| No Internet | 749 | 15.5% |
| Total | 4,846 | 100.0% |
Birch Bay Summary
Birch Bay is a small unincorporated community located in Whatcom County, Washington, United States. It is situated on the northern shore of Birch Bay, a bay of the Strait of Georgia, and is approximately 8 miles (13 km) north of the city of Bellingham. The population of Birch Bay was estimated to be 8,845 in 2019.
History
The area now known as Birch Bay was first inhabited by the Lummi people, who used the area for fishing and gathering shellfish. The first European settlers arrived in the area in the late 19th century, and the area was officially incorporated as a town in 1909. The town was named after the bay, which was named by Captain George Vancouver in 1792 after the abundance of birch trees in the area.
In the early 20th century, the area was a popular tourist destination, with many visitors coming to enjoy the beach and the nearby Semiahmoo Resort. The resort was destroyed by a fire in the 1950s, but the area remains a popular tourist destination.
Geography
Birch Bay is located in Whatcom County, Washington, on the northern shore of Birch Bay, a bay of the Strait of Georgia. The bay is approximately 8 miles (13 km) long and 1 mile (1.6 km) wide. The area is surrounded by the Chuckanut Mountains to the east and the San Juan Islands to the west.
The climate in Birch Bay is mild and temperate, with warm summers and cool winters. The average annual temperature is around 50°F (10°C). The area receives an average of 35 inches (89 cm) of precipitation per year, with most of it falling in the winter months.
Economy
The economy of Birch Bay is largely based on tourism. The area is home to several resorts and hotels, as well as a variety of restaurants and shops. The area is also popular for its recreational activities, such as fishing, boating, and beachcombing.
The area is also home to several businesses, including a marina, a boatyard, and a seafood processing plant. The area is also home to a number of small businesses, such as art galleries, gift shops, and antique stores.
Demographics
As of 2019, the population of Birch Bay was estimated to be 8,845. The population is predominantly white (90.3%), with the remaining population being made up of Hispanic (3.3%), Asian (2.2%), and African American (1.2%) residents. The median household income in the area is $60,945, and the median home value is $360,000.
Conclusion
Birch Bay is a small unincorporated community located in Whatcom County, Washington, United States. It is situated on the northern shore of Birch Bay, a bay of the Strait of Georgia, and is approximately 8 miles (13 km) north of the city of Bellingham. The area was first inhabited by the Lummi people, and was officially incorporated as a town in 1909. The economy of Birch Bay is largely based on tourism, with the area being home to several resorts and hotels, as well as a variety of restaurants and shops. The population of Birch Bay was estimated to be 8,845 in 2019, with the population being predominantly white.
Common Questions
What is Per Capita Income in Birch Bay?
Per Capita income in Birch Bay is $41,895.
What is the Median Family Income in Birch Bay?
Median Family Income in Birch Bay is $86,183.
What is the Median Household income in Birch Bay?
Median Household Income in Birch Bay is $78,172.
What is Income or Wage Gap in Birch Bay?
Income or Wage Gap in Birch Bay is 34.3%.
Women in Birch Bay earn 65.7 cents for every dollar earned by a man.
What is Family Income Deficit in Birch Bay?
Family Income Deficit in Birch Bay is $8,316.
Families that are below poverty line in Birch Bay earn $8,316 less on average than the poverty threshold level.
What is Inequality or Gini Index in Birch Bay?
Inequality or Gini Index in Birch Bay is 0.43.
What is the Total Population of Birch Bay?
Total Population of Birch Bay is 11,142.
What is the Total Male Population of Birch Bay?
Total Male Population of Birch Bay is 6,000.
What is the Total Female Population of Birch Bay?
Total Female Population of Birch Bay is 5,142.
What is the Ratio of Males per 100 Females in Birch Bay?
There are 116.69 Males per 100 Females in Birch Bay.
What is the Ratio of Females per 100 Males in Birch Bay?
There are 85.70 Females per 100 Males in Birch Bay.
What is the Median Population Age in Birch Bay?
Median Population Age in Birch Bay is 44.9 Years.
What is the Average Family Size in Birch Bay
Average Family Size in Birch Bay is 2.9 People.
What is the Average Household Size in Birch Bay
Average Household Size in Birch Bay is 2.3 People.
How Large is the Labor Force in Birch Bay?
There are 4,778 People in the Labor Forcein in Birch Bay.
What is the Percentage of People in the Labor Force in Birch Bay?
52.0% of People are in the Labor Force in Birch Bay.
What is the Unemployment Rate in Birch Bay?
Unemployment Rate in Birch Bay is 5.3%.