Chehalis, WA Map & Demographics
Chehalis Map
Chehalis Overview
$30,125
PER CAPITA INCOME
$77,385
AVG FAMILY INCOME
$61,378
AVG HOUSEHOLD INCOME
32.7%
WAGE / INCOME GAP [ % ]
67.3¢/ $1
WAGE / INCOME GAP [ $ ]
0.42
INEQUALITY / GINI INDEX
7,512
TOTAL POPULATION
4,110
MALE POPULATION
3,402
FEMALE POPULATION
120.81
MALES / 100 FEMALES
82.77
FEMALES / 100 MALES
32.2
MEDIAN AGE
3.1
AVG FAMILY SIZE
2.4
AVG HOUSEHOLD SIZE
3,514
LABOR FORCE [ PEOPLE ]
60.5%
PERCENT IN LABOR FORCE
9.8%
UNEMPLOYMENT RATE
Chehalis Zip Codes
Chehalis Area Codes
Income in Chehalis
Income Overview in Chehalis
Per Capita Income in Chehalis is $30,125, while median incomes of families and households are $77,385 and $61,378 respectively.
| Characteristic | Number | Measure |
| Per Capita Income | 7,512 | $30,125 |
| Median Family Income | 1,575 | $77,385 |
| Mean Family Income | 1,575 | $84,889 |
| Median Household Income | 2,939 | $61,378 |
| Mean Household Income | 2,939 | $74,708 |
| Income Deficit | 1,575 | $0 |
| Wage / Income Gap (%) | 7,512 | 32.68% |
| Wage / Income Gap ($) | 7,512 | 67.32¢ per $1 |
| Gini / Inequality Index | 7,512 | 0.42 |
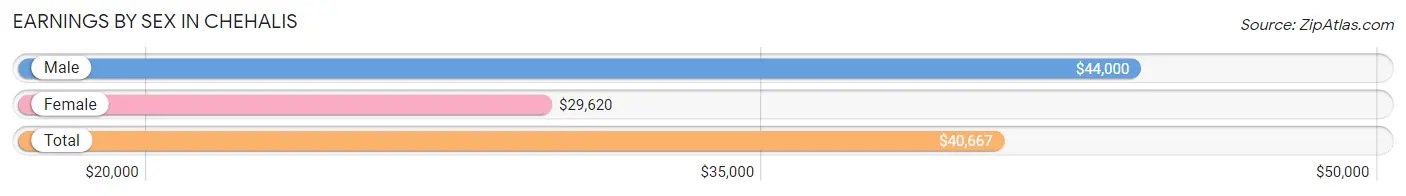
Earnings by Sex in Chehalis
Average Earnings in Chehalis are $40,667, $44,000 for men and $29,620 for women, a difference of 32.7%.
| Sex | Number | Average Earnings |
| Male | 2,206 (60.3%) | $44,000 |
| Female | 1,454 (39.7%) | $29,620 |
| Total | 3,660 (100.0%) | $40,667 |
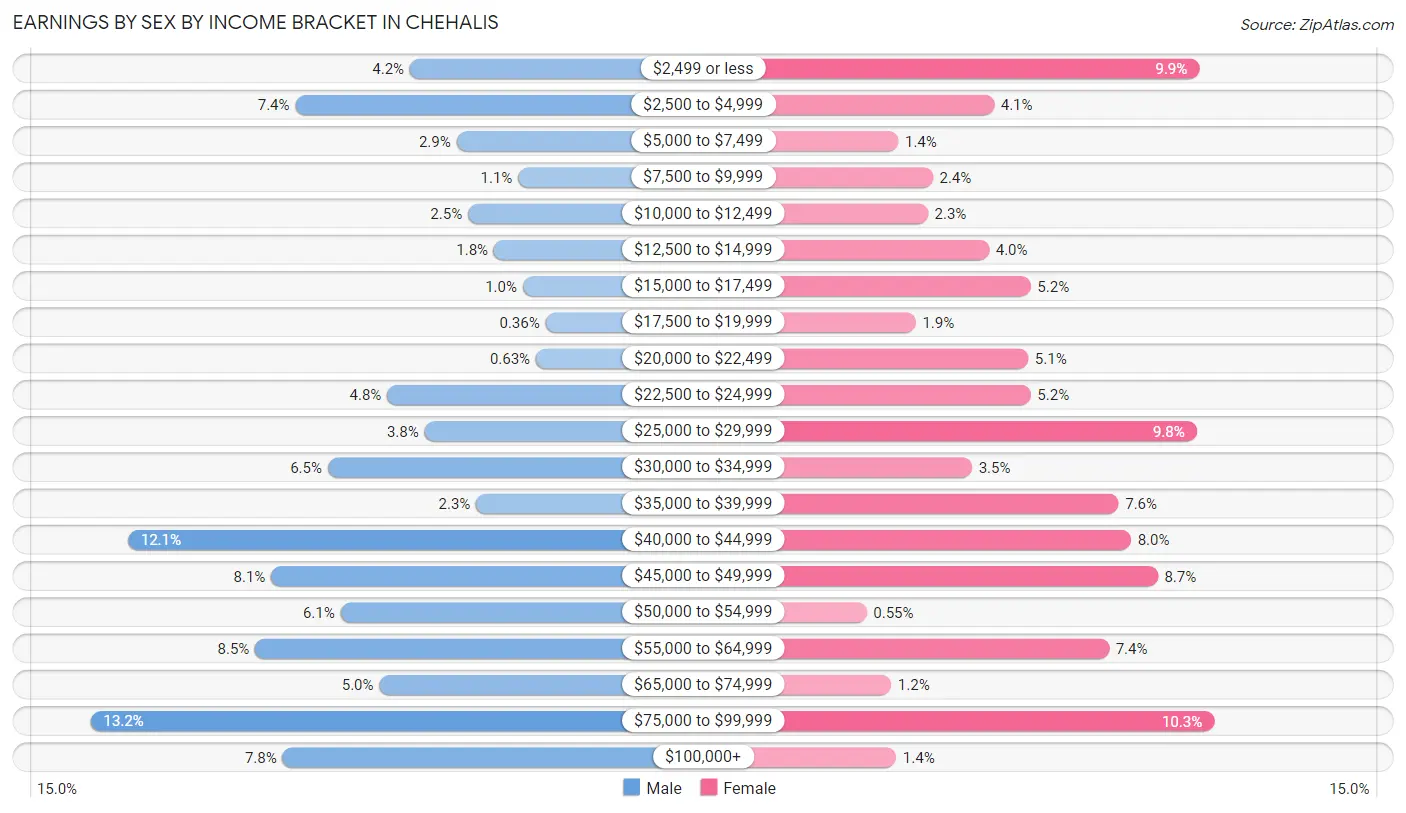
Earnings by Sex by Income Bracket in Chehalis
The most common earnings brackets in Chehalis are $75,000 to $99,999 for men (290 | 13.2%) and $75,000 to $99,999 for women (150 | 10.3%).
| Income | Male | Female |
| $2,499 or less | 92 (4.2%) | 144 (9.9%) |
| $2,500 to $4,999 | 163 (7.4%) | 60 (4.1%) |
| $5,000 to $7,499 | 63 (2.9%) | 21 (1.4%) |
| $7,500 to $9,999 | 25 (1.1%) | 35 (2.4%) |
| $10,000 to $12,499 | 56 (2.5%) | 33 (2.3%) |
| $12,500 to $14,999 | 40 (1.8%) | 58 (4.0%) |
| $15,000 to $17,499 | 22 (1.0%) | 75 (5.2%) |
| $17,500 to $19,999 | 8 (0.4%) | 28 (1.9%) |
| $20,000 to $22,499 | 14 (0.6%) | 74 (5.1%) |
| $22,500 to $24,999 | 106 (4.8%) | 75 (5.2%) |
| $25,000 to $29,999 | 83 (3.8%) | 143 (9.8%) |
| $30,000 to $34,999 | 143 (6.5%) | 51 (3.5%) |
| $35,000 to $39,999 | 51 (2.3%) | 111 (7.6%) |
| $40,000 to $44,999 | 267 (12.1%) | 116 (8.0%) |
| $45,000 to $49,999 | 178 (8.1%) | 127 (8.7%) |
| $50,000 to $54,999 | 135 (6.1%) | 8 (0.5%) |
| $55,000 to $64,999 | 188 (8.5%) | 107 (7.4%) |
| $65,000 to $74,999 | 111 (5.0%) | 18 (1.2%) |
| $75,000 to $99,999 | 290 (13.2%) | 150 (10.3%) |
| $100,000+ | 171 (7.7%) | 20 (1.4%) |
| Total | 2,206 (100.0%) | 1,454 (100.0%) |
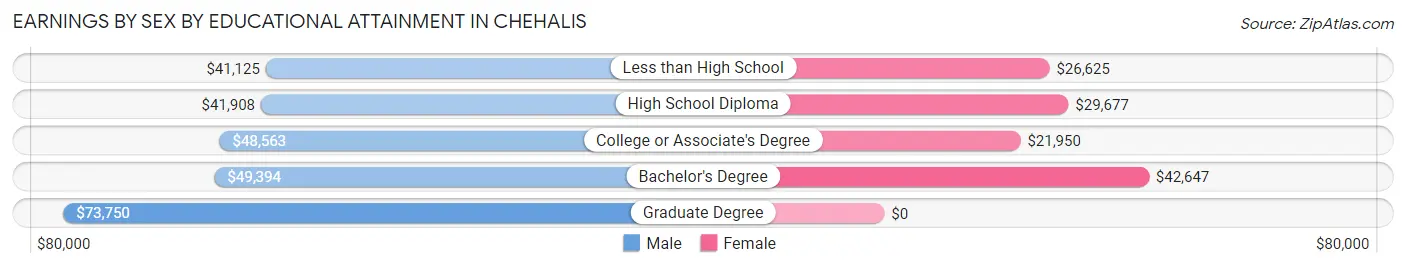
Earnings by Sex by Educational Attainment in Chehalis
Average earnings in Chehalis are $48,445 for men and $29,680 for women, a difference of 38.7%. Men with an educational attainment of graduate degree enjoy the highest average annual earnings of $73,750, while those with less than high school education earn the least with $41,125. Women with an educational attainment of bachelor's degree earn the most with the average annual earnings of $42,647, while those with college or associate's degree education have the smallest earnings of $21,950.
| Educational Attainment | Male Income | Female Income |
| Less than High School | $41,125 | $26,625 |
| High School Diploma | $41,908 | $29,677 |
| College or Associate's Degree | $48,563 | $21,950 |
| Bachelor's Degree | $49,394 | $42,647 |
| Graduate Degree | $73,750 | $0 |
| Total | $48,445 | $29,680 |
Family Income in Chehalis
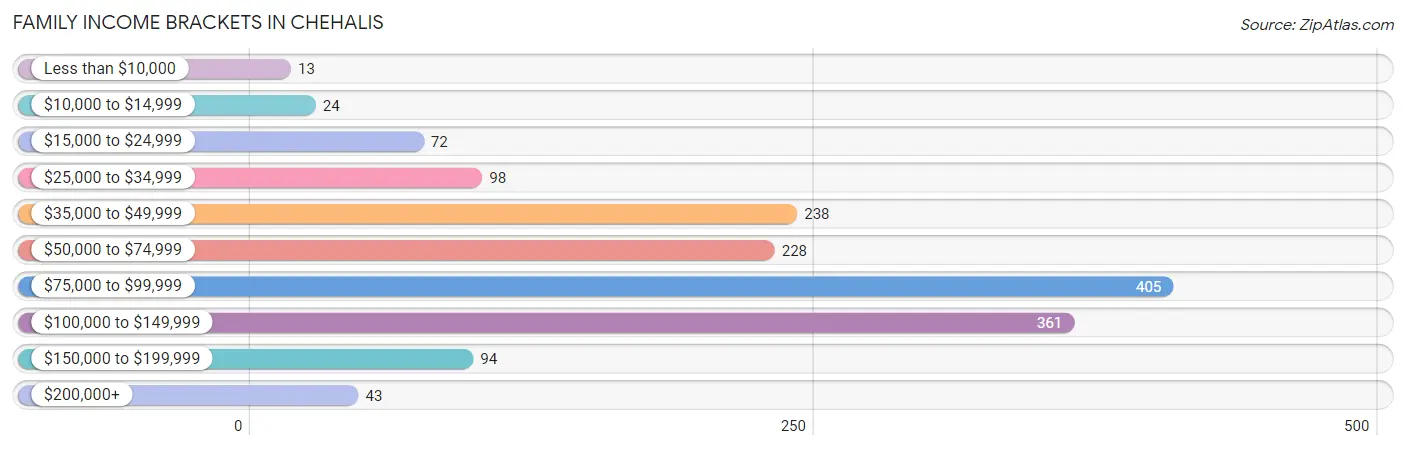
Family Income Brackets in Chehalis
According to the Chehalis family income data, there are 405 families falling into the $75,000 to $99,999 income range, which is the most common income bracket and makes up 25.7% of all families. Conversely, the less than $10,000 income bracket is the least frequent group with only 13 families (0.8%) belonging to this category.
| Income Bracket | # Families | % Families |
| Less than $10,000 | 13 | 0.8% |
| $10,000 to $14,999 | 24 | 1.5% |
| $15,000 to $24,999 | 72 | 4.6% |
| $25,000 to $34,999 | 98 | 6.2% |
| $35,000 to $49,999 | 238 | 15.1% |
| $50,000 to $74,999 | 228 | 14.5% |
| $75,000 to $99,999 | 405 | 25.7% |
| $100,000 to $149,999 | 361 | 22.9% |
| $150,000 to $199,999 | 94 | 6.0% |
| $200,000+ | 43 | 2.7% |
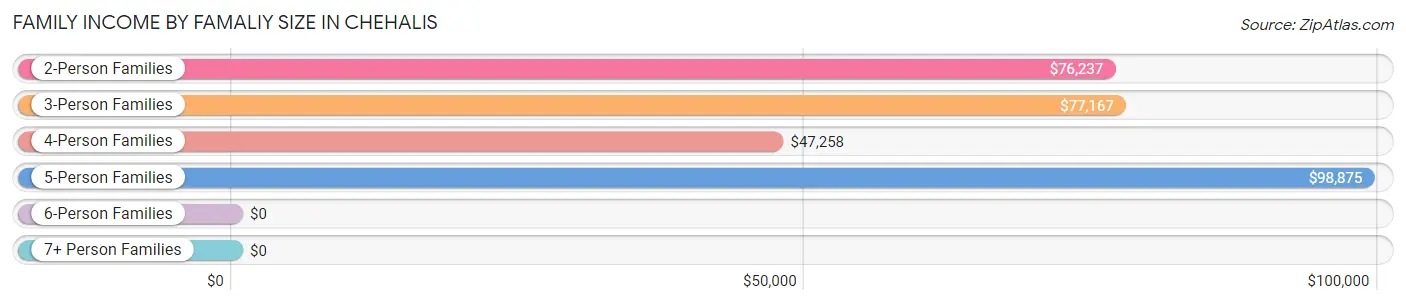
Family Income by Famaliy Size in Chehalis
5-person families (203 | 12.9%) account for the highest median family income in Chehalis with $98,875 per family, while 2-person families (690 | 43.8%) have the highest median income of $38,118 per family member.
| Income Bracket | # Families | Median Income |
| 2-Person Families | 690 (43.8%) | $76,237 |
| 3-Person Families | 348 (22.1%) | $77,167 |
| 4-Person Families | 274 (17.4%) | $47,258 |
| 5-Person Families | 203 (12.9%) | $98,875 |
| 6-Person Families | 42 (2.7%) | $0 |
| 7+ Person Families | 18 (1.1%) | $0 |
| Total | 1,575 (100.0%) | $77,385 |
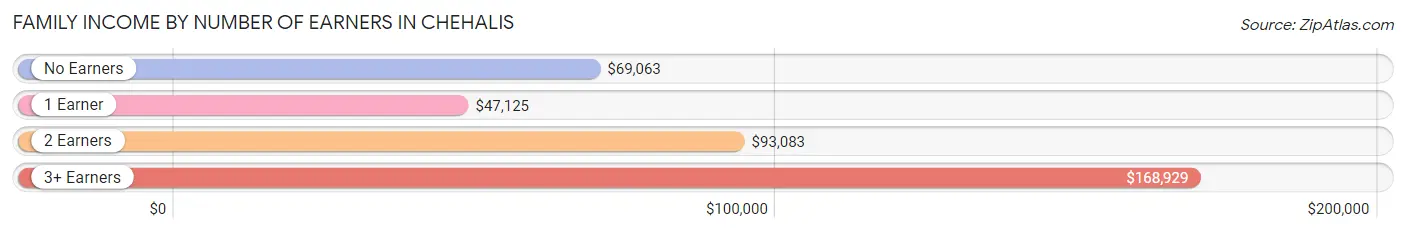
Family Income by Number of Earners in Chehalis
The median family income in Chehalis is $77,385, with families comprising 3+ earners (96) having the highest median family income of $168,929, while families with 1 earner (642) have the lowest median family income of $47,125, accounting for 6.1% and 40.8% of families, respectively.
| Number of Earners | # Families | Median Income |
| No Earners | 142 (9.0%) | $69,063 |
| 1 Earner | 642 (40.8%) | $47,125 |
| 2 Earners | 695 (44.1%) | $93,083 |
| 3+ Earners | 96 (6.1%) | $168,929 |
| Total | 1,575 (100.0%) | $77,385 |
Household Income in Chehalis
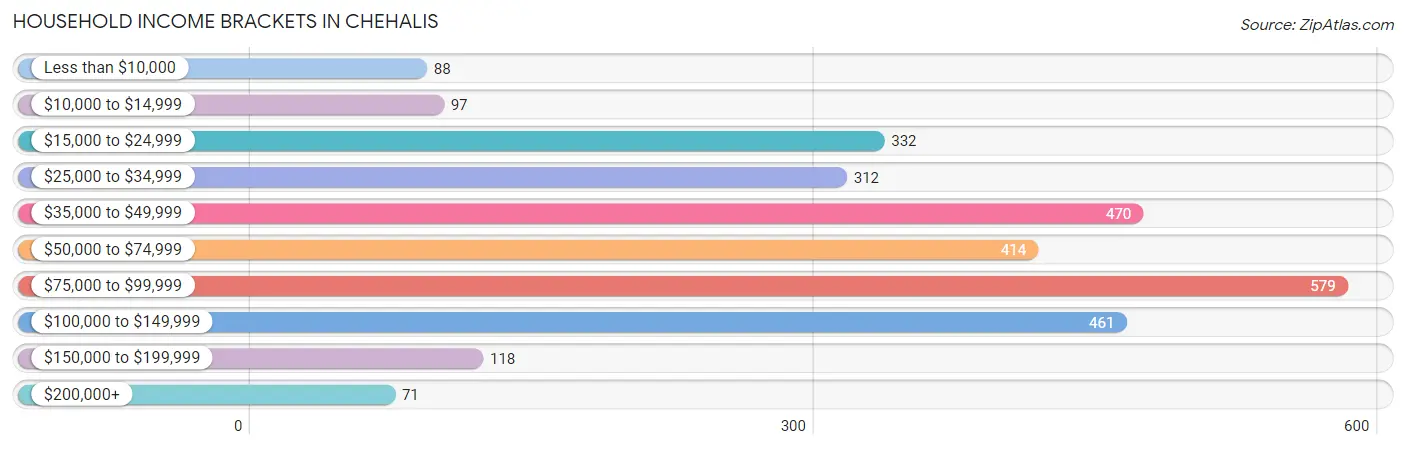
Household Income Brackets in Chehalis
With 579 households falling in the category, the $75,000 to $99,999 income range is the most frequent in Chehalis, accounting for 19.7% of all households. In contrast, only 71 households (2.4%) fall into the $200,000+ income bracket, making it the least populous group.
| Income Bracket | # Households | % Households |
| Less than $10,000 | 88 | 3.0% |
| $10,000 to $14,999 | 97 | 3.3% |
| $15,000 to $24,999 | 332 | 11.3% |
| $25,000 to $34,999 | 312 | 10.6% |
| $35,000 to $49,999 | 470 | 16.0% |
| $50,000 to $74,999 | 414 | 14.1% |
| $75,000 to $99,999 | 579 | 19.7% |
| $100,000 to $149,999 | 461 | 15.7% |
| $150,000 to $199,999 | 118 | 4.0% |
| $200,000+ | 71 | 2.4% |
Household Income by Householder Age in Chehalis
The median household income in Chehalis is $61,378, with the highest median household income of $78,226 found in the 45 to 64 years age bracket for the primary householder. A total of 704 households (23.9%) fall into this category. Meanwhile, the 65+ years age bracket for the primary householder has the lowest median household income of $31,756, with 949 households (32.3%) in this group.
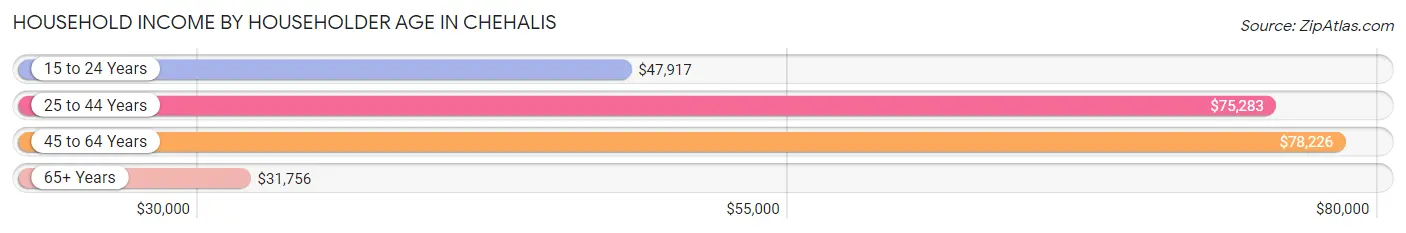
| Income Bracket | # Households | Median Income |
| 15 to 24 Years | 110 (3.7%) | $47,917 |
| 25 to 44 Years | 1,176 (40.0%) | $75,283 |
| 45 to 64 Years | 704 (23.9%) | $78,226 |
| 65+ Years | 949 (32.3%) | $31,756 |
| Total | 2,939 (100.0%) | $61,378 |
Poverty in Chehalis
Income Below Poverty by Sex and Age in Chehalis
With 14.1% poverty level for males and 11.5% for females among the residents of Chehalis, 15 year old males and 16 and 17 year old females are the most vulnerable to poverty, with 22 males (34.9%) and 10 females (26.3%) in their respective age groups living below the poverty level.
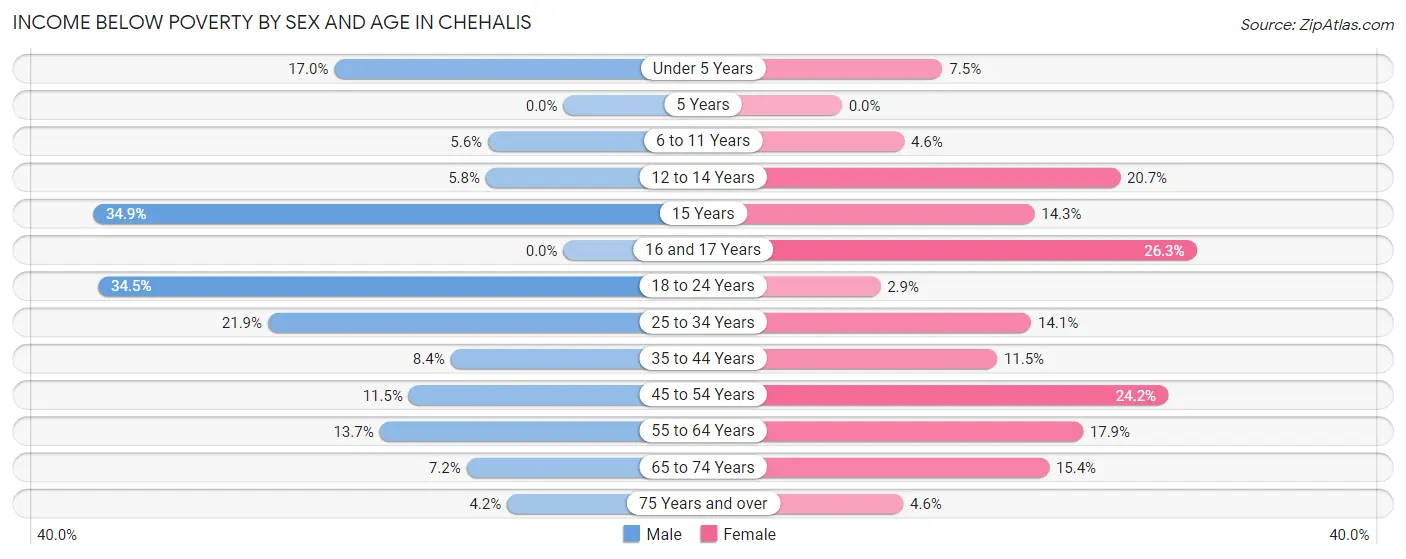
| Age Bracket | Male | Female |
| Under 5 Years | 33 (17.0%) | 23 (7.5%) |
| 5 Years | 0 (0.0%) | 0 (0.0%) |
| 6 to 11 Years | 15 (5.6%) | 16 (4.6%) |
| 12 to 14 Years | 11 (5.8%) | 19 (20.6%) |
| 15 Years | 22 (34.9%) | 3 (14.3%) |
| 16 and 17 Years | 0 (0.0%) | 10 (26.3%) |
| 18 to 24 Years | 124 (34.5%) | 8 (2.9%) |
| 25 to 34 Years | 154 (21.9%) | 94 (14.1%) |
| 35 to 44 Years | 43 (8.4%) | 53 (11.5%) |
| 45 to 54 Years | 38 (11.5%) | 61 (24.2%) |
| 55 to 64 Years | 61 (13.7%) | 41 (17.9%) |
| 65 to 74 Years | 23 (7.2%) | 48 (15.4%) |
| 75 Years and over | 12 (4.2%) | 14 (4.5%) |
| Total | 536 (14.1%) | 390 (11.5%) |
Income Above Poverty by Sex and Age in Chehalis
According to the poverty statistics in Chehalis, males aged 5 years and females aged 5 years are the age groups that are most secure financially, with 100.0% of males and 100.0% of females in these age groups living above the poverty line.
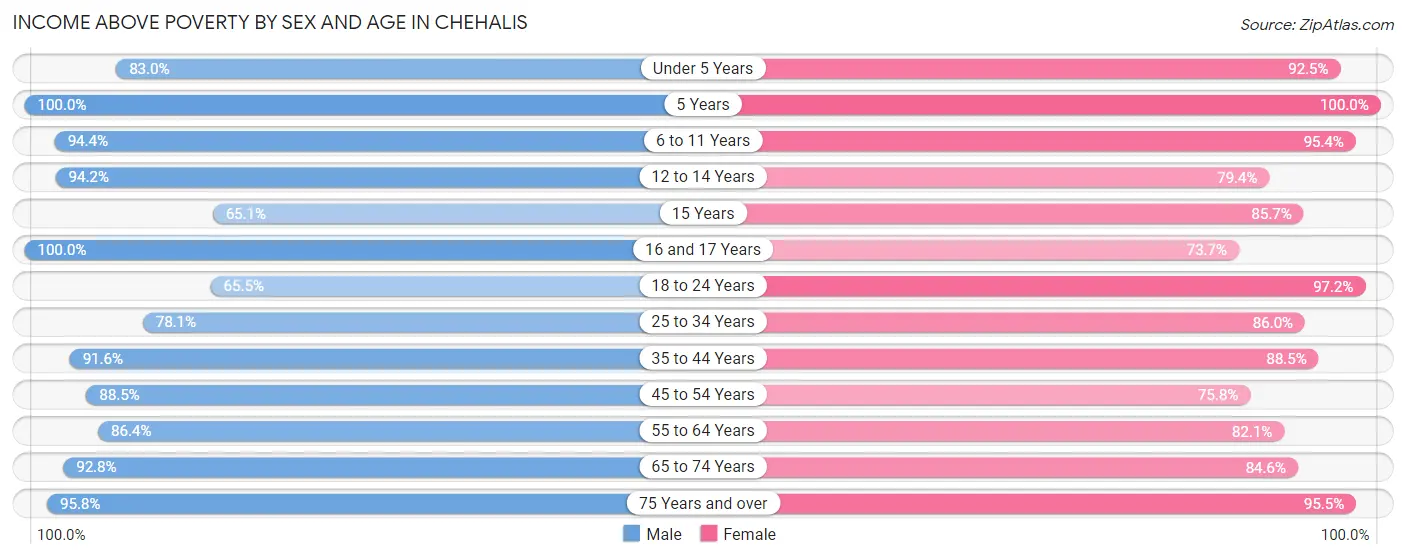
| Age Bracket | Male | Female |
| Under 5 Years | 161 (83.0%) | 285 (92.5%) |
| 5 Years | 62 (100.0%) | 75 (100.0%) |
| 6 to 11 Years | 253 (94.4%) | 330 (95.4%) |
| 12 to 14 Years | 180 (94.2%) | 73 (79.3%) |
| 15 Years | 41 (65.1%) | 18 (85.7%) |
| 16 and 17 Years | 53 (100.0%) | 28 (73.7%) |
| 18 to 24 Years | 235 (65.5%) | 273 (97.2%) |
| 25 to 34 Years | 548 (78.1%) | 575 (86.0%) |
| 35 to 44 Years | 470 (91.6%) | 407 (88.5%) |
| 45 to 54 Years | 293 (88.5%) | 191 (75.8%) |
| 55 to 64 Years | 386 (86.4%) | 188 (82.1%) |
| 65 to 74 Years | 297 (92.8%) | 264 (84.6%) |
| 75 Years and over | 275 (95.8%) | 294 (95.5%) |
| Total | 3,254 (85.9%) | 3,001 (88.5%) |
Income Below Poverty Among Married-Couple Families in Chehalis
The poverty statistics for married-couple families in Chehalis show that 4.5% or 47 of the total 1,044 families live below the poverty line. Families with 1 or 2 children have the highest poverty rate of 13.6%, comprising of 35 families. On the other hand, families with 3 or 4 children have the lowest poverty rate of 0.0%, which includes 0 families.
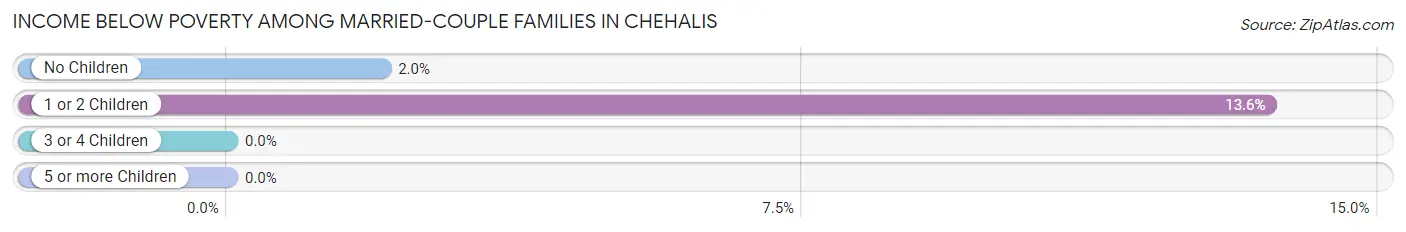
| Children | Above Poverty | Below Poverty |
| No Children | 587 (98.0%) | 12 (2.0%) |
| 1 or 2 Children | 223 (86.4%) | 35 (13.6%) |
| 3 or 4 Children | 187 (100.0%) | 0 (0.0%) |
| 5 or more Children | 0 (0.0%) | 0 (0.0%) |
| Total | 997 (95.5%) | 47 (4.5%) |
Income Below Poverty Among Single-Parent Households in Chehalis
According to the poverty data in Chehalis, 12.2% or 29 single-father households and 5.8% or 17 single-mother households are living below the poverty line. Among single-father households, those with 3 or 4 children have the highest poverty rate, with 8 households (47.1%) experiencing poverty. Likewise, among single-mother households, those with 3 or 4 children have the highest poverty rate, with 10 households (7.6%) falling below the poverty line.
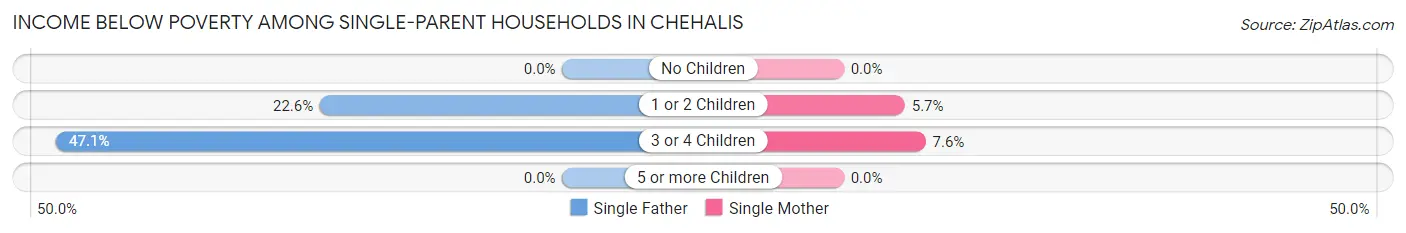
| Children | Single Father | Single Mother |
| No Children | 0 (0.0%) | 0 (0.0%) |
| 1 or 2 Children | 21 (22.6%) | 7 (5.7%) |
| 3 or 4 Children | 8 (47.1%) | 10 (7.6%) |
| 5 or more Children | 0 (0.0%) | 0 (0.0%) |
| Total | 29 (12.2%) | 17 (5.8%) |
Income Below Poverty Among Married-Couple vs Single-Parent Households in Chehalis
The poverty data for Chehalis shows that 47 of the married-couple family households (4.5%) and 46 of the single-parent households (8.7%) are living below the poverty level. Within the married-couple family households, those with 1 or 2 children have the highest poverty rate, with 35 households (13.6%) falling below the poverty line. Among the single-parent households, those with 1 or 2 children have the highest poverty rate, with 28 household (13.0%) living below poverty.
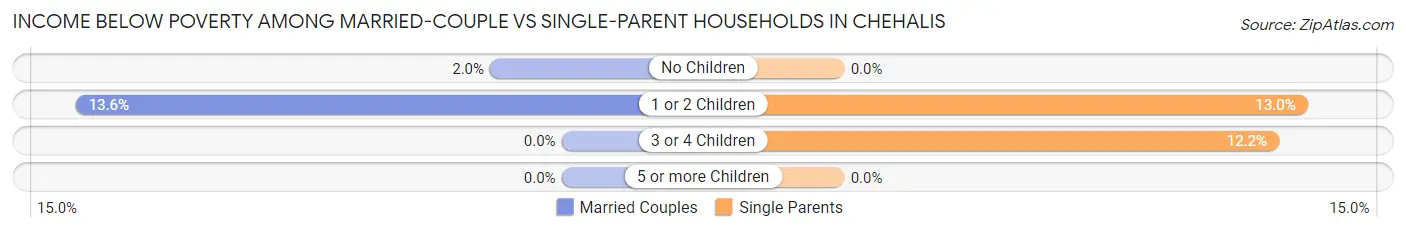
| Children | Married-Couple Families | Single-Parent Households |
| No Children | 12 (2.0%) | 0 (0.0%) |
| 1 or 2 Children | 35 (13.6%) | 28 (13.0%) |
| 3 or 4 Children | 0 (0.0%) | 18 (12.2%) |
| 5 or more Children | 0 (0.0%) | 0 (0.0%) |
| Total | 47 (4.5%) | 46 (8.7%) |
Race in Chehalis
The most populous races in Chehalis are White / Caucasian (6,011 | 80.0%), Hispanic or Latino (978 | 13.0%), and Two or more Races (919 | 12.2%).
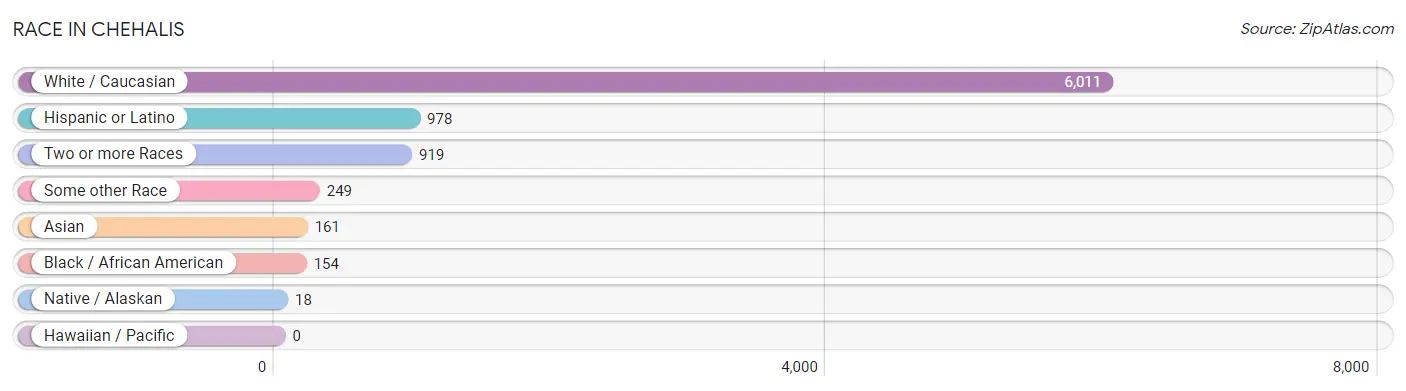
| Race | # Population | % Population |
| Asian | 161 | 2.1% |
| Black / African American | 154 | 2.1% |
| Hawaiian / Pacific | 0 | 0.0% |
| Hispanic or Latino | 978 | 13.0% |
| Native / Alaskan | 18 | 0.2% |
| White / Caucasian | 6,011 | 80.0% |
| Two or more Races | 919 | 12.2% |
| Some other Race | 249 | 3.3% |
| Total | 7,512 | 100.0% |
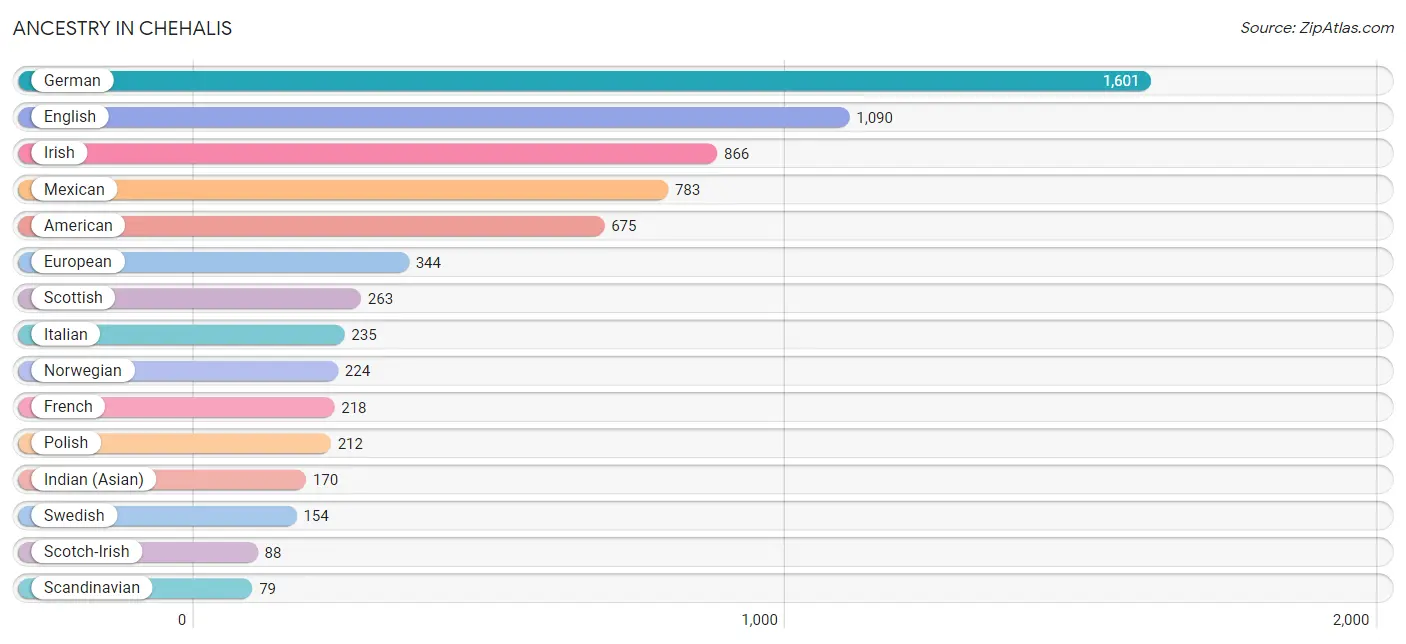
Ancestry in Chehalis
The most populous ancestries reported in Chehalis are German (1,601 | 21.3%), English (1,090 | 14.5%), Irish (866 | 11.5%), Mexican (783 | 10.4%), and American (675 | 9.0%), together accounting for 66.8% of all Chehalis residents.
| Ancestry | # Population | % Population |
| African | 31 | 0.4% |
| American | 675 | 9.0% |
| Arab | 16 | 0.2% |
| Austrian | 27 | 0.4% |
| Belgian | 16 | 0.2% |
| British | 47 | 0.6% |
| Bulgarian | 11 | 0.2% |
| Burmese | 15 | 0.2% |
| Canadian | 48 | 0.6% |
| Cherokee | 75 | 1.0% |
| Chippewa | 6 | 0.1% |
| Czech | 8 | 0.1% |
| Danish | 62 | 0.8% |
| Delaware | 3 | 0.0% |
| Dutch | 69 | 0.9% |
| English | 1,090 | 14.5% |
| European | 344 | 4.6% |
| Finnish | 45 | 0.6% |
| French | 218 | 2.9% |
| French American Indian | 8 | 0.1% |
| French Canadian | 18 | 0.2% |
| German | 1,601 | 21.3% |
| Greek | 31 | 0.4% |
| Indian (Asian) | 170 | 2.3% |
| Iranian | 38 | 0.5% |
| Irish | 866 | 11.5% |
| Iroquois | 27 | 0.4% |
| Italian | 235 | 3.1% |
| Kenyan | 3 | 0.0% |
| Korean | 19 | 0.3% |
| Laotian | 6 | 0.1% |
| Mexican | 783 | 10.4% |
| Native Hawaiian | 4 | 0.1% |
| Northern European | 9 | 0.1% |
| Norwegian | 224 | 3.0% |
| Peruvian | 75 | 1.0% |
| Polish | 212 | 2.8% |
| Puerto Rican | 45 | 0.6% |
| Puget Sound Salish | 7 | 0.1% |
| Romanian | 7 | 0.1% |
| Russian | 53 | 0.7% |
| Scandinavian | 79 | 1.1% |
| Scotch-Irish | 88 | 1.2% |
| Scottish | 263 | 3.5% |
| Serbian | 9 | 0.1% |
| Sioux | 38 | 0.5% |
| South American | 75 | 1.0% |
| Spaniard | 9 | 0.1% |
| Spanish | 26 | 0.4% |
| Sri Lankan | 32 | 0.4% |
| Subsaharan African | 34 | 0.4% |
| Swedish | 154 | 2.1% |
| Swiss | 56 | 0.7% |
| Tsimshian | 8 | 0.1% |
| Ukrainian | 11 | 0.2% |
| Welsh | 24 | 0.3% |
| Yup'ik | 5 | 0.1% | View All 57 Rows |
Immigrants in Chehalis
The most numerous immigrant groups reported in Chehalis came from Latin America (294 | 3.9%), Central America (241 | 3.2%), Mexico (230 | 3.1%), Asia (71 | 0.9%), and Peru (53 | 0.7%), together accounting for 11.8% of all Chehalis residents.
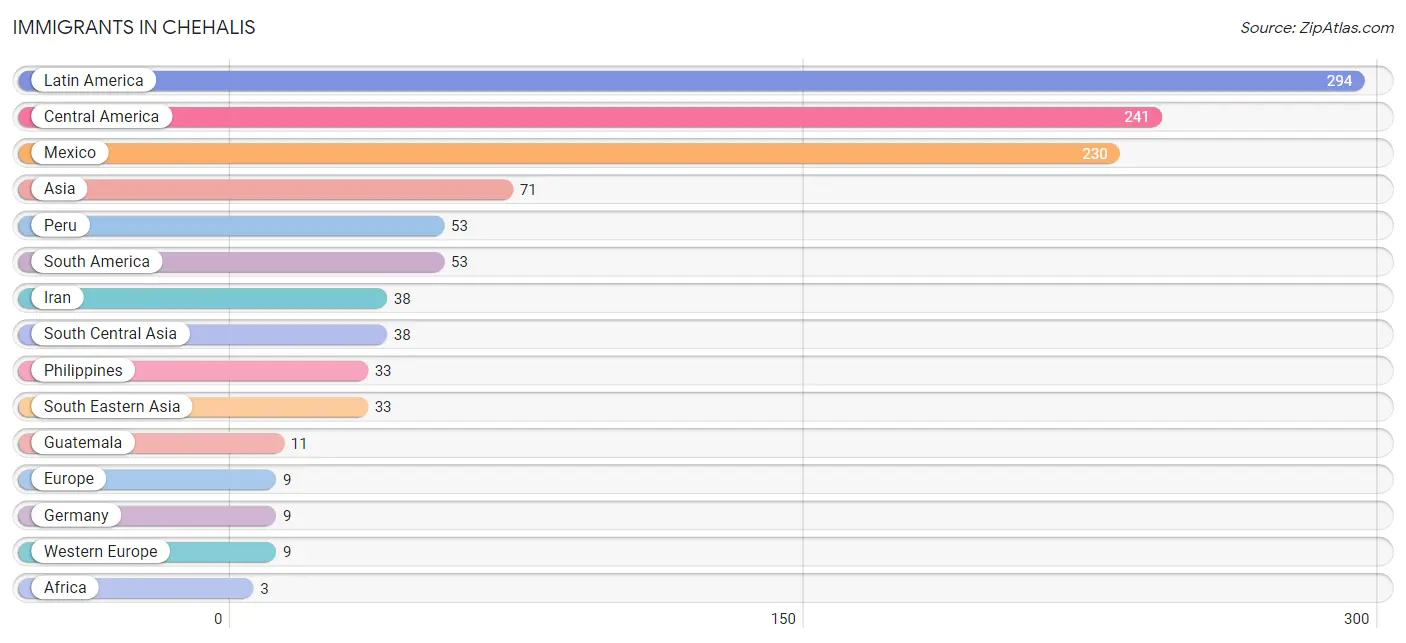
| Immigration Origin | # Population | % Population |
| Africa | 3 | 0.0% |
| Asia | 71 | 0.9% |
| Central America | 241 | 3.2% |
| Eastern Africa | 3 | 0.0% |
| Europe | 9 | 0.1% |
| Germany | 9 | 0.1% |
| Guatemala | 11 | 0.2% |
| Iran | 38 | 0.5% |
| Kenya | 3 | 0.0% |
| Latin America | 294 | 3.9% |
| Mexico | 230 | 3.1% |
| Peru | 53 | 0.7% |
| Philippines | 33 | 0.4% |
| South America | 53 | 0.7% |
| South Central Asia | 38 | 0.5% |
| South Eastern Asia | 33 | 0.4% |
| Western Europe | 9 | 0.1% | View All 17 Rows |
Sex and Age in Chehalis
Sex and Age in Chehalis
The most populous age groups in Chehalis are 25 to 29 Years (397 | 9.7%) for men and 25 to 29 Years (378 | 11.1%) for women.
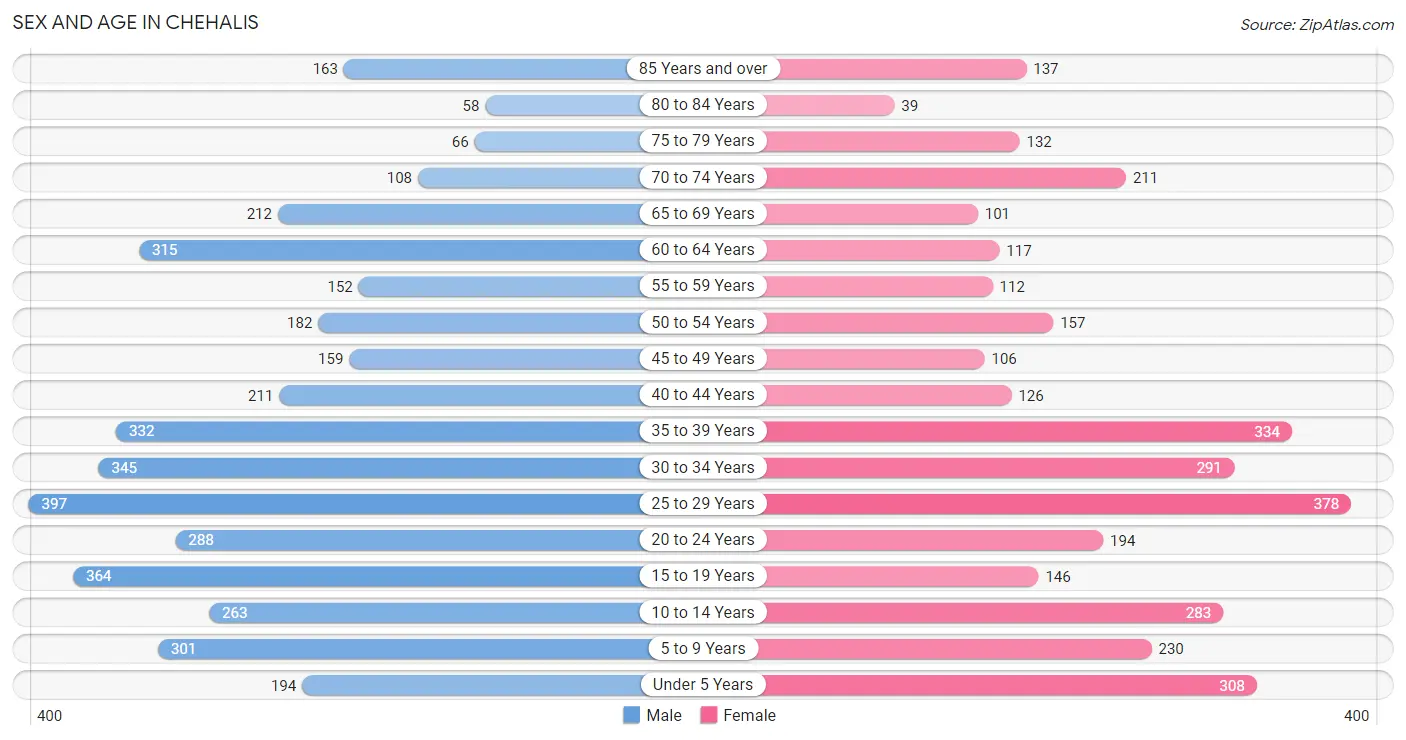
| Age Bracket | Male | Female |
| Under 5 Years | 194 (4.7%) | 308 (9.0%) |
| 5 to 9 Years | 301 (7.3%) | 230 (6.8%) |
| 10 to 14 Years | 263 (6.4%) | 283 (8.3%) |
| 15 to 19 Years | 364 (8.9%) | 146 (4.3%) |
| 20 to 24 Years | 288 (7.0%) | 194 (5.7%) |
| 25 to 29 Years | 397 (9.7%) | 378 (11.1%) |
| 30 to 34 Years | 345 (8.4%) | 291 (8.6%) |
| 35 to 39 Years | 332 (8.1%) | 334 (9.8%) |
| 40 to 44 Years | 211 (5.1%) | 126 (3.7%) |
| 45 to 49 Years | 159 (3.9%) | 106 (3.1%) |
| 50 to 54 Years | 182 (4.4%) | 157 (4.6%) |
| 55 to 59 Years | 152 (3.7%) | 112 (3.3%) |
| 60 to 64 Years | 315 (7.7%) | 117 (3.4%) |
| 65 to 69 Years | 212 (5.2%) | 101 (3.0%) |
| 70 to 74 Years | 108 (2.6%) | 211 (6.2%) |
| 75 to 79 Years | 66 (1.6%) | 132 (3.9%) |
| 80 to 84 Years | 58 (1.4%) | 39 (1.1%) |
| 85 Years and over | 163 (4.0%) | 137 (4.0%) |
| Total | 4,110 (100.0%) | 3,402 (100.0%) |
Families and Households in Chehalis
Median Family Size in Chehalis
The median family size in Chehalis is 3.14 persons per family, with single female/mother families (293 | 18.6%) accounting for the largest median family size of 3.37 persons per family. On the other hand, single male/father families (238 | 15.1%) represent the smallest median family size with 2.26 persons per family.
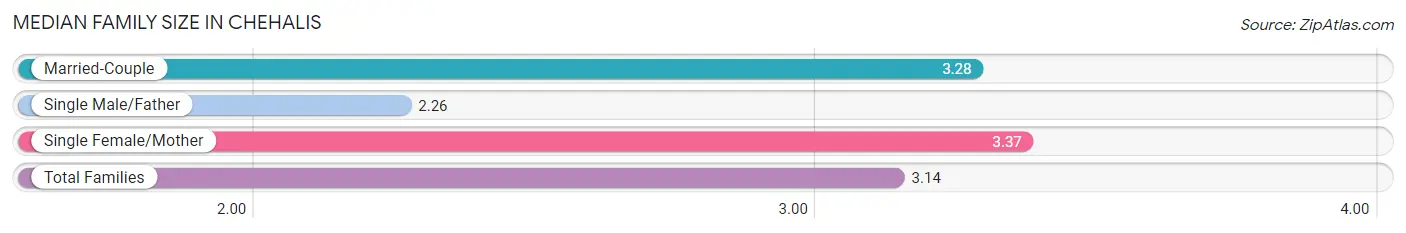
| Family Type | # Families | Family Size |
| Married-Couple | 1,044 (66.3%) | 3.28 |
| Single Male/Father | 238 (15.1%) | 2.26 |
| Single Female/Mother | 293 (18.6%) | 3.37 |
| Total Families | 1,575 (100.0%) | 3.14 |
Median Household Size in Chehalis
The median household size in Chehalis is 2.37 persons per household, with single female/mother households (293 | 10.0%) accounting for the largest median household size of 3.53 persons per household. non-family households (1,364 | 46.4%) represent the smallest median household size with 1.31 persons per household.
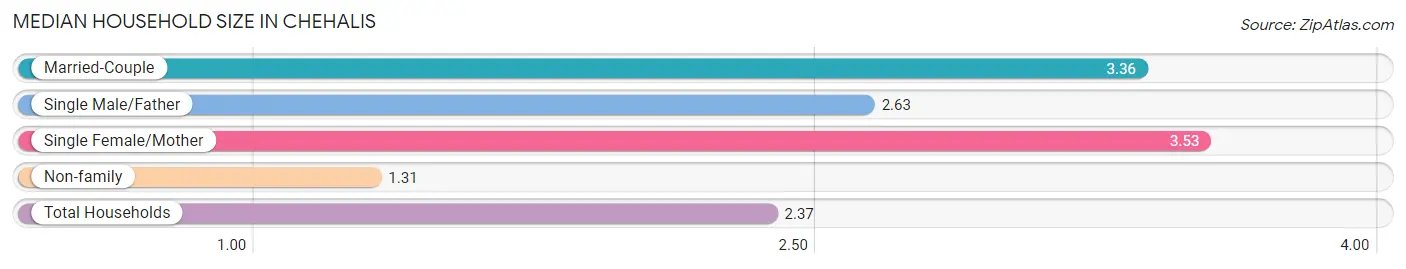
| Household Type | # Households | Household Size |
| Married-Couple | 1,044 (35.5%) | 3.36 |
| Single Male/Father | 238 (8.1%) | 2.63 |
| Single Female/Mother | 293 (10.0%) | 3.53 |
| Non-family | 1,364 (46.4%) | 1.31 |
| Total Households | 2,939 (100.0%) | 2.37 |
Household Size by Marriage Status in Chehalis
Out of a total of 2,939 households in Chehalis, 1,575 (53.6%) are family households, while 1,364 (46.4%) are nonfamily households. The most numerous type of family households are 2-person households, comprising 597, and the most common type of nonfamily households are 1-person households, comprising 1,026.
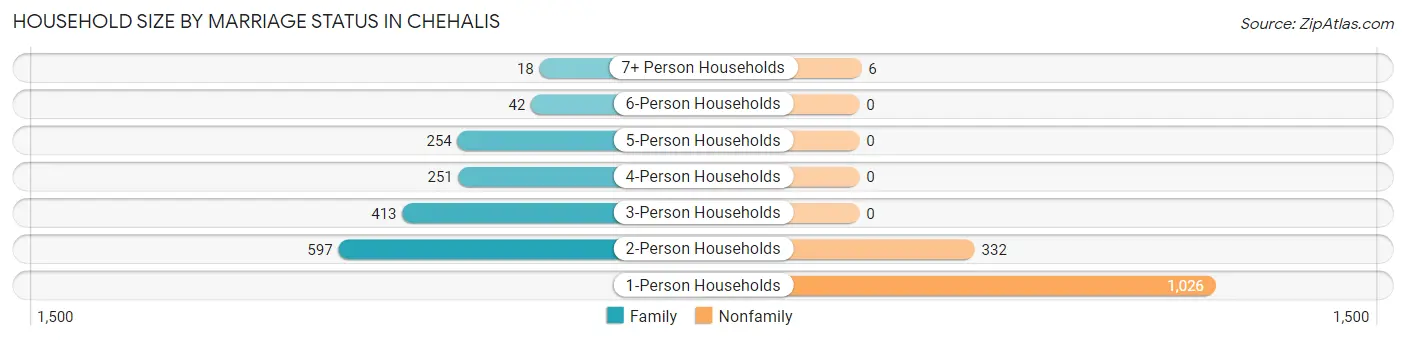
| Household Size | Family Households | Nonfamily Households |
| 1-Person Households | - | 1,026 (34.9%) |
| 2-Person Households | 597 (20.3%) | 332 (11.3%) |
| 3-Person Households | 413 (14.1%) | 0 (0.0%) |
| 4-Person Households | 251 (8.5%) | 0 (0.0%) |
| 5-Person Households | 254 (8.6%) | 0 (0.0%) |
| 6-Person Households | 42 (1.4%) | 0 (0.0%) |
| 7+ Person Households | 18 (0.6%) | 6 (0.2%) |
| Total | 1,575 (53.6%) | 1,364 (46.4%) |
Female Fertility in Chehalis
Fertility by Age in Chehalis
Average fertility rate in Chehalis is 58.0 births per 1,000 women. Women in the age bracket of 20 to 34 years have the highest fertility rate with 72.0 births per 1,000 women. Women in the age bracket of 20 to 34 years acount for 65.3% of all women with births.
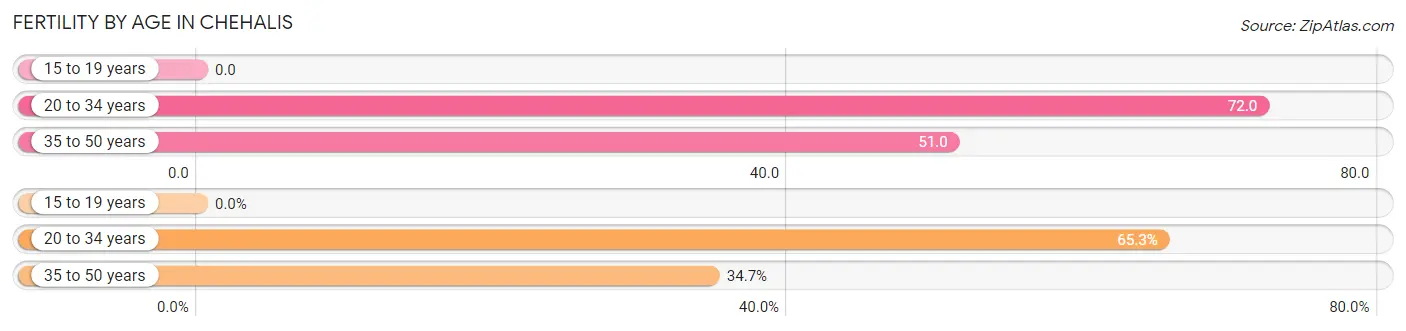
| Age Bracket | Women with Births | Births / 1,000 Women |
| 15 to 19 years | 0 (0.0%) | 0.0 |
| 20 to 34 years | 62 (65.3%) | 72.0 |
| 35 to 50 years | 33 (34.7%) | 51.0 |
| Total | 95 (100.0%) | 58.0 |
Fertility by Age by Marriage Status in Chehalis
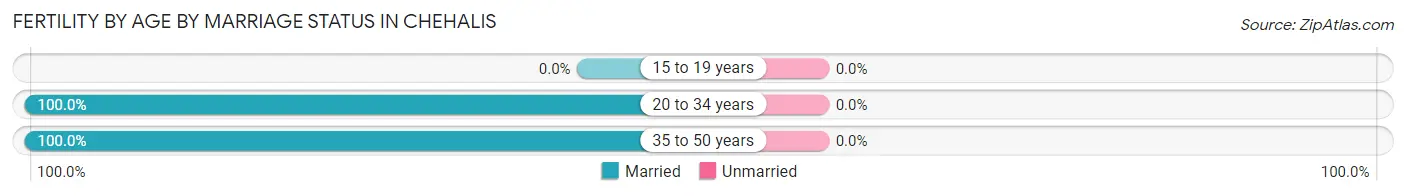
| Age Bracket | Married | Unmarried |
| 15 to 19 years | 0 (0.0%) | 0 (0.0%) |
| 20 to 34 years | 62 (100.0%) | 0 (0.0%) |
| 35 to 50 years | 33 (100.0%) | 0 (0.0%) |
| Total | 95 (100.0%) | 0 (0.0%) |
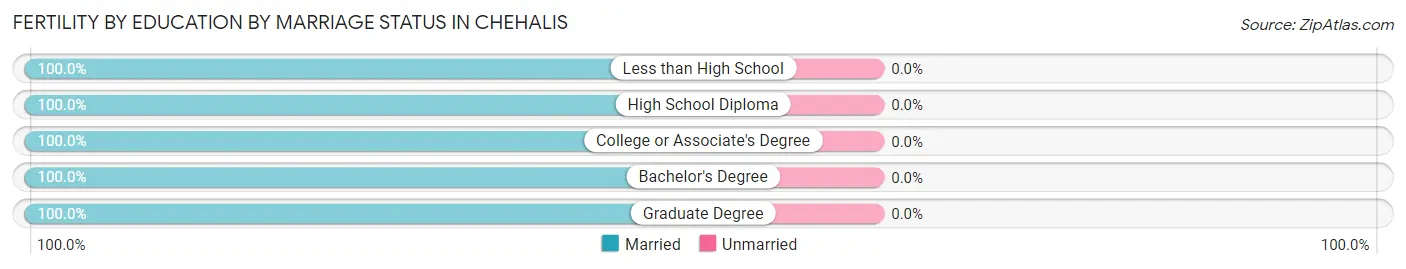
Fertility by Education in Chehalis
Average fertility rate in Chehalis is 58.0 births per 1,000 women. Women with the education attainment of graduate degree have the highest fertility rate of 337.0 births per 1,000 women, while women with the education attainment of college or associate's degree have the lowest fertility at 19.0 births per 1,000 women. Women with the education attainment of graduate degree represent 34.7% of all women with births.
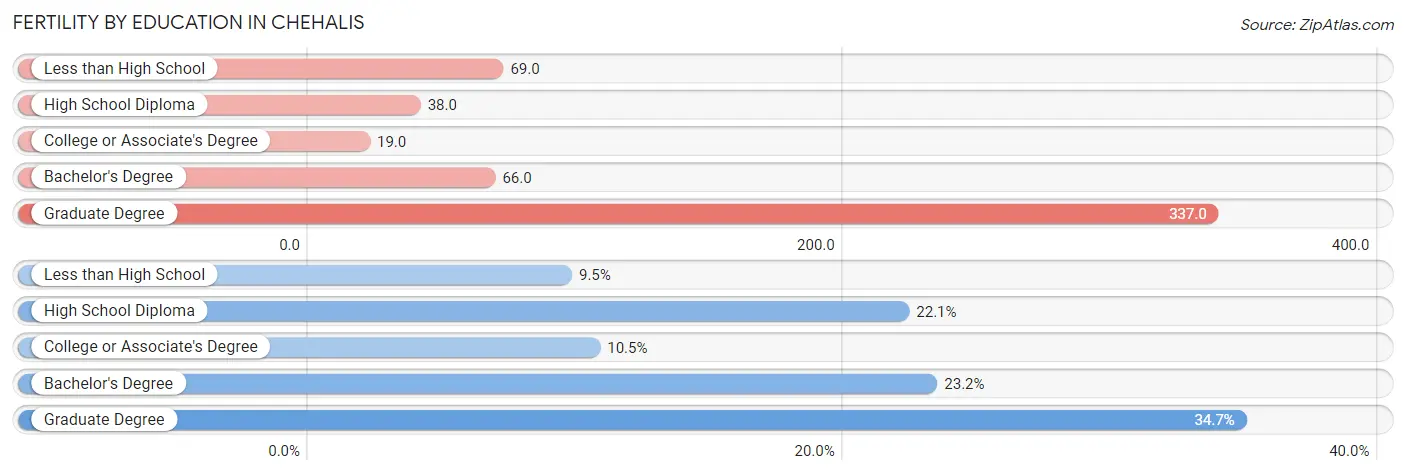
| Educational Attainment | Women with Births | Births / 1,000 Women |
| Less than High School | 9 (9.5%) | 69.0 |
| High School Diploma | 21 (22.1%) | 38.0 |
| College or Associate's Degree | 10 (10.5%) | 19.0 |
| Bachelor's Degree | 22 (23.2%) | 66.0 |
| Graduate Degree | 33 (34.7%) | 337.0 |
| Total | 95 (100.0%) | 58.0 |
Fertility by Education by Marriage Status in Chehalis
| Educational Attainment | Married | Unmarried |
| Less than High School | 9 (100.0%) | 0 (0.0%) |
| High School Diploma | 21 (100.0%) | 0 (0.0%) |
| College or Associate's Degree | 10 (100.0%) | 0 (0.0%) |
| Bachelor's Degree | 22 (100.0%) | 0 (0.0%) |
| Graduate Degree | 33 (100.0%) | 0 (0.0%) |
| Total | 95 (100.0%) | 0 (0.0%) |
Employment Characteristics in Chehalis
Employment by Class of Employer in Chehalis
Among the 3,041 employed individuals in Chehalis, private company employees (1,826 | 60.1%), state government employees (380 | 12.5%), and not-for-profit organizations (326 | 10.7%) make up the most common classes of employment.
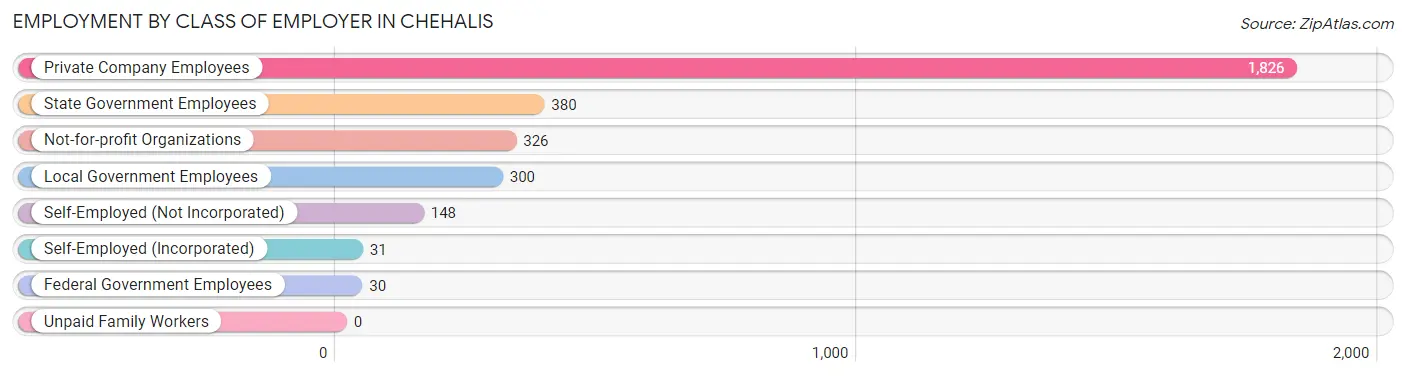
| Employer Class | # Employees | % Employees |
| Private Company Employees | 1,826 | 60.1% |
| Self-Employed (Incorporated) | 31 | 1.0% |
| Self-Employed (Not Incorporated) | 148 | 4.9% |
| Not-for-profit Organizations | 326 | 10.7% |
| Local Government Employees | 300 | 9.9% |
| State Government Employees | 380 | 12.5% |
| Federal Government Employees | 30 | 1.0% |
| Unpaid Family Workers | 0 | 0.0% |
| Total | 3,041 | 100.0% |
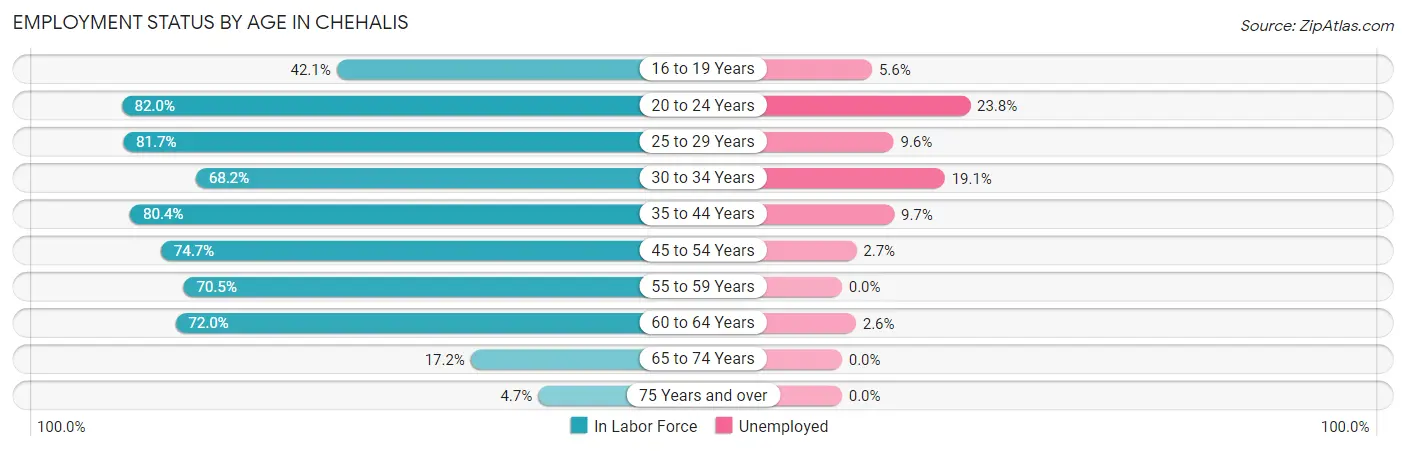
Employment Status by Age in Chehalis
According to the labor force statistics for Chehalis, out of the total population over 16 years of age (5,808), 60.5% or 3,514 individuals are in the labor force, with 9.8% or 344 of them unemployed. The age group with the highest labor force participation rate is 20 to 24 years, with 82.0% or 395 individuals in the labor force. Within the labor force, the 20 to 24 years age range has the highest percentage of unemployed individuals, with 23.8% or 94 of them being unemployed.
| Age Bracket | In Labor Force | Unemployed |
| 16 to 19 Years | 162 (42.1%) | 9 (5.6%) |
| 20 to 24 Years | 395 (82.0%) | 94 (23.8%) |
| 25 to 29 Years | 633 (81.7%) | 61 (9.6%) |
| 30 to 34 Years | 434 (68.2%) | 83 (19.1%) |
| 35 to 44 Years | 806 (80.4%) | 78 (9.7%) |
| 45 to 54 Years | 451 (74.7%) | 12 (2.7%) |
| 55 to 59 Years | 186 (70.5%) | 0 (0.0%) |
| 60 to 64 Years | 311 (72.0%) | 8 (2.6%) |
| 65 to 74 Years | 109 (17.2%) | 0 (0.0%) |
| 75 Years and over | 28 (4.7%) | 0 (0.0%) |
| Total | 3,514 (60.5%) | 344 (9.8%) |
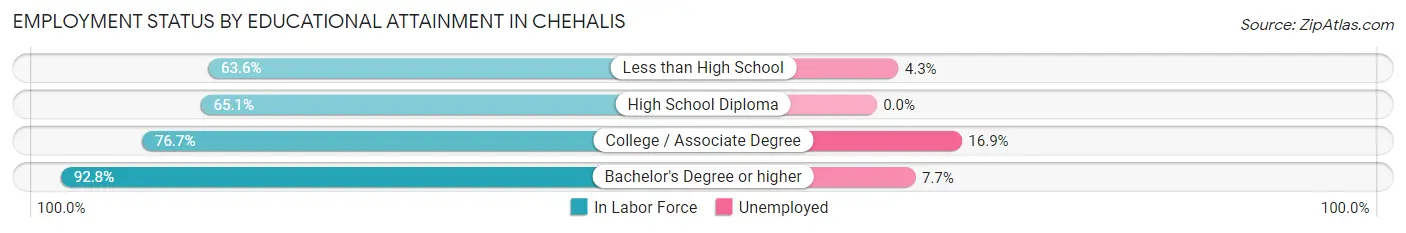
Employment Status by Educational Attainment in Chehalis
According to labor force statistics for Chehalis, 76.0% of individuals (2,823) out of the total population between 25 and 64 years of age (3,714) are in the labor force, with 8.6% or 243 of them being unemployed. The group with the highest labor force participation rate are those with the educational attainment of bachelor's degree or higher, with 92.8% or 874 individuals in the labor force. Within the labor force, individuals with college / associate degree education have the highest percentage of unemployment, with 16.9% or 165 of them being unemployed.
| Educational Attainment | In Labor Force | Unemployed |
| Less than High School | 232 (63.6%) | 16 (4.3%) |
| High School Diploma | 737 (65.1%) | 0 (0.0%) |
| College / Associate Degree | 978 (76.7%) | 215 (16.9%) |
| Bachelor's Degree or higher | 874 (92.8%) | 73 (7.7%) |
| Total | 2,823 (76.0%) | 319 (8.6%) |
Employment Occupations by Sex in Chehalis
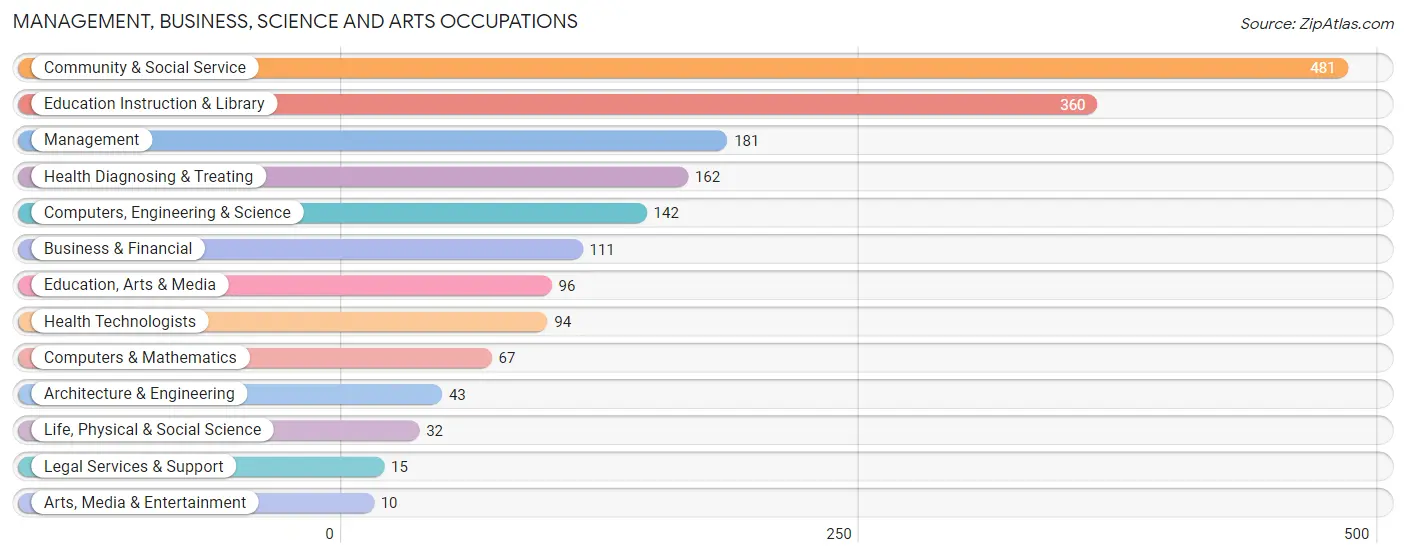
Management, Business, Science and Arts Occupations
The most common Management, Business, Science and Arts occupations in Chehalis are Community & Social Service (481 | 15.2%), Education Instruction & Library (360 | 11.4%), Management (181 | 5.7%), Health Diagnosing & Treating (162 | 5.1%), and Computers, Engineering & Science (142 | 4.5%).
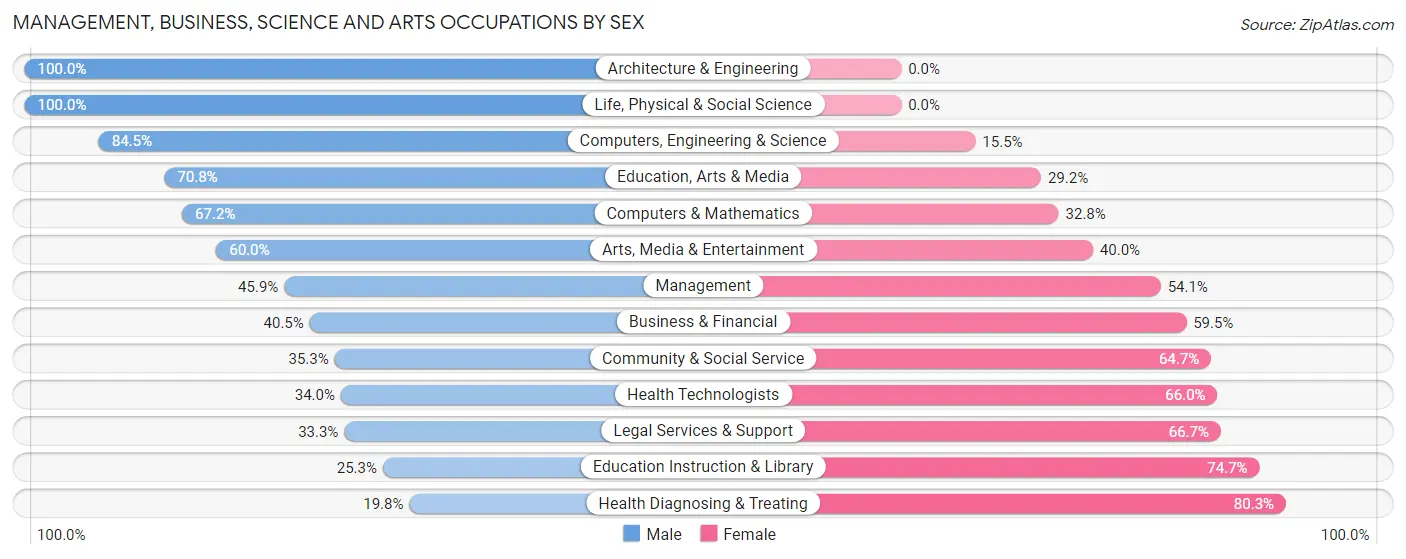
Management, Business, Science and Arts Occupations by Sex
Within the Management, Business, Science and Arts occupations in Chehalis, the most male-oriented occupations are Architecture & Engineering (100.0%), Life, Physical & Social Science (100.0%), and Computers, Engineering & Science (84.5%), while the most female-oriented occupations are Health Diagnosing & Treating (80.2%), Education Instruction & Library (74.7%), and Legal Services & Support (66.7%).
| Occupation | Male | Female |
| Management | 83 (45.9%) | 98 (54.1%) |
| Business & Financial | 45 (40.5%) | 66 (59.5%) |
| Computers, Engineering & Science | 120 (84.5%) | 22 (15.5%) |
| Computers & Mathematics | 45 (67.2%) | 22 (32.8%) |
| Architecture & Engineering | 43 (100.0%) | 0 (0.0%) |
| Life, Physical & Social Science | 32 (100.0%) | 0 (0.0%) |
| Community & Social Service | 170 (35.3%) | 311 (64.7%) |
| Education, Arts & Media | 68 (70.8%) | 28 (29.2%) |
| Legal Services & Support | 5 (33.3%) | 10 (66.7%) |
| Education Instruction & Library | 91 (25.3%) | 269 (74.7%) |
| Arts, Media & Entertainment | 6 (60.0%) | 4 (40.0%) |
| Health Diagnosing & Treating | 32 (19.8%) | 130 (80.2%) |
| Health Technologists | 32 (34.0%) | 62 (66.0%) |
| Total (Category) | 450 (41.8%) | 627 (58.2%) |
| Total (Overall) | 1,898 (60.0%) | 1,267 (40.0%) |
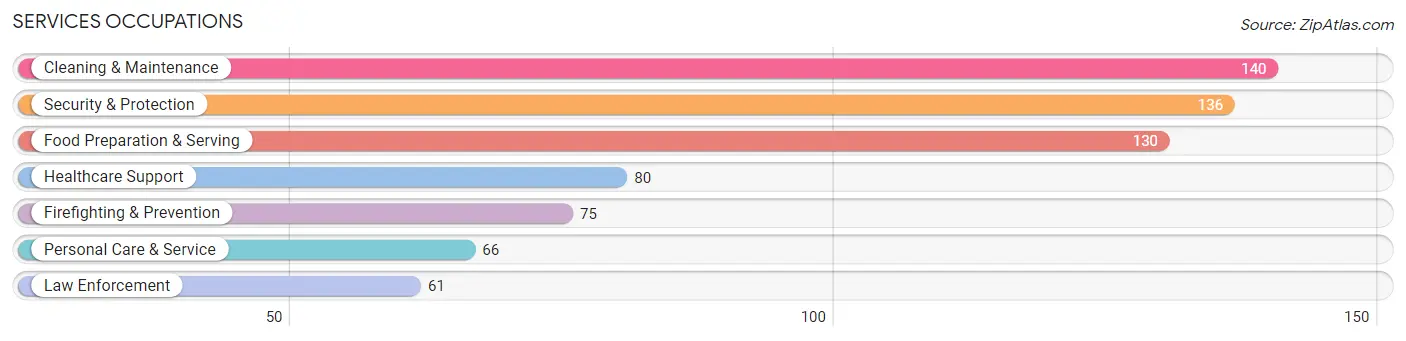
Services Occupations
The most common Services occupations in Chehalis are Cleaning & Maintenance (140 | 4.4%), Security & Protection (136 | 4.3%), Food Preparation & Serving (130 | 4.1%), Healthcare Support (80 | 2.5%), and Firefighting & Prevention (75 | 2.4%).
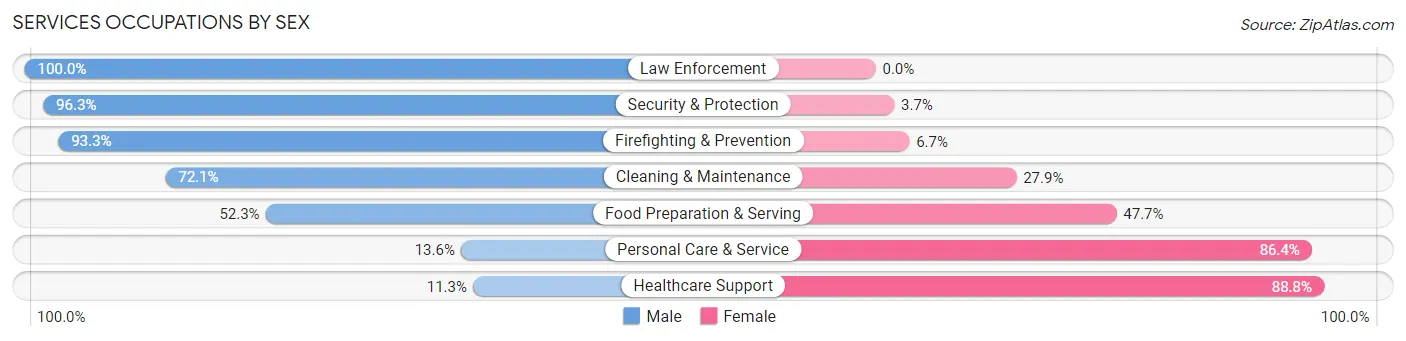
Services Occupations by Sex
Within the Services occupations in Chehalis, the most male-oriented occupations are Law Enforcement (100.0%), Security & Protection (96.3%), and Firefighting & Prevention (93.3%), while the most female-oriented occupations are Healthcare Support (88.7%), Personal Care & Service (86.4%), and Food Preparation & Serving (47.7%).
| Occupation | Male | Female |
| Healthcare Support | 9 (11.3%) | 71 (88.7%) |
| Security & Protection | 131 (96.3%) | 5 (3.7%) |
| Firefighting & Prevention | 70 (93.3%) | 5 (6.7%) |
| Law Enforcement | 61 (100.0%) | 0 (0.0%) |
| Food Preparation & Serving | 68 (52.3%) | 62 (47.7%) |
| Cleaning & Maintenance | 101 (72.1%) | 39 (27.9%) |
| Personal Care & Service | 9 (13.6%) | 57 (86.4%) |
| Total (Category) | 318 (57.6%) | 234 (42.4%) |
| Total (Overall) | 1,898 (60.0%) | 1,267 (40.0%) |
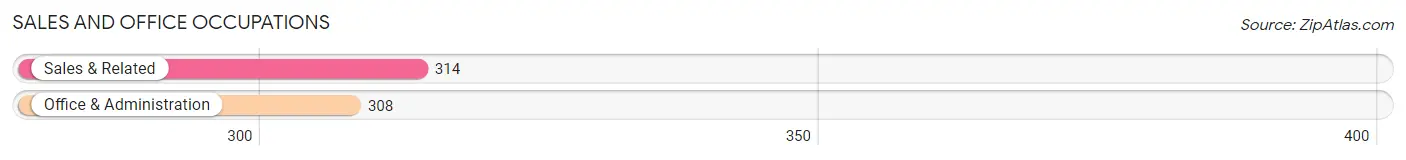
Sales and Office Occupations
The most common Sales and Office occupations in Chehalis are Sales & Related (314 | 9.9%), and Office & Administration (308 | 9.7%).
Sales and Office Occupations by Sex
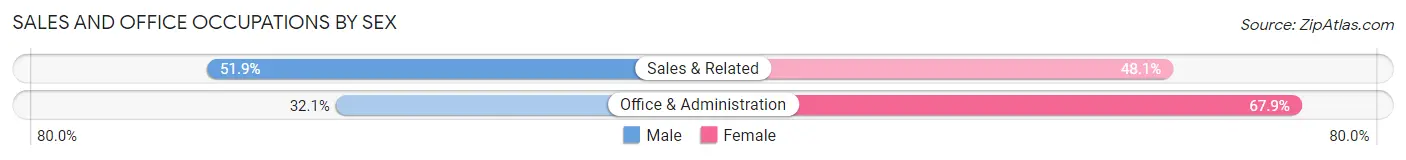
| Occupation | Male | Female |
| Sales & Related | 163 (51.9%) | 151 (48.1%) |
| Office & Administration | 99 (32.1%) | 209 (67.9%) |
| Total (Category) | 262 (42.1%) | 360 (57.9%) |
| Total (Overall) | 1,898 (60.0%) | 1,267 (40.0%) |
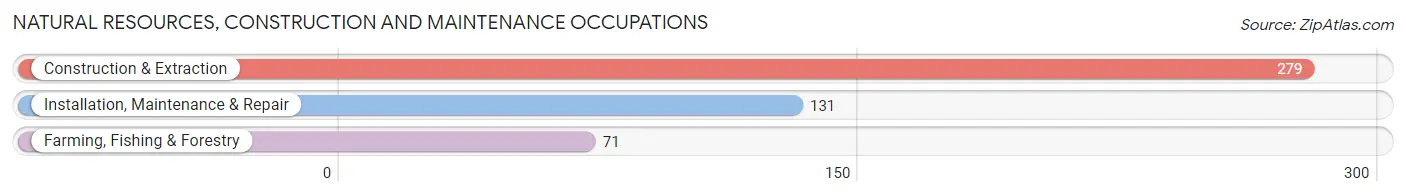
Natural Resources, Construction and Maintenance Occupations
The most common Natural Resources, Construction and Maintenance occupations in Chehalis are Construction & Extraction (279 | 8.8%), Installation, Maintenance & Repair (131 | 4.1%), and Farming, Fishing & Forestry (71 | 2.2%).
Natural Resources, Construction and Maintenance Occupations by Sex
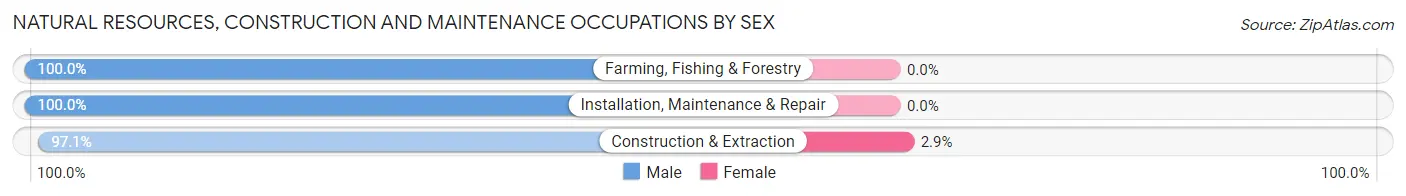
| Occupation | Male | Female |
| Farming, Fishing & Forestry | 71 (100.0%) | 0 (0.0%) |
| Construction & Extraction | 271 (97.1%) | 8 (2.9%) |
| Installation, Maintenance & Repair | 131 (100.0%) | 0 (0.0%) |
| Total (Category) | 473 (98.3%) | 8 (1.7%) |
| Total (Overall) | 1,898 (60.0%) | 1,267 (40.0%) |
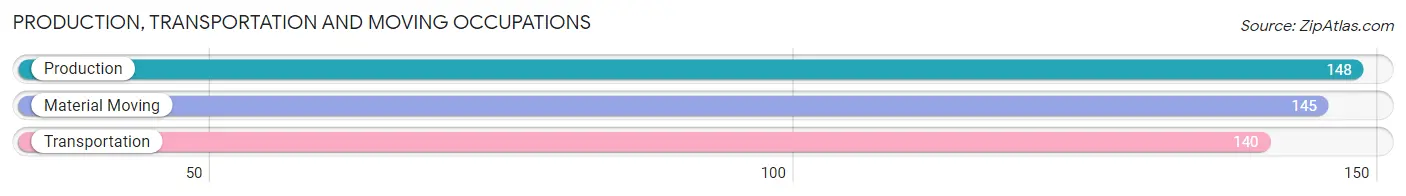
Production, Transportation and Moving Occupations
The most common Production, Transportation and Moving occupations in Chehalis are Production (148 | 4.7%), Material Moving (145 | 4.6%), and Transportation (140 | 4.4%).
Production, Transportation and Moving Occupations by Sex
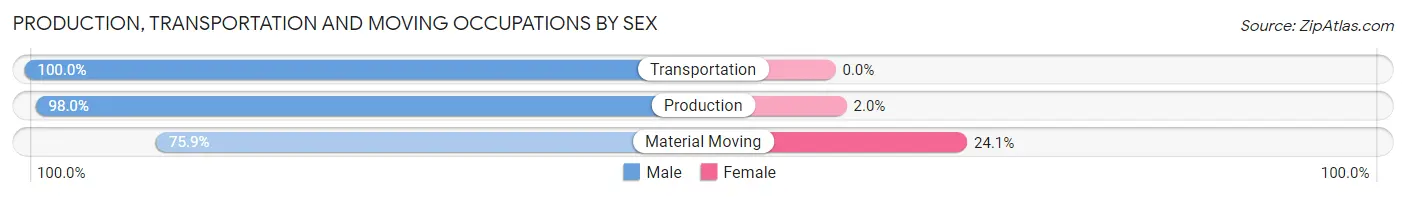
| Occupation | Male | Female |
| Production | 145 (98.0%) | 3 (2.0%) |
| Transportation | 140 (100.0%) | 0 (0.0%) |
| Material Moving | 110 (75.9%) | 35 (24.1%) |
| Total (Category) | 395 (91.2%) | 38 (8.8%) |
| Total (Overall) | 1,898 (60.0%) | 1,267 (40.0%) |
Employment Industries by Sex in Chehalis
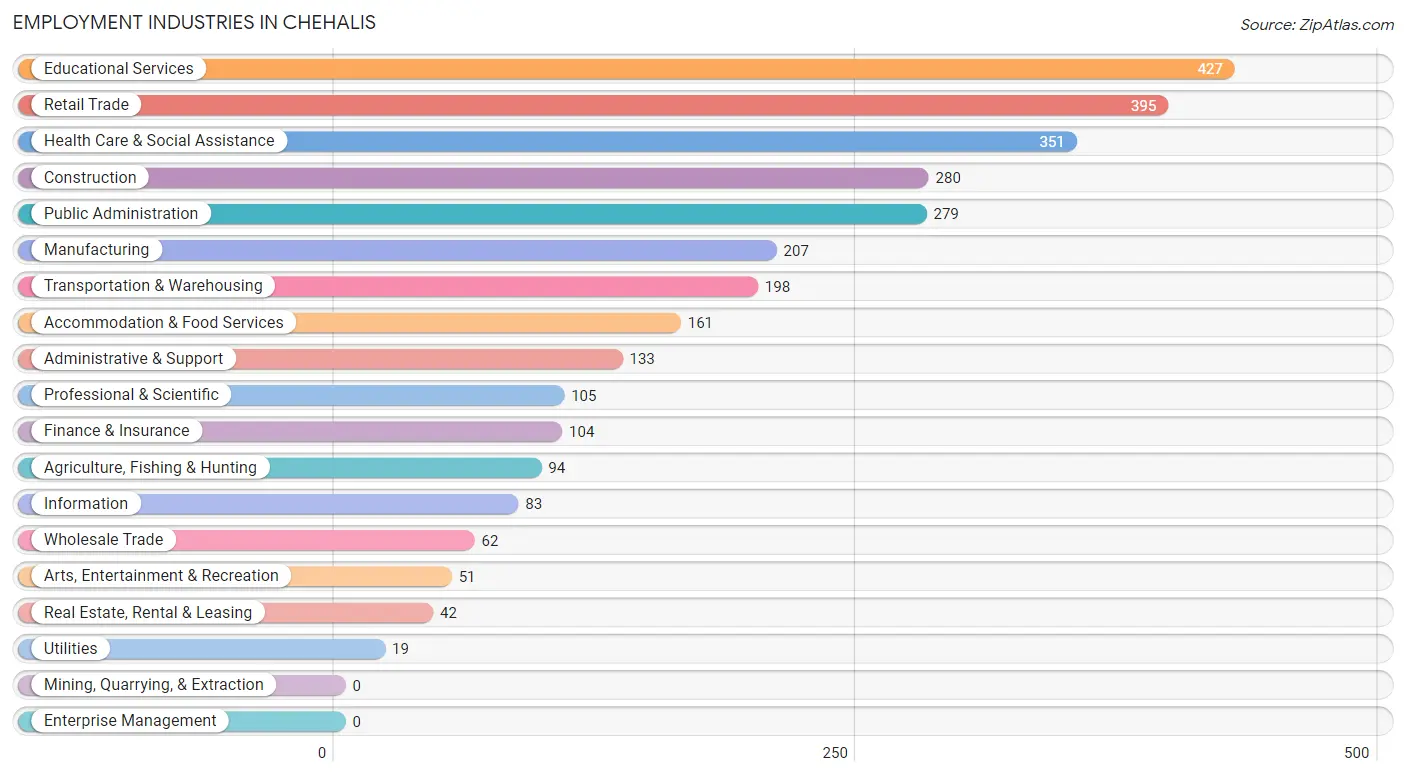
Employment Industries in Chehalis
The major employment industries in Chehalis include Educational Services (427 | 13.5%), Retail Trade (395 | 12.5%), Health Care & Social Assistance (351 | 11.1%), Construction (280 | 8.8%), and Public Administration (279 | 8.8%).
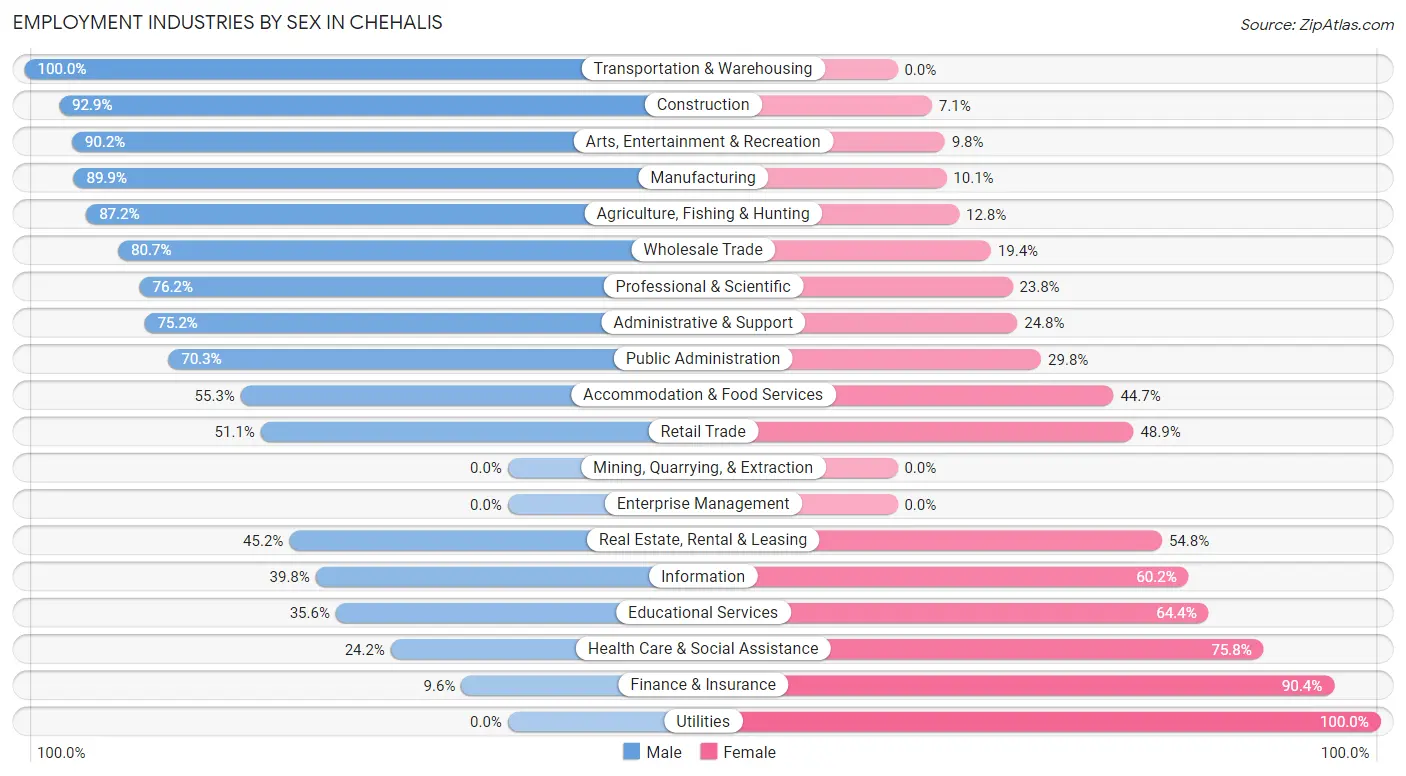
Employment Industries by Sex in Chehalis
The Chehalis industries that see more men than women are Transportation & Warehousing (100.0%), Construction (92.9%), and Arts, Entertainment & Recreation (90.2%), whereas the industries that tend to have a higher number of women are Utilities (100.0%), Finance & Insurance (90.4%), and Health Care & Social Assistance (75.8%).
| Industry | Male | Female |
| Agriculture, Fishing & Hunting | 82 (87.2%) | 12 (12.8%) |
| Mining, Quarrying, & Extraction | 0 (0.0%) | 0 (0.0%) |
| Construction | 260 (92.9%) | 20 (7.1%) |
| Manufacturing | 186 (89.9%) | 21 (10.1%) |
| Wholesale Trade | 50 (80.6%) | 12 (19.4%) |
| Retail Trade | 202 (51.1%) | 193 (48.9%) |
| Transportation & Warehousing | 198 (100.0%) | 0 (0.0%) |
| Utilities | 0 (0.0%) | 19 (100.0%) |
| Information | 33 (39.8%) | 50 (60.2%) |
| Finance & Insurance | 10 (9.6%) | 94 (90.4%) |
| Real Estate, Rental & Leasing | 19 (45.2%) | 23 (54.8%) |
| Professional & Scientific | 80 (76.2%) | 25 (23.8%) |
| Enterprise Management | 0 (0.0%) | 0 (0.0%) |
| Administrative & Support | 100 (75.2%) | 33 (24.8%) |
| Educational Services | 152 (35.6%) | 275 (64.4%) |
| Health Care & Social Assistance | 85 (24.2%) | 266 (75.8%) |
| Arts, Entertainment & Recreation | 46 (90.2%) | 5 (9.8%) |
| Accommodation & Food Services | 89 (55.3%) | 72 (44.7%) |
| Public Administration | 196 (70.3%) | 83 (29.7%) |
| Total | 1,898 (60.0%) | 1,267 (40.0%) |
Education in Chehalis
School Enrollment in Chehalis
The most common levels of schooling among the 1,703 students in Chehalis are middle school (480 | 28.2%), high school (403 | 23.7%), and elementary school (388 | 22.8%).
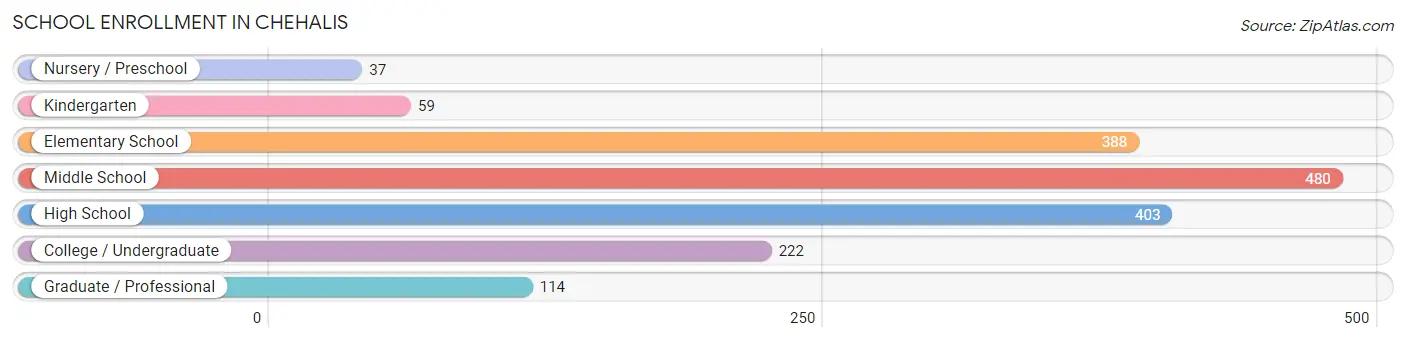
| School Level | # Students | % Students |
| Nursery / Preschool | 37 | 2.2% |
| Kindergarten | 59 | 3.5% |
| Elementary School | 388 | 22.8% |
| Middle School | 480 | 28.2% |
| High School | 403 | 23.7% |
| College / Undergraduate | 222 | 13.0% |
| Graduate / Professional | 114 | 6.7% |
| Total | 1,703 | 100.0% |
School Enrollment by Age by Funding Source in Chehalis
Out of a total of 1,703 students who are enrolled in schools in Chehalis, 165 (9.7%) attend a private institution, while the remaining 1,538 (90.3%) are enrolled in public schools. The age group of 35 years and over has the highest likelihood of being enrolled in private schools, with 48 (42.9% in the age bracket) enrolled. Conversely, the age group of 10 to 14 year olds has the lowest likelihood of being enrolled in a private school, with 536 (100.0% in the age bracket) attending a public institution.
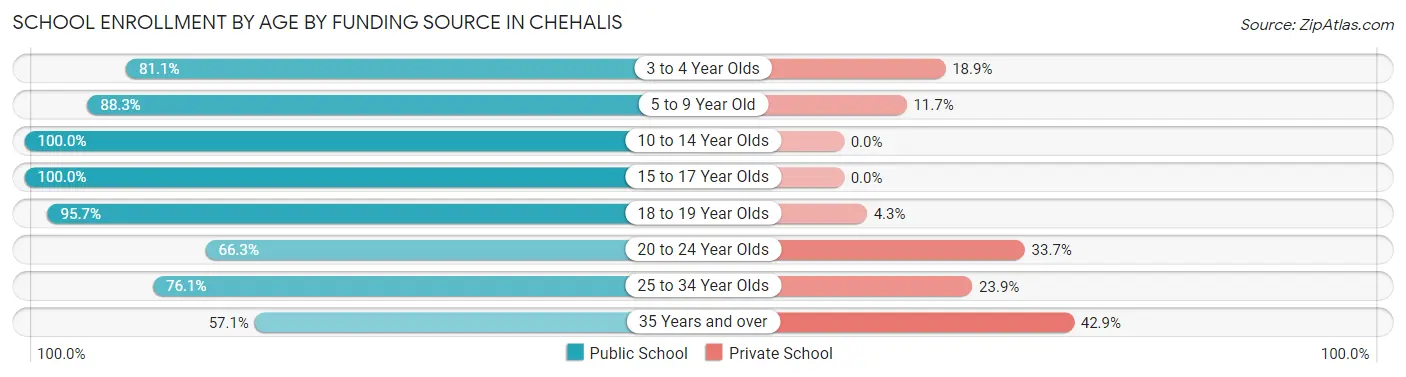
| Age Bracket | Public School | Private School |
| 3 to 4 Year Olds | 30 (81.1%) | 7 (18.9%) |
| 5 to 9 Year Old | 347 (88.3%) | 46 (11.7%) |
| 10 to 14 Year Olds | 536 (100.0%) | 0 (0.0%) |
| 15 to 17 Year Olds | 279 (100.0%) | 0 (0.0%) |
| 18 to 19 Year Olds | 134 (95.7%) | 6 (4.3%) |
| 20 to 24 Year Olds | 59 (66.3%) | 30 (33.7%) |
| 25 to 34 Year Olds | 89 (76.1%) | 28 (23.9%) |
| 35 Years and over | 64 (57.1%) | 48 (42.9%) |
| Total | 1,538 (90.3%) | 165 (9.7%) |
Educational Attainment by Field of Study in Chehalis
Business (239 | 18.5%), education (226 | 17.5%), science & technology (151 | 11.7%), liberal arts & history (115 | 8.9%), and engineering (106 | 8.2%) are the most common fields of study among 1,291 individuals in Chehalis who have obtained a bachelor's degree or higher.
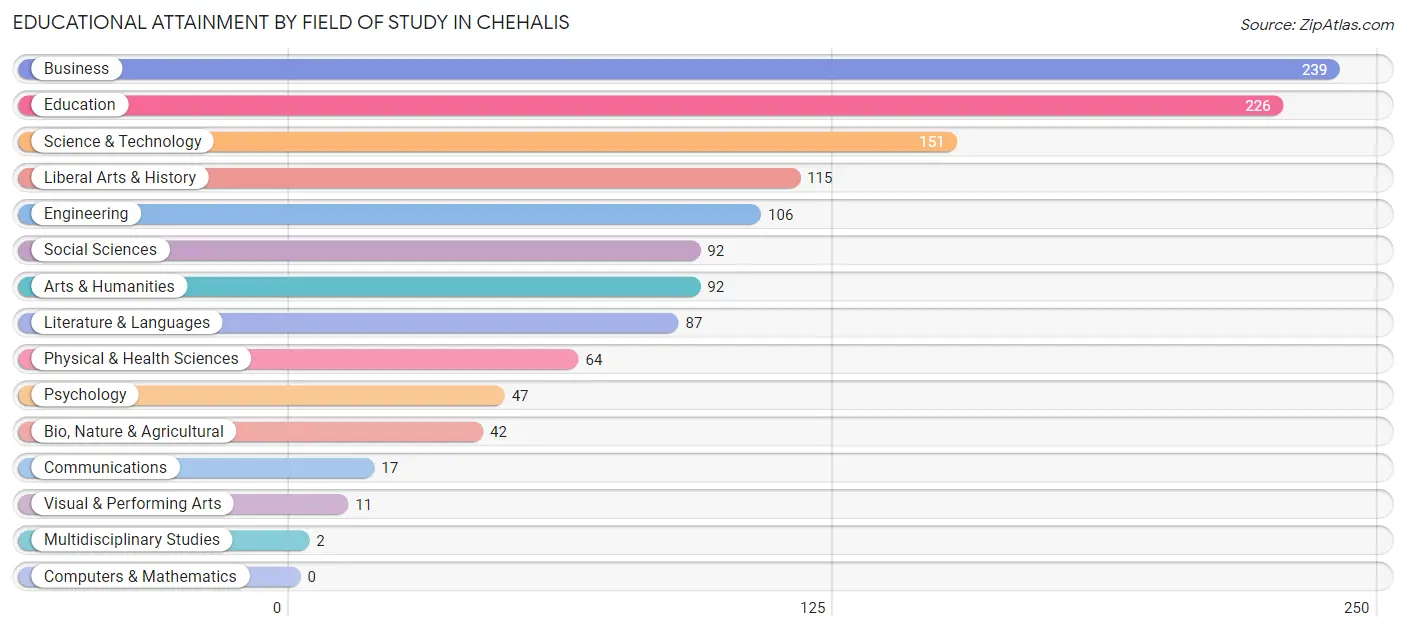
| Field of Study | # Graduates | % Graduates |
| Computers & Mathematics | 0 | 0.0% |
| Bio, Nature & Agricultural | 42 | 3.3% |
| Physical & Health Sciences | 64 | 5.0% |
| Psychology | 47 | 3.6% |
| Social Sciences | 92 | 7.1% |
| Engineering | 106 | 8.2% |
| Multidisciplinary Studies | 2 | 0.2% |
| Science & Technology | 151 | 11.7% |
| Business | 239 | 18.5% |
| Education | 226 | 17.5% |
| Literature & Languages | 87 | 6.7% |
| Liberal Arts & History | 115 | 8.9% |
| Visual & Performing Arts | 11 | 0.9% |
| Communications | 17 | 1.3% |
| Arts & Humanities | 92 | 7.1% |
| Total | 1,291 | 100.0% |
Transportation & Commute in Chehalis
Vehicle Availability by Sex in Chehalis
The most prevalent vehicle ownership categories in Chehalis are males with 2 vehicles (818, accounting for 45.9%) and females with 2 vehicles (508, making up 65.7%).
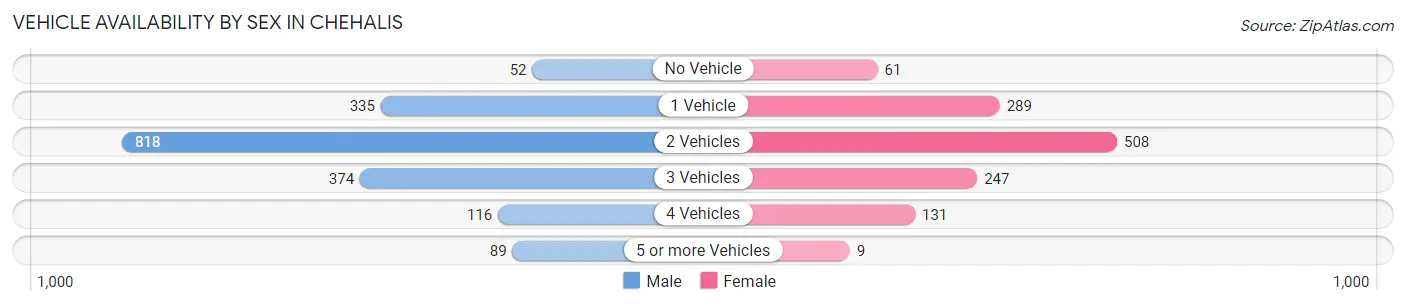
| Vehicles Available | Male | Female |
| No Vehicle | 52 (2.9%) | 61 (4.9%) |
| 1 Vehicle | 335 (18.8%) | 289 (23.2%) |
| 2 Vehicles | 818 (45.9%) | 508 (40.8%) |
| 3 Vehicles | 374 (21.0%) | 247 (19.8%) |
| 4 Vehicles | 116 (6.5%) | 131 (10.5%) |
| 5 or more Vehicles | 89 (5.0%) | 9 (0.7%) |
| Total | 1,784 (100.0%) | 1,245 (100.0%) |
Commute Time in Chehalis
The most frequently occuring commute durations in Chehalis are 10 to 14 minutes (610 commuters, 21.7%), 5 to 9 minutes (585 commuters, 20.8%), and 15 to 19 minutes (574 commuters, 20.5%).
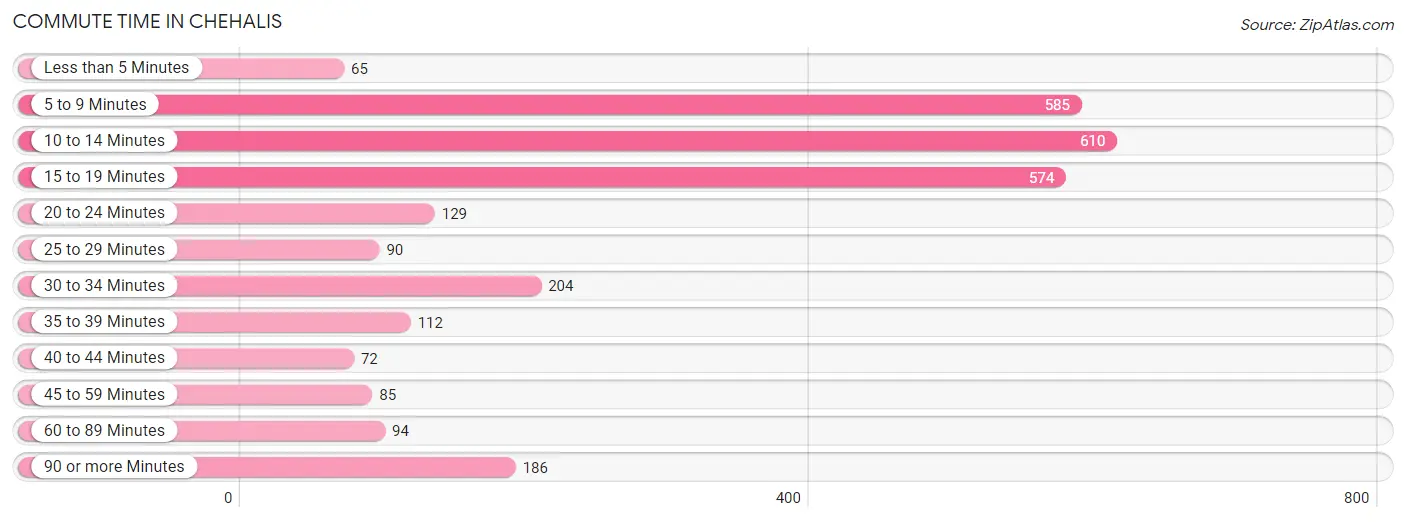
| Commute Time | # Commuters | % Commuters |
| Less than 5 Minutes | 65 | 2.3% |
| 5 to 9 Minutes | 585 | 20.8% |
| 10 to 14 Minutes | 610 | 21.7% |
| 15 to 19 Minutes | 574 | 20.5% |
| 20 to 24 Minutes | 129 | 4.6% |
| 25 to 29 Minutes | 90 | 3.2% |
| 30 to 34 Minutes | 204 | 7.3% |
| 35 to 39 Minutes | 112 | 4.0% |
| 40 to 44 Minutes | 72 | 2.6% |
| 45 to 59 Minutes | 85 | 3.0% |
| 60 to 89 Minutes | 94 | 3.4% |
| 90 or more Minutes | 186 | 6.6% |
Commute Time by Sex in Chehalis
The most common commute times in Chehalis are 5 to 9 minutes (330 commuters, 19.6%) for males and 10 to 14 minutes (332 commuters, 29.5%) for females.
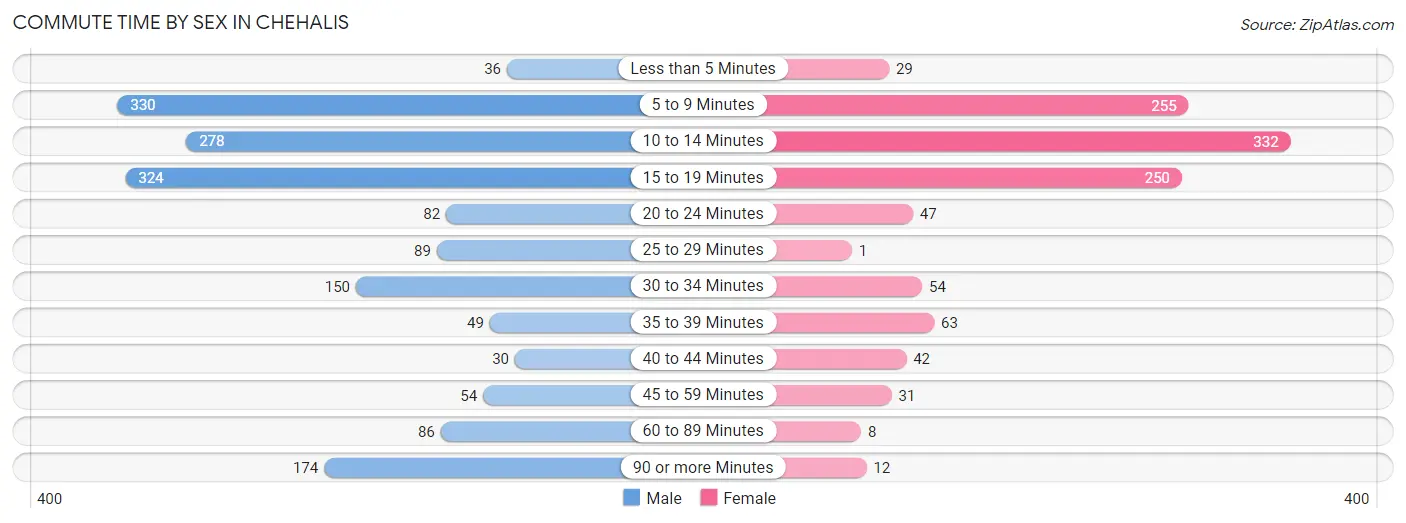
| Commute Time | Male | Female |
| Less than 5 Minutes | 36 (2.1%) | 29 (2.6%) |
| 5 to 9 Minutes | 330 (19.6%) | 255 (22.7%) |
| 10 to 14 Minutes | 278 (16.5%) | 332 (29.5%) |
| 15 to 19 Minutes | 324 (19.3%) | 250 (22.2%) |
| 20 to 24 Minutes | 82 (4.9%) | 47 (4.2%) |
| 25 to 29 Minutes | 89 (5.3%) | 1 (0.1%) |
| 30 to 34 Minutes | 150 (8.9%) | 54 (4.8%) |
| 35 to 39 Minutes | 49 (2.9%) | 63 (5.6%) |
| 40 to 44 Minutes | 30 (1.8%) | 42 (3.7%) |
| 45 to 59 Minutes | 54 (3.2%) | 31 (2.8%) |
| 60 to 89 Minutes | 86 (5.1%) | 8 (0.7%) |
| 90 or more Minutes | 174 (10.3%) | 12 (1.1%) |
Time of Departure to Work by Sex in Chehalis
The most frequent times of departure to work in Chehalis are 7:00 AM to 7:29 AM (236, 14.0%) for males and 7:30 AM to 7:59 AM (311, 27.7%) for females.
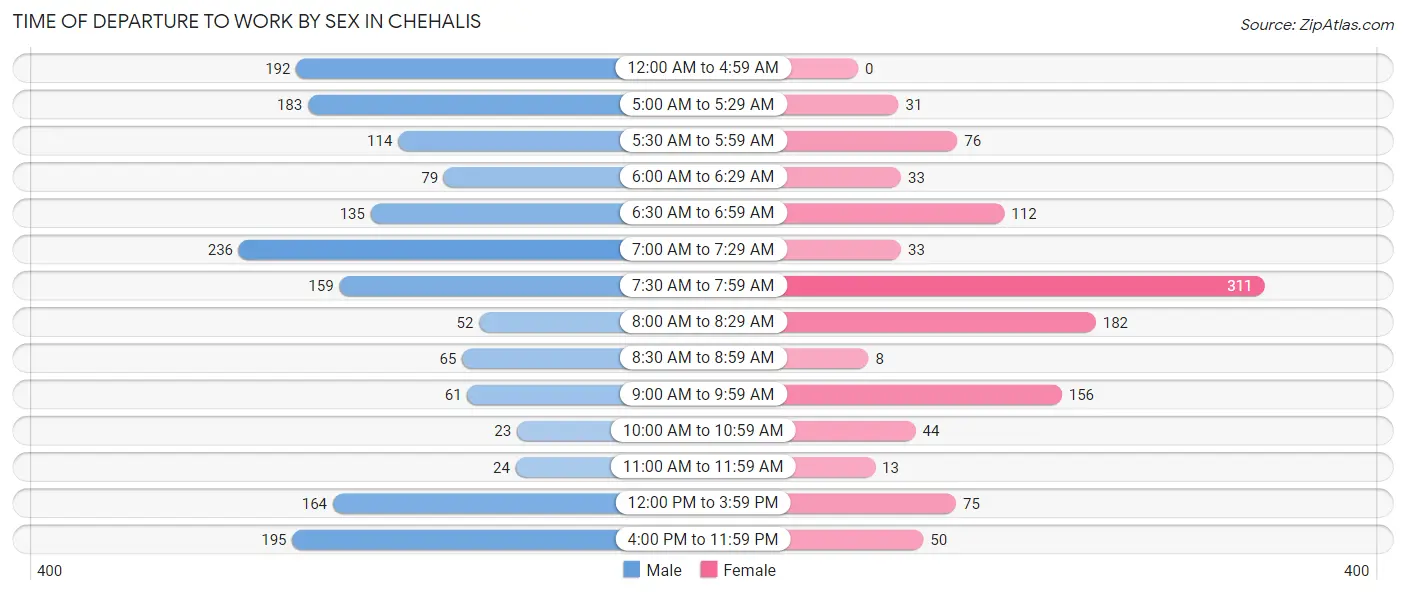
| Time of Departure | Male | Female |
| 12:00 AM to 4:59 AM | 192 (11.4%) | 0 (0.0%) |
| 5:00 AM to 5:29 AM | 183 (10.9%) | 31 (2.8%) |
| 5:30 AM to 5:59 AM | 114 (6.8%) | 76 (6.8%) |
| 6:00 AM to 6:29 AM | 79 (4.7%) | 33 (2.9%) |
| 6:30 AM to 6:59 AM | 135 (8.0%) | 112 (10.0%) |
| 7:00 AM to 7:29 AM | 236 (14.0%) | 33 (2.9%) |
| 7:30 AM to 7:59 AM | 159 (9.5%) | 311 (27.7%) |
| 8:00 AM to 8:29 AM | 52 (3.1%) | 182 (16.2%) |
| 8:30 AM to 8:59 AM | 65 (3.9%) | 8 (0.7%) |
| 9:00 AM to 9:59 AM | 61 (3.6%) | 156 (13.9%) |
| 10:00 AM to 10:59 AM | 23 (1.4%) | 44 (3.9%) |
| 11:00 AM to 11:59 AM | 24 (1.4%) | 13 (1.2%) |
| 12:00 PM to 3:59 PM | 164 (9.8%) | 75 (6.7%) |
| 4:00 PM to 11:59 PM | 195 (11.6%) | 50 (4.4%) |
| Total | 1,682 (100.0%) | 1,124 (100.0%) |
Housing Occupancy in Chehalis
Occupancy by Ownership in Chehalis
Of the total 2,939 dwellings in Chehalis, owner-occupied units account for 1,460 (49.7%), while renter-occupied units make up 1,479 (50.3%).
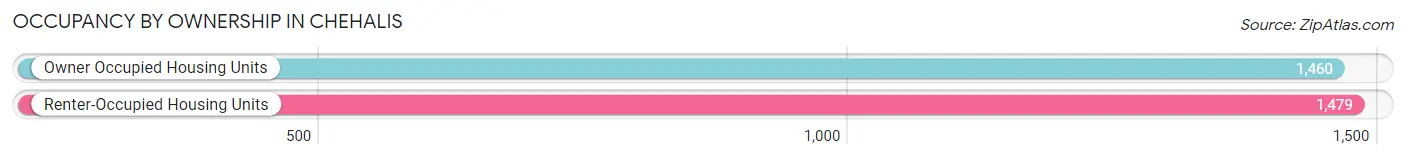
| Occupancy | # Housing Units | % Housing Units |
| Owner Occupied Housing Units | 1,460 | 49.7% |
| Renter-Occupied Housing Units | 1,479 | 50.3% |
| Total Occupied Housing Units | 2,939 | 100.0% |
Occupancy by Household Size in Chehalis
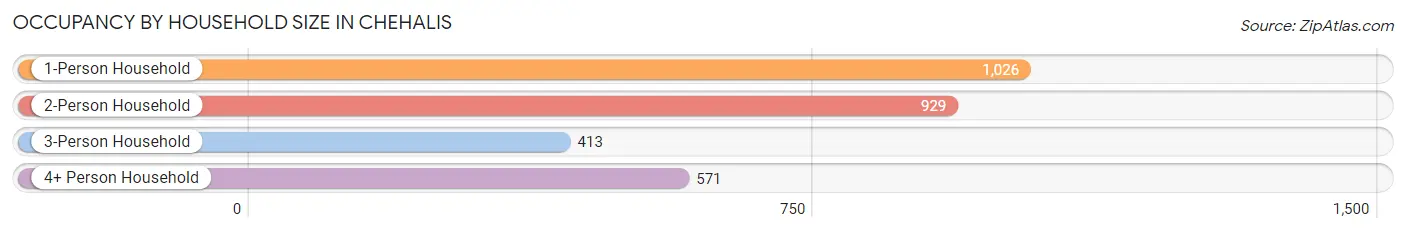
| Household Size | # Housing Units | % Housing Units |
| 1-Person Household | 1,026 | 34.9% |
| 2-Person Household | 929 | 31.6% |
| 3-Person Household | 413 | 14.1% |
| 4+ Person Household | 571 | 19.4% |
| Total Housing Units | 2,939 | 100.0% |
Occupancy by Ownership by Household Size in Chehalis
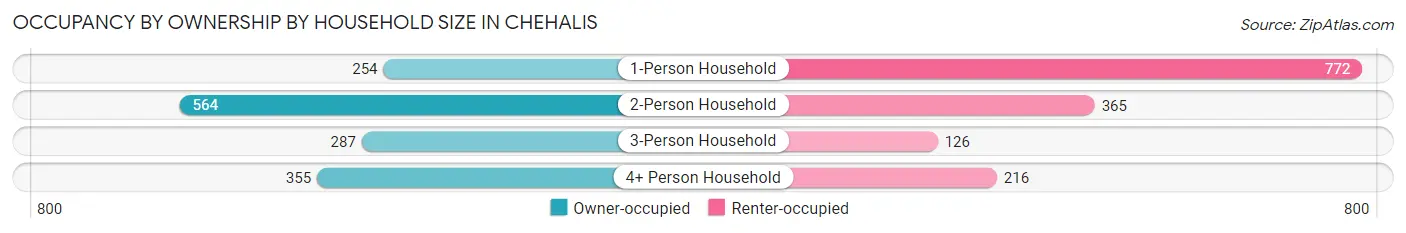
| Household Size | Owner-occupied | Renter-occupied |
| 1-Person Household | 254 (24.8%) | 772 (75.2%) |
| 2-Person Household | 564 (60.7%) | 365 (39.3%) |
| 3-Person Household | 287 (69.5%) | 126 (30.5%) |
| 4+ Person Household | 355 (62.2%) | 216 (37.8%) |
| Total Housing Units | 1,460 (49.7%) | 1,479 (50.3%) |
Occupancy by Educational Attainment in Chehalis
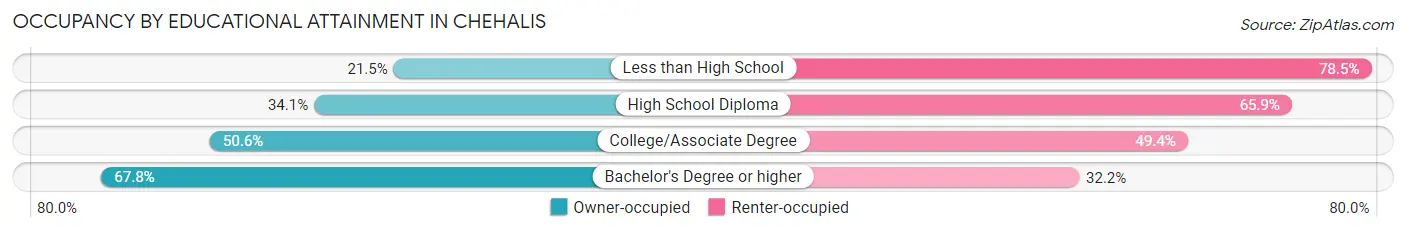
| Household Size | Owner-occupied | Renter-occupied |
| Less than High School | 32 (21.5%) | 117 (78.5%) |
| High School Diploma | 267 (34.1%) | 516 (65.9%) |
| College/Associate Degree | 588 (50.6%) | 574 (49.4%) |
| Bachelor's Degree or higher | 573 (67.8%) | 272 (32.2%) |
Occupancy by Age of Householder in Chehalis
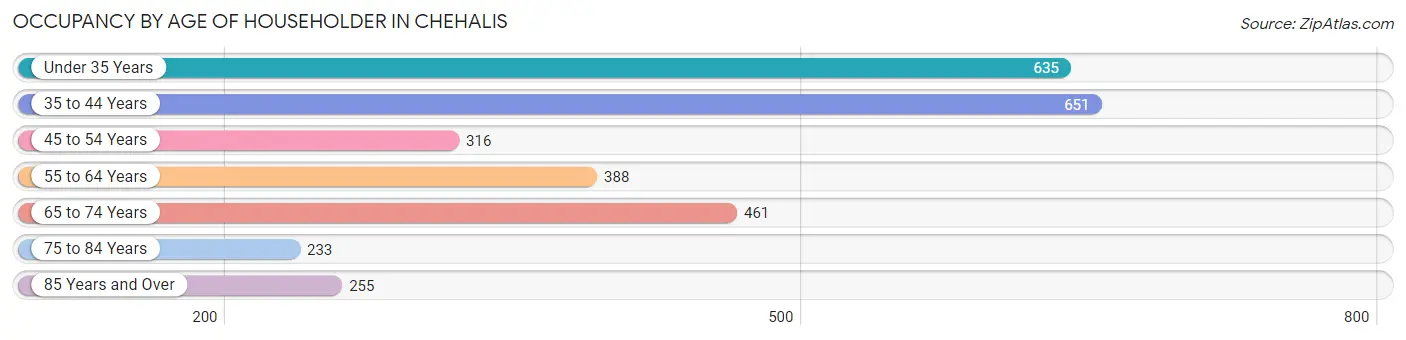
| Age Bracket | # Households | % Households |
| Under 35 Years | 635 | 21.6% |
| 35 to 44 Years | 651 | 22.2% |
| 45 to 54 Years | 316 | 10.7% |
| 55 to 64 Years | 388 | 13.2% |
| 65 to 74 Years | 461 | 15.7% |
| 75 to 84 Years | 233 | 7.9% |
| 85 Years and Over | 255 | 8.7% |
| Total | 2,939 | 100.0% |
Housing Finances in Chehalis
Median Income by Occupancy in Chehalis
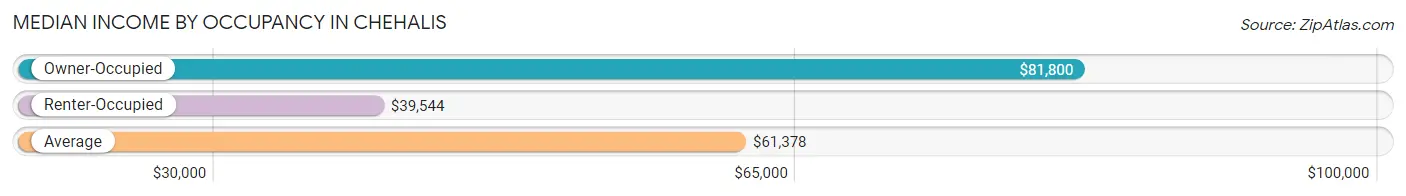
| Occupancy Type | # Households | Median Income |
| Owner-Occupied | 1,460 (49.7%) | $81,800 |
| Renter-Occupied | 1,479 (50.3%) | $39,544 |
| Average | 2,939 (100.0%) | $61,378 |
Occupancy by Householder Income Bracket in Chehalis
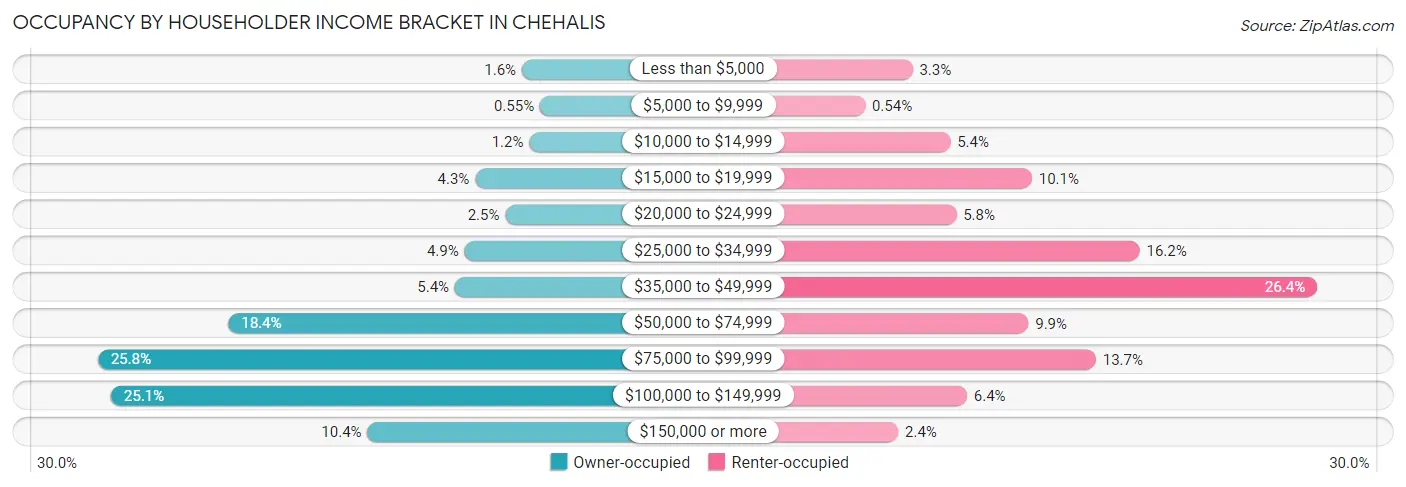
| Income Bracket | Owner-occupied | Renter-occupied |
| Less than $5,000 | 23 (1.6%) | 48 (3.3%) |
| $5,000 to $9,999 | 8 (0.5%) | 8 (0.5%) |
| $10,000 to $14,999 | 17 (1.2%) | 80 (5.4%) |
| $15,000 to $19,999 | 62 (4.3%) | 149 (10.1%) |
| $20,000 to $24,999 | 37 (2.5%) | 85 (5.8%) |
| $25,000 to $34,999 | 71 (4.9%) | 240 (16.2%) |
| $35,000 to $49,999 | 79 (5.4%) | 390 (26.4%) |
| $50,000 to $74,999 | 268 (18.4%) | 146 (9.9%) |
| $75,000 to $99,999 | 377 (25.8%) | 203 (13.7%) |
| $100,000 to $149,999 | 366 (25.1%) | 94 (6.4%) |
| $150,000 or more | 152 (10.4%) | 36 (2.4%) |
| Total | 1,460 (100.0%) | 1,479 (100.0%) |
Monthly Housing Cost Tiers in Chehalis
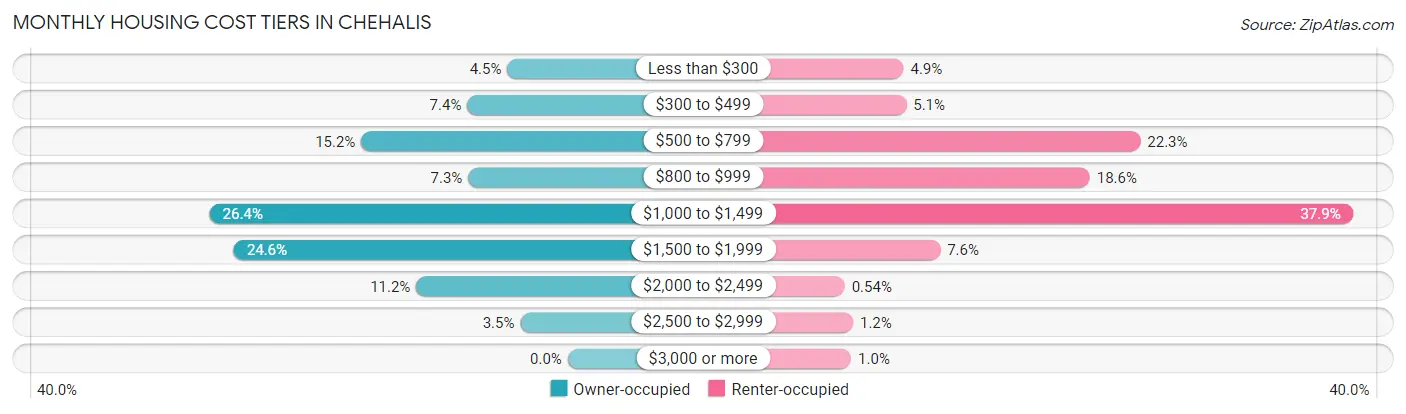
| Monthly Cost | Owner-occupied | Renter-occupied |
| Less than $300 | 65 (4.4%) | 72 (4.9%) |
| $300 to $499 | 108 (7.4%) | 75 (5.1%) |
| $500 to $799 | 222 (15.2%) | 330 (22.3%) |
| $800 to $999 | 107 (7.3%) | 275 (18.6%) |
| $1,000 to $1,499 | 385 (26.4%) | 561 (37.9%) |
| $1,500 to $1,999 | 359 (24.6%) | 112 (7.6%) |
| $2,000 to $2,499 | 163 (11.2%) | 8 (0.5%) |
| $2,500 to $2,999 | 51 (3.5%) | 17 (1.1%) |
| $3,000 or more | 0 (0.0%) | 15 (1.0%) |
| Total | 1,460 (100.0%) | 1,479 (100.0%) |
Physical Housing Characteristics in Chehalis
Housing Structures in Chehalis
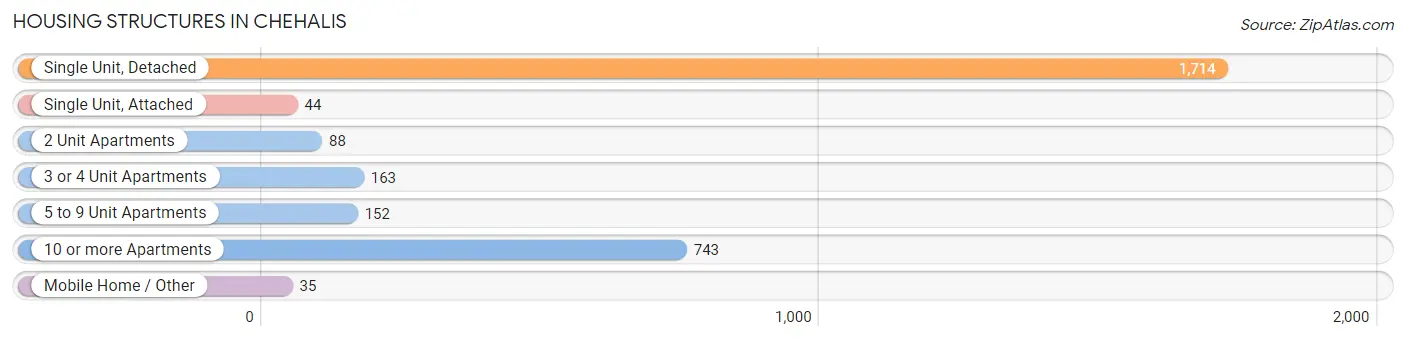
| Structure Type | # Housing Units | % Housing Units |
| Single Unit, Detached | 1,714 | 58.3% |
| Single Unit, Attached | 44 | 1.5% |
| 2 Unit Apartments | 88 | 3.0% |
| 3 or 4 Unit Apartments | 163 | 5.6% |
| 5 to 9 Unit Apartments | 152 | 5.2% |
| 10 or more Apartments | 743 | 25.3% |
| Mobile Home / Other | 35 | 1.2% |
| Total | 2,939 | 100.0% |
Housing Structures by Occupancy in Chehalis
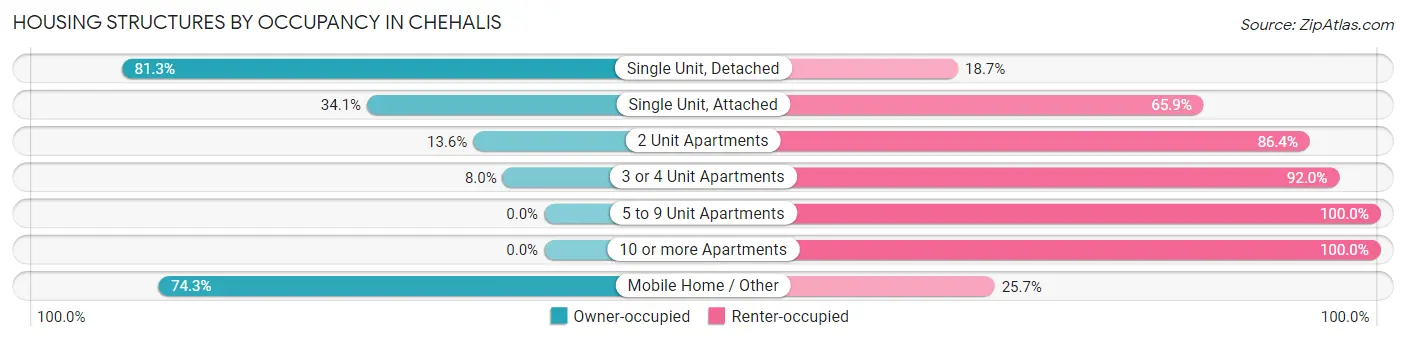
| Structure Type | Owner-occupied | Renter-occupied |
| Single Unit, Detached | 1,394 (81.3%) | 320 (18.7%) |
| Single Unit, Attached | 15 (34.1%) | 29 (65.9%) |
| 2 Unit Apartments | 12 (13.6%) | 76 (86.4%) |
| 3 or 4 Unit Apartments | 13 (8.0%) | 150 (92.0%) |
| 5 to 9 Unit Apartments | 0 (0.0%) | 152 (100.0%) |
| 10 or more Apartments | 0 (0.0%) | 743 (100.0%) |
| Mobile Home / Other | 26 (74.3%) | 9 (25.7%) |
| Total | 1,460 (49.7%) | 1,479 (50.3%) |
Housing Structures by Number of Rooms in Chehalis
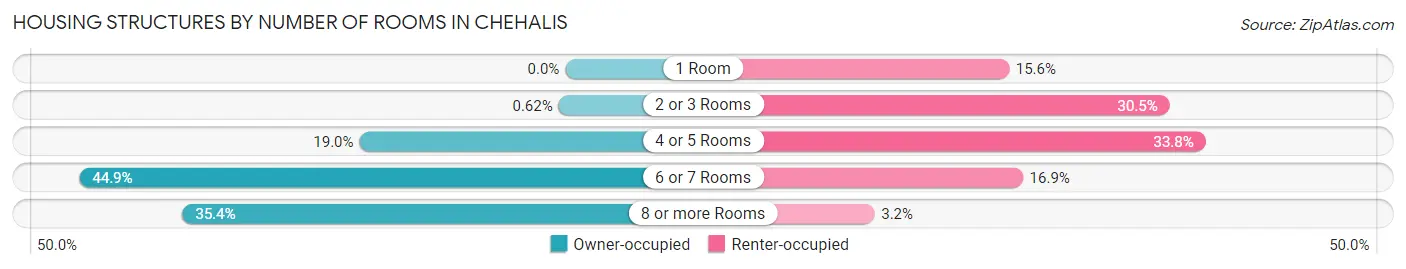
| Number of Rooms | Owner-occupied | Renter-occupied |
| 1 Room | 0 (0.0%) | 231 (15.6%) |
| 2 or 3 Rooms | 9 (0.6%) | 451 (30.5%) |
| 4 or 5 Rooms | 278 (19.0%) | 500 (33.8%) |
| 6 or 7 Rooms | 656 (44.9%) | 250 (16.9%) |
| 8 or more Rooms | 517 (35.4%) | 47 (3.2%) |
| Total | 1,460 (100.0%) | 1,479 (100.0%) |
Housing Structure by Heating Type in Chehalis
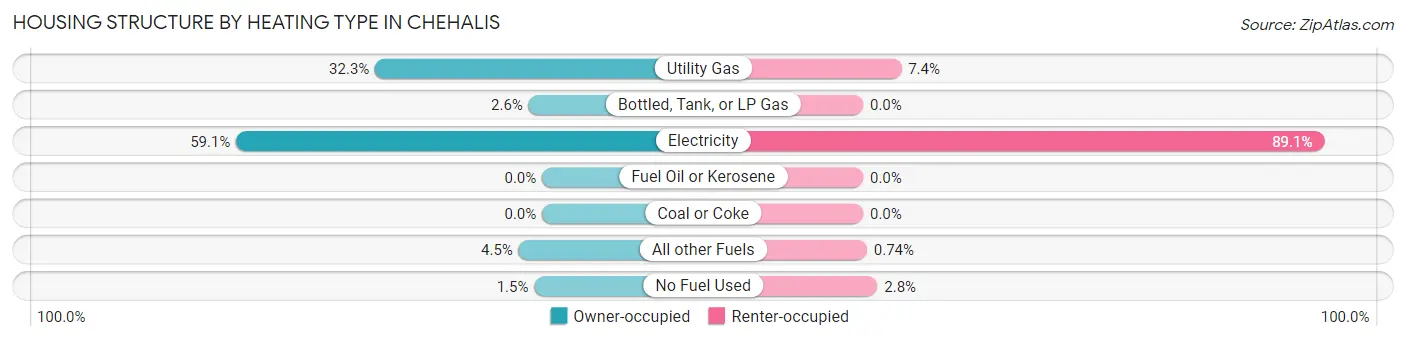
| Heating Type | Owner-occupied | Renter-occupied |
| Utility Gas | 471 (32.3%) | 109 (7.4%) |
| Bottled, Tank, or LP Gas | 38 (2.6%) | 0 (0.0%) |
| Electricity | 863 (59.1%) | 1,318 (89.1%) |
| Fuel Oil or Kerosene | 0 (0.0%) | 0 (0.0%) |
| Coal or Coke | 0 (0.0%) | 0 (0.0%) |
| All other Fuels | 66 (4.5%) | 11 (0.7%) |
| No Fuel Used | 22 (1.5%) | 41 (2.8%) |
| Total | 1,460 (100.0%) | 1,479 (100.0%) |
Household Vehicle Usage in Chehalis
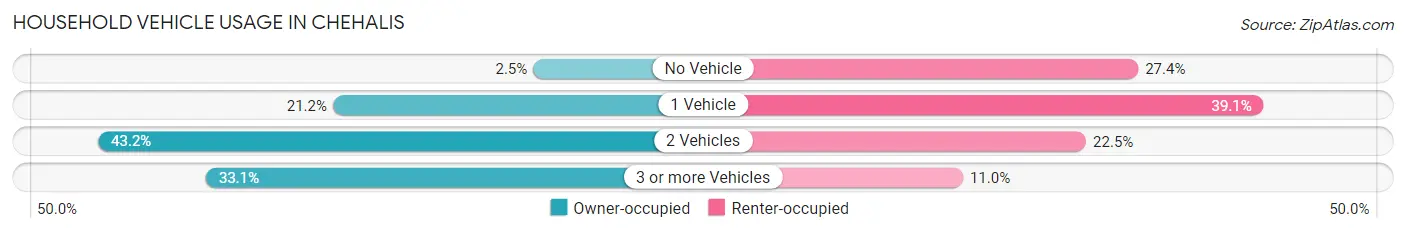
| Vehicles per Household | Owner-occupied | Renter-occupied |
| No Vehicle | 37 (2.5%) | 405 (27.4%) |
| 1 Vehicle | 310 (21.2%) | 578 (39.1%) |
| 2 Vehicles | 630 (43.1%) | 333 (22.5%) |
| 3 or more Vehicles | 483 (33.1%) | 163 (11.0%) |
| Total | 1,460 (100.0%) | 1,479 (100.0%) |
Real Estate & Mortgages in Chehalis
Real Estate and Mortgage Overview in Chehalis
| Characteristic | Without Mortgage | With Mortgage |
| Housing Units | 481 | 979 |
| Median Property Value | $293,300 | $298,300 |
| Median Household Income | $78,819 | $135 |
| Monthly Housing Costs | $620 | $0 |
| Real Estate Taxes | $2,212 | $29 |
Property Value by Mortgage Status in Chehalis
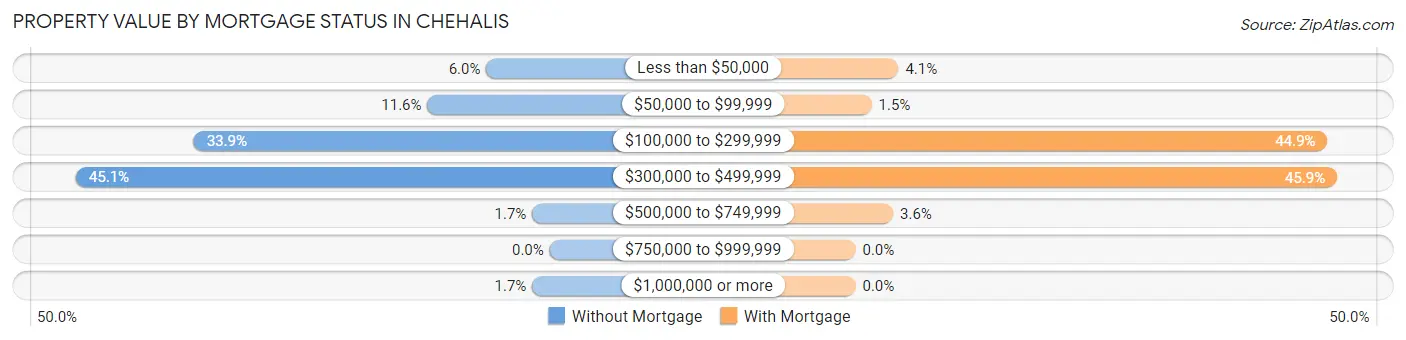
| Property Value | Without Mortgage | With Mortgage |
| Less than $50,000 | 29 (6.0%) | 40 (4.1%) |
| $50,000 to $99,999 | 56 (11.6%) | 15 (1.5%) |
| $100,000 to $299,999 | 163 (33.9%) | 440 (44.9%) |
| $300,000 to $499,999 | 217 (45.1%) | 449 (45.9%) |
| $500,000 to $749,999 | 8 (1.7%) | 35 (3.6%) |
| $750,000 to $999,999 | 0 (0.0%) | 0 (0.0%) |
| $1,000,000 or more | 8 (1.7%) | 0 (0.0%) |
| Total | 481 (100.0%) | 979 (100.0%) |
Household Income by Mortgage Status in Chehalis
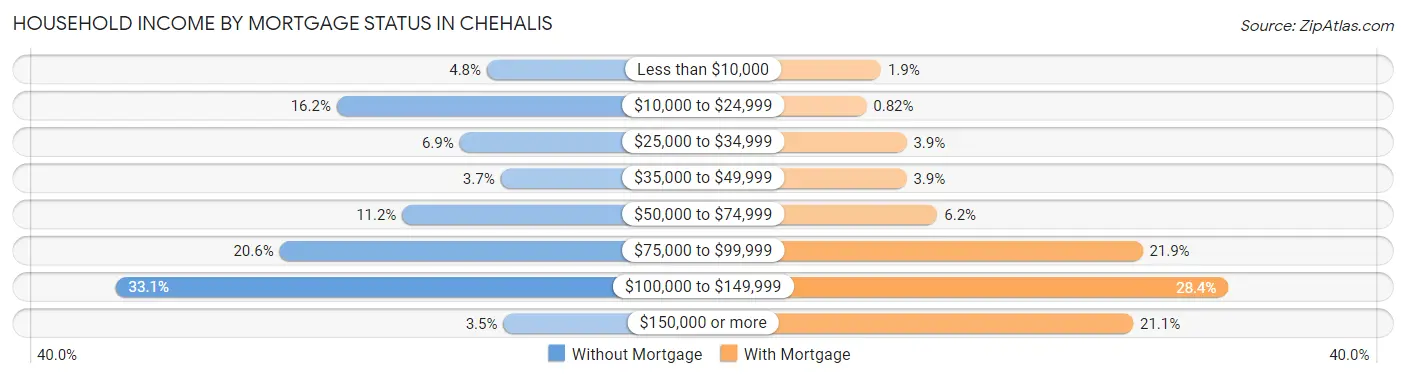
| Household Income | Without Mortgage | With Mortgage |
| Less than $10,000 | 23 (4.8%) | 19 (1.9%) |
| $10,000 to $24,999 | 78 (16.2%) | 8 (0.8%) |
| $25,000 to $34,999 | 33 (6.9%) | 38 (3.9%) |
| $35,000 to $49,999 | 18 (3.7%) | 38 (3.9%) |
| $50,000 to $74,999 | 54 (11.2%) | 61 (6.2%) |
| $75,000 to $99,999 | 99 (20.6%) | 214 (21.9%) |
| $100,000 to $149,999 | 159 (33.1%) | 278 (28.4%) |
| $150,000 or more | 17 (3.5%) | 207 (21.1%) |
| Total | 481 (100.0%) | 979 (100.0%) |
Property Value to Household Income Ratio in Chehalis
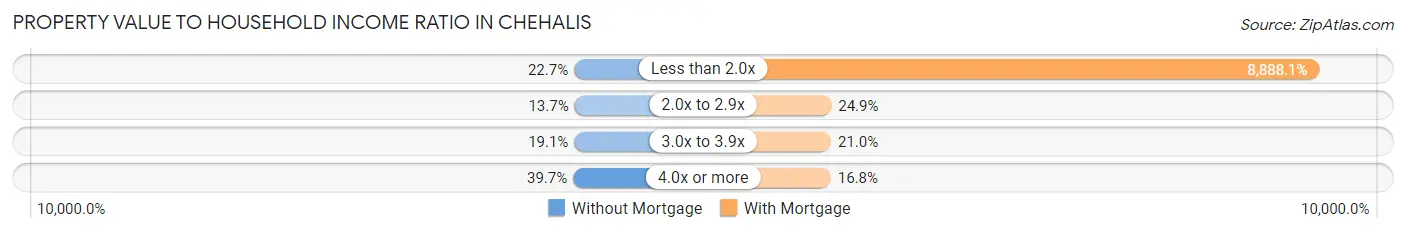
| Value-to-Income Ratio | Without Mortgage | With Mortgage |
| Less than 2.0x | 109 (22.7%) | 87,014 (8,888.0%) |
| 2.0x to 2.9x | 66 (13.7%) | 244 (24.9%) |
| 3.0x to 3.9x | 92 (19.1%) | 206 (21.0%) |
| 4.0x or more | 191 (39.7%) | 164 (16.8%) |
| Total | 481 (100.0%) | 979 (100.0%) |
Real Estate Taxes by Mortgage Status in Chehalis
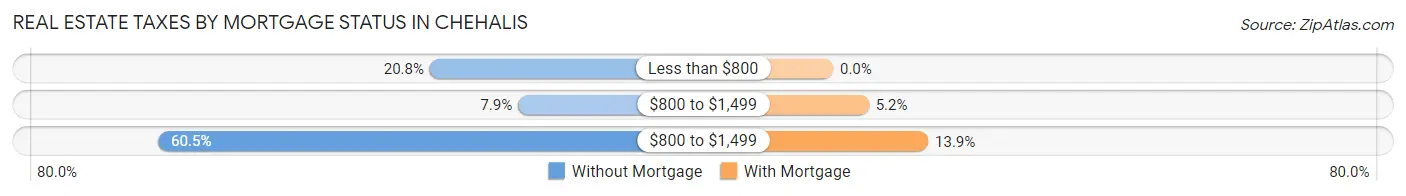
| Property Taxes | Without Mortgage | With Mortgage |
| Less than $800 | 100 (20.8%) | 0 (0.0%) |
| $800 to $1,499 | 38 (7.9%) | 51 (5.2%) |
| $800 to $1,499 | 291 (60.5%) | 136 (13.9%) |
| Total | 481 (100.0%) | 979 (100.0%) |
Health & Disability in Chehalis
Health Insurance Coverage by Age in Chehalis
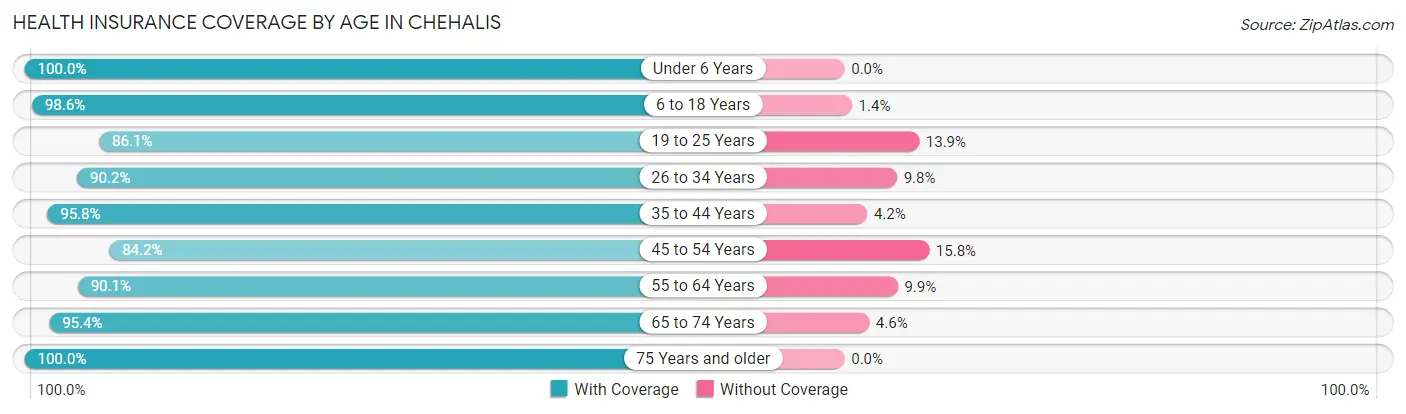
| Age Bracket | With Coverage | Without Coverage |
| Under 6 Years | 639 (100.0%) | 0 (0.0%) |
| 6 to 18 Years | 1,149 (98.6%) | 16 (1.4%) |
| 19 to 25 Years | 613 (86.1%) | 99 (13.9%) |
| 26 to 34 Years | 1,088 (90.2%) | 118 (9.8%) |
| 35 to 44 Years | 927 (95.8%) | 41 (4.2%) |
| 45 to 54 Years | 491 (84.2%) | 92 (15.8%) |
| 55 to 64 Years | 609 (90.1%) | 67 (9.9%) |
| 65 to 74 Years | 603 (95.4%) | 29 (4.6%) |
| 75 Years and older | 595 (100.0%) | 0 (0.0%) |
| Total | 6,714 (93.6%) | 462 (6.4%) |
Health Insurance Coverage by Citizenship Status in Chehalis
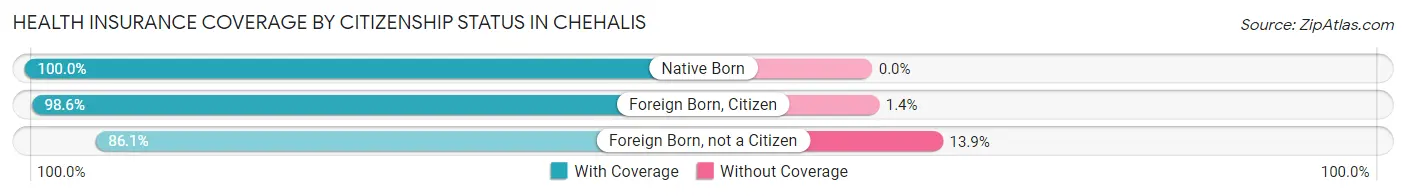
| Citizenship Status | With Coverage | Without Coverage |
| Native Born | 639 (100.0%) | 0 (0.0%) |
| Foreign Born, Citizen | 1,149 (98.6%) | 16 (1.4%) |
| Foreign Born, not a Citizen | 613 (86.1%) | 99 (13.9%) |
Health Insurance Coverage by Household Income in Chehalis
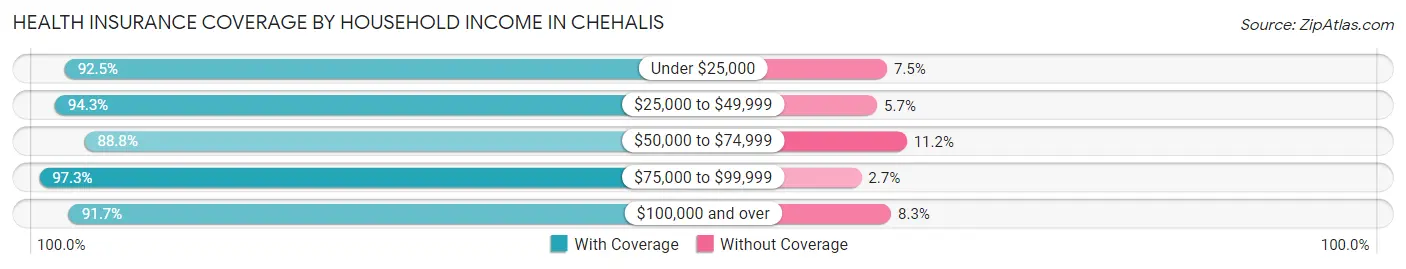
| Household Income | With Coverage | Without Coverage |
| Under $25,000 | 627 (92.5%) | 51 (7.5%) |
| $25,000 to $49,999 | 1,410 (94.3%) | 85 (5.7%) |
| $50,000 to $74,999 | 830 (88.8%) | 105 (11.2%) |
| $75,000 to $99,999 | 1,742 (97.3%) | 49 (2.7%) |
| $100,000 and over | 1,877 (91.7%) | 170 (8.3%) |
Public vs Private Health Insurance Coverage by Age in Chehalis
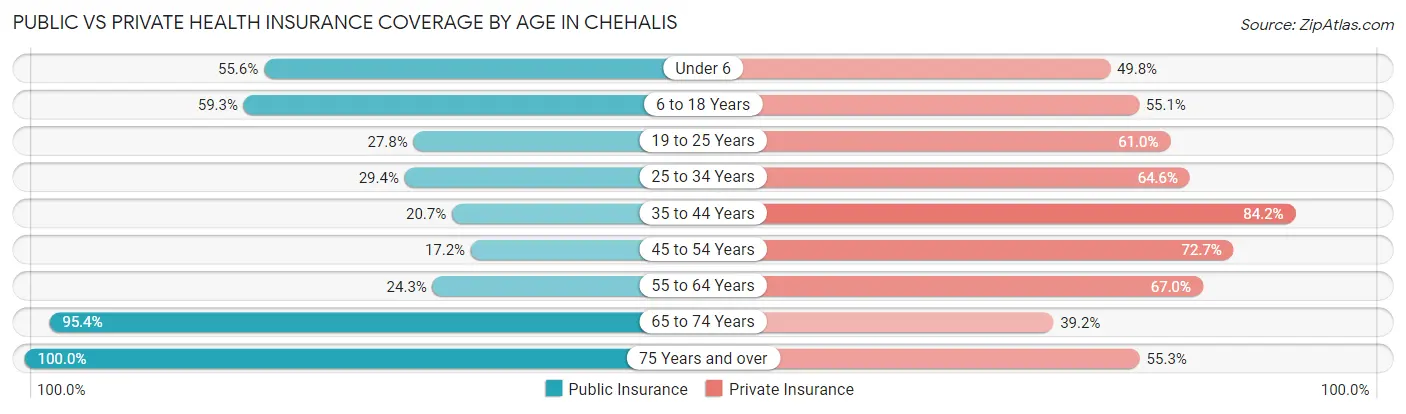
| Age Bracket | Public Insurance | Private Insurance |
| Under 6 | 355 (55.6%) | 318 (49.8%) |
| 6 to 18 Years | 691 (59.3%) | 642 (55.1%) |
| 19 to 25 Years | 198 (27.8%) | 434 (61.0%) |
| 25 to 34 Years | 355 (29.4%) | 779 (64.6%) |
| 35 to 44 Years | 200 (20.7%) | 815 (84.2%) |
| 45 to 54 Years | 100 (17.2%) | 424 (72.7%) |
| 55 to 64 Years | 164 (24.3%) | 453 (67.0%) |
| 65 to 74 Years | 603 (95.4%) | 248 (39.2%) |
| 75 Years and over | 595 (100.0%) | 329 (55.3%) |
| Total | 3,261 (45.4%) | 4,442 (61.9%) |
Disability Status by Sex by Age in Chehalis
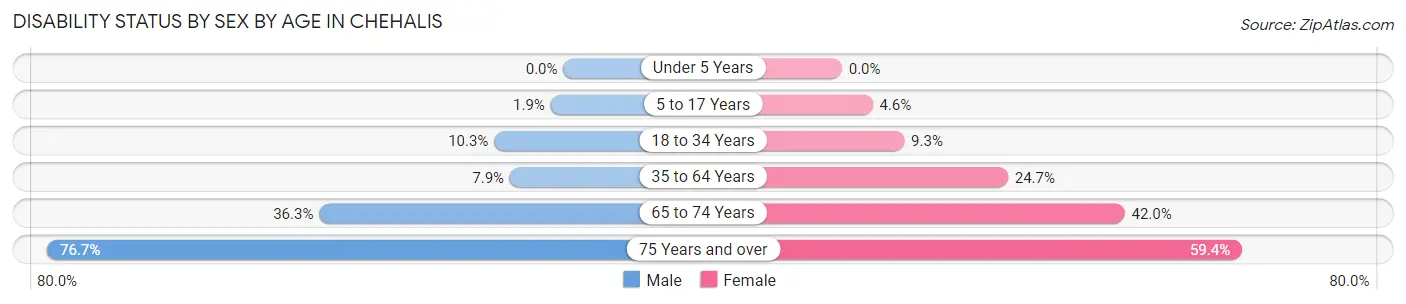
| Age Bracket | Male | Female |
| Under 5 Years | 0 (0.0%) | 0 (0.0%) |
| 5 to 17 Years | 12 (1.9%) | 26 (4.5%) |
| 18 to 34 Years | 109 (10.3%) | 88 (9.3%) |
| 35 to 64 Years | 102 (7.9%) | 232 (24.6%) |
| 65 to 74 Years | 116 (36.2%) | 131 (42.0%) |
| 75 Years and over | 220 (76.7%) | 183 (59.4%) |
Disability Class by Sex by Age in Chehalis
Disability Class: Hearing Difficulty
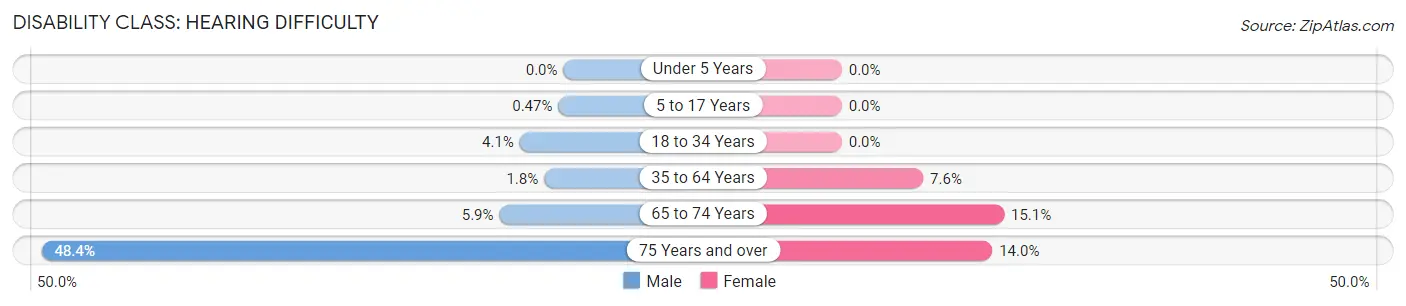
| Age Bracket | Male | Female |
| Under 5 Years | 0 (0.0%) | 0 (0.0%) |
| 5 to 17 Years | 3 (0.5%) | 0 (0.0%) |
| 18 to 34 Years | 43 (4.1%) | 0 (0.0%) |
| 35 to 64 Years | 23 (1.8%) | 71 (7.5%) |
| 65 to 74 Years | 19 (5.9%) | 47 (15.1%) |
| 75 Years and over | 139 (48.4%) | 43 (14.0%) |
Disability Class: Vision Difficulty
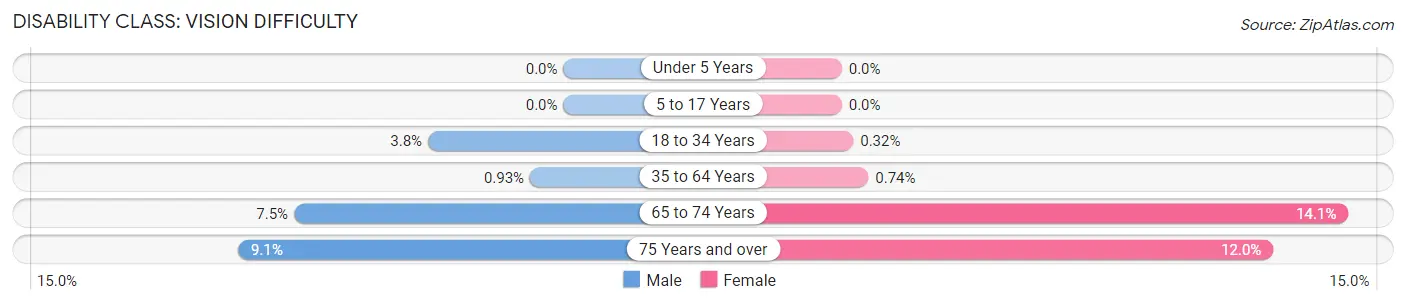
| Age Bracket | Male | Female |
| Under 5 Years | 0 (0.0%) | 0 (0.0%) |
| 5 to 17 Years | 0 (0.0%) | 0 (0.0%) |
| 18 to 34 Years | 40 (3.8%) | 3 (0.3%) |
| 35 to 64 Years | 12 (0.9%) | 7 (0.7%) |
| 65 to 74 Years | 24 (7.5%) | 44 (14.1%) |
| 75 Years and over | 26 (9.1%) | 37 (12.0%) |
Disability Class: Cognitive Difficulty
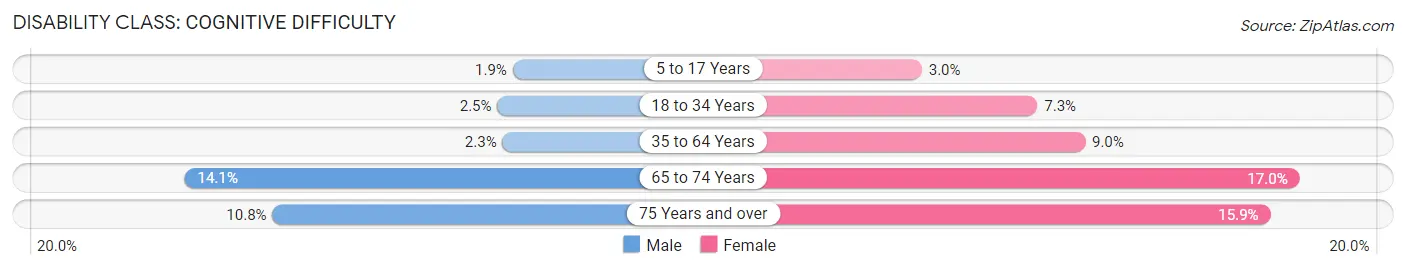
| Age Bracket | Male | Female |
| 5 to 17 Years | 12 (1.9%) | 17 (3.0%) |
| 18 to 34 Years | 26 (2.5%) | 69 (7.3%) |
| 35 to 64 Years | 29 (2.3%) | 85 (9.0%) |
| 65 to 74 Years | 45 (14.1%) | 53 (17.0%) |
| 75 Years and over | 31 (10.8%) | 49 (15.9%) |
Disability Class: Ambulatory Difficulty
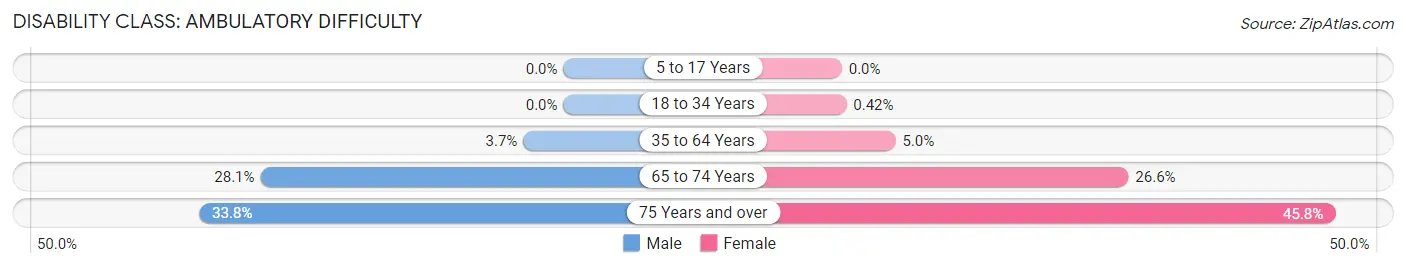
| Age Bracket | Male | Female |
| 5 to 17 Years | 0 (0.0%) | 0 (0.0%) |
| 18 to 34 Years | 0 (0.0%) | 4 (0.4%) |
| 35 to 64 Years | 48 (3.7%) | 47 (5.0%) |
| 65 to 74 Years | 90 (28.1%) | 83 (26.6%) |
| 75 Years and over | 97 (33.8%) | 141 (45.8%) |
Disability Class: Self-Care Difficulty
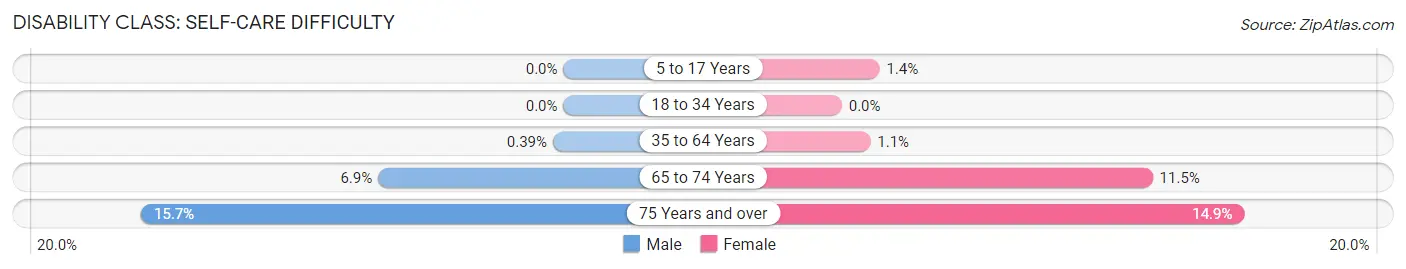
| Age Bracket | Male | Female |
| 5 to 17 Years | 0 (0.0%) | 8 (1.4%) |
| 18 to 34 Years | 0 (0.0%) | 0 (0.0%) |
| 35 to 64 Years | 5 (0.4%) | 10 (1.1%) |
| 65 to 74 Years | 22 (6.9%) | 36 (11.5%) |
| 75 Years and over | 45 (15.7%) | 46 (14.9%) |
Technology Access in Chehalis
Computing Device Access in Chehalis
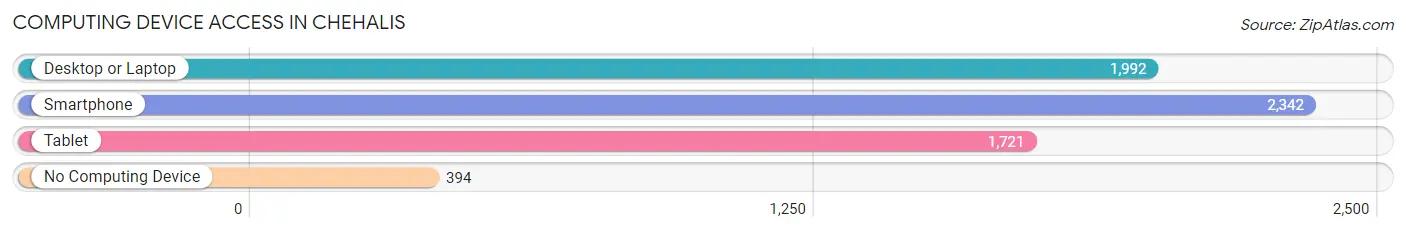
| Device Type | # Households | % Households |
| Desktop or Laptop | 1,992 | 67.8% |
| Smartphone | 2,342 | 79.7% |
| Tablet | 1,721 | 58.6% |
| No Computing Device | 394 | 13.4% |
| Total | 2,939 | 100.0% |
Internet Access in Chehalis
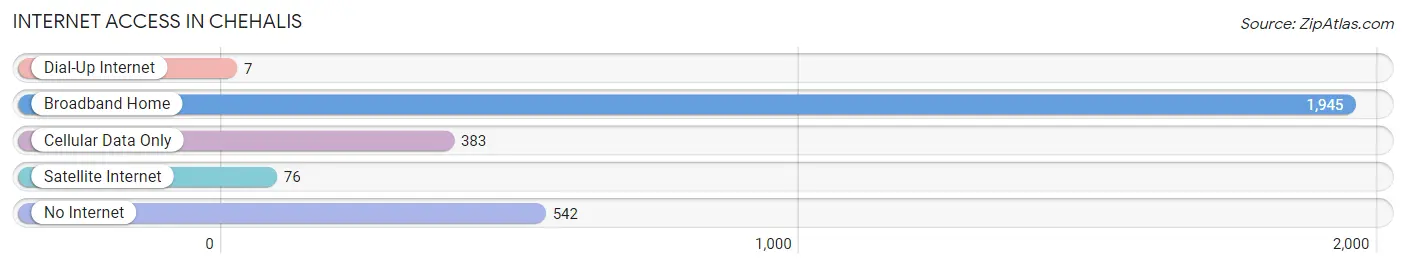
| Internet Type | # Households | % Households |
| Dial-Up Internet | 7 | 0.2% |
| Broadband Home | 1,945 | 66.2% |
| Cellular Data Only | 383 | 13.0% |
| Satellite Internet | 76 | 2.6% |
| No Internet | 542 | 18.4% |
| Total | 2,939 | 100.0% |
Chehalis Summary
Chehalis, Washington is a city located in Lewis County, Washington, United States. It is the county seat of Lewis County and is located in the southwestern part of the state. The population of Chehalis was 7,259 at the 2010 census.
History
Chehalis was first settled in 1845 by a group of settlers from the Oregon Trail. The city was named after the Chehalis people, a Native American tribe that lived in the area. The city was officially incorporated in 1883.
In the late 19th century, Chehalis was a major logging center and was home to several sawmills. The city was also a major railroad hub, with the Northern Pacific Railway and the Great Northern Railway both running through the city.
In the early 20th century, Chehalis was a major agricultural center, with the surrounding area producing a variety of crops, including wheat, oats, barley, potatoes, and apples.
Geography
Chehalis is located in southwestern Washington, in the foothills of the Cascade Mountains. The city is situated at the confluence of the Chehalis and Newaukum Rivers. The city is located about 50 miles south of Seattle and about 30 miles north of Olympia.
The city has a total area of 4 2 square miles all of which is land
Economy
Chehalis is a major agricultural center, with the surrounding area producing a variety of crops, including wheat, oats, barley, potatoes, and apples. The city is also home to several manufacturing companies, including a paper mill, a wood products plant, and a metal fabrication plant.
The city is also home to several retail stores restaurants and other businesses
Demographics
As of the 2010 census, there were 7,259 people, 2,845 households, and 1,845 families residing in the city. The population density was 1,737.3 people per square mile. The racial makeup of the city was 87.2% White, 0.7% African American, 1.3% Native American, 0.7% Asian, 0.1% Pacific Islander, 6.3% from other races, and 3.9% from two or more races. Hispanic or Latino of any race were 11.2% of the population.
The median income for a household in the city was $37,917, and the median income for a family was $45,938. The per capita income for the city was $18,945. About 14.2% of families and 17.7% of the population were below the poverty line, including 25.2% of those under age 18 and 8.2% of those age 65 or over.
Common Questions
What is Per Capita Income in Chehalis?
Per Capita income in Chehalis is $30,125.
What is the Median Family Income in Chehalis?
Median Family Income in Chehalis is $77,385.
What is the Median Household income in Chehalis?
Median Household Income in Chehalis is $61,378.
What is Income or Wage Gap in Chehalis?
Income or Wage Gap in Chehalis is 32.7%.
Women in Chehalis earn 67.3 cents for every dollar earned by a man.
What is Inequality or Gini Index in Chehalis?
Inequality or Gini Index in Chehalis is 0.42.
What is the Total Population of Chehalis?
Total Population of Chehalis is 7,512.
What is the Total Male Population of Chehalis?
Total Male Population of Chehalis is 4,110.
What is the Total Female Population of Chehalis?
Total Female Population of Chehalis is 3,402.
What is the Ratio of Males per 100 Females in Chehalis?
There are 120.81 Males per 100 Females in Chehalis.
What is the Ratio of Females per 100 Males in Chehalis?
There are 82.77 Females per 100 Males in Chehalis.
What is the Median Population Age in Chehalis?
Median Population Age in Chehalis is 32.2 Years.
What is the Average Family Size in Chehalis
Average Family Size in Chehalis is 3.1 People.
What is the Average Household Size in Chehalis
Average Household Size in Chehalis is 2.4 People.
How Large is the Labor Force in Chehalis?
There are 3,514 People in the Labor Forcein in Chehalis.
What is the Percentage of People in the Labor Force in Chehalis?
60.5% of People are in the Labor Force in Chehalis.
What is the Unemployment Rate in Chehalis?
Unemployment Rate in Chehalis is 9.8%.