Zip Codes with the Highest Percentage of Population Employed in Security & Protection in Port Orchard, WA
RELATED REPORTS & OPTIONS
Security & Protection
Port Orchard
Compare Zip Codes
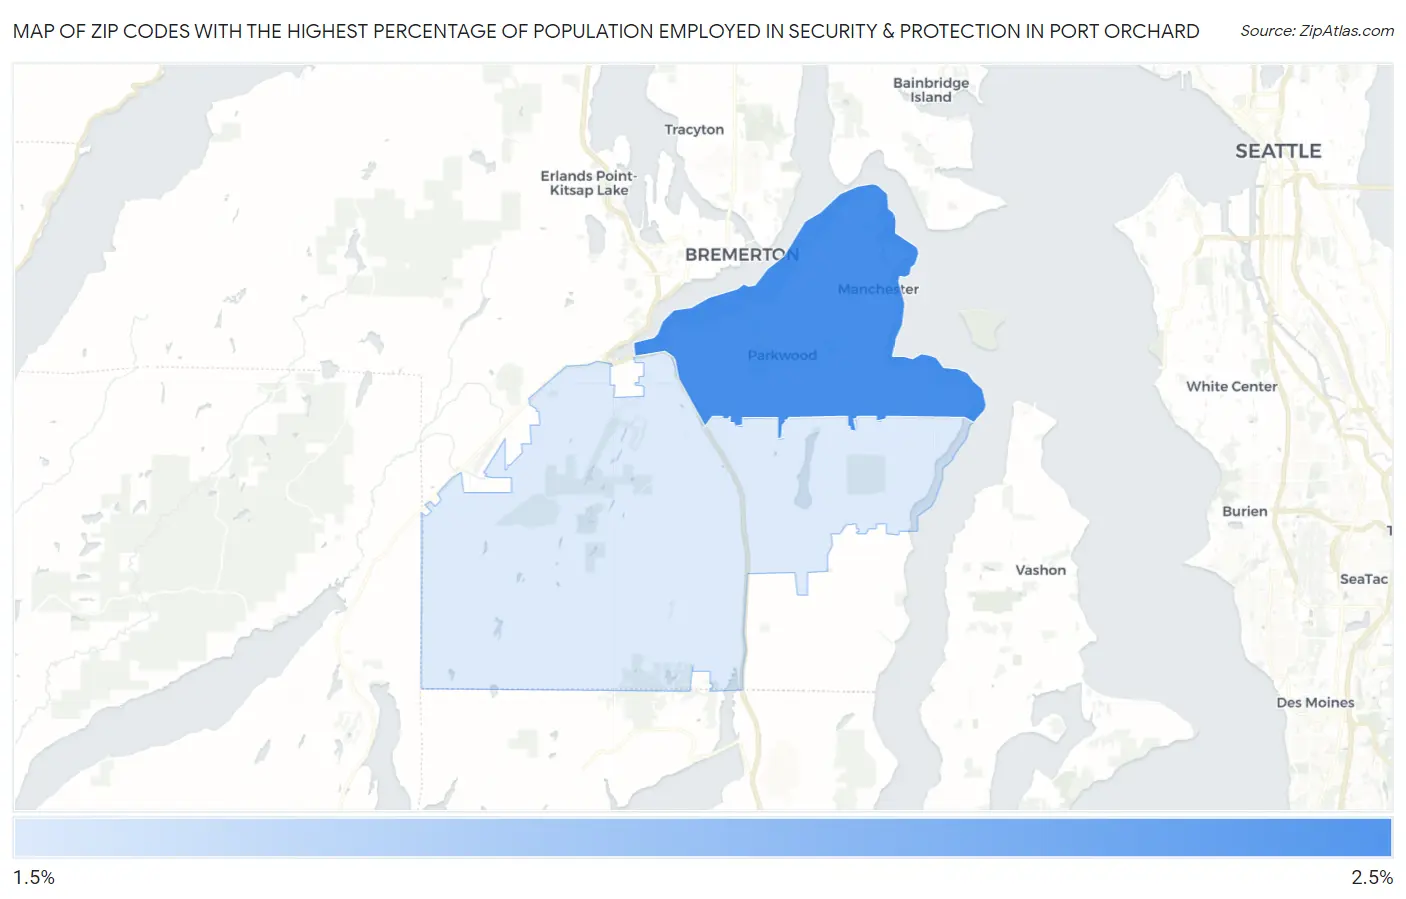
Map of Zip Codes with the Highest Percentage of Population Employed in Security & Protection in Port Orchard
1.8%
2.4%
Zip Codes with the Highest Percentage of Population Employed in Security & Protection in Port Orchard, WA
| Zip Code | % Employed | vs State | vs National | |
| 1. | 98366 | 2.4% | 1.8%(+0.591)#172 | 2.1%(+0.256)#10,033 |
| 2. | 98367 | 1.8% | 1.8%(-0.000)#262 | 2.1%(-0.335)#13,832 |
1
Common Questions
What are the Top Zip Codes with the Highest Percentage of Population Employed in Security & Protection in Port Orchard, WA?
Top Zip Codes with the Highest Percentage of Population Employed in Security & Protection in Port Orchard, WA are:
What zip code has the Highest Percentage of Population Employed in Security & Protection in Port Orchard, WA?
98366 has the Highest Percentage of Population Employed in Security & Protection in Port Orchard, WA with 2.4%.
What is the Percentage of Population Employed in Security & Protection in Port Orchard, WA?
Percentage of Population Employed in Security & Protection in Port Orchard is 2.1%.
What is the Percentage of Population Employed in Security & Protection in Washington?
Percentage of Population Employed in Security & Protection in Washington is 1.8%.
What is the Percentage of Population Employed in Security & Protection in the United States?
Percentage of Population Employed in Security & Protection in the United States is 2.1%.