Sumas, WA Map & Demographics
Sumas Map
Sumas Overview
$35,777
PER CAPITA INCOME
$103,506
AVG FAMILY INCOME
$82,188
AVG HOUSEHOLD INCOME
46.9%
WAGE / INCOME GAP [ % ]
53.1¢/ $1
WAGE / INCOME GAP [ $ ]
$12,686
FAMILY INCOME DEFICIT
0.42
INEQUALITY / GINI INDEX
1,397
TOTAL POPULATION
732
MALE POPULATION
665
FEMALE POPULATION
110.08
MALES / 100 FEMALES
90.85
FEMALES / 100 MALES
31.1
MEDIAN AGE
3.3
AVG FAMILY SIZE
2.6
AVG HOUSEHOLD SIZE
684
LABOR FORCE [ PEOPLE ]
63.9%
PERCENT IN LABOR FORCE
3.8%
UNEMPLOYMENT RATE
Sumas Zip Codes
Sumas Area Codes
Income in Sumas
Income Overview in Sumas
Per Capita Income in Sumas is $35,777, while median incomes of families and households are $103,506 and $82,188 respectively.
| Characteristic | Number | Measure |
| Per Capita Income | 1,397 | $35,777 |
| Median Family Income | 335 | $103,506 |
| Mean Family Income | 335 | $116,099 |
| Median Household Income | 533 | $82,188 |
| Mean Household Income | 533 | $92,606 |
| Income Deficit | 335 | $12,686 |
| Wage / Income Gap (%) | 1,397 | 46.88% |
| Wage / Income Gap ($) | 1,397 | 53.12¢ per $1 |
| Gini / Inequality Index | 1,397 | 0.42 |
Earnings by Sex in Sumas
Average Earnings in Sumas are $52,656, $69,583 for men and $36,964 for women, a difference of 46.9%.

| Sex | Number | Average Earnings |
| Male | 442 (61.3%) | $69,583 |
| Female | 279 (38.7%) | $36,964 |
| Total | 721 (100.0%) | $52,656 |
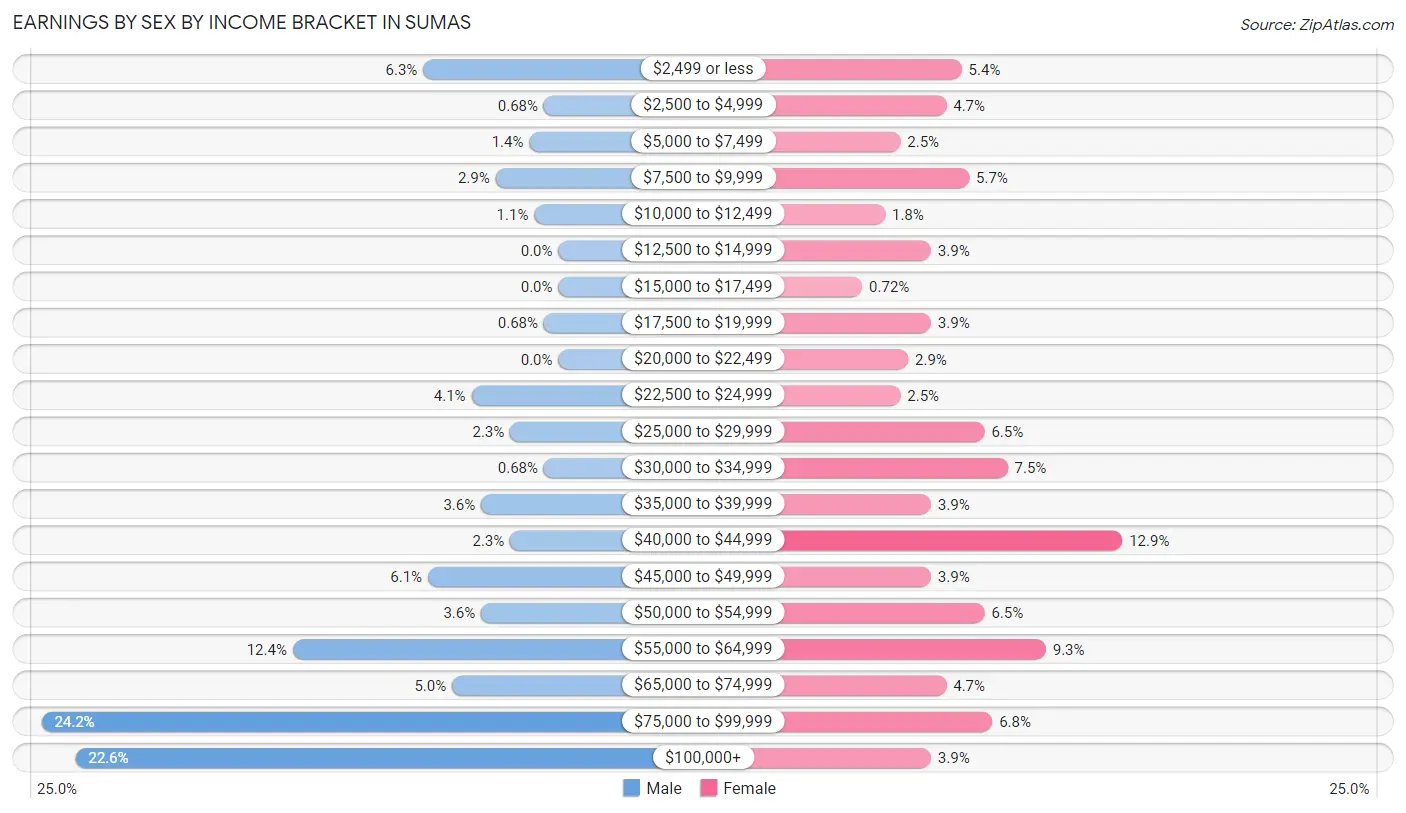
Earnings by Sex by Income Bracket in Sumas
The most common earnings brackets in Sumas are $75,000 to $99,999 for men (107 | 24.2%) and $40,000 to $44,999 for women (36 | 12.9%).
| Income | Male | Female |
| $2,499 or less | 28 (6.3%) | 15 (5.4%) |
| $2,500 to $4,999 | 3 (0.7%) | 13 (4.7%) |
| $5,000 to $7,499 | 6 (1.4%) | 7 (2.5%) |
| $7,500 to $9,999 | 13 (2.9%) | 16 (5.7%) |
| $10,000 to $12,499 | 5 (1.1%) | 5 (1.8%) |
| $12,500 to $14,999 | 0 (0.0%) | 11 (3.9%) |
| $15,000 to $17,499 | 0 (0.0%) | 2 (0.7%) |
| $17,500 to $19,999 | 3 (0.7%) | 11 (3.9%) |
| $20,000 to $22,499 | 0 (0.0%) | 8 (2.9%) |
| $22,500 to $24,999 | 18 (4.1%) | 7 (2.5%) |
| $25,000 to $29,999 | 10 (2.3%) | 18 (6.5%) |
| $30,000 to $34,999 | 3 (0.7%) | 21 (7.5%) |
| $35,000 to $39,999 | 16 (3.6%) | 11 (3.9%) |
| $40,000 to $44,999 | 10 (2.3%) | 36 (12.9%) |
| $45,000 to $49,999 | 27 (6.1%) | 11 (3.9%) |
| $50,000 to $54,999 | 16 (3.6%) | 18 (6.5%) |
| $55,000 to $64,999 | 55 (12.4%) | 26 (9.3%) |
| $65,000 to $74,999 | 22 (5.0%) | 13 (4.7%) |
| $75,000 to $99,999 | 107 (24.2%) | 19 (6.8%) |
| $100,000+ | 100 (22.6%) | 11 (3.9%) |
| Total | 442 (100.0%) | 279 (100.0%) |
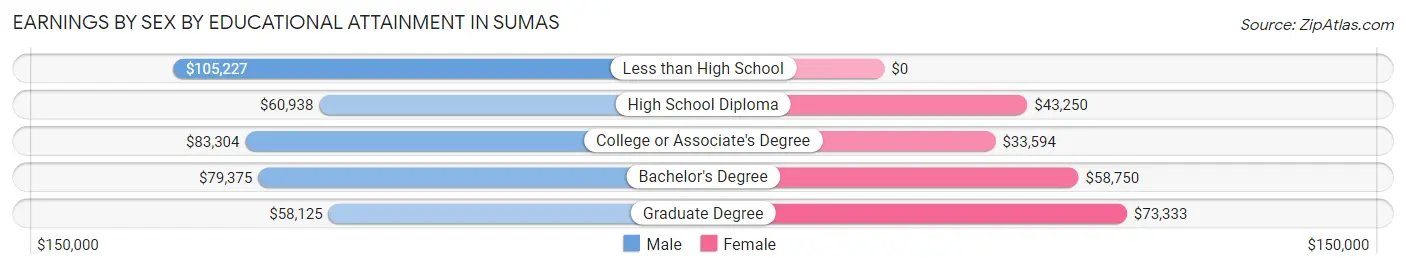
Earnings by Sex by Educational Attainment in Sumas
Average earnings in Sumas are $77,708 for men and $42,344 for women, a difference of 45.5%. Men with an educational attainment of less than high school enjoy the highest average annual earnings of $105,227, while those with graduate degree education earn the least with $58,125. Women with an educational attainment of graduate degree earn the most with the average annual earnings of $73,333, while those with college or associate's degree education have the smallest earnings of $33,594.
| Educational Attainment | Male Income | Female Income |
| Less than High School | $105,227 | $0 |
| High School Diploma | $60,938 | $43,250 |
| College or Associate's Degree | $83,304 | $33,594 |
| Bachelor's Degree | $79,375 | $58,750 |
| Graduate Degree | $58,125 | $73,333 |
| Total | $77,708 | $42,344 |
Family Income in Sumas
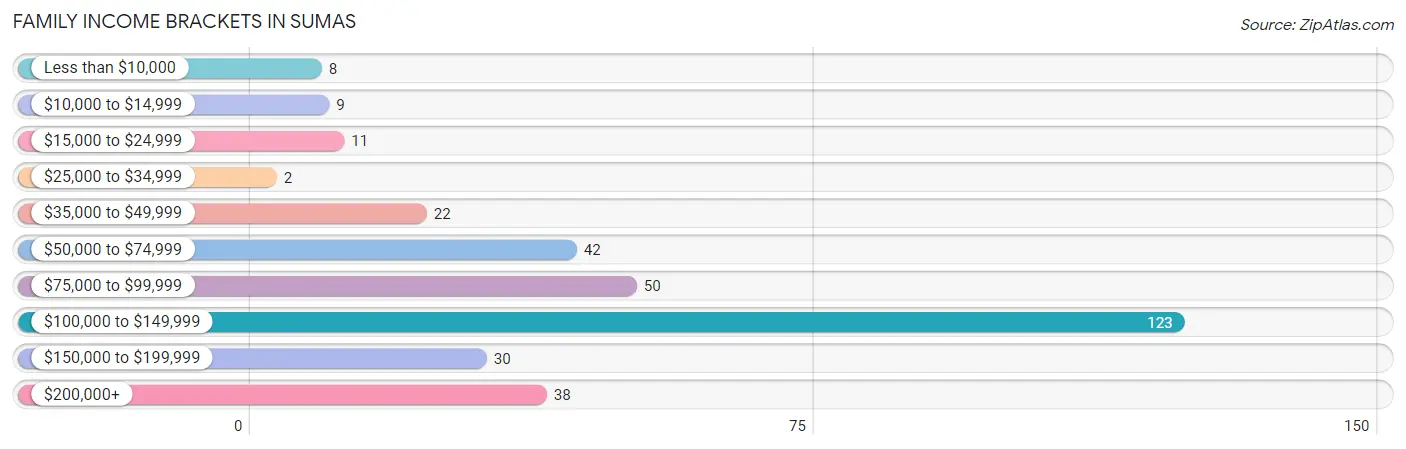
Family Income Brackets in Sumas
According to the Sumas family income data, there are 123 families falling into the $100,000 to $149,999 income range, which is the most common income bracket and makes up 36.7% of all families. Conversely, the $25,000 to $34,999 income bracket is the least frequent group with only 2 families (0.6%) belonging to this category.
| Income Bracket | # Families | % Families |
| Less than $10,000 | 8 | 2.4% |
| $10,000 to $14,999 | 9 | 2.7% |
| $15,000 to $24,999 | 11 | 3.3% |
| $25,000 to $34,999 | 2 | 0.6% |
| $35,000 to $49,999 | 22 | 6.6% |
| $50,000 to $74,999 | 42 | 12.5% |
| $75,000 to $99,999 | 50 | 14.9% |
| $100,000 to $149,999 | 123 | 36.7% |
| $150,000 to $199,999 | 30 | 9.0% |
| $200,000+ | 38 | 11.3% |
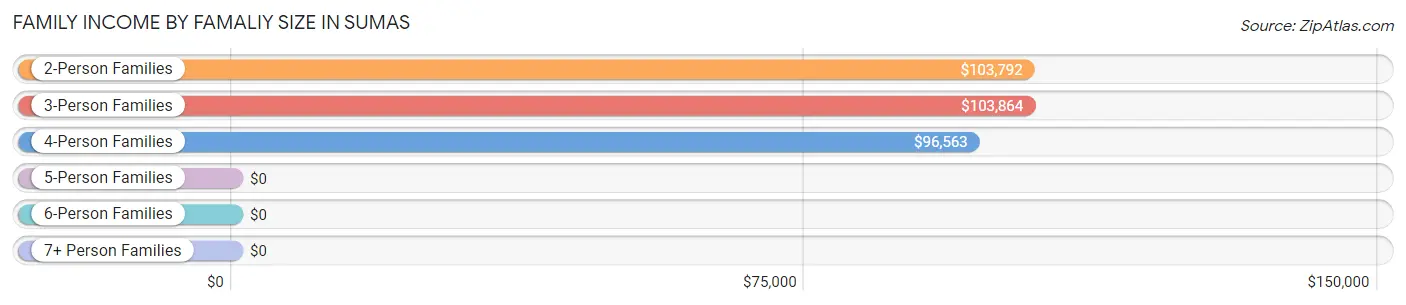
Family Income by Famaliy Size in Sumas
3-person families (66 | 19.7%) account for the highest median family income in Sumas with $103,864 per family, while 2-person families (131 | 39.1%) have the highest median income of $51,896 per family member.
| Income Bracket | # Families | Median Income |
| 2-Person Families | 131 (39.1%) | $103,792 |
| 3-Person Families | 66 (19.7%) | $103,864 |
| 4-Person Families | 61 (18.2%) | $96,563 |
| 5-Person Families | 56 (16.7%) | $0 |
| 6-Person Families | 21 (6.3%) | $0 |
| 7+ Person Families | 0 (0.0%) | $0 |
| Total | 335 (100.0%) | $103,506 |
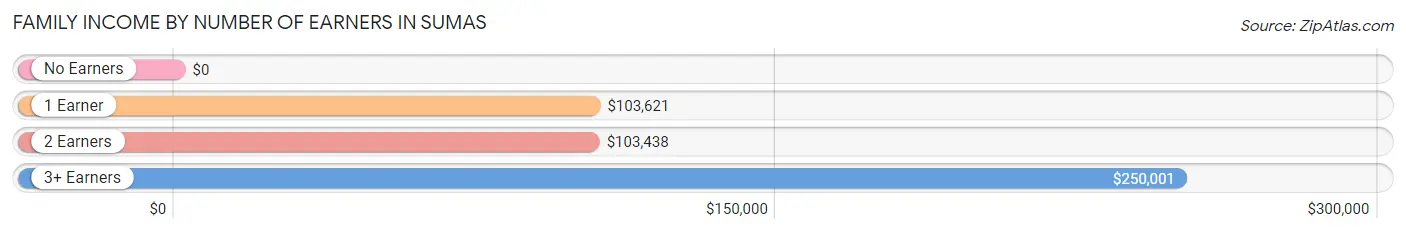
Family Income by Number of Earners in Sumas
| Number of Earners | # Families | Median Income |
| No Earners | 34 (10.2%) | $0 |
| 1 Earner | 84 (25.1%) | $103,621 |
| 2 Earners | 181 (54.0%) | $103,438 |
| 3+ Earners | 36 (10.7%) | $250,001 |
| Total | 335 (100.0%) | $103,506 |
Household Income in Sumas
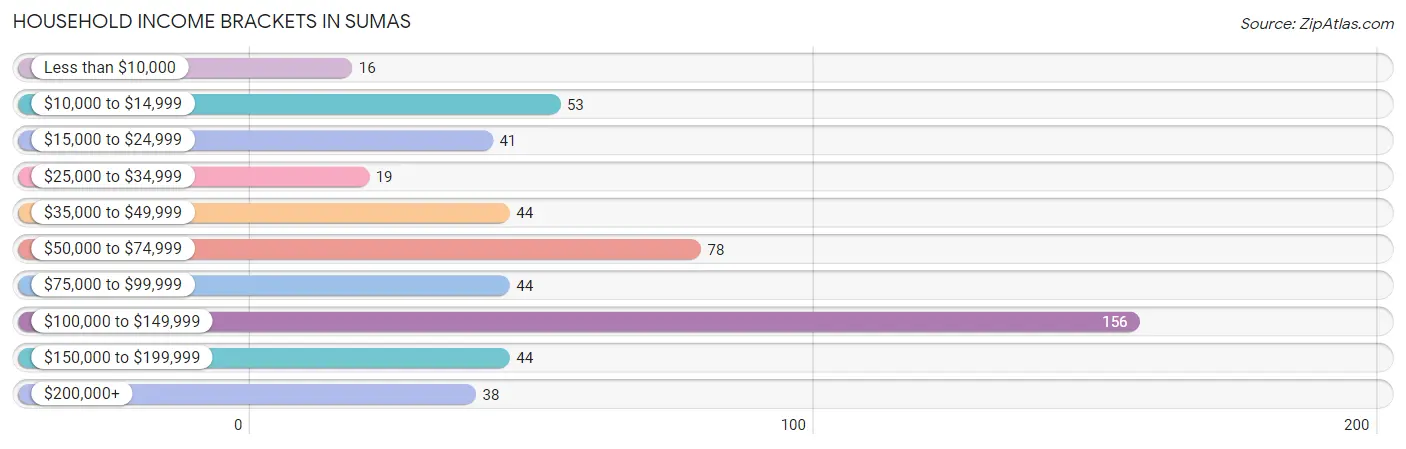
Household Income Brackets in Sumas
With 156 households falling in the category, the $100,000 to $149,999 income range is the most frequent in Sumas, accounting for 29.3% of all households. In contrast, only 16 households (3.0%) fall into the less than $10,000 income bracket, making it the least populous group.
| Income Bracket | # Households | % Households |
| Less than $10,000 | 16 | 3.0% |
| $10,000 to $14,999 | 53 | 9.9% |
| $15,000 to $24,999 | 41 | 7.7% |
| $25,000 to $34,999 | 19 | 3.6% |
| $35,000 to $49,999 | 44 | 8.3% |
| $50,000 to $74,999 | 78 | 14.6% |
| $75,000 to $99,999 | 44 | 8.3% |
| $100,000 to $149,999 | 156 | 29.3% |
| $150,000 to $199,999 | 44 | 8.3% |
| $200,000+ | 38 | 7.1% |
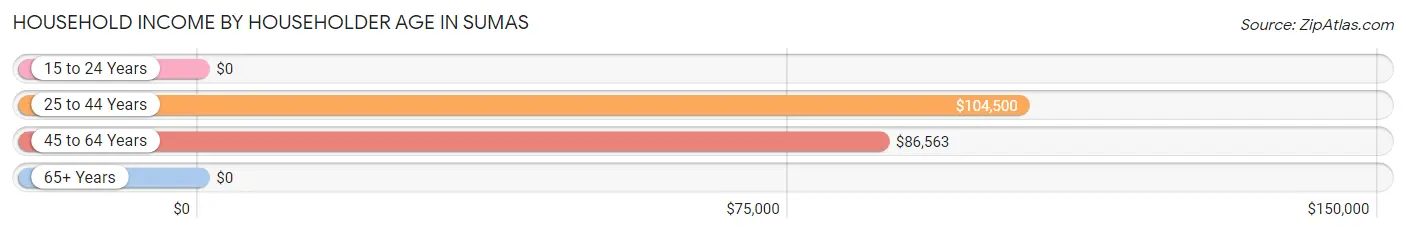
Household Income by Householder Age in Sumas
The median household income in Sumas is $82,188, with the highest median household income of $104,500 found in the 25 to 44 years age bracket for the primary householder. A total of 226 households (42.4%) fall into this category. Meanwhile, the 15 to 24 years age bracket for the primary householder has the lowest median household income of $0, with 31 households (5.8%) in this group.
| Income Bracket | # Households | Median Income |
| 15 to 24 Years | 31 (5.8%) | $0 |
| 25 to 44 Years | 226 (42.4%) | $104,500 |
| 45 to 64 Years | 157 (29.5%) | $86,563 |
| 65+ Years | 119 (22.3%) | $0 |
| Total | 533 (100.0%) | $82,188 |
Poverty in Sumas
Income Below Poverty by Sex and Age in Sumas
With 4.8% poverty level for males and 14.8% for females among the residents of Sumas, 75 year old and over males and 15 year old females are the most vulnerable to poverty, with 3 males (50.0%) and 1 females (100.0%) in their respective age groups living below the poverty level.
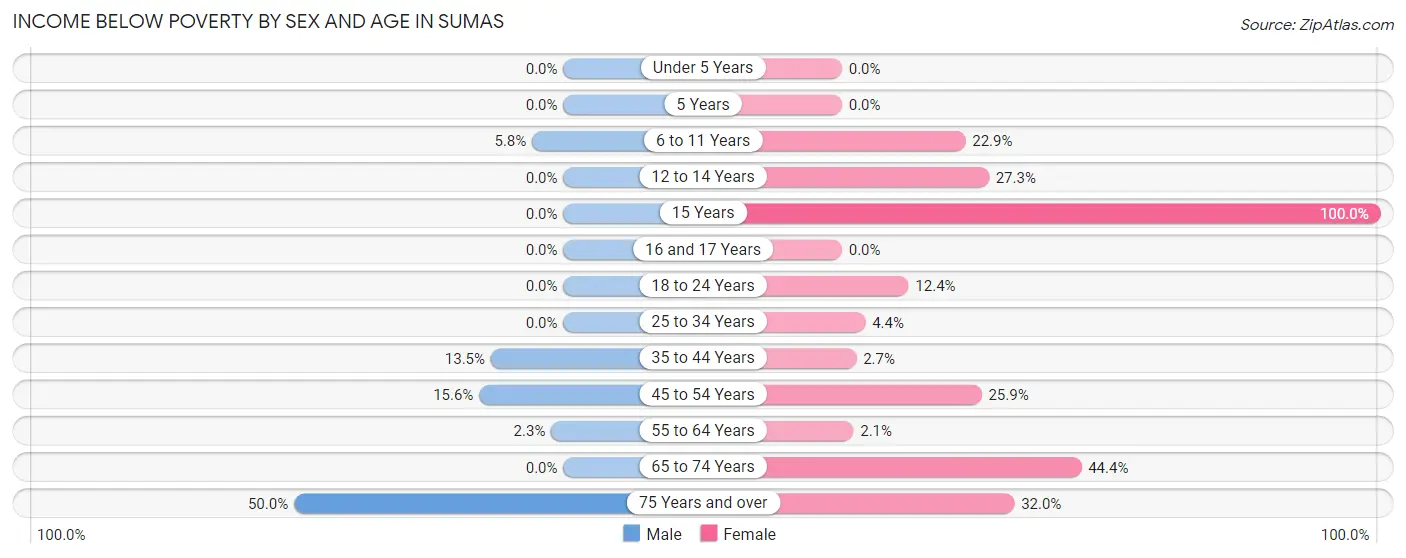
| Age Bracket | Male | Female |
| Under 5 Years | 0 (0.0%) | 0 (0.0%) |
| 5 Years | 0 (0.0%) | 0 (0.0%) |
| 6 to 11 Years | 4 (5.8%) | 11 (22.9%) |
| 12 to 14 Years | 0 (0.0%) | 12 (27.3%) |
| 15 Years | 0 (0.0%) | 1 (100.0%) |
| 16 and 17 Years | 0 (0.0%) | 0 (0.0%) |
| 18 to 24 Years | 0 (0.0%) | 11 (12.4%) |
| 25 to 34 Years | 0 (0.0%) | 4 (4.3%) |
| 35 to 44 Years | 14 (13.5%) | 2 (2.7%) |
| 45 to 54 Years | 10 (15.6%) | 21 (25.9%) |
| 55 to 64 Years | 2 (2.2%) | 2 (2.1%) |
| 65 to 74 Years | 0 (0.0%) | 16 (44.4%) |
| 75 Years and over | 3 (50.0%) | 16 (32.0%) |
| Total | 33 (4.8%) | 96 (14.8%) |
Income Above Poverty by Sex and Age in Sumas
According to the poverty statistics in Sumas, males aged under 5 years and females aged under 5 years are the age groups that are most secure financially, with 100.0% of males and 100.0% of females in these age groups living above the poverty line.
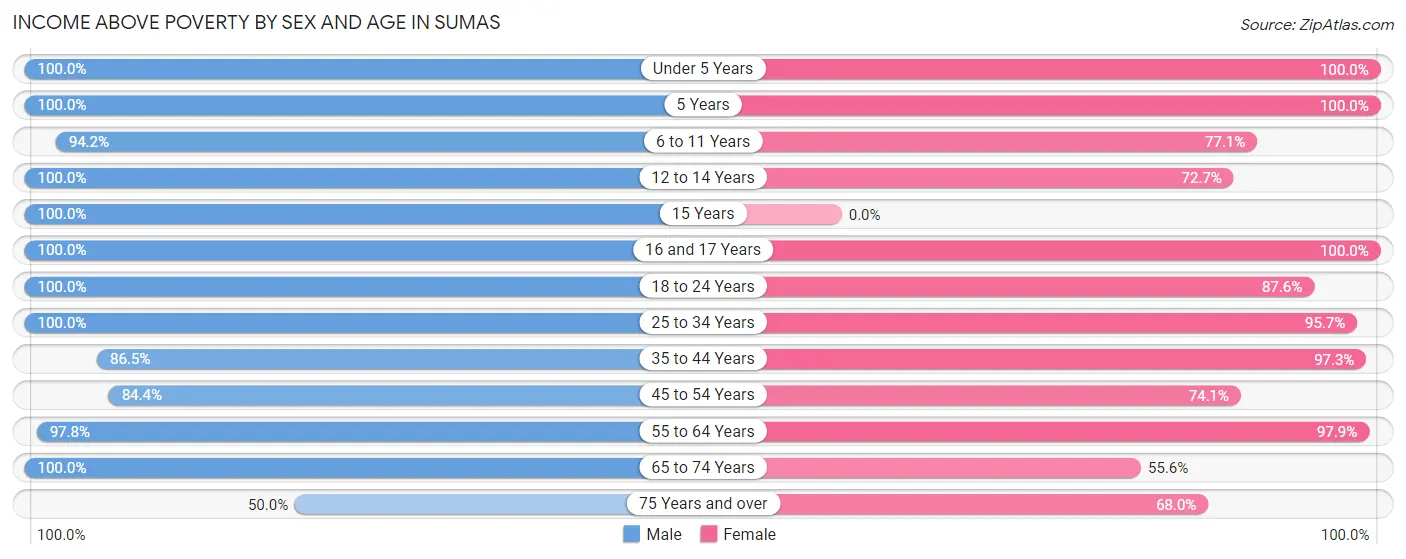
| Age Bracket | Male | Female |
| Under 5 Years | 38 (100.0%) | 31 (100.0%) |
| 5 Years | 1 (100.0%) | 2 (100.0%) |
| 6 to 11 Years | 65 (94.2%) | 37 (77.1%) |
| 12 to 14 Years | 22 (100.0%) | 32 (72.7%) |
| 15 Years | 6 (100.0%) | 0 (0.0%) |
| 16 and 17 Years | 36 (100.0%) | 4 (100.0%) |
| 18 to 24 Years | 67 (100.0%) | 78 (87.6%) |
| 25 to 34 Years | 138 (100.0%) | 88 (95.7%) |
| 35 to 44 Years | 90 (86.5%) | 73 (97.3%) |
| 45 to 54 Years | 54 (84.4%) | 60 (74.1%) |
| 55 to 64 Years | 87 (97.8%) | 92 (97.9%) |
| 65 to 74 Years | 46 (100.0%) | 20 (55.6%) |
| 75 Years and over | 3 (50.0%) | 34 (68.0%) |
| Total | 653 (95.2%) | 551 (85.2%) |
Income Below Poverty Among Married-Couple Families in Sumas
The poverty statistics for married-couple families in Sumas show that 4.0% or 11 of the total 274 families live below the poverty line. Families with 3 or 4 children have the highest poverty rate of 14.6%, comprising of 6 families. On the other hand, families with 1 or 2 children have the lowest poverty rate of 1.7%, which includes 2 families.
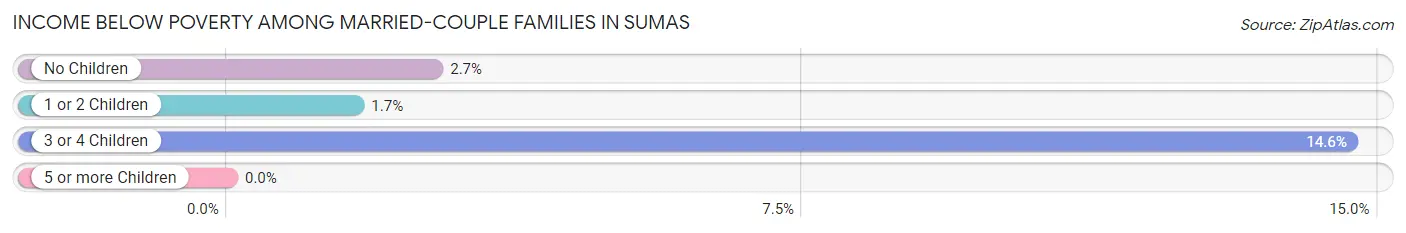
| Children | Above Poverty | Below Poverty |
| No Children | 109 (97.3%) | 3 (2.7%) |
| 1 or 2 Children | 119 (98.4%) | 2 (1.7%) |
| 3 or 4 Children | 35 (85.4%) | 6 (14.6%) |
| 5 or more Children | 0 (0.0%) | 0 (0.0%) |
| Total | 263 (96.0%) | 11 (4.0%) |
Income Below Poverty Among Single-Parent Households in Sumas
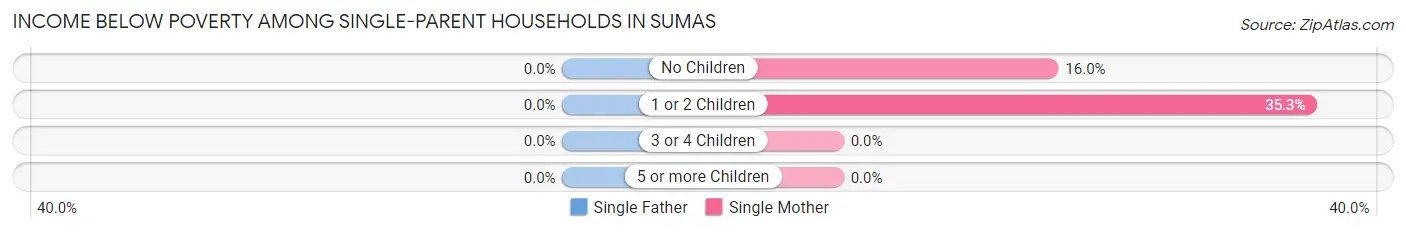
| Children | Single Father | Single Mother |
| No Children | 0 (0.0%) | 4 (16.0%) |
| 1 or 2 Children | 0 (0.0%) | 6 (35.3%) |
| 3 or 4 Children | 0 (0.0%) | 0 (0.0%) |
| 5 or more Children | 0 (0.0%) | 0 (0.0%) |
| Total | 0 (0.0%) | 10 (23.8%) |
Income Below Poverty Among Married-Couple vs Single-Parent Households in Sumas
The poverty data for Sumas shows that 11 of the married-couple family households (4.0%) and 10 of the single-parent households (16.4%) are living below the poverty level. Within the married-couple family households, those with 3 or 4 children have the highest poverty rate, with 6 households (14.6%) falling below the poverty line. Among the single-parent households, those with 1 or 2 children have the highest poverty rate, with 6 household (25.0%) living below poverty.
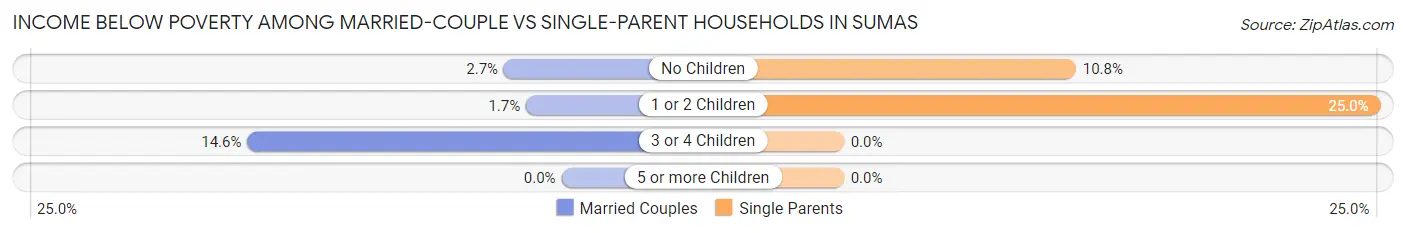
| Children | Married-Couple Families | Single-Parent Households |
| No Children | 3 (2.7%) | 4 (10.8%) |
| 1 or 2 Children | 2 (1.7%) | 6 (25.0%) |
| 3 or 4 Children | 6 (14.6%) | 0 (0.0%) |
| 5 or more Children | 0 (0.0%) | 0 (0.0%) |
| Total | 11 (4.0%) | 10 (16.4%) |
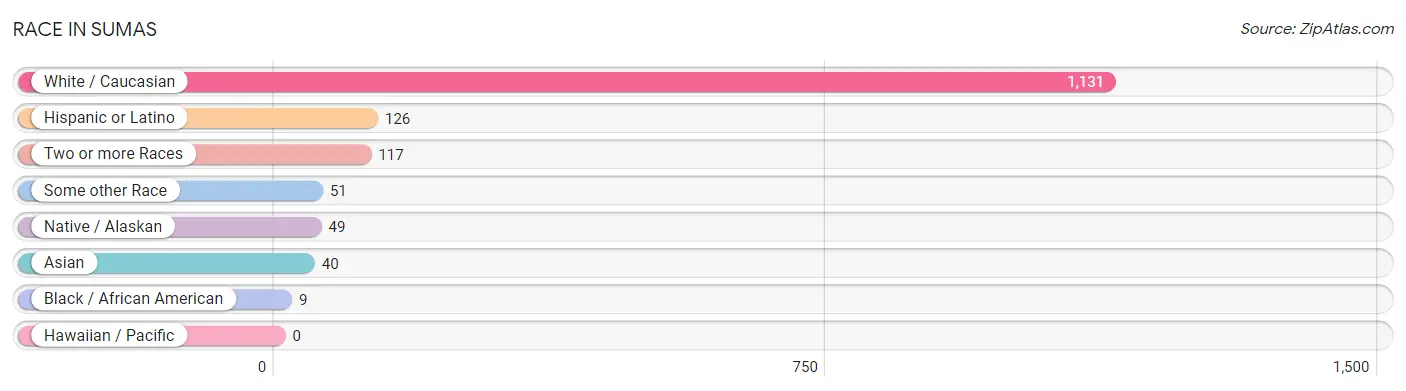
Race in Sumas
The most populous races in Sumas are White / Caucasian (1,131 | 81.0%), Hispanic or Latino (126 | 9.0%), and Two or more Races (117 | 8.4%).
| Race | # Population | % Population |
| Asian | 40 | 2.9% |
| Black / African American | 9 | 0.6% |
| Hawaiian / Pacific | 0 | 0.0% |
| Hispanic or Latino | 126 | 9.0% |
| Native / Alaskan | 49 | 3.5% |
| White / Caucasian | 1,131 | 81.0% |
| Two or more Races | 117 | 8.4% |
| Some other Race | 51 | 3.6% |
| Total | 1,397 | 100.0% |
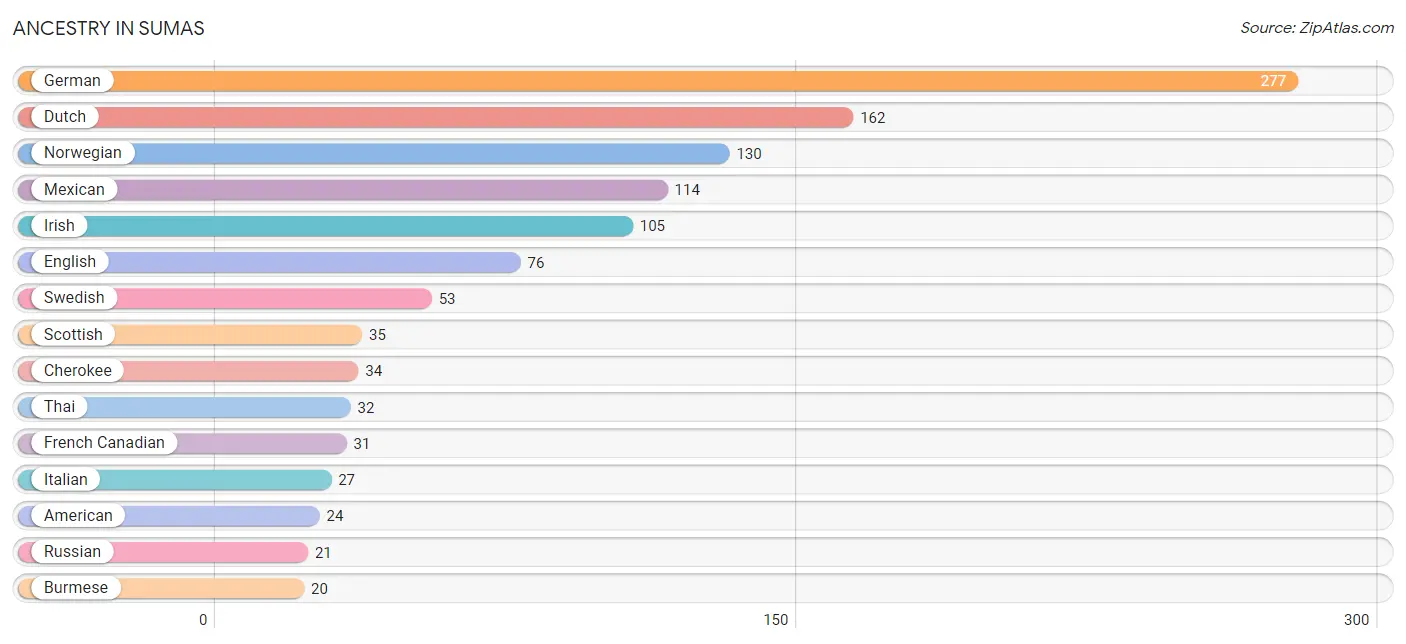
Ancestry in Sumas
The most populous ancestries reported in Sumas are German (277 | 19.8%), Dutch (162 | 11.6%), Norwegian (130 | 9.3%), Mexican (114 | 8.2%), and Irish (105 | 7.5%), together accounting for 56.4% of all Sumas residents.
| Ancestry | # Population | % Population |
| American | 24 | 1.7% |
| Blackfeet | 5 | 0.4% |
| British | 9 | 0.6% |
| Burmese | 20 | 1.4% |
| Cherokee | 34 | 2.4% |
| Danish | 18 | 1.3% |
| Dutch | 162 | 11.6% |
| Eastern European | 4 | 0.3% |
| English | 76 | 5.4% |
| French | 15 | 1.1% |
| French Canadian | 31 | 2.2% |
| German | 277 | 19.8% |
| Icelander | 12 | 0.9% |
| Indian (Asian) | 4 | 0.3% |
| Irish | 105 | 7.5% |
| Italian | 27 | 1.9% |
| Korean | 18 | 1.3% |
| Mexican | 114 | 8.2% |
| Mexican American Indian | 2 | 0.1% |
| Navajo | 3 | 0.2% |
| Northern European | 12 | 0.9% |
| Norwegian | 130 | 9.3% |
| Polish | 6 | 0.4% |
| Portuguese | 10 | 0.7% |
| Puget Sound Salish | 10 | 0.7% |
| Russian | 21 | 1.5% |
| Scandinavian | 5 | 0.4% |
| Scotch-Irish | 17 | 1.2% |
| Scottish | 35 | 2.5% |
| Slavic | 7 | 0.5% |
| Slovak | 6 | 0.4% |
| Spanish | 9 | 0.6% |
| Swedish | 53 | 3.8% |
| Swiss | 3 | 0.2% |
| Thai | 32 | 2.3% |
| Ukrainian | 20 | 1.4% |
| Welsh | 6 | 0.4% |
| Yakama | 20 | 1.4% |
| Yaqui | 3 | 0.2% | View All 39 Rows |
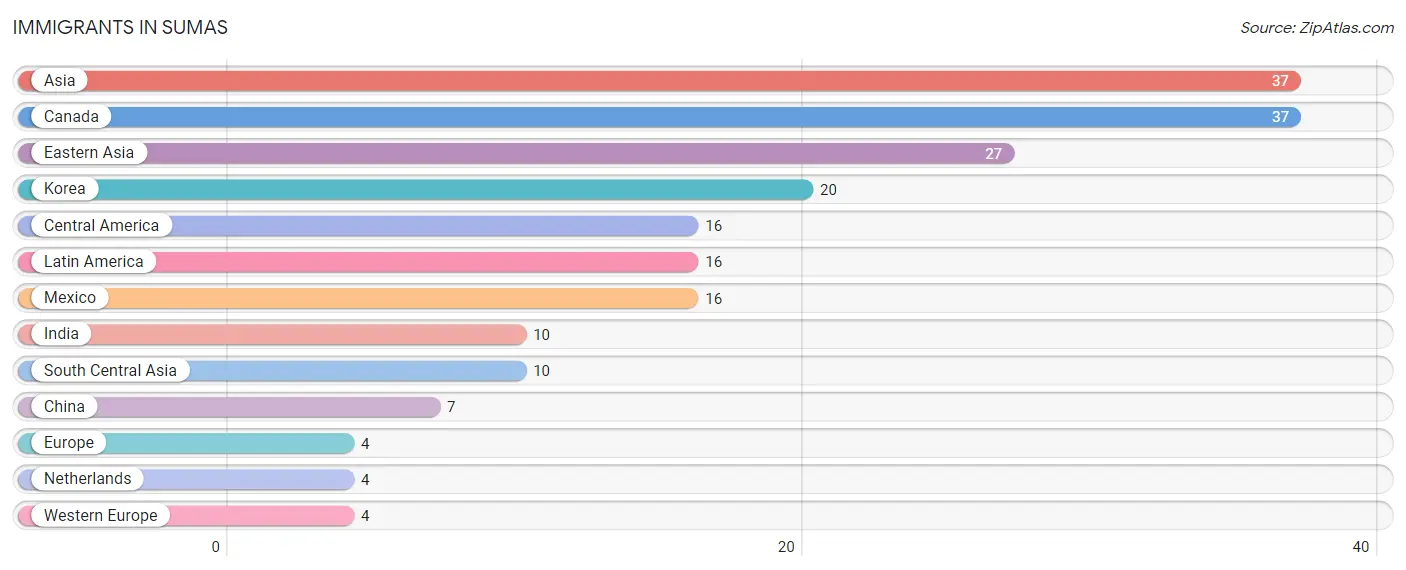
Immigrants in Sumas
The most numerous immigrant groups reported in Sumas came from Asia (37 | 2.6%), Canada (37 | 2.6%), Eastern Asia (27 | 1.9%), Korea (20 | 1.4%), and Central America (16 | 1.1%), together accounting for 9.8% of all Sumas residents.
| Immigration Origin | # Population | % Population |
| Asia | 37 | 2.6% |
| Canada | 37 | 2.6% |
| Central America | 16 | 1.1% |
| China | 7 | 0.5% |
| Eastern Asia | 27 | 1.9% |
| Europe | 4 | 0.3% |
| India | 10 | 0.7% |
| Korea | 20 | 1.4% |
| Latin America | 16 | 1.1% |
| Mexico | 16 | 1.1% |
| Netherlands | 4 | 0.3% |
| South Central Asia | 10 | 0.7% |
| Western Europe | 4 | 0.3% | View All 13 Rows |
Sex and Age in Sumas
Sex and Age in Sumas
The most populous age groups in Sumas are 25 to 29 Years (96 | 13.1%) for men and 10 to 14 Years (84 | 12.6%) for women.
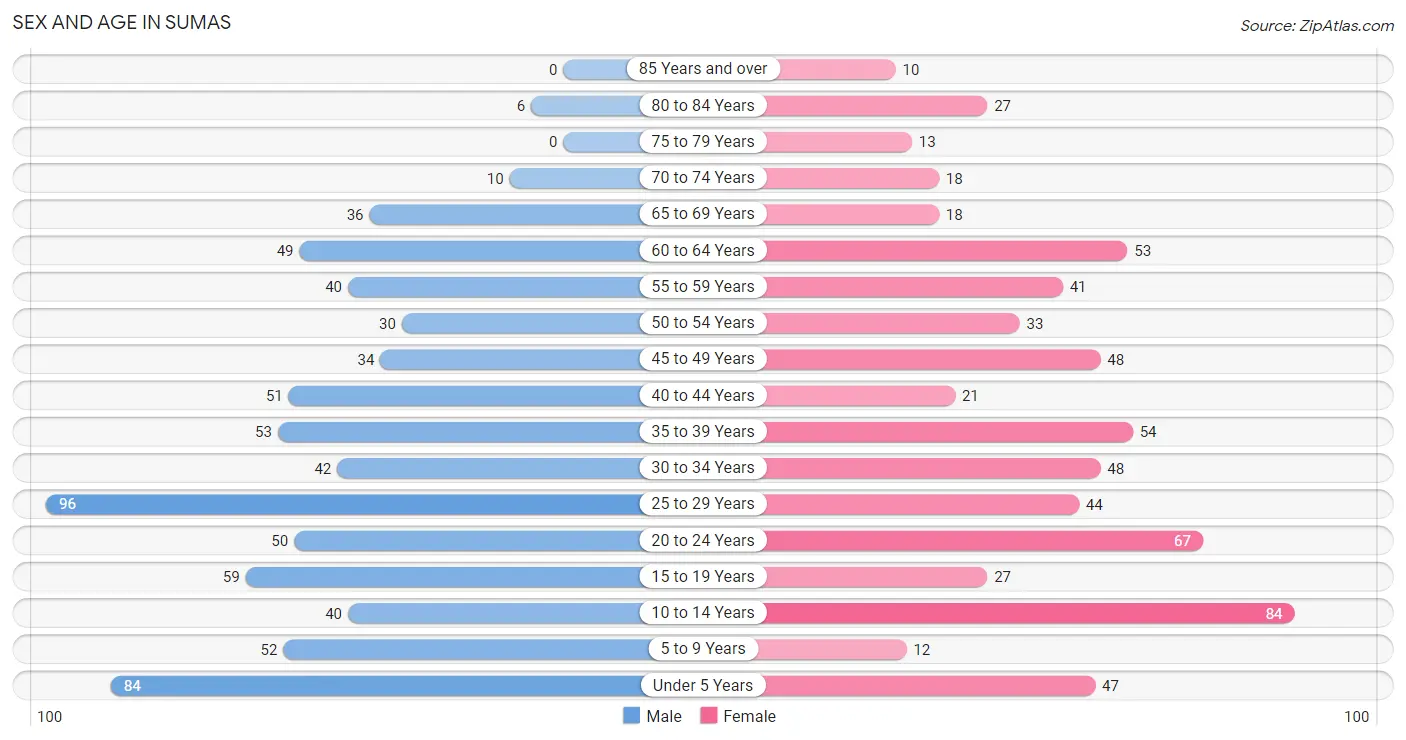
| Age Bracket | Male | Female |
| Under 5 Years | 84 (11.5%) | 47 (7.1%) |
| 5 to 9 Years | 52 (7.1%) | 12 (1.8%) |
| 10 to 14 Years | 40 (5.5%) | 84 (12.6%) |
| 15 to 19 Years | 59 (8.1%) | 27 (4.1%) |
| 20 to 24 Years | 50 (6.8%) | 67 (10.1%) |
| 25 to 29 Years | 96 (13.1%) | 44 (6.6%) |
| 30 to 34 Years | 42 (5.7%) | 48 (7.2%) |
| 35 to 39 Years | 53 (7.2%) | 54 (8.1%) |
| 40 to 44 Years | 51 (7.0%) | 21 (3.2%) |
| 45 to 49 Years | 34 (4.6%) | 48 (7.2%) |
| 50 to 54 Years | 30 (4.1%) | 33 (5.0%) |
| 55 to 59 Years | 40 (5.5%) | 41 (6.2%) |
| 60 to 64 Years | 49 (6.7%) | 53 (8.0%) |
| 65 to 69 Years | 36 (4.9%) | 18 (2.7%) |
| 70 to 74 Years | 10 (1.4%) | 18 (2.7%) |
| 75 to 79 Years | 0 (0.0%) | 13 (1.9%) |
| 80 to 84 Years | 6 (0.8%) | 27 (4.1%) |
| 85 Years and over | 0 (0.0%) | 10 (1.5%) |
| Total | 732 (100.0%) | 665 (100.0%) |
Families and Households in Sumas
Median Family Size in Sumas
The median family size in Sumas is 3.31 persons per family, with married-couple families (274 | 81.8%) accounting for the largest median family size of 3.49 persons per family. On the other hand, single male/father families (19 | 5.7%) represent the smallest median family size with 1.79 persons per family.
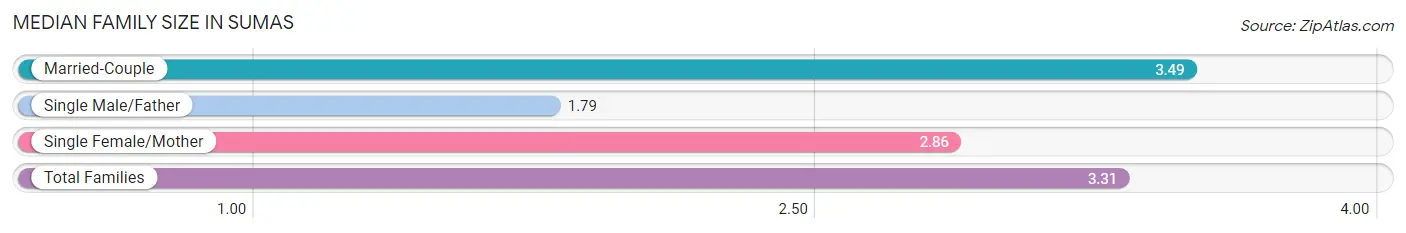
| Family Type | # Families | Family Size |
| Married-Couple | 274 (81.8%) | 3.49 |
| Single Male/Father | 19 (5.7%) | 1.79 |
| Single Female/Mother | 42 (12.5%) | 2.86 |
| Total Families | 335 (100.0%) | 3.31 |
Median Household Size in Sumas
The median household size in Sumas is 2.62 persons per household, with married-couple households (274 | 51.4%) accounting for the largest median household size of 3.74 persons per household. non-family households (198 | 37.1%) represent the smallest median household size with 1.05 persons per household.
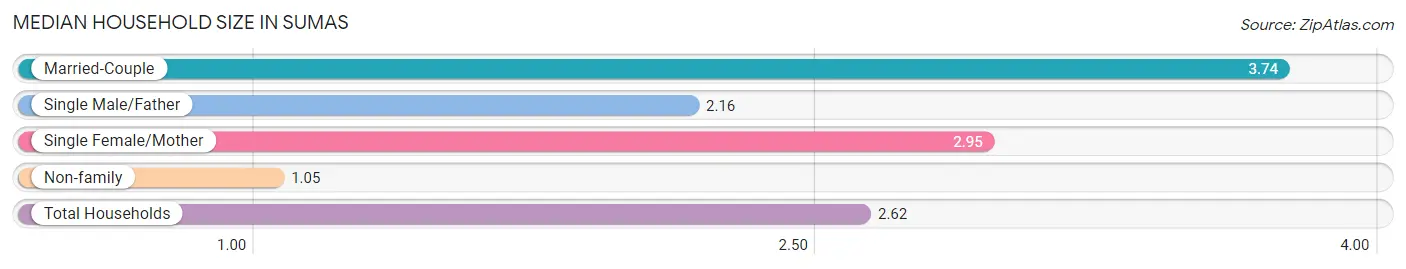
| Household Type | # Households | Household Size |
| Married-Couple | 274 (51.4%) | 3.74 |
| Single Male/Father | 19 (3.6%) | 2.16 |
| Single Female/Mother | 42 (7.9%) | 2.95 |
| Non-family | 198 (37.1%) | 1.05 |
| Total Households | 533 (100.0%) | 2.62 |
Household Size by Marriage Status in Sumas
Out of a total of 533 households in Sumas, 335 (62.8%) are family households, while 198 (37.1%) are nonfamily households. The most numerous type of family households are 2-person households, comprising 103, and the most common type of nonfamily households are 1-person households, comprising 189.
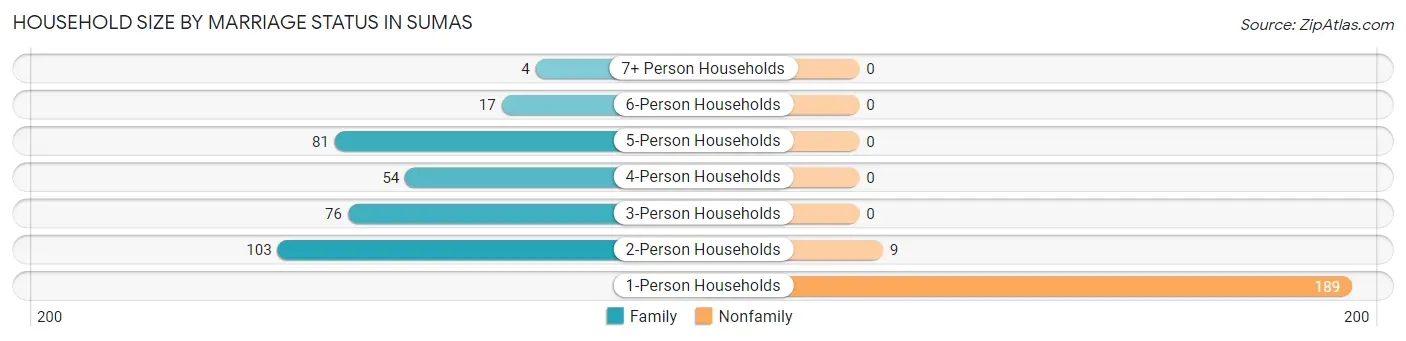
| Household Size | Family Households | Nonfamily Households |
| 1-Person Households | - | 189 (35.5%) |
| 2-Person Households | 103 (19.3%) | 9 (1.7%) |
| 3-Person Households | 76 (14.3%) | 0 (0.0%) |
| 4-Person Households | 54 (10.1%) | 0 (0.0%) |
| 5-Person Households | 81 (15.2%) | 0 (0.0%) |
| 6-Person Households | 17 (3.2%) | 0 (0.0%) |
| 7+ Person Households | 4 (0.7%) | 0 (0.0%) |
| Total | 335 (62.8%) | 198 (37.1%) |
Female Fertility in Sumas
Fertility by Age in Sumas
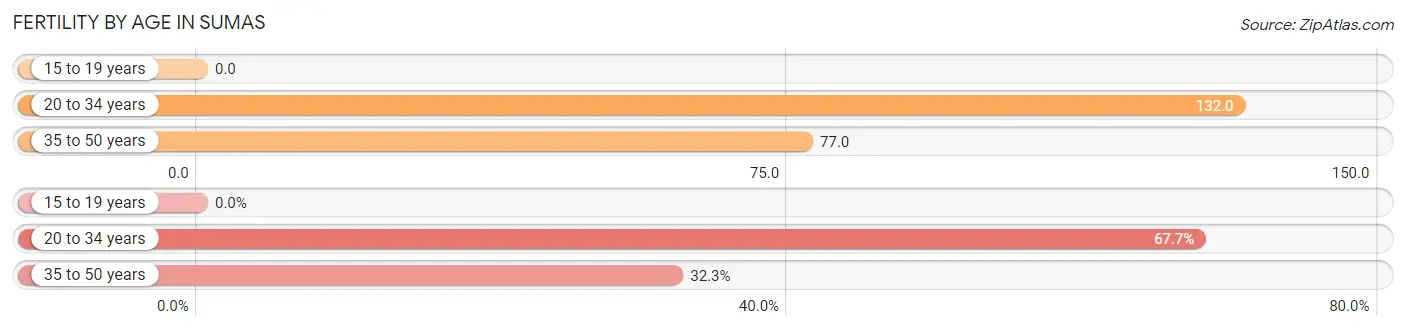
Average fertility rate in Sumas is 98.0 births per 1,000 women. Women in the age bracket of 20 to 34 years have the highest fertility rate with 132.0 births per 1,000 women. Women in the age bracket of 20 to 34 years acount for 67.7% of all women with births.
| Age Bracket | Women with Births | Births / 1,000 Women |
| 15 to 19 years | 0 (0.0%) | 0.0 |
| 20 to 34 years | 21 (67.7%) | 132.0 |
| 35 to 50 years | 10 (32.3%) | 77.0 |
| Total | 31 (100.0%) | 98.0 |
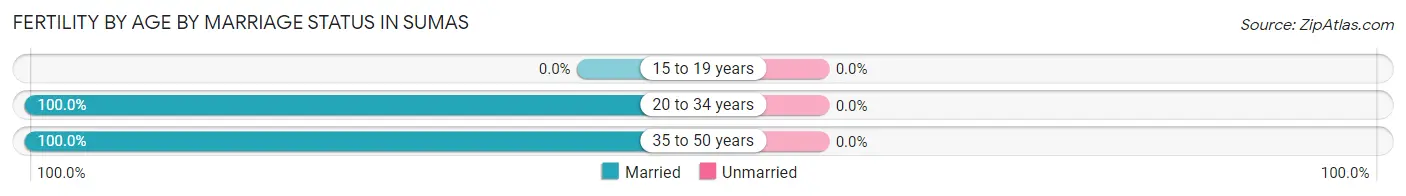
Fertility by Age by Marriage Status in Sumas
| Age Bracket | Married | Unmarried |
| 15 to 19 years | 0 (0.0%) | 0 (0.0%) |
| 20 to 34 years | 21 (100.0%) | 0 (0.0%) |
| 35 to 50 years | 10 (100.0%) | 0 (0.0%) |
| Total | 31 (100.0%) | 0 (0.0%) |
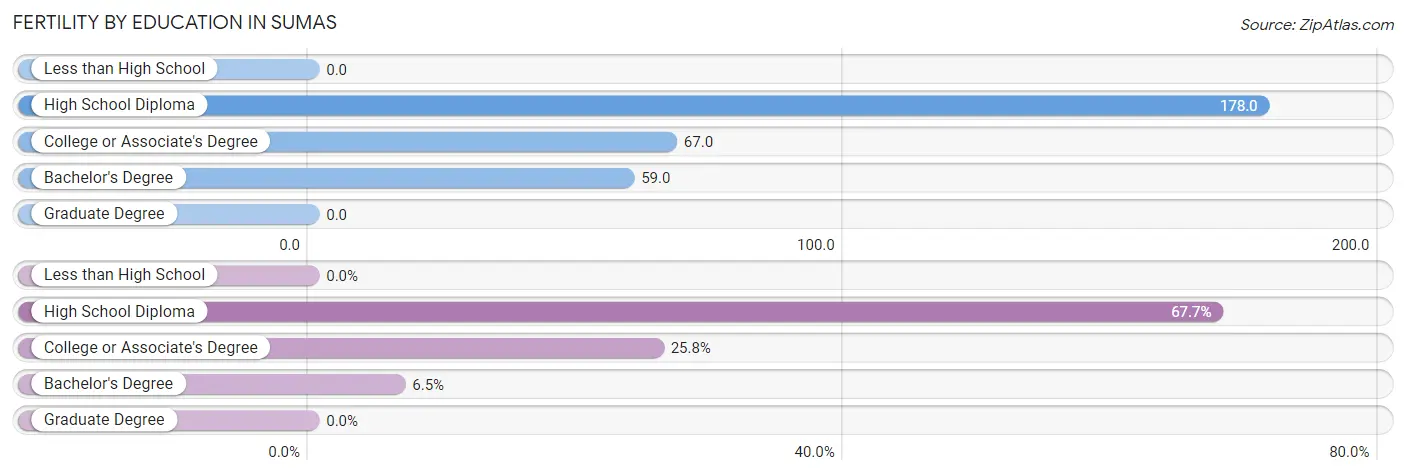
Fertility by Education in Sumas
| Educational Attainment | Women with Births | Births / 1,000 Women |
| Less than High School | 0 (0.0%) | 0.0 |
| High School Diploma | 21 (67.7%) | 178.0 |
| College or Associate's Degree | 8 (25.8%) | 67.0 |
| Bachelor's Degree | 2 (6.5%) | 59.0 |
| Graduate Degree | 0 (0.0%) | 0.0 |
| Total | 31 (100.0%) | 98.0 |
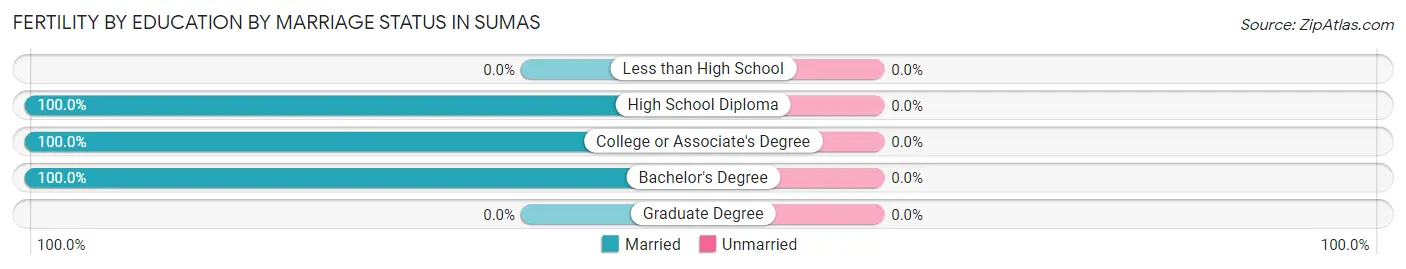
Fertility by Education by Marriage Status in Sumas
| Educational Attainment | Married | Unmarried |
| Less than High School | 0 (0.0%) | 0 (0.0%) |
| High School Diploma | 21 (100.0%) | 0 (0.0%) |
| College or Associate's Degree | 8 (100.0%) | 0 (0.0%) |
| Bachelor's Degree | 2 (100.0%) | 0 (0.0%) |
| Graduate Degree | 0 (0.0%) | 0 (0.0%) |
| Total | 31 (100.0%) | 0 (0.0%) |
Employment Characteristics in Sumas
Employment by Class of Employer in Sumas
Among the 651 employed individuals in Sumas, private company employees (437 | 67.1%), local government employees (57 | 8.8%), and not-for-profit organizations (44 | 6.8%) make up the most common classes of employment.
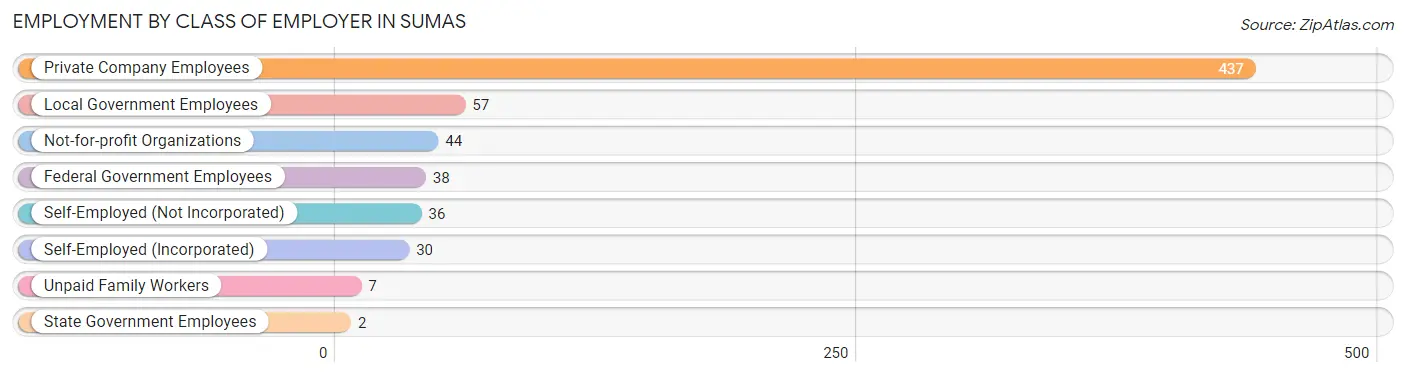
| Employer Class | # Employees | % Employees |
| Private Company Employees | 437 | 67.1% |
| Self-Employed (Incorporated) | 30 | 4.6% |
| Self-Employed (Not Incorporated) | 36 | 5.5% |
| Not-for-profit Organizations | 44 | 6.8% |
| Local Government Employees | 57 | 8.8% |
| State Government Employees | 2 | 0.3% |
| Federal Government Employees | 38 | 5.8% |
| Unpaid Family Workers | 7 | 1.1% |
| Total | 651 | 100.0% |
Employment Status by Age in Sumas
According to the labor force statistics for Sumas, out of the total population over 16 years of age (1,071), 63.9% or 684 individuals are in the labor force, with 3.8% or 26 of them unemployed. The age group with the highest labor force participation rate is 55 to 59 years, with 87.7% or 71 individuals in the labor force. Within the labor force, the 16 to 19 years age range has the highest percentage of unemployed individuals, with 21.1% or 4 of them being unemployed.
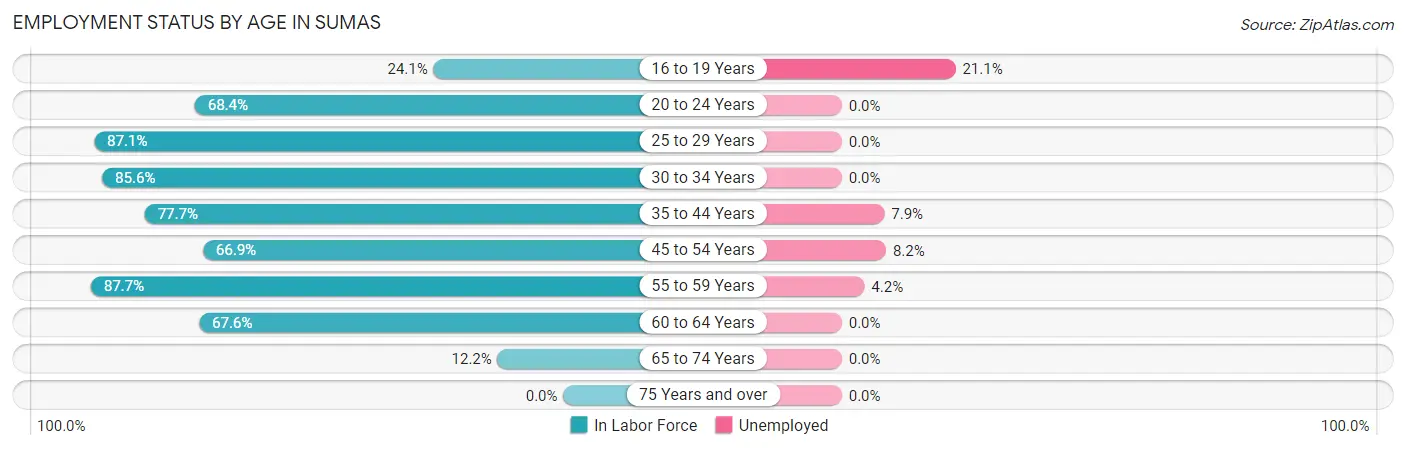
| Age Bracket | In Labor Force | Unemployed |
| 16 to 19 Years | 19 (24.1%) | 4 (21.1%) |
| 20 to 24 Years | 80 (68.4%) | 0 (0.0%) |
| 25 to 29 Years | 122 (87.1%) | 0 (0.0%) |
| 30 to 34 Years | 77 (85.6%) | 0 (0.0%) |
| 35 to 44 Years | 139 (77.7%) | 11 (7.9%) |
| 45 to 54 Years | 97 (66.9%) | 8 (8.2%) |
| 55 to 59 Years | 71 (87.7%) | 3 (4.2%) |
| 60 to 64 Years | 69 (67.6%) | 0 (0.0%) |
| 65 to 74 Years | 10 (12.2%) | 0 (0.0%) |
| 75 Years and over | 0 (0.0%) | 0 (0.0%) |
| Total | 684 (63.9%) | 26 (3.8%) |
Employment Status by Educational Attainment in Sumas
According to labor force statistics for Sumas, 78.0% of individuals (575) out of the total population between 25 and 64 years of age (737) are in the labor force, with 3.8% or 22 of them being unemployed. The group with the highest labor force participation rate are those with the educational attainment of bachelor's degree or higher, with 95.0% or 96 individuals in the labor force. Within the labor force, individuals with less than high school education have the highest percentage of unemployment, with 6.8% or 3 of them being unemployed.
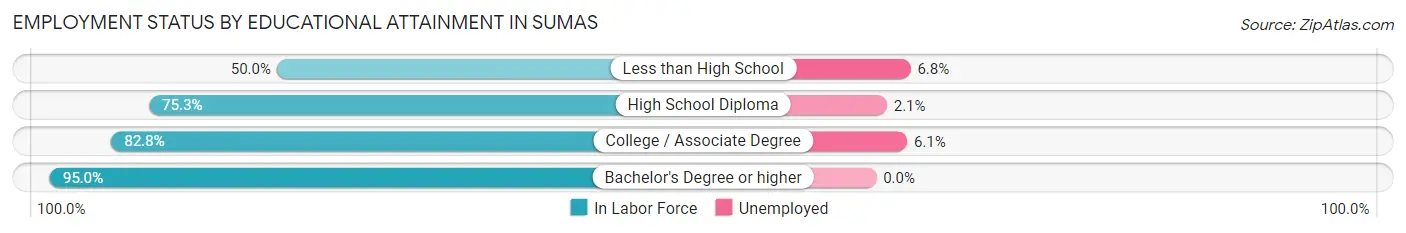
| Educational Attainment | In Labor Force | Unemployed |
| Less than High School | 44 (50.0%) | 6 (6.8%) |
| High School Diploma | 189 (75.3%) | 5 (2.1%) |
| College / Associate Degree | 246 (82.8%) | 18 (6.1%) |
| Bachelor's Degree or higher | 96 (95.0%) | 0 (0.0%) |
| Total | 575 (78.0%) | 28 (3.8%) |
Employment Occupations by Sex in Sumas
Management, Business, Science and Arts Occupations
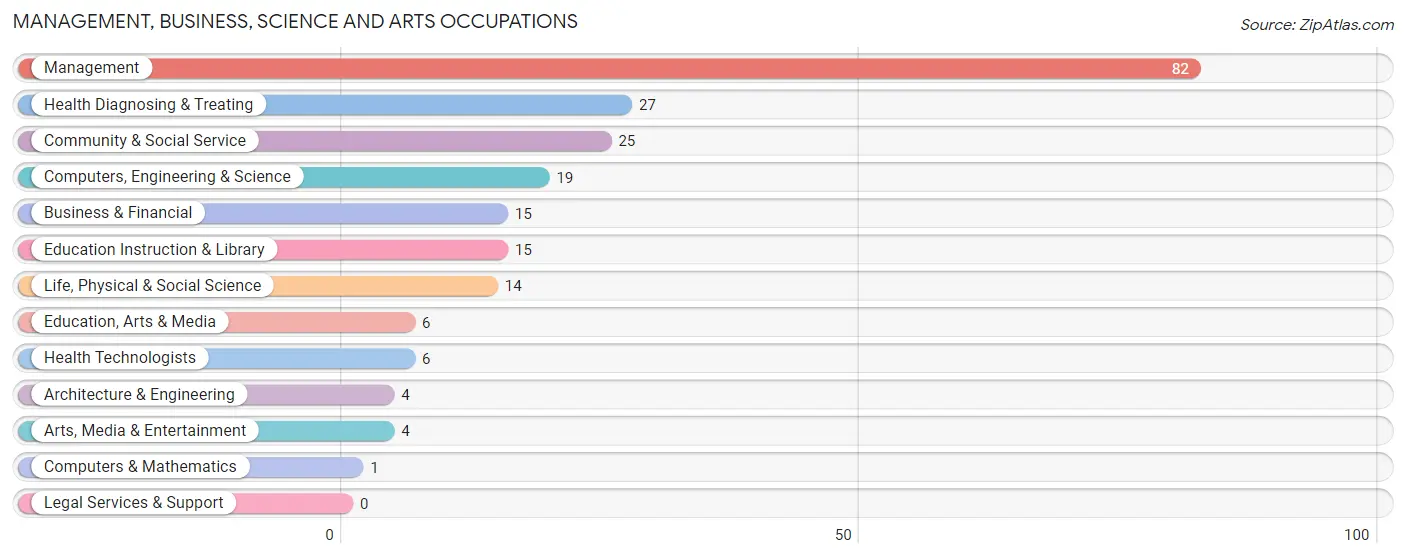
The most common Management, Business, Science and Arts occupations in Sumas are Management (82 | 12.5%), Health Diagnosing & Treating (27 | 4.1%), Community & Social Service (25 | 3.8%), Computers, Engineering & Science (19 | 2.9%), and Business & Financial (15 | 2.3%).
Management, Business, Science and Arts Occupations by Sex
Within the Management, Business, Science and Arts occupations in Sumas, the most male-oriented occupations are Computers, Engineering & Science (100.0%), Computers & Mathematics (100.0%), and Architecture & Engineering (100.0%), while the most female-oriented occupations are Health Technologists (100.0%), Health Diagnosing & Treating (92.6%), and Business & Financial (46.7%).
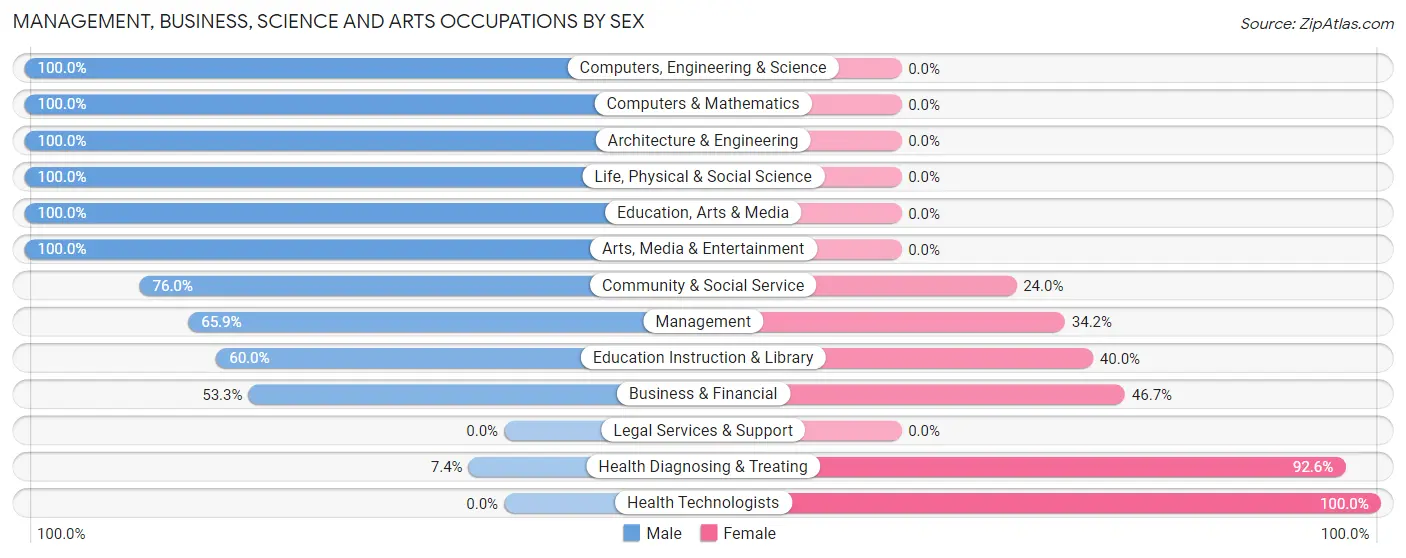
| Occupation | Male | Female |
| Management | 54 (65.8%) | 28 (34.2%) |
| Business & Financial | 8 (53.3%) | 7 (46.7%) |
| Computers, Engineering & Science | 19 (100.0%) | 0 (0.0%) |
| Computers & Mathematics | 1 (100.0%) | 0 (0.0%) |
| Architecture & Engineering | 4 (100.0%) | 0 (0.0%) |
| Life, Physical & Social Science | 14 (100.0%) | 0 (0.0%) |
| Community & Social Service | 19 (76.0%) | 6 (24.0%) |
| Education, Arts & Media | 6 (100.0%) | 0 (0.0%) |
| Legal Services & Support | 0 (0.0%) | 0 (0.0%) |
| Education Instruction & Library | 9 (60.0%) | 6 (40.0%) |
| Arts, Media & Entertainment | 4 (100.0%) | 0 (0.0%) |
| Health Diagnosing & Treating | 2 (7.4%) | 25 (92.6%) |
| Health Technologists | 0 (0.0%) | 6 (100.0%) |
| Total (Category) | 102 (60.7%) | 66 (39.3%) |
| Total (Overall) | 405 (61.6%) | 253 (38.5%) |
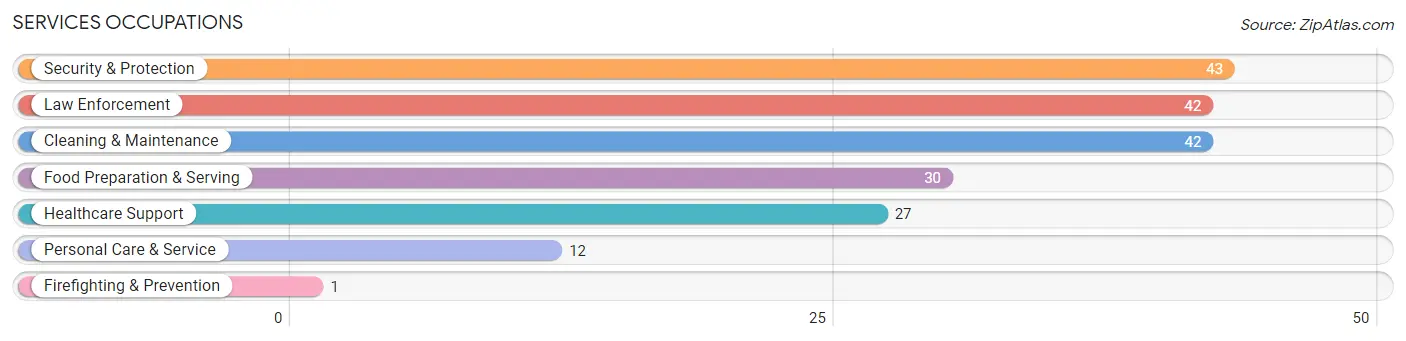
Services Occupations
The most common Services occupations in Sumas are Security & Protection (43 | 6.5%), Law Enforcement (42 | 6.4%), Cleaning & Maintenance (42 | 6.4%), Food Preparation & Serving (30 | 4.6%), and Healthcare Support (27 | 4.1%).
Services Occupations by Sex
Within the Services occupations in Sumas, the most male-oriented occupations are Law Enforcement (100.0%), Security & Protection (97.7%), and Food Preparation & Serving (43.3%), while the most female-oriented occupations are Healthcare Support (100.0%), Firefighting & Prevention (100.0%), and Personal Care & Service (100.0%).
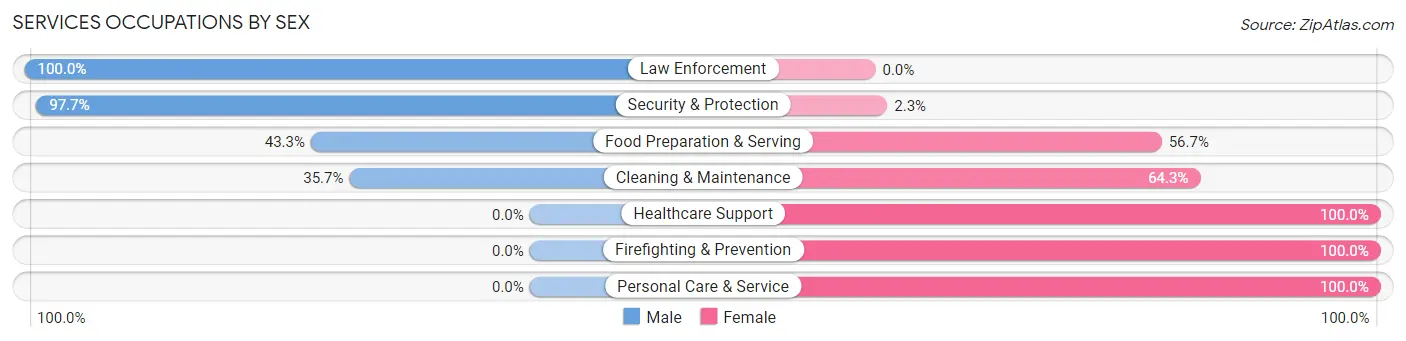
| Occupation | Male | Female |
| Healthcare Support | 0 (0.0%) | 27 (100.0%) |
| Security & Protection | 42 (97.7%) | 1 (2.3%) |
| Firefighting & Prevention | 0 (0.0%) | 1 (100.0%) |
| Law Enforcement | 42 (100.0%) | 0 (0.0%) |
| Food Preparation & Serving | 13 (43.3%) | 17 (56.7%) |
| Cleaning & Maintenance | 15 (35.7%) | 27 (64.3%) |
| Personal Care & Service | 0 (0.0%) | 12 (100.0%) |
| Total (Category) | 70 (45.5%) | 84 (54.5%) |
| Total (Overall) | 405 (61.6%) | 253 (38.5%) |
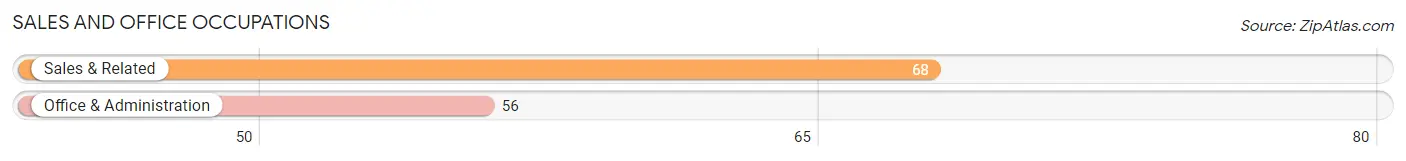
Sales and Office Occupations
The most common Sales and Office occupations in Sumas are Sales & Related (68 | 10.3%), and Office & Administration (56 | 8.5%).
Sales and Office Occupations by Sex
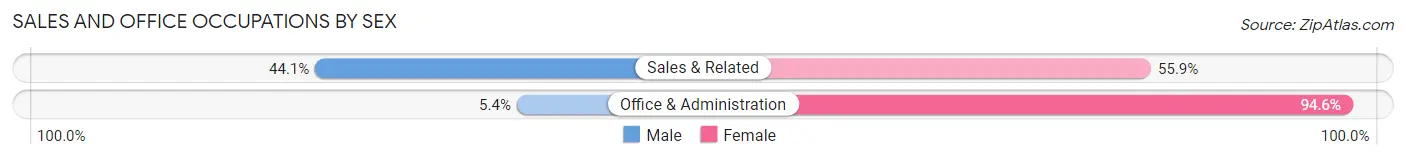
| Occupation | Male | Female |
| Sales & Related | 30 (44.1%) | 38 (55.9%) |
| Office & Administration | 3 (5.4%) | 53 (94.6%) |
| Total (Category) | 33 (26.6%) | 91 (73.4%) |
| Total (Overall) | 405 (61.6%) | 253 (38.5%) |
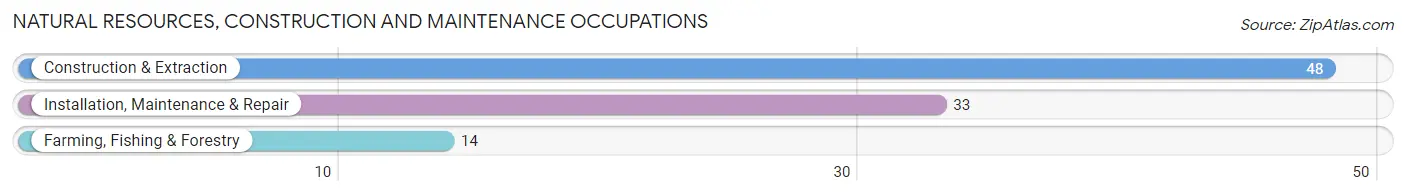
Natural Resources, Construction and Maintenance Occupations
The most common Natural Resources, Construction and Maintenance occupations in Sumas are Construction & Extraction (48 | 7.3%), Installation, Maintenance & Repair (33 | 5.0%), and Farming, Fishing & Forestry (14 | 2.1%).
Natural Resources, Construction and Maintenance Occupations by Sex
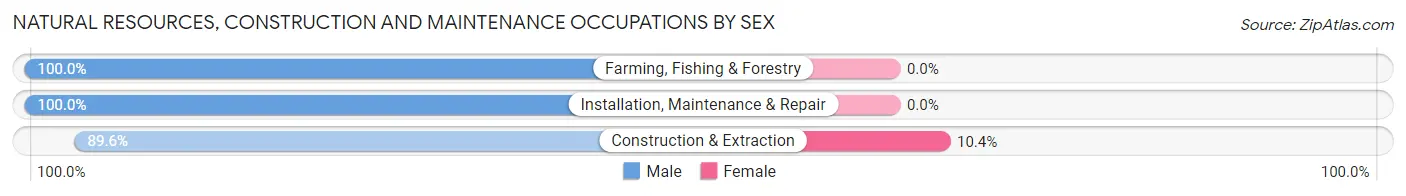
| Occupation | Male | Female |
| Farming, Fishing & Forestry | 14 (100.0%) | 0 (0.0%) |
| Construction & Extraction | 43 (89.6%) | 5 (10.4%) |
| Installation, Maintenance & Repair | 33 (100.0%) | 0 (0.0%) |
| Total (Category) | 90 (94.7%) | 5 (5.3%) |
| Total (Overall) | 405 (61.6%) | 253 (38.5%) |
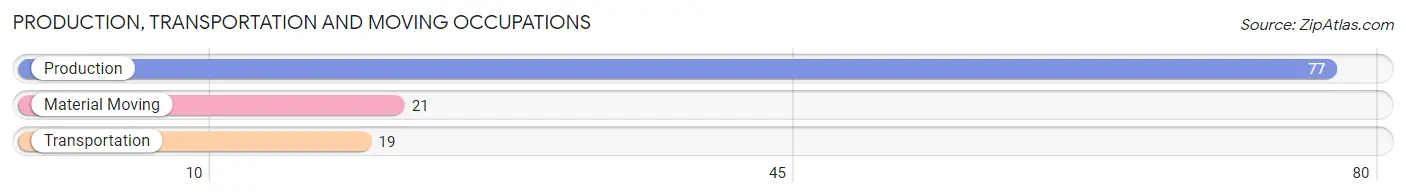
Production, Transportation and Moving Occupations
The most common Production, Transportation and Moving occupations in Sumas are Production (77 | 11.7%), Material Moving (21 | 3.2%), and Transportation (19 | 2.9%).
Production, Transportation and Moving Occupations by Sex
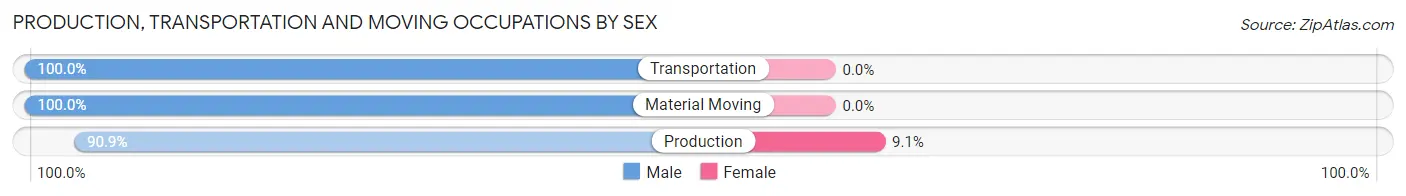
| Occupation | Male | Female |
| Production | 70 (90.9%) | 7 (9.1%) |
| Transportation | 19 (100.0%) | 0 (0.0%) |
| Material Moving | 21 (100.0%) | 0 (0.0%) |
| Total (Category) | 110 (94.0%) | 7 (6.0%) |
| Total (Overall) | 405 (61.6%) | 253 (38.5%) |
Employment Industries by Sex in Sumas
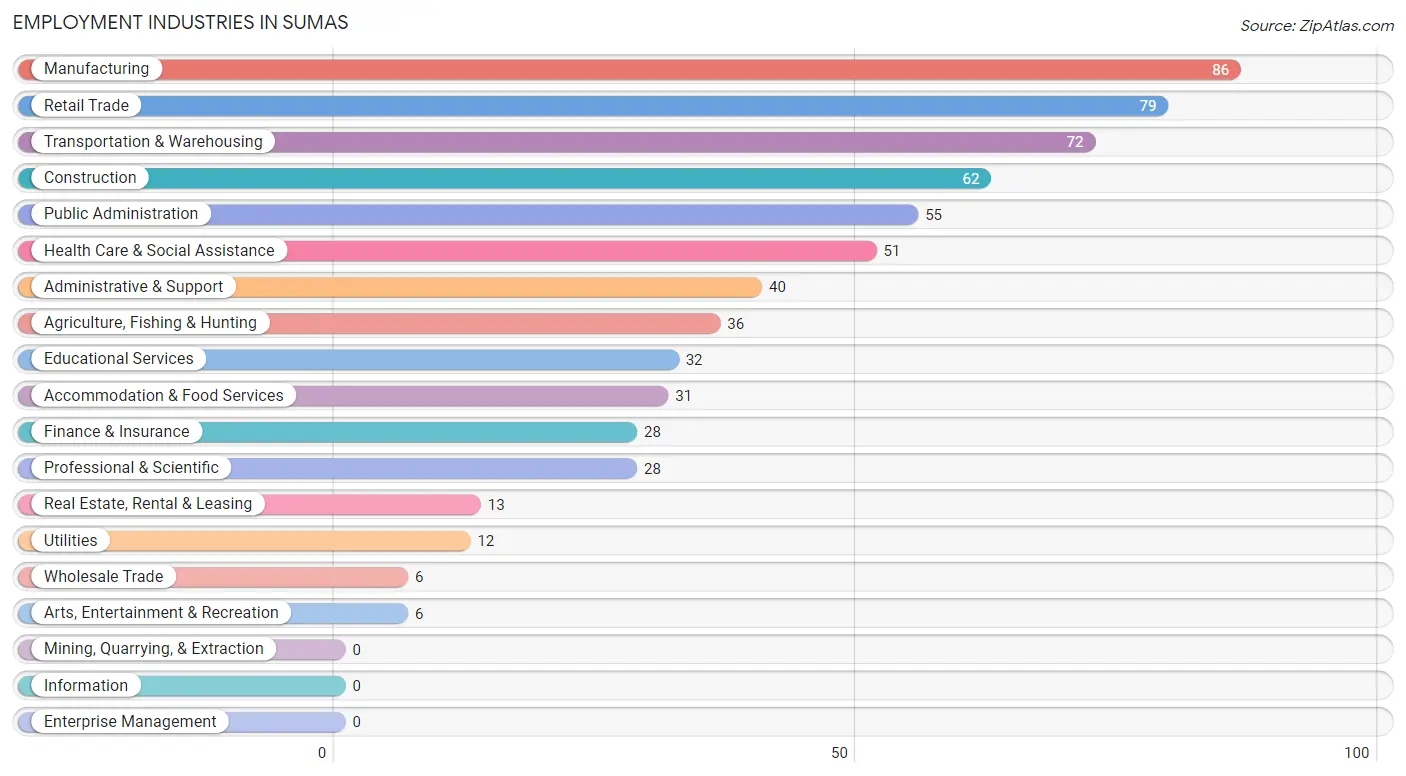
Employment Industries in Sumas
The major employment industries in Sumas include Manufacturing (86 | 13.1%), Retail Trade (79 | 12.0%), Transportation & Warehousing (72 | 10.9%), Construction (62 | 9.4%), and Public Administration (55 | 8.4%).
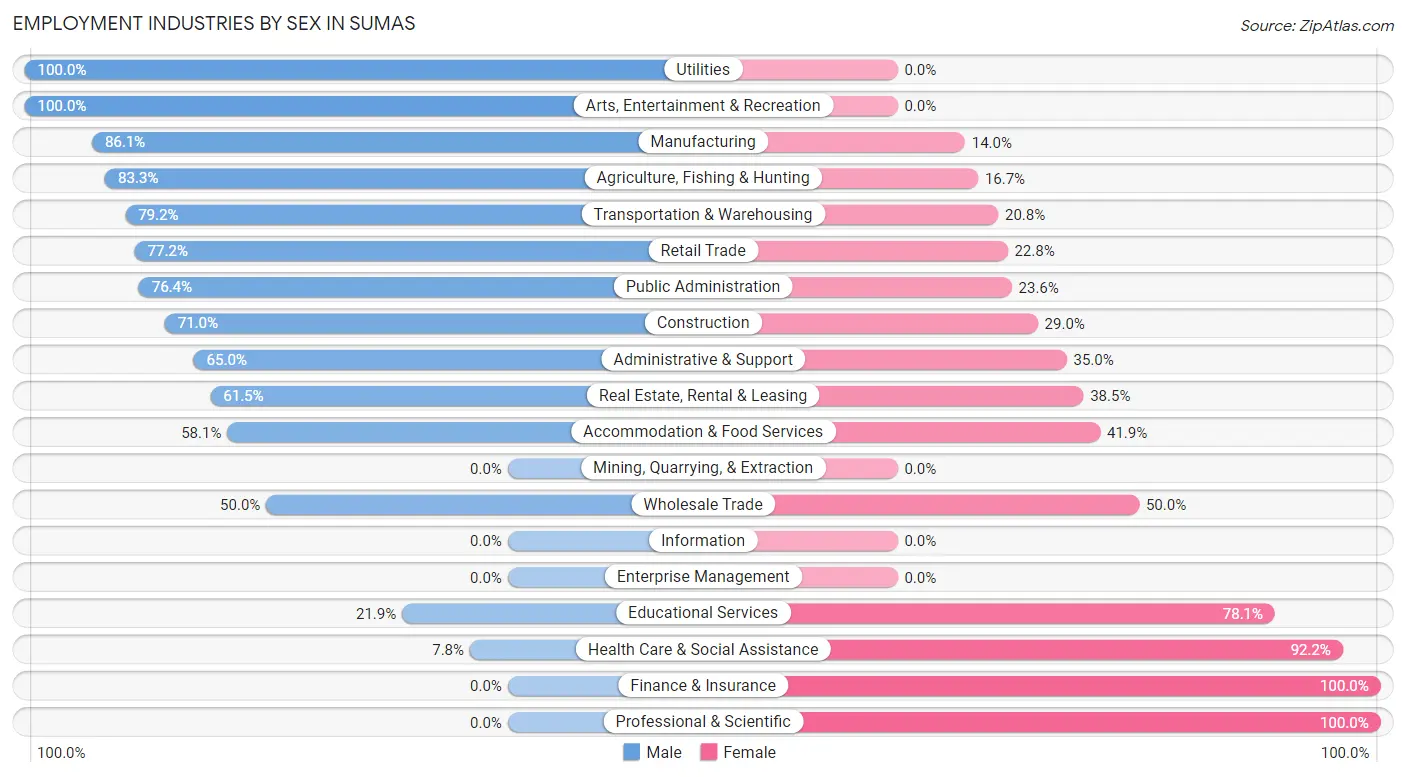
Employment Industries by Sex in Sumas
The Sumas industries that see more men than women are Utilities (100.0%), Arts, Entertainment & Recreation (100.0%), and Manufacturing (86.1%), whereas the industries that tend to have a higher number of women are Finance & Insurance (100.0%), Professional & Scientific (100.0%), and Health Care & Social Assistance (92.2%).
| Industry | Male | Female |
| Agriculture, Fishing & Hunting | 30 (83.3%) | 6 (16.7%) |
| Mining, Quarrying, & Extraction | 0 (0.0%) | 0 (0.0%) |
| Construction | 44 (71.0%) | 18 (29.0%) |
| Manufacturing | 74 (86.1%) | 12 (14.0%) |
| Wholesale Trade | 3 (50.0%) | 3 (50.0%) |
| Retail Trade | 61 (77.2%) | 18 (22.8%) |
| Transportation & Warehousing | 57 (79.2%) | 15 (20.8%) |
| Utilities | 12 (100.0%) | 0 (0.0%) |
| Information | 0 (0.0%) | 0 (0.0%) |
| Finance & Insurance | 0 (0.0%) | 28 (100.0%) |
| Real Estate, Rental & Leasing | 8 (61.5%) | 5 (38.5%) |
| Professional & Scientific | 0 (0.0%) | 28 (100.0%) |
| Enterprise Management | 0 (0.0%) | 0 (0.0%) |
| Administrative & Support | 26 (65.0%) | 14 (35.0%) |
| Educational Services | 7 (21.9%) | 25 (78.1%) |
| Health Care & Social Assistance | 4 (7.8%) | 47 (92.2%) |
| Arts, Entertainment & Recreation | 6 (100.0%) | 0 (0.0%) |
| Accommodation & Food Services | 18 (58.1%) | 13 (41.9%) |
| Public Administration | 42 (76.4%) | 13 (23.6%) |
| Total | 405 (61.6%) | 253 (38.5%) |
Education in Sumas
School Enrollment in Sumas
The most common levels of schooling among the 325 students in Sumas are middle school (92 | 28.3%), elementary school (82 | 25.2%), and high school (59 | 18.1%).

| School Level | # Students | % Students |
| Nursery / Preschool | 23 | 7.1% |
| Kindergarten | 3 | 0.9% |
| Elementary School | 82 | 25.2% |
| Middle School | 92 | 28.3% |
| High School | 59 | 18.1% |
| College / Undergraduate | 56 | 17.2% |
| Graduate / Professional | 10 | 3.1% |
| Total | 325 | 100.0% |
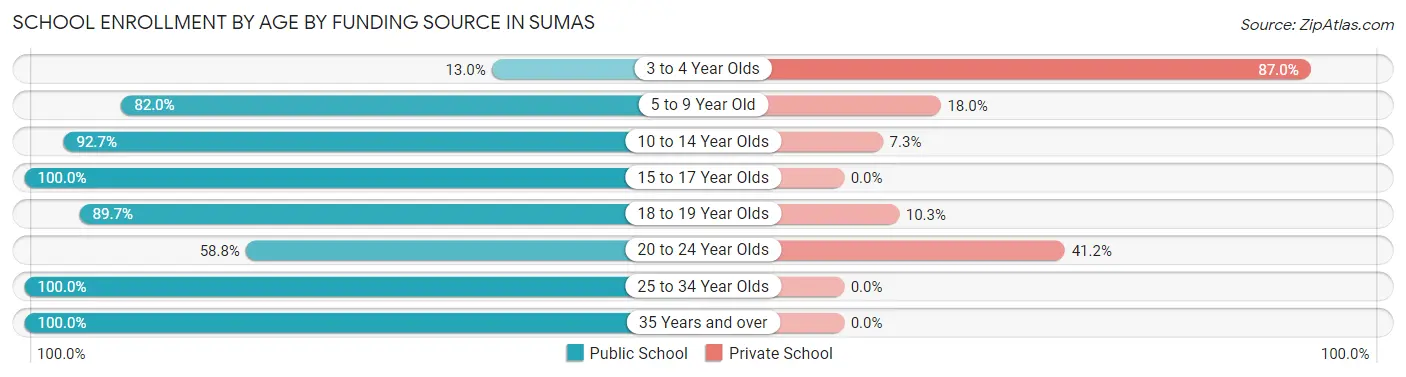
School Enrollment by Age by Funding Source in Sumas
Out of a total of 325 students who are enrolled in schools in Sumas, 51 (15.7%) attend a private institution, while the remaining 274 (84.3%) are enrolled in public schools. The age group of 3 to 4 year olds has the highest likelihood of being enrolled in private schools, with 20 (87.0% in the age bracket) enrolled. Conversely, the age group of 15 to 17 year olds has the lowest likelihood of being enrolled in a private school, with 47 (100.0% in the age bracket) attending a public institution.
| Age Bracket | Public School | Private School |
| 3 to 4 Year Olds | 3 (13.0%) | 20 (87.0%) |
| 5 to 9 Year Old | 50 (82.0%) | 11 (18.0%) |
| 10 to 14 Year Olds | 115 (92.7%) | 9 (7.3%) |
| 15 to 17 Year Olds | 47 (100.0%) | 0 (0.0%) |
| 18 to 19 Year Olds | 35 (89.7%) | 4 (10.3%) |
| 20 to 24 Year Olds | 10 (58.8%) | 7 (41.2%) |
| 25 to 34 Year Olds | 8 (100.0%) | 0 (0.0%) |
| 35 Years and over | 6 (100.0%) | 0 (0.0%) |
| Total | 274 (84.3%) | 51 (15.7%) |
Educational Attainment by Field of Study in Sumas
Social sciences (34 | 27.9%), bio, nature & agricultural (14 | 11.5%), liberal arts & history (14 | 11.5%), literature & languages (12 | 9.8%), and engineering (10 | 8.2%) are the most common fields of study among 122 individuals in Sumas who have obtained a bachelor's degree or higher.
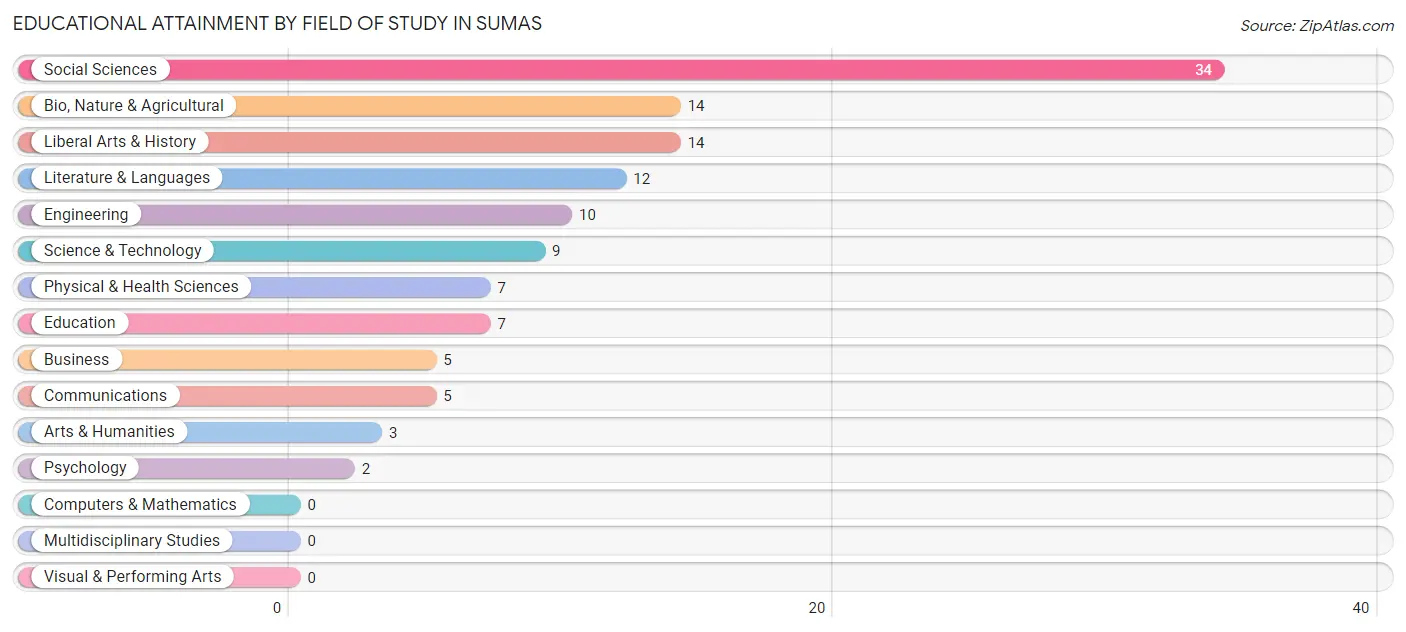
| Field of Study | # Graduates | % Graduates |
| Computers & Mathematics | 0 | 0.0% |
| Bio, Nature & Agricultural | 14 | 11.5% |
| Physical & Health Sciences | 7 | 5.7% |
| Psychology | 2 | 1.6% |
| Social Sciences | 34 | 27.9% |
| Engineering | 10 | 8.2% |
| Multidisciplinary Studies | 0 | 0.0% |
| Science & Technology | 9 | 7.4% |
| Business | 5 | 4.1% |
| Education | 7 | 5.7% |
| Literature & Languages | 12 | 9.8% |
| Liberal Arts & History | 14 | 11.5% |
| Visual & Performing Arts | 0 | 0.0% |
| Communications | 5 | 4.1% |
| Arts & Humanities | 3 | 2.5% |
| Total | 122 | 100.0% |
Transportation & Commute in Sumas
Vehicle Availability by Sex in Sumas
The most prevalent vehicle ownership categories in Sumas are males with 2 vehicles (141, accounting for 34.8%) and females with 2 vehicles (87, making up 57.3%).
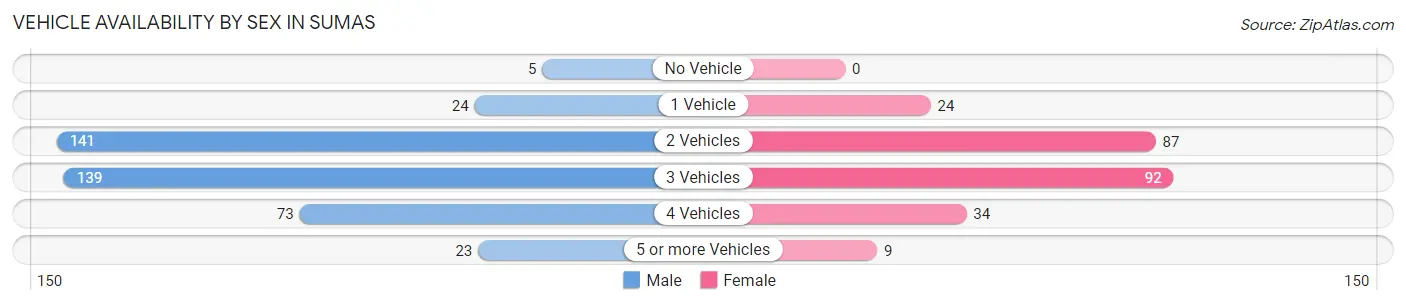
| Vehicles Available | Male | Female |
| No Vehicle | 5 (1.2%) | 0 (0.0%) |
| 1 Vehicle | 24 (5.9%) | 24 (9.8%) |
| 2 Vehicles | 141 (34.8%) | 87 (35.4%) |
| 3 Vehicles | 139 (34.3%) | 92 (37.4%) |
| 4 Vehicles | 73 (18.0%) | 34 (13.8%) |
| 5 or more Vehicles | 23 (5.7%) | 9 (3.7%) |
| Total | 405 (100.0%) | 246 (100.0%) |
Commute Time in Sumas
The most frequently occuring commute durations in Sumas are 15 to 19 minutes (82 commuters, 13.6%), 45 to 59 minutes (79 commuters, 13.1%), and less than 5 minutes (78 commuters, 13.0%).
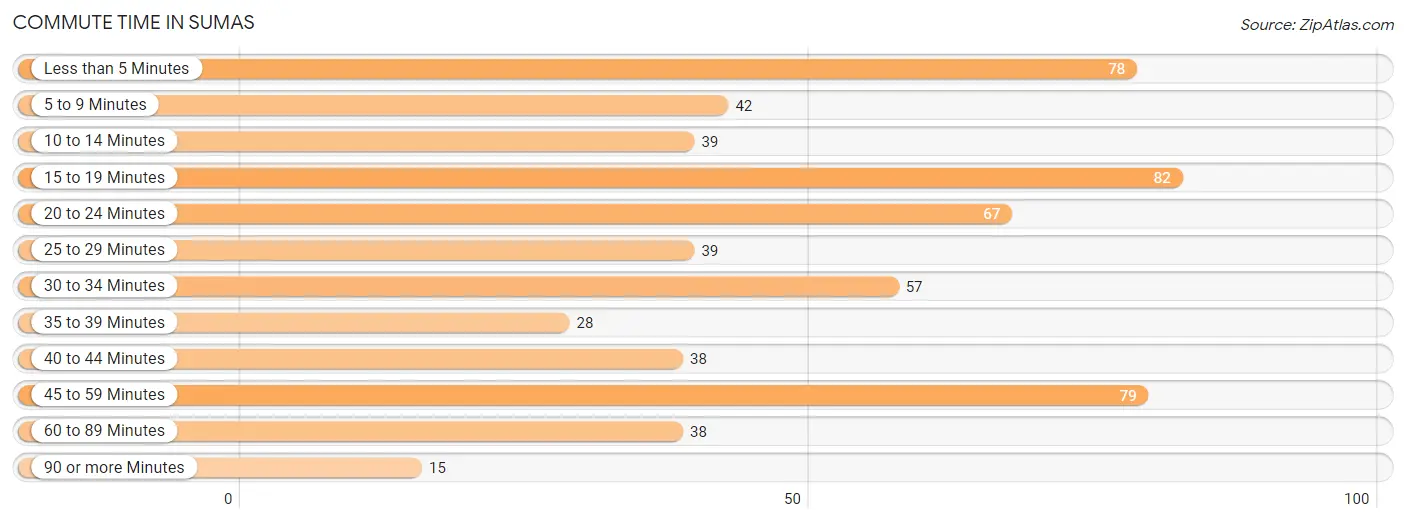
| Commute Time | # Commuters | % Commuters |
| Less than 5 Minutes | 78 | 13.0% |
| 5 to 9 Minutes | 42 | 7.0% |
| 10 to 14 Minutes | 39 | 6.5% |
| 15 to 19 Minutes | 82 | 13.6% |
| 20 to 24 Minutes | 67 | 11.1% |
| 25 to 29 Minutes | 39 | 6.5% |
| 30 to 34 Minutes | 57 | 9.5% |
| 35 to 39 Minutes | 28 | 4.6% |
| 40 to 44 Minutes | 38 | 6.3% |
| 45 to 59 Minutes | 79 | 13.1% |
| 60 to 89 Minutes | 38 | 6.3% |
| 90 or more Minutes | 15 | 2.5% |
Commute Time by Sex in Sumas
The most common commute times in Sumas are less than 5 minutes (50 commuters, 13.1%) for males and 15 to 19 minutes (58 commuters, 26.4%) for females.
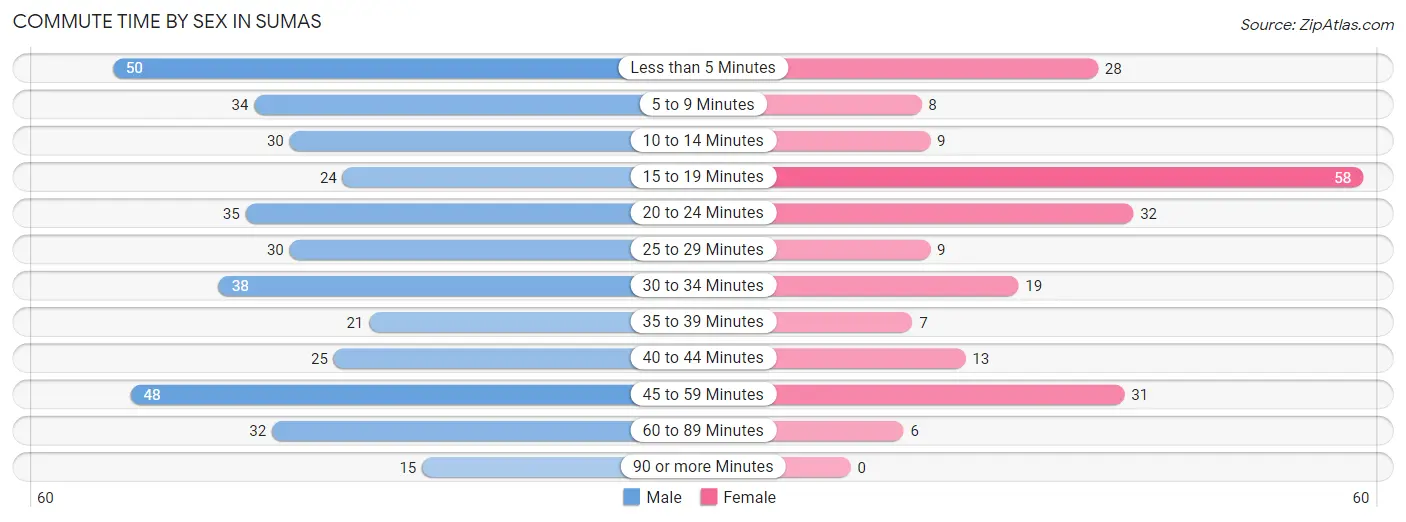
| Commute Time | Male | Female |
| Less than 5 Minutes | 50 (13.1%) | 28 (12.7%) |
| 5 to 9 Minutes | 34 (8.9%) | 8 (3.6%) |
| 10 to 14 Minutes | 30 (7.9%) | 9 (4.1%) |
| 15 to 19 Minutes | 24 (6.3%) | 58 (26.4%) |
| 20 to 24 Minutes | 35 (9.2%) | 32 (14.5%) |
| 25 to 29 Minutes | 30 (7.9%) | 9 (4.1%) |
| 30 to 34 Minutes | 38 (10.0%) | 19 (8.6%) |
| 35 to 39 Minutes | 21 (5.5%) | 7 (3.2%) |
| 40 to 44 Minutes | 25 (6.5%) | 13 (5.9%) |
| 45 to 59 Minutes | 48 (12.6%) | 31 (14.1%) |
| 60 to 89 Minutes | 32 (8.4%) | 6 (2.7%) |
| 90 or more Minutes | 15 (3.9%) | 0 (0.0%) |
Time of Departure to Work by Sex in Sumas
The most frequent times of departure to work in Sumas are 7:00 AM to 7:29 AM (84, 22.0%) for males and 5:00 AM to 5:29 AM (47, 21.4%) for females.
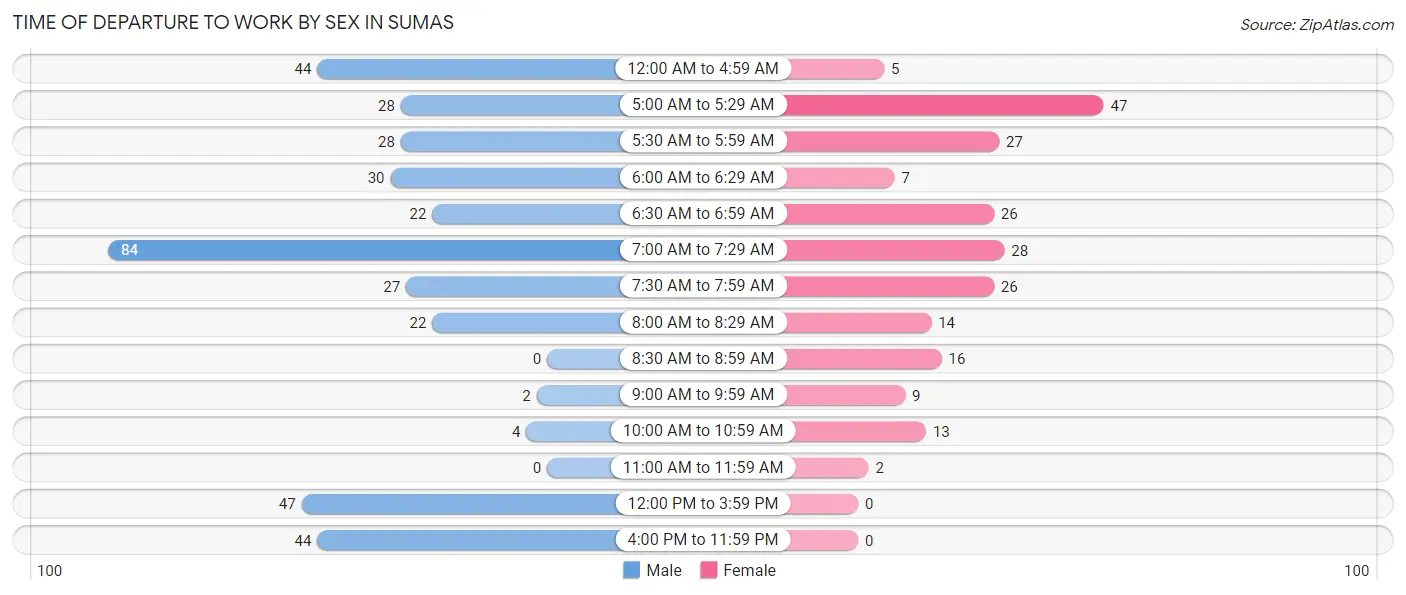
| Time of Departure | Male | Female |
| 12:00 AM to 4:59 AM | 44 (11.5%) | 5 (2.3%) |
| 5:00 AM to 5:29 AM | 28 (7.3%) | 47 (21.4%) |
| 5:30 AM to 5:59 AM | 28 (7.3%) | 27 (12.3%) |
| 6:00 AM to 6:29 AM | 30 (7.9%) | 7 (3.2%) |
| 6:30 AM to 6:59 AM | 22 (5.8%) | 26 (11.8%) |
| 7:00 AM to 7:29 AM | 84 (22.0%) | 28 (12.7%) |
| 7:30 AM to 7:59 AM | 27 (7.1%) | 26 (11.8%) |
| 8:00 AM to 8:29 AM | 22 (5.8%) | 14 (6.4%) |
| 8:30 AM to 8:59 AM | 0 (0.0%) | 16 (7.3%) |
| 9:00 AM to 9:59 AM | 2 (0.5%) | 9 (4.1%) |
| 10:00 AM to 10:59 AM | 4 (1.1%) | 13 (5.9%) |
| 11:00 AM to 11:59 AM | 0 (0.0%) | 2 (0.9%) |
| 12:00 PM to 3:59 PM | 47 (12.3%) | 0 (0.0%) |
| 4:00 PM to 11:59 PM | 44 (11.5%) | 0 (0.0%) |
| Total | 382 (100.0%) | 220 (100.0%) |
Housing Occupancy in Sumas
Occupancy by Ownership in Sumas
Of the total 533 dwellings in Sumas, owner-occupied units account for 377 (70.7%), while renter-occupied units make up 156 (29.3%).
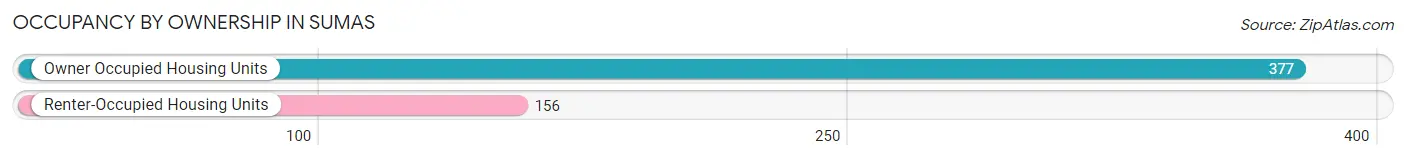
| Occupancy | # Housing Units | % Housing Units |
| Owner Occupied Housing Units | 377 | 70.7% |
| Renter-Occupied Housing Units | 156 | 29.3% |
| Total Occupied Housing Units | 533 | 100.0% |
Occupancy by Household Size in Sumas
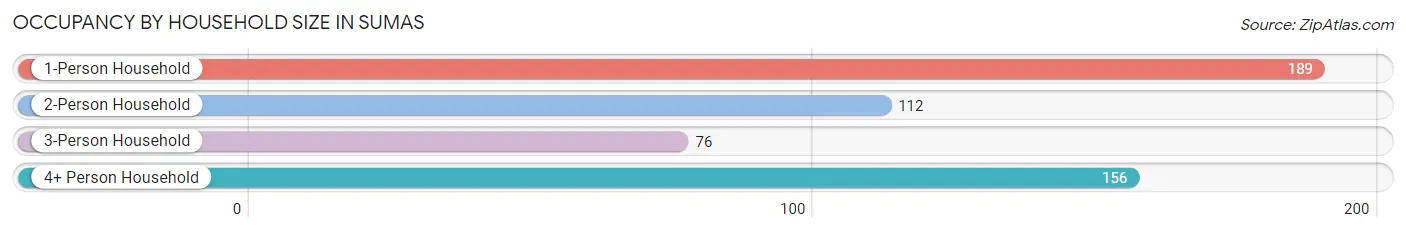
| Household Size | # Housing Units | % Housing Units |
| 1-Person Household | 189 | 35.5% |
| 2-Person Household | 112 | 21.0% |
| 3-Person Household | 76 | 14.3% |
| 4+ Person Household | 156 | 29.3% |
| Total Housing Units | 533 | 100.0% |
Occupancy by Ownership by Household Size in Sumas
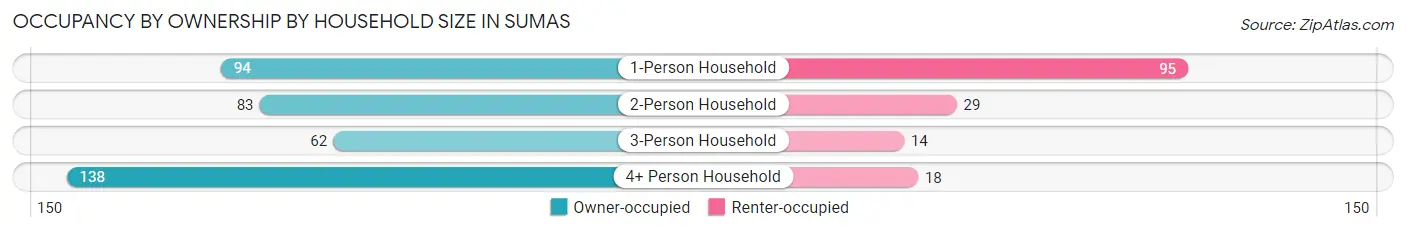
| Household Size | Owner-occupied | Renter-occupied |
| 1-Person Household | 94 (49.7%) | 95 (50.3%) |
| 2-Person Household | 83 (74.1%) | 29 (25.9%) |
| 3-Person Household | 62 (81.6%) | 14 (18.4%) |
| 4+ Person Household | 138 (88.5%) | 18 (11.5%) |
| Total Housing Units | 377 (70.7%) | 156 (29.3%) |
Occupancy by Educational Attainment in Sumas
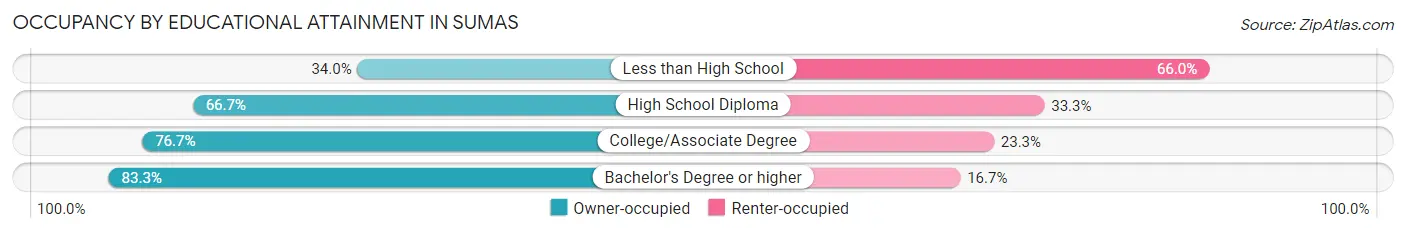
| Household Size | Owner-occupied | Renter-occupied |
| Less than High School | 17 (34.0%) | 33 (66.0%) |
| High School Diploma | 106 (66.7%) | 53 (33.3%) |
| College/Associate Degree | 184 (76.7%) | 56 (23.3%) |
| Bachelor's Degree or higher | 70 (83.3%) | 14 (16.7%) |
Occupancy by Age of Householder in Sumas
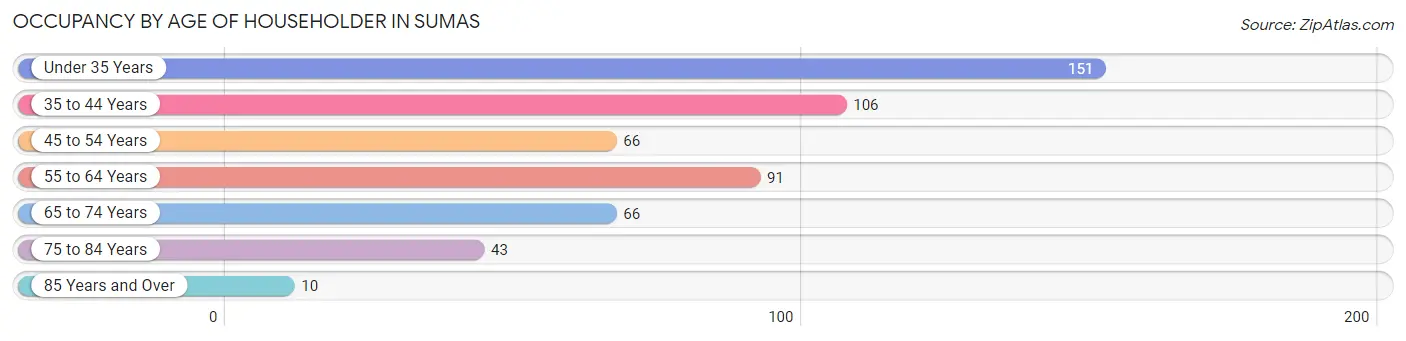
| Age Bracket | # Households | % Households |
| Under 35 Years | 151 | 28.3% |
| 35 to 44 Years | 106 | 19.9% |
| 45 to 54 Years | 66 | 12.4% |
| 55 to 64 Years | 91 | 17.1% |
| 65 to 74 Years | 66 | 12.4% |
| 75 to 84 Years | 43 | 8.1% |
| 85 Years and Over | 10 | 1.9% |
| Total | 533 | 100.0% |
Housing Finances in Sumas
Median Income by Occupancy in Sumas
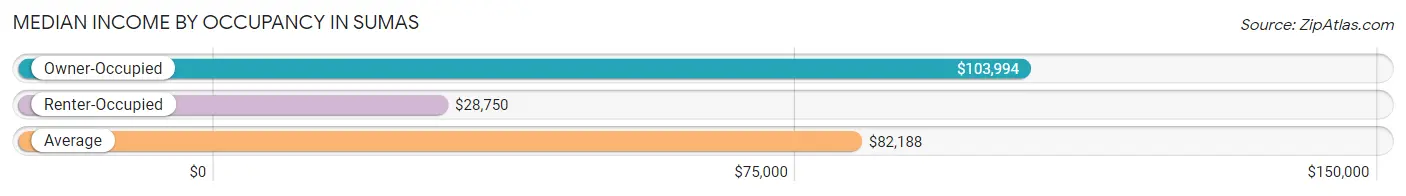
| Occupancy Type | # Households | Median Income |
| Owner-Occupied | 377 (70.7%) | $103,994 |
| Renter-Occupied | 156 (29.3%) | $28,750 |
| Average | 533 (100.0%) | $82,188 |
Occupancy by Householder Income Bracket in Sumas
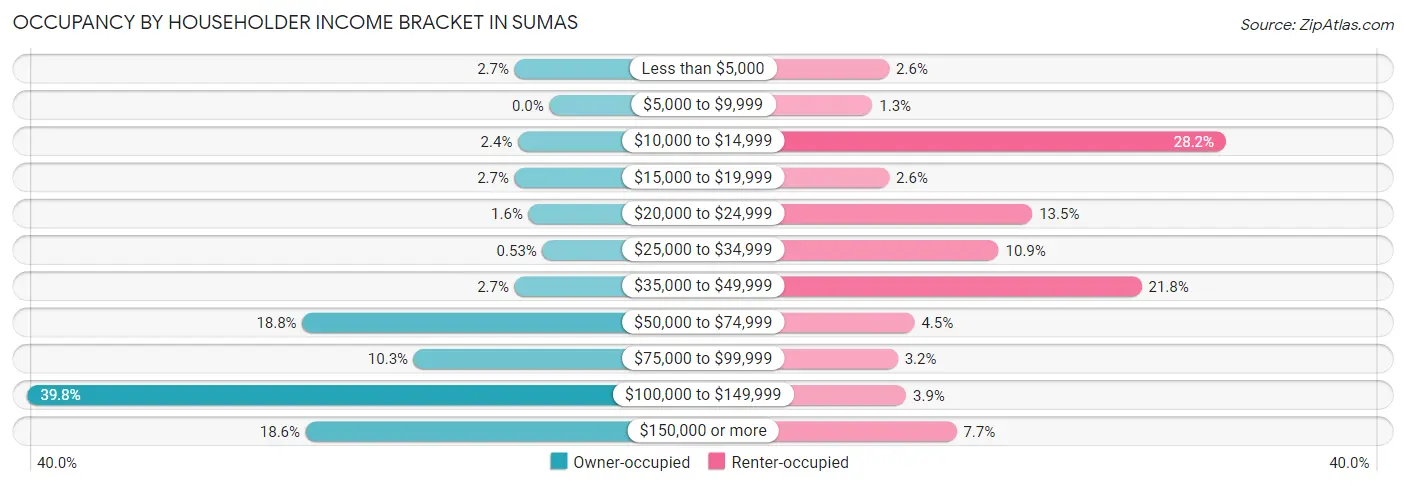
| Income Bracket | Owner-occupied | Renter-occupied |
| Less than $5,000 | 10 (2.6%) | 4 (2.6%) |
| $5,000 to $9,999 | 0 (0.0%) | 2 (1.3%) |
| $10,000 to $14,999 | 9 (2.4%) | 44 (28.2%) |
| $15,000 to $19,999 | 10 (2.6%) | 4 (2.6%) |
| $20,000 to $24,999 | 6 (1.6%) | 21 (13.5%) |
| $25,000 to $34,999 | 2 (0.5%) | 17 (10.9%) |
| $35,000 to $49,999 | 10 (2.6%) | 34 (21.8%) |
| $50,000 to $74,999 | 71 (18.8%) | 7 (4.5%) |
| $75,000 to $99,999 | 39 (10.3%) | 5 (3.2%) |
| $100,000 to $149,999 | 150 (39.8%) | 6 (3.8%) |
| $150,000 or more | 70 (18.6%) | 12 (7.7%) |
| Total | 377 (100.0%) | 156 (100.0%) |
Monthly Housing Cost Tiers in Sumas
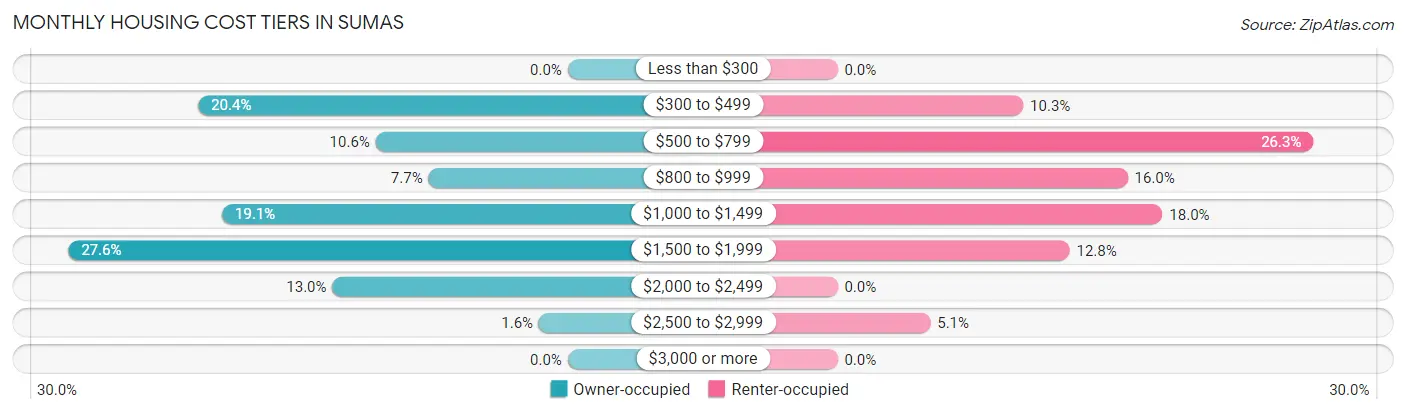
| Monthly Cost | Owner-occupied | Renter-occupied |
| Less than $300 | 0 (0.0%) | 0 (0.0%) |
| $300 to $499 | 77 (20.4%) | 16 (10.3%) |
| $500 to $799 | 40 (10.6%) | 41 (26.3%) |
| $800 to $999 | 29 (7.7%) | 25 (16.0%) |
| $1,000 to $1,499 | 72 (19.1%) | 28 (17.9%) |
| $1,500 to $1,999 | 104 (27.6%) | 20 (12.8%) |
| $2,000 to $2,499 | 49 (13.0%) | 0 (0.0%) |
| $2,500 to $2,999 | 6 (1.6%) | 8 (5.1%) |
| $3,000 or more | 0 (0.0%) | 0 (0.0%) |
| Total | 377 (100.0%) | 156 (100.0%) |
Physical Housing Characteristics in Sumas
Housing Structures in Sumas
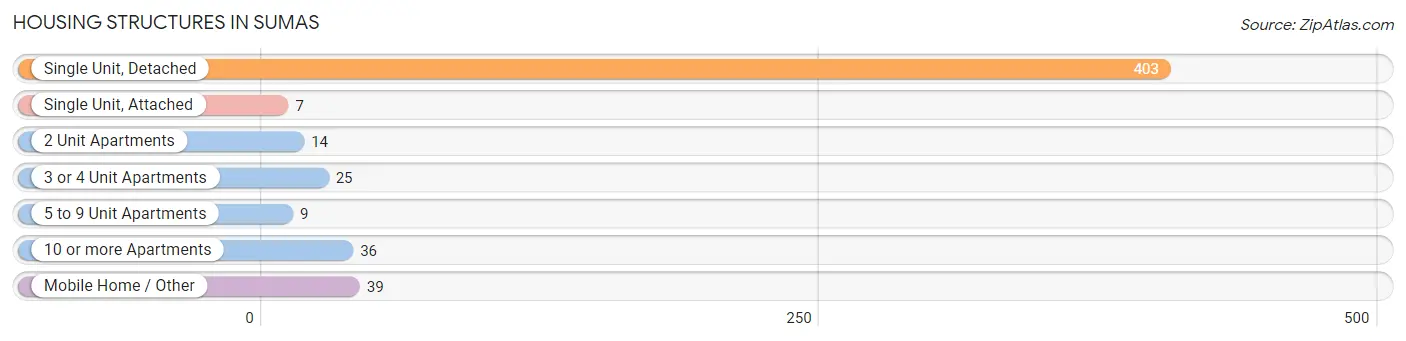
| Structure Type | # Housing Units | % Housing Units |
| Single Unit, Detached | 403 | 75.6% |
| Single Unit, Attached | 7 | 1.3% |
| 2 Unit Apartments | 14 | 2.6% |
| 3 or 4 Unit Apartments | 25 | 4.7% |
| 5 to 9 Unit Apartments | 9 | 1.7% |
| 10 or more Apartments | 36 | 6.8% |
| Mobile Home / Other | 39 | 7.3% |
| Total | 533 | 100.0% |
Housing Structures by Occupancy in Sumas
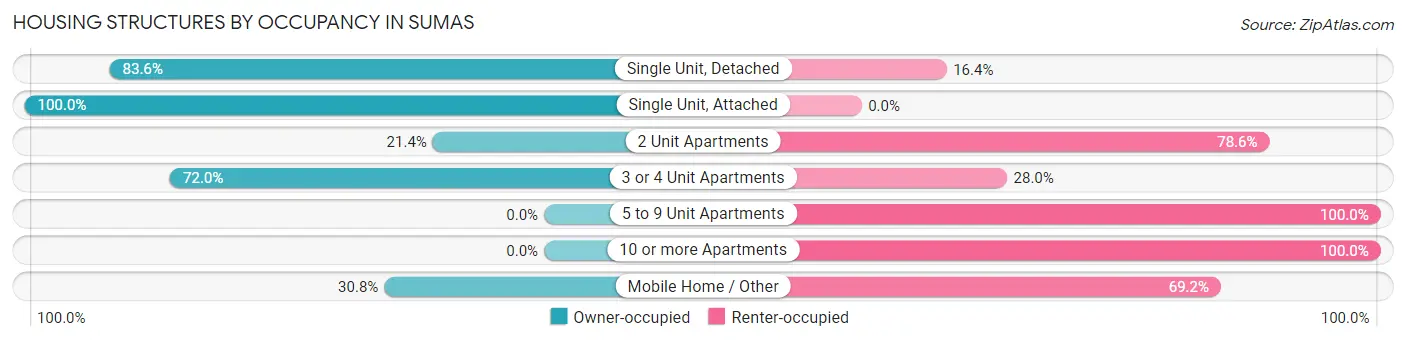
| Structure Type | Owner-occupied | Renter-occupied |
| Single Unit, Detached | 337 (83.6%) | 66 (16.4%) |
| Single Unit, Attached | 7 (100.0%) | 0 (0.0%) |
| 2 Unit Apartments | 3 (21.4%) | 11 (78.6%) |
| 3 or 4 Unit Apartments | 18 (72.0%) | 7 (28.0%) |
| 5 to 9 Unit Apartments | 0 (0.0%) | 9 (100.0%) |
| 10 or more Apartments | 0 (0.0%) | 36 (100.0%) |
| Mobile Home / Other | 12 (30.8%) | 27 (69.2%) |
| Total | 377 (70.7%) | 156 (29.3%) |
Housing Structures by Number of Rooms in Sumas
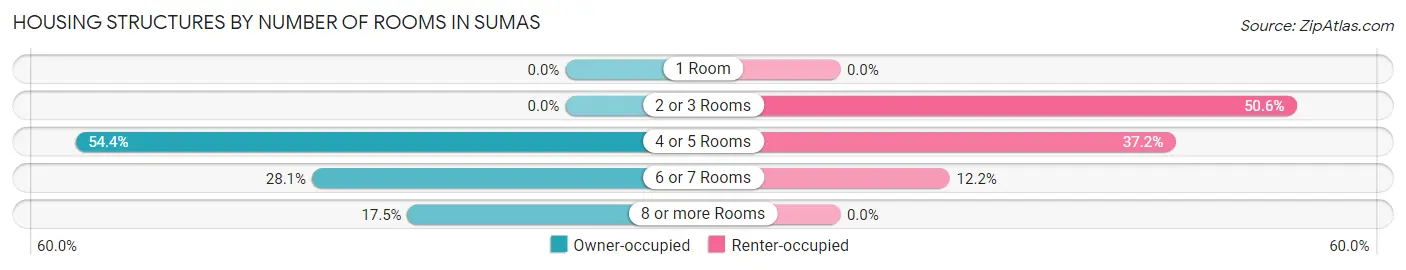
| Number of Rooms | Owner-occupied | Renter-occupied |
| 1 Room | 0 (0.0%) | 0 (0.0%) |
| 2 or 3 Rooms | 0 (0.0%) | 79 (50.6%) |
| 4 or 5 Rooms | 205 (54.4%) | 58 (37.2%) |
| 6 or 7 Rooms | 106 (28.1%) | 19 (12.2%) |
| 8 or more Rooms | 66 (17.5%) | 0 (0.0%) |
| Total | 377 (100.0%) | 156 (100.0%) |
Housing Structure by Heating Type in Sumas
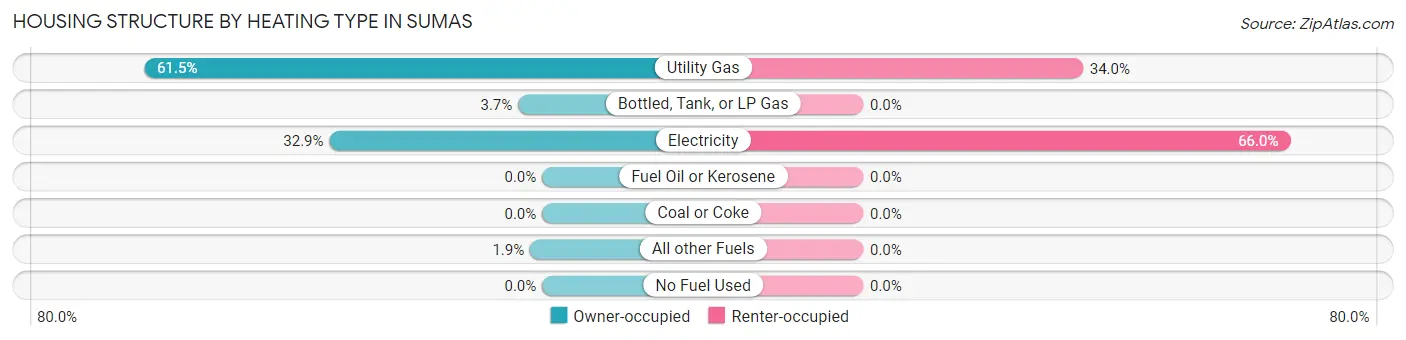
| Heating Type | Owner-occupied | Renter-occupied |
| Utility Gas | 232 (61.5%) | 53 (34.0%) |
| Bottled, Tank, or LP Gas | 14 (3.7%) | 0 (0.0%) |
| Electricity | 124 (32.9%) | 103 (66.0%) |
| Fuel Oil or Kerosene | 0 (0.0%) | 0 (0.0%) |
| Coal or Coke | 0 (0.0%) | 0 (0.0%) |
| All other Fuels | 7 (1.9%) | 0 (0.0%) |
| No Fuel Used | 0 (0.0%) | 0 (0.0%) |
| Total | 377 (100.0%) | 156 (100.0%) |
Household Vehicle Usage in Sumas
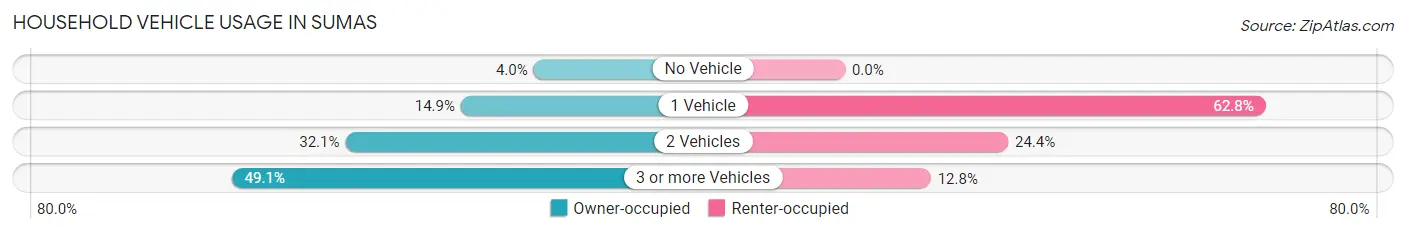
| Vehicles per Household | Owner-occupied | Renter-occupied |
| No Vehicle | 15 (4.0%) | 0 (0.0%) |
| 1 Vehicle | 56 (14.8%) | 98 (62.8%) |
| 2 Vehicles | 121 (32.1%) | 38 (24.4%) |
| 3 or more Vehicles | 185 (49.1%) | 20 (12.8%) |
| Total | 377 (100.0%) | 156 (100.0%) |
Real Estate & Mortgages in Sumas
Real Estate and Mortgage Overview in Sumas
| Characteristic | Without Mortgage | With Mortgage |
| Housing Units | 124 | 253 |
| Median Property Value | $304,000 | $306,300 |
| Median Household Income | $103,804 | $40 |
| Monthly Housing Costs | $473 | $0 |
| Real Estate Taxes | $2,417 | $29 |
Property Value by Mortgage Status in Sumas
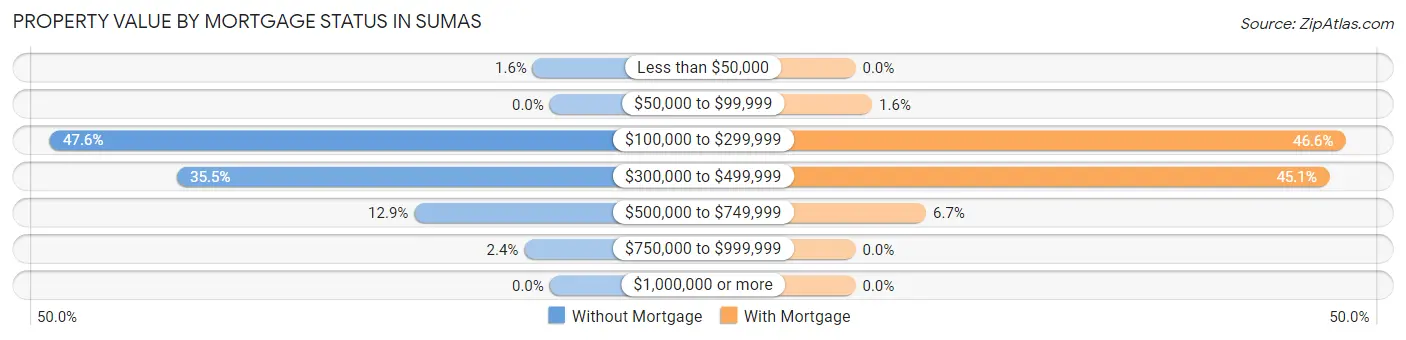
| Property Value | Without Mortgage | With Mortgage |
| Less than $50,000 | 2 (1.6%) | 0 (0.0%) |
| $50,000 to $99,999 | 0 (0.0%) | 4 (1.6%) |
| $100,000 to $299,999 | 59 (47.6%) | 118 (46.6%) |
| $300,000 to $499,999 | 44 (35.5%) | 114 (45.1%) |
| $500,000 to $749,999 | 16 (12.9%) | 17 (6.7%) |
| $750,000 to $999,999 | 3 (2.4%) | 0 (0.0%) |
| $1,000,000 or more | 0 (0.0%) | 0 (0.0%) |
| Total | 124 (100.0%) | 253 (100.0%) |
Household Income by Mortgage Status in Sumas
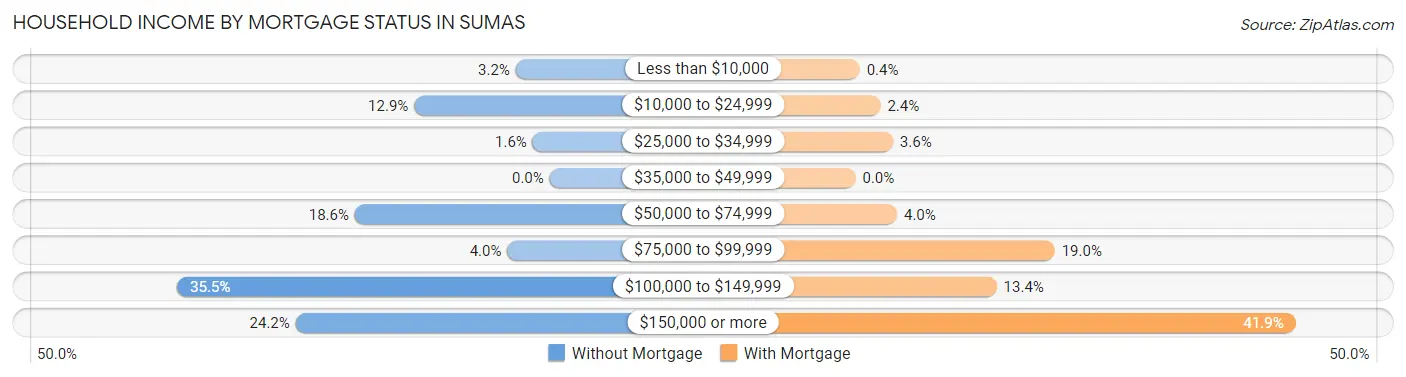
| Household Income | Without Mortgage | With Mortgage |
| Less than $10,000 | 4 (3.2%) | 1 (0.4%) |
| $10,000 to $24,999 | 16 (12.9%) | 6 (2.4%) |
| $25,000 to $34,999 | 2 (1.6%) | 9 (3.6%) |
| $35,000 to $49,999 | 0 (0.0%) | 0 (0.0%) |
| $50,000 to $74,999 | 23 (18.5%) | 10 (4.0%) |
| $75,000 to $99,999 | 5 (4.0%) | 48 (19.0%) |
| $100,000 to $149,999 | 44 (35.5%) | 34 (13.4%) |
| $150,000 or more | 30 (24.2%) | 106 (41.9%) |
| Total | 124 (100.0%) | 253 (100.0%) |
Property Value to Household Income Ratio in Sumas
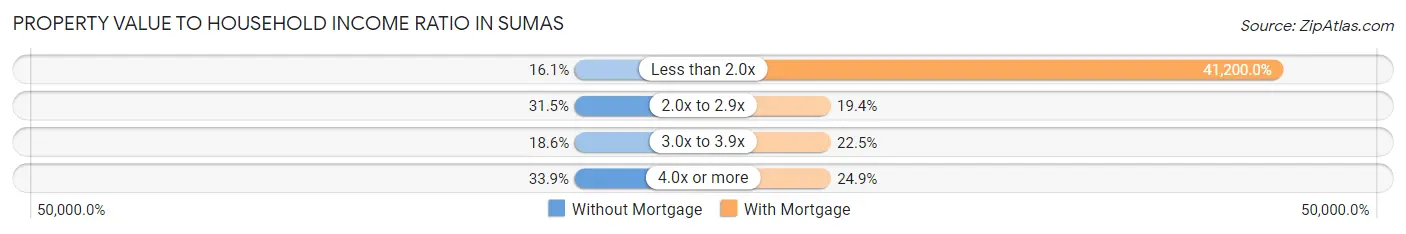
| Value-to-Income Ratio | Without Mortgage | With Mortgage |
| Less than 2.0x | 20 (16.1%) | 104,236 (41,200.0%) |
| 2.0x to 2.9x | 39 (31.5%) | 49 (19.4%) |
| 3.0x to 3.9x | 23 (18.5%) | 57 (22.5%) |
| 4.0x or more | 42 (33.9%) | 63 (24.9%) |
| Total | 124 (100.0%) | 253 (100.0%) |
Real Estate Taxes by Mortgage Status in Sumas
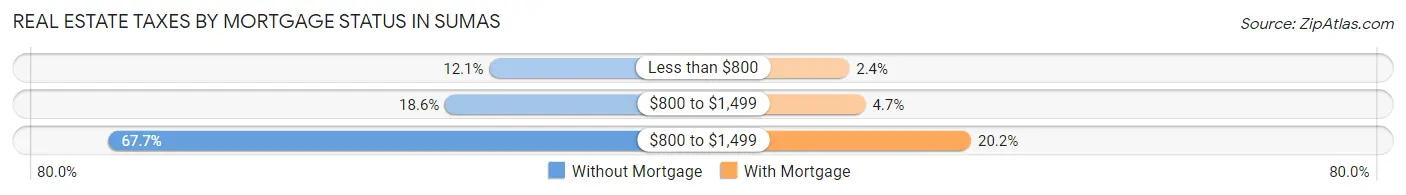
| Property Taxes | Without Mortgage | With Mortgage |
| Less than $800 | 15 (12.1%) | 6 (2.4%) |
| $800 to $1,499 | 23 (18.5%) | 12 (4.7%) |
| $800 to $1,499 | 84 (67.7%) | 51 (20.2%) |
| Total | 124 (100.0%) | 253 (100.0%) |
Health & Disability in Sumas
Health Insurance Coverage by Age in Sumas
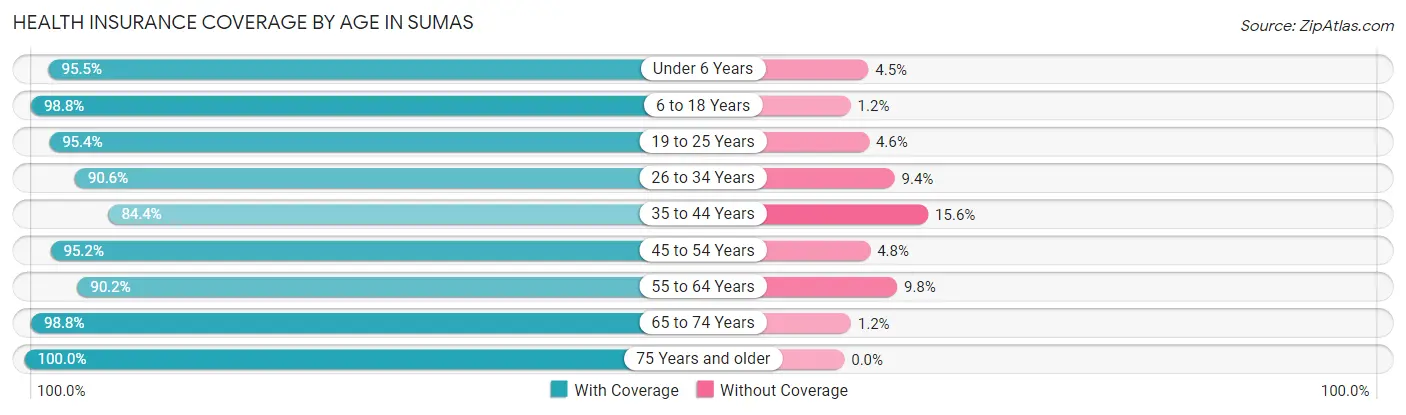
| Age Bracket | With Coverage | Without Coverage |
| Under 6 Years | 128 (95.5%) | 6 (4.5%) |
| 6 to 18 Years | 249 (98.8%) | 3 (1.2%) |
| 19 to 25 Years | 166 (95.4%) | 8 (4.6%) |
| 26 to 34 Years | 174 (90.6%) | 18 (9.4%) |
| 35 to 44 Years | 151 (84.4%) | 28 (15.6%) |
| 45 to 54 Years | 138 (95.2%) | 7 (4.8%) |
| 55 to 64 Years | 165 (90.2%) | 18 (9.8%) |
| 65 to 74 Years | 81 (98.8%) | 1 (1.2%) |
| 75 Years and older | 56 (100.0%) | 0 (0.0%) |
| Total | 1,308 (93.6%) | 89 (6.4%) |
Health Insurance Coverage by Citizenship Status in Sumas
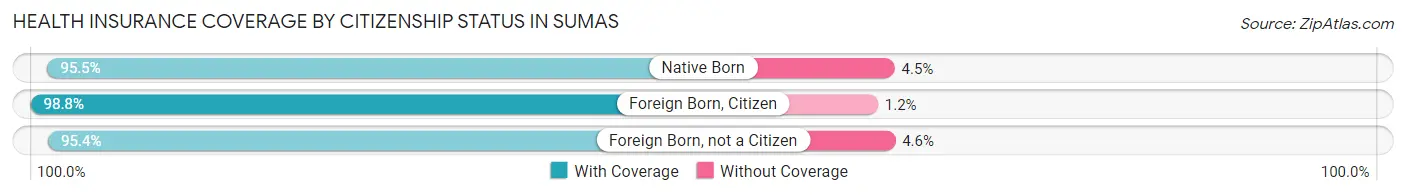
| Citizenship Status | With Coverage | Without Coverage |
| Native Born | 128 (95.5%) | 6 (4.5%) |
| Foreign Born, Citizen | 249 (98.8%) | 3 (1.2%) |
| Foreign Born, not a Citizen | 166 (95.4%) | 8 (4.6%) |
Health Insurance Coverage by Household Income in Sumas
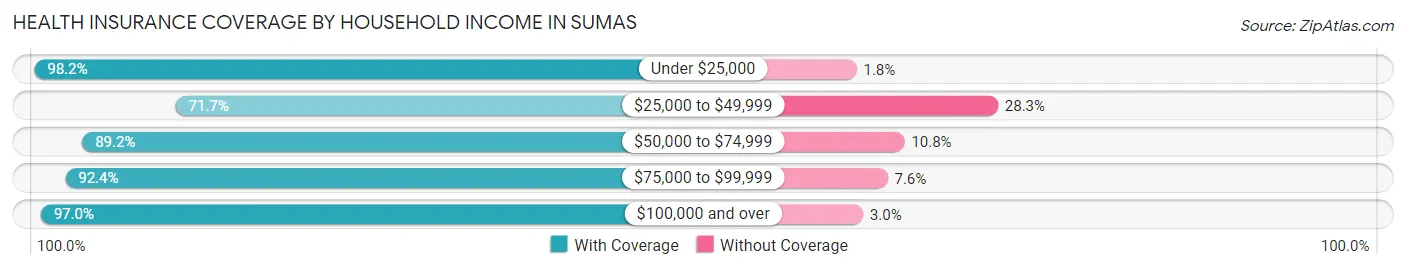
| Household Income | With Coverage | Without Coverage |
| Under $25,000 | 162 (98.2%) | 3 (1.8%) |
| $25,000 to $49,999 | 76 (71.7%) | 30 (28.3%) |
| $50,000 to $74,999 | 190 (89.2%) | 23 (10.8%) |
| $75,000 to $99,999 | 109 (92.4%) | 9 (7.6%) |
| $100,000 and over | 771 (97.0%) | 24 (3.0%) |
Public vs Private Health Insurance Coverage by Age in Sumas
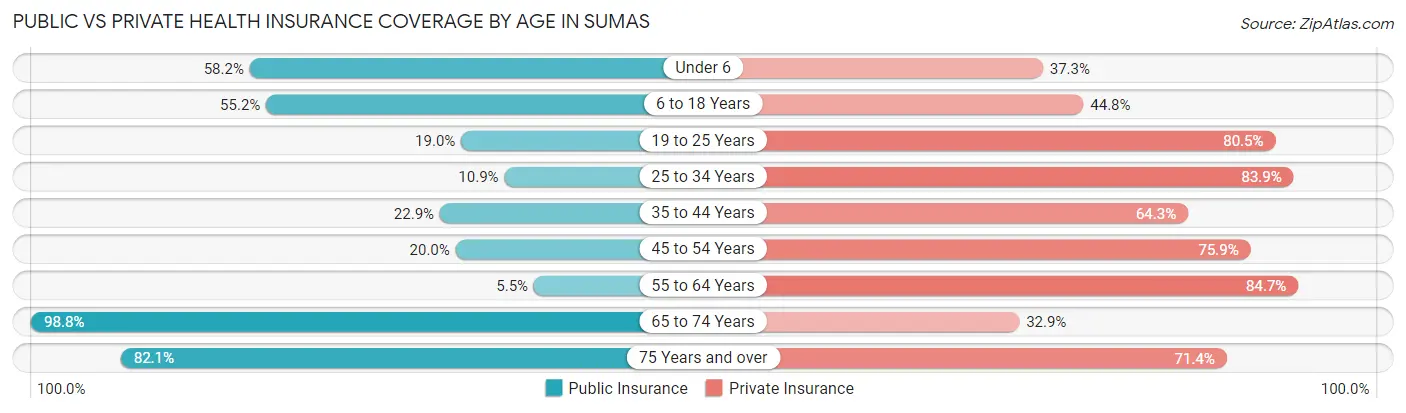
| Age Bracket | Public Insurance | Private Insurance |
| Under 6 | 78 (58.2%) | 50 (37.3%) |
| 6 to 18 Years | 139 (55.2%) | 113 (44.8%) |
| 19 to 25 Years | 33 (19.0%) | 140 (80.5%) |
| 25 to 34 Years | 21 (10.9%) | 161 (83.9%) |
| 35 to 44 Years | 41 (22.9%) | 115 (64.2%) |
| 45 to 54 Years | 29 (20.0%) | 110 (75.9%) |
| 55 to 64 Years | 10 (5.5%) | 155 (84.7%) |
| 65 to 74 Years | 81 (98.8%) | 27 (32.9%) |
| 75 Years and over | 46 (82.1%) | 40 (71.4%) |
| Total | 478 (34.2%) | 911 (65.2%) |
Disability Status by Sex by Age in Sumas
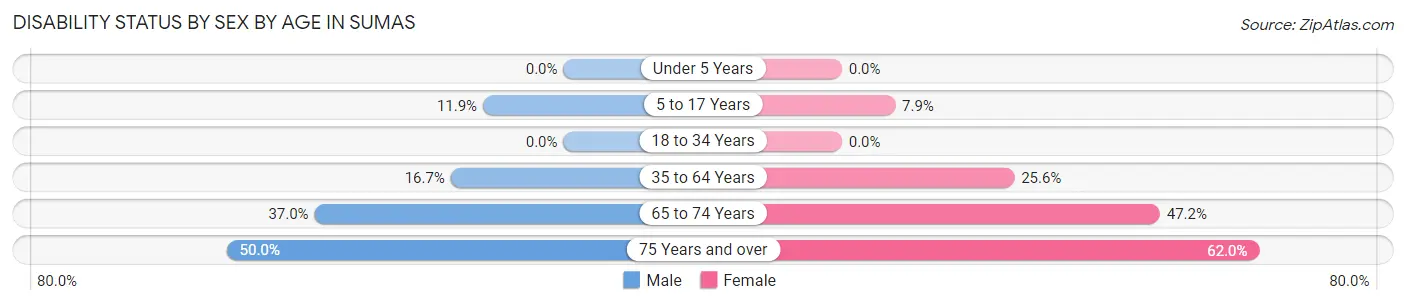
| Age Bracket | Male | Female |
| Under 5 Years | 0 (0.0%) | 0 (0.0%) |
| 5 to 17 Years | 16 (11.9%) | 8 (7.9%) |
| 18 to 34 Years | 0 (0.0%) | 0 (0.0%) |
| 35 to 64 Years | 43 (16.7%) | 64 (25.6%) |
| 65 to 74 Years | 17 (37.0%) | 17 (47.2%) |
| 75 Years and over | 3 (50.0%) | 31 (62.0%) |
Disability Class by Sex by Age in Sumas
Disability Class: Hearing Difficulty
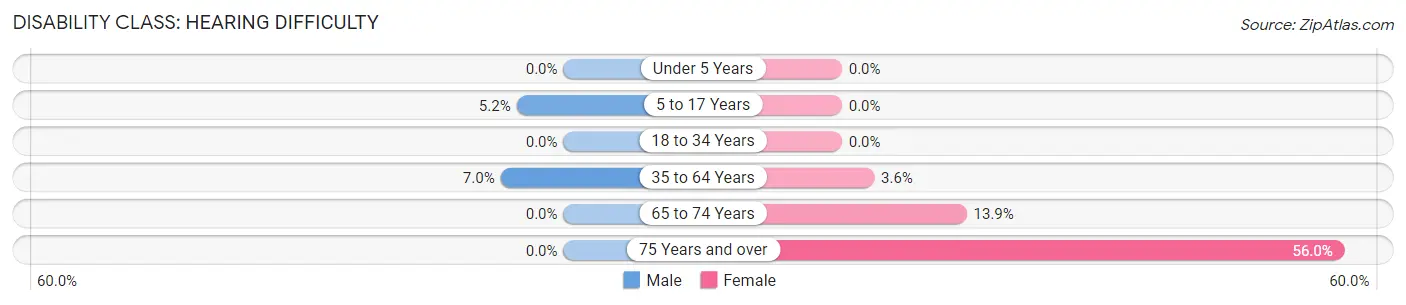
| Age Bracket | Male | Female |
| Under 5 Years | 0 (0.0%) | 0 (0.0%) |
| 5 to 17 Years | 7 (5.2%) | 0 (0.0%) |
| 18 to 34 Years | 0 (0.0%) | 0 (0.0%) |
| 35 to 64 Years | 18 (7.0%) | 9 (3.6%) |
| 65 to 74 Years | 0 (0.0%) | 5 (13.9%) |
| 75 Years and over | 0 (0.0%) | 28 (56.0%) |
Disability Class: Vision Difficulty
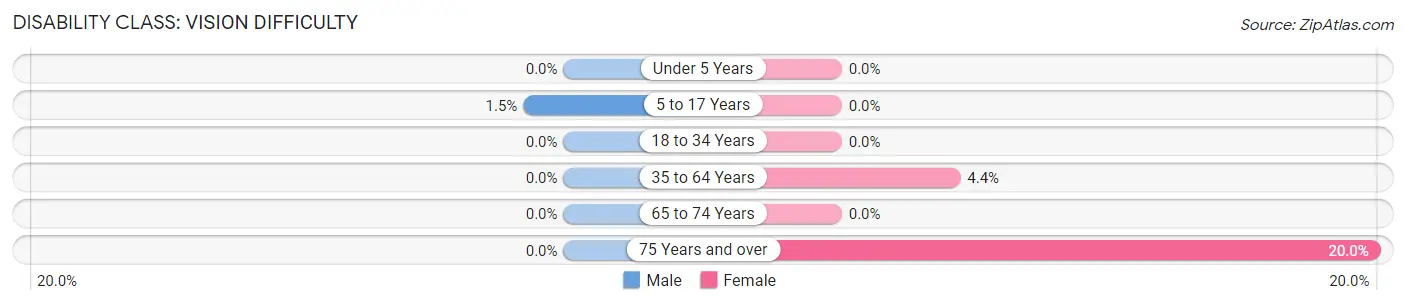
| Age Bracket | Male | Female |
| Under 5 Years | 0 (0.0%) | 0 (0.0%) |
| 5 to 17 Years | 2 (1.5%) | 0 (0.0%) |
| 18 to 34 Years | 0 (0.0%) | 0 (0.0%) |
| 35 to 64 Years | 0 (0.0%) | 11 (4.4%) |
| 65 to 74 Years | 0 (0.0%) | 0 (0.0%) |
| 75 Years and over | 0 (0.0%) | 10 (20.0%) |
Disability Class: Cognitive Difficulty
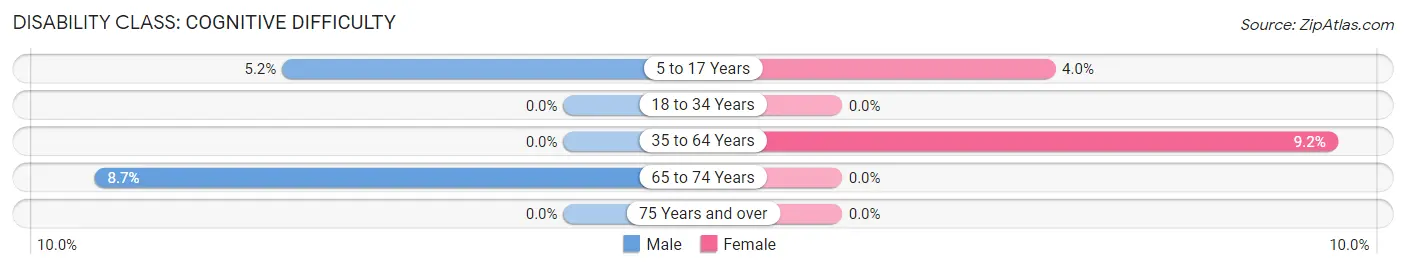
| Age Bracket | Male | Female |
| 5 to 17 Years | 7 (5.2%) | 4 (4.0%) |
| 18 to 34 Years | 0 (0.0%) | 0 (0.0%) |
| 35 to 64 Years | 0 (0.0%) | 23 (9.2%) |
| 65 to 74 Years | 4 (8.7%) | 0 (0.0%) |
| 75 Years and over | 0 (0.0%) | 0 (0.0%) |
Disability Class: Ambulatory Difficulty
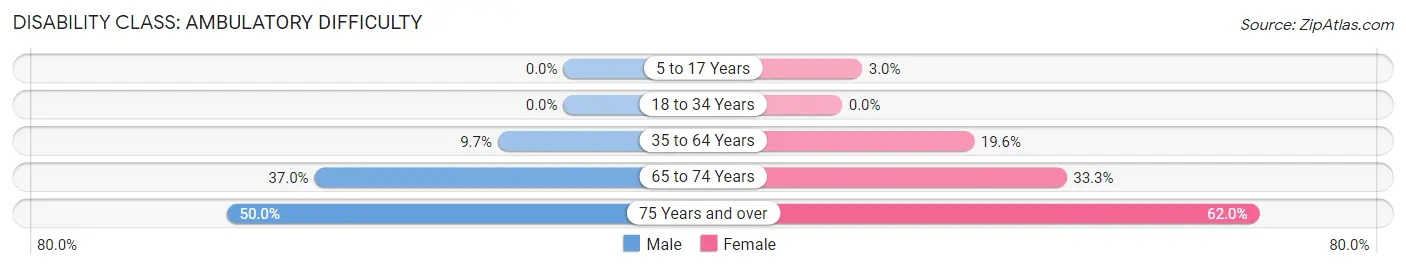
| Age Bracket | Male | Female |
| 5 to 17 Years | 0 (0.0%) | 3 (3.0%) |
| 18 to 34 Years | 0 (0.0%) | 0 (0.0%) |
| 35 to 64 Years | 25 (9.7%) | 49 (19.6%) |
| 65 to 74 Years | 17 (37.0%) | 12 (33.3%) |
| 75 Years and over | 3 (50.0%) | 31 (62.0%) |
Disability Class: Self-Care Difficulty
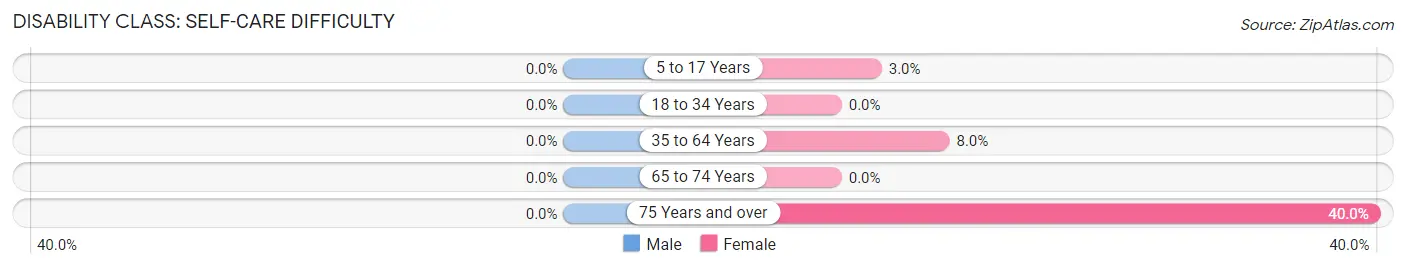
| Age Bracket | Male | Female |
| 5 to 17 Years | 0 (0.0%) | 3 (3.0%) |
| 18 to 34 Years | 0 (0.0%) | 0 (0.0%) |
| 35 to 64 Years | 0 (0.0%) | 20 (8.0%) |
| 65 to 74 Years | 0 (0.0%) | 0 (0.0%) |
| 75 Years and over | 0 (0.0%) | 20 (40.0%) |
Technology Access in Sumas
Computing Device Access in Sumas
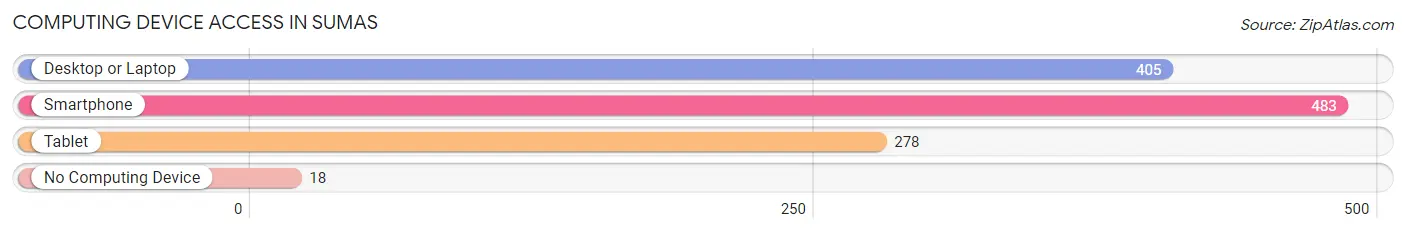
| Device Type | # Households | % Households |
| Desktop or Laptop | 405 | 76.0% |
| Smartphone | 483 | 90.6% |
| Tablet | 278 | 52.2% |
| No Computing Device | 18 | 3.4% |
| Total | 533 | 100.0% |
Internet Access in Sumas
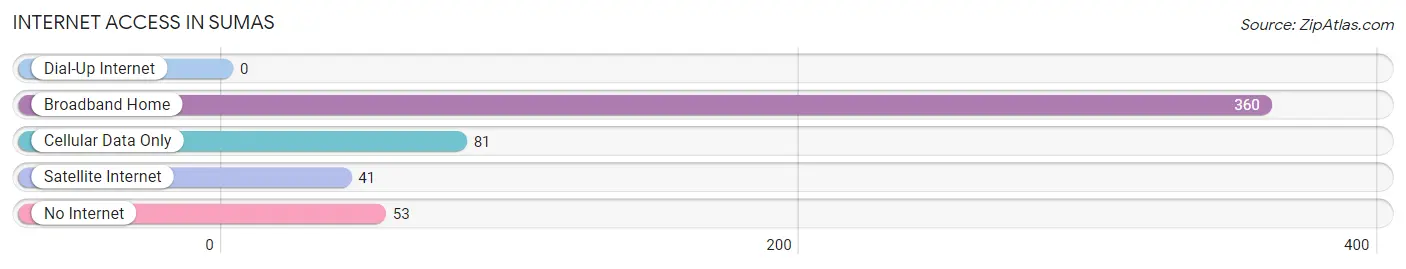
| Internet Type | # Households | % Households |
| Dial-Up Internet | 0 | 0.0% |
| Broadband Home | 360 | 67.5% |
| Cellular Data Only | 81 | 15.2% |
| Satellite Internet | 41 | 7.7% |
| No Internet | 53 | 9.9% |
| Total | 533 | 100.0% |
Sumas Summary
Sumas, Washington is a small town located in Whatcom County, Washington, United States. It is situated on the border of the United States and Canada, and is the northernmost town in the state. The town has a population of 1,541 as of the 2010 census, and is part of the Bellingham, Washington Metropolitan Statistical Area.
History
The area that is now Sumas was originally inhabited by the Nooksack people, who lived in the area for thousands of years before the arrival of European settlers. The first European settlers arrived in the area in the late 19th century, and the town was officially incorporated in 1910. The town was named after the Sumas River, which flows through the area.
The town was originally a farming community, and the main crops grown in the area were potatoes, wheat, and hay. The town also had a thriving lumber industry, and the local sawmill was the largest employer in the area.
In the early 20th century, the town was a popular destination for tourists, and the local economy was bolstered by the influx of visitors. The town was also home to a number of resorts, including the Sumas Hotel, which was built in 1910.
Geography
Sumas is located in Whatcom County, Washington, United States. It is situated on the border of the United States and Canada, and is the northernmost town in the state. The town is located at the confluence of the Sumas River and the Nooksack River, and is surrounded by the Cascade Mountains to the east and the Coast Mountains to the west.
The town has a total area of 1.3 square miles, all of which is land. The town is located at an elevation of 441 feet above sea level.
Economy
The economy of Sumas is largely based on agriculture and tourism. The town is home to a number of farms, which produce a variety of crops, including potatoes, wheat, and hay. The town is also home to a number of tourist attractions, including the Sumas Hotel, which was built in 1910.
The town is also home to a number of businesses, including restaurants, retail stores, and a number of service-based businesses. The town is also home to a number of manufacturing businesses, including a sawmill and a woodworking shop.
Demographics
As of the 2010 census, the town had a population of 1,541. The racial makeup of the town was 94.3% White, 0.7% African American, 0.7% Native American, 0.7% Asian, 0.1% Pacific Islander, 0.7% from other races, and 2.6% from two or more races. Hispanic or Latino of any race were 3.2% of the population.
The median income for a household in the town was $41,250, and the median income for a family was $45,833. The per capita income for the town was $19,945. About 11.2% of families and 14.2% of the population were below the poverty line, including 18.2% of those under age 18 and 8.3% of those age 65 or over.
Common Questions
What is Per Capita Income in Sumas?
Per Capita income in Sumas is $35,777.
What is the Median Family Income in Sumas?
Median Family Income in Sumas is $103,506.
What is the Median Household income in Sumas?
Median Household Income in Sumas is $82,188.
What is Income or Wage Gap in Sumas?
Income or Wage Gap in Sumas is 46.9%.
Women in Sumas earn 53.1 cents for every dollar earned by a man.
What is Family Income Deficit in Sumas?
Family Income Deficit in Sumas is $12,686.
Families that are below poverty line in Sumas earn $12,686 less on average than the poverty threshold level.
What is Inequality or Gini Index in Sumas?
Inequality or Gini Index in Sumas is 0.42.
What is the Total Population of Sumas?
Total Population of Sumas is 1,397.
What is the Total Male Population of Sumas?
Total Male Population of Sumas is 732.
What is the Total Female Population of Sumas?
Total Female Population of Sumas is 665.
What is the Ratio of Males per 100 Females in Sumas?
There are 110.08 Males per 100 Females in Sumas.
What is the Ratio of Females per 100 Males in Sumas?
There are 90.85 Females per 100 Males in Sumas.
What is the Median Population Age in Sumas?
Median Population Age in Sumas is 31.1 Years.
What is the Average Family Size in Sumas
Average Family Size in Sumas is 3.3 People.
What is the Average Household Size in Sumas
Average Household Size in Sumas is 2.6 People.
How Large is the Labor Force in Sumas?
There are 684 People in the Labor Forcein in Sumas.
What is the Percentage of People in the Labor Force in Sumas?
63.9% of People are in the Labor Force in Sumas.
What is the Unemployment Rate in Sumas?
Unemployment Rate in Sumas is 3.8%.