Nespelem Community, WA Map & Demographics
Nespelem Community Map
Nespelem Community Overview
$24,568
PER CAPITA INCOME
$112,639
AVG FAMILY INCOME
$96,250
AVG HOUSEHOLD INCOME
0.39
INEQUALITY / GINI INDEX
309
TOTAL POPULATION
146
MALE POPULATION
163
FEMALE POPULATION
89.57
MALES / 100 FEMALES
111.64
FEMALES / 100 MALES
29.0
MEDIAN AGE
4.1
AVG FAMILY SIZE
3.7
AVG HOUSEHOLD SIZE
123
LABOR FORCE [ PEOPLE ]
51.0%
PERCENT IN LABOR FORCE
10.6%
UNEMPLOYMENT RATE
Income in Nespelem Community
Income Overview in Nespelem Community
Per Capita Income in Nespelem Community is $24,568, while median incomes of families and households are $112,639 and $96,250 respectively.
| Characteristic | Number | Measure |
| Per Capita Income | 309 | $24,568 |
| Median Family Income | 70 | $112,639 |
| Mean Family Income | 70 | $107,434 |
| Median Household Income | 83 | $96,250 |
| Mean Household Income | 83 | $101,351 |
| Income Deficit | 70 | $0 |
| Wage / Income Gap (%) | 309 | 0.00% |
| Wage / Income Gap ($) | 309 | 100.00¢ per $1 |
| Gini / Inequality Index | 309 | 0.39 |
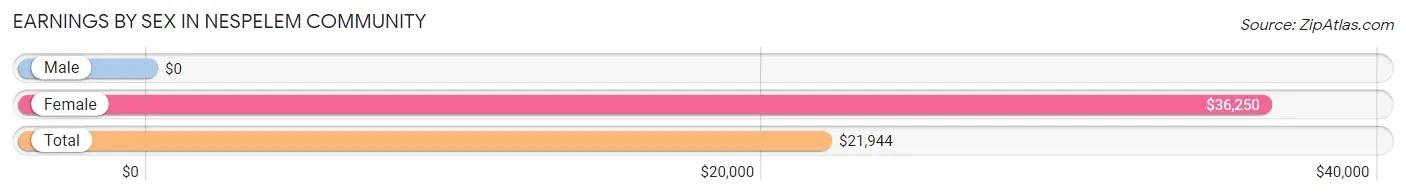
Earnings by Sex in Nespelem Community
| Sex | Number | Average Earnings |
| Male | 66 (44.0%) | $0 |
| Female | 84 (56.0%) | $36,250 |
| Total | 150 (100.0%) | $21,944 |
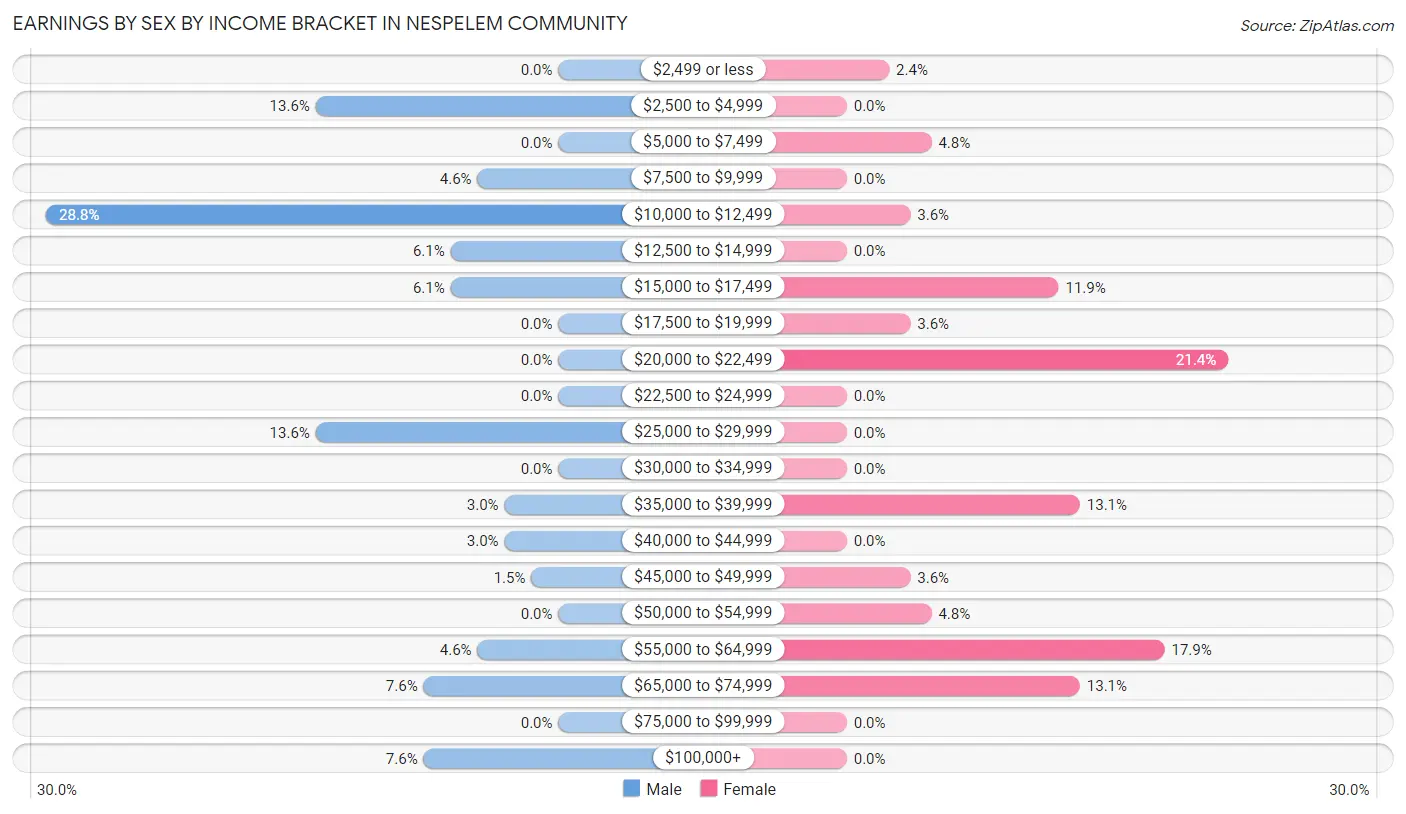
Earnings by Sex by Income Bracket in Nespelem Community
The most common earnings brackets in Nespelem Community are $10,000 to $12,499 for men (19 | 28.8%) and $20,000 to $22,499 for women (18 | 21.4%).
| Income | Male | Female |
| $2,499 or less | 0 (0.0%) | 2 (2.4%) |
| $2,500 to $4,999 | 9 (13.6%) | 0 (0.0%) |
| $5,000 to $7,499 | 0 (0.0%) | 4 (4.8%) |
| $7,500 to $9,999 | 3 (4.5%) | 0 (0.0%) |
| $10,000 to $12,499 | 19 (28.8%) | 3 (3.6%) |
| $12,500 to $14,999 | 4 (6.1%) | 0 (0.0%) |
| $15,000 to $17,499 | 4 (6.1%) | 10 (11.9%) |
| $17,500 to $19,999 | 0 (0.0%) | 3 (3.6%) |
| $20,000 to $22,499 | 0 (0.0%) | 18 (21.4%) |
| $22,500 to $24,999 | 0 (0.0%) | 0 (0.0%) |
| $25,000 to $29,999 | 9 (13.6%) | 0 (0.0%) |
| $30,000 to $34,999 | 0 (0.0%) | 0 (0.0%) |
| $35,000 to $39,999 | 2 (3.0%) | 11 (13.1%) |
| $40,000 to $44,999 | 2 (3.0%) | 0 (0.0%) |
| $45,000 to $49,999 | 1 (1.5%) | 3 (3.6%) |
| $50,000 to $54,999 | 0 (0.0%) | 4 (4.8%) |
| $55,000 to $64,999 | 3 (4.5%) | 15 (17.9%) |
| $65,000 to $74,999 | 5 (7.6%) | 11 (13.1%) |
| $75,000 to $99,999 | 0 (0.0%) | 0 (0.0%) |
| $100,000+ | 5 (7.6%) | 0 (0.0%) |
| Total | 66 (100.0%) | 84 (100.0%) |
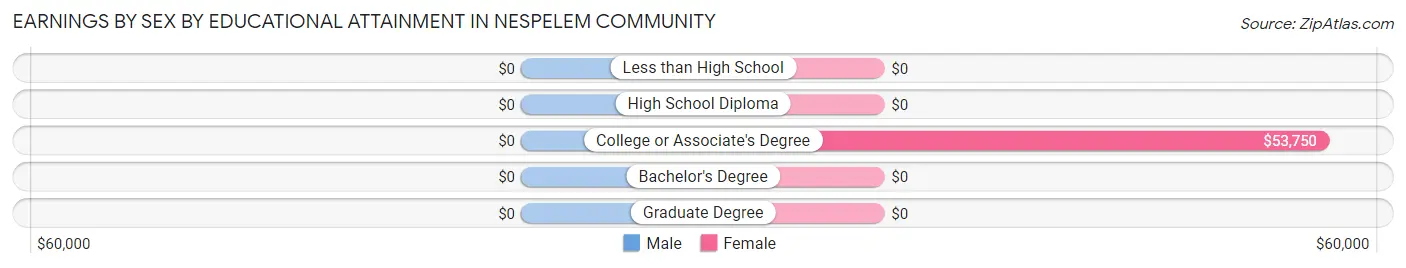
Earnings by Sex by Educational Attainment in Nespelem Community
| Educational Attainment | Male Income | Female Income |
| Less than High School | - | - |
| High School Diploma | - | - |
| College or Associate's Degree | - | - |
| Bachelor's Degree | - | - |
| Graduate Degree | - | - |
| Total | - | - |
Family Income in Nespelem Community
Family Income Brackets in Nespelem Community
According to the Nespelem Community family income data, there are 36 families falling into the $100,000 to $149,999 income range, which is the most common income bracket and makes up 51.4% of all families.
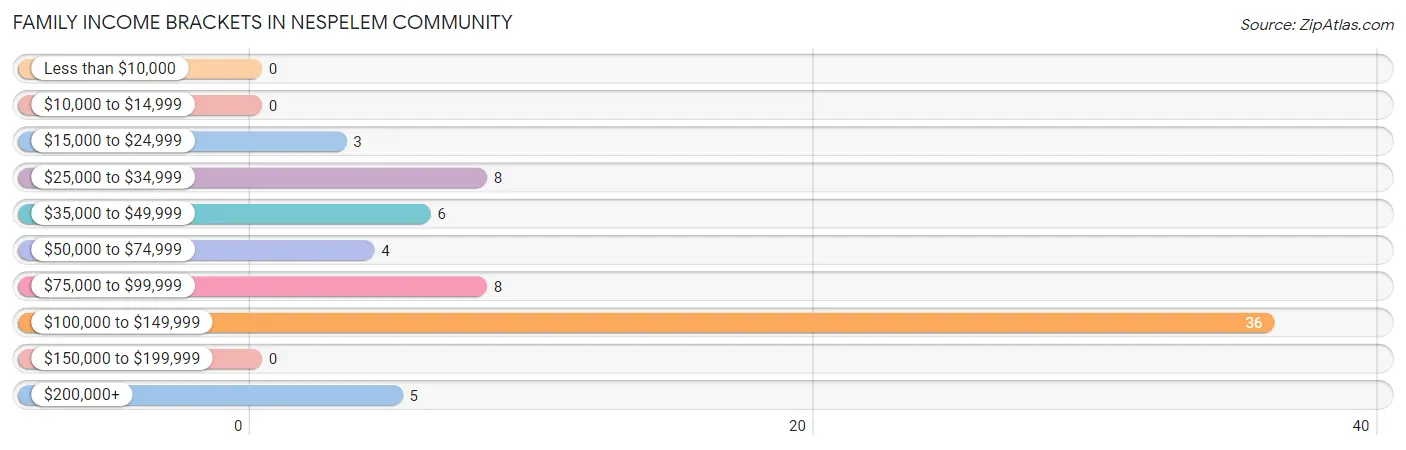
| Income Bracket | # Families | % Families |
| Less than $10,000 | 0 | 0.0% |
| $10,000 to $14,999 | 0 | 0.0% |
| $15,000 to $24,999 | 3 | 4.3% |
| $25,000 to $34,999 | 8 | 11.4% |
| $35,000 to $49,999 | 6 | 8.6% |
| $50,000 to $74,999 | 4 | 5.7% |
| $75,000 to $99,999 | 8 | 11.4% |
| $100,000 to $149,999 | 36 | 51.4% |
| $150,000 to $199,999 | 0 | 0.0% |
| $200,000+ | 5 | 7.1% |
Family Income by Famaliy Size in Nespelem Community
3-person families (25 | 35.7%) account for the highest median family income in Nespelem Community with $113,958 per family, while 3-person families (25 | 35.7%) have the highest median income of $37,986 per family member.
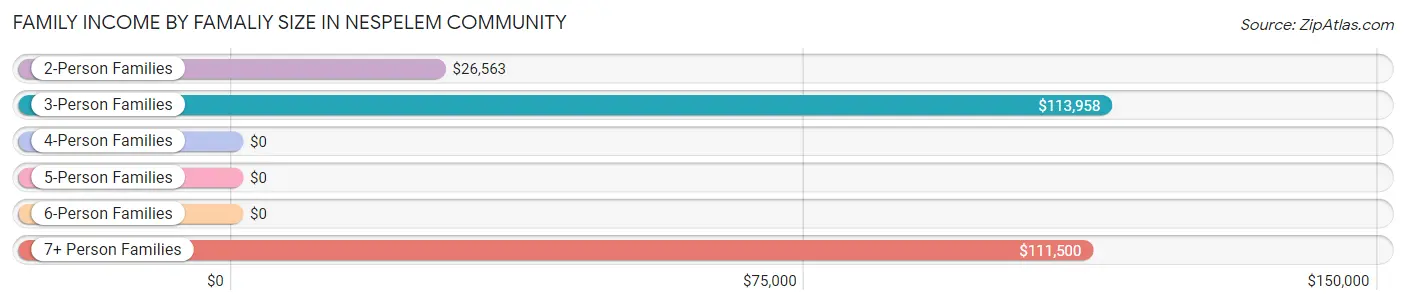
| Income Bracket | # Families | Median Income |
| 2-Person Families | 10 (14.3%) | $26,563 |
| 3-Person Families | 25 (35.7%) | $113,958 |
| 4-Person Families | 6 (8.6%) | $0 |
| 5-Person Families | 15 (21.4%) | $0 |
| 6-Person Families | 6 (8.6%) | $0 |
| 7+ Person Families | 8 (11.4%) | $111,500 |
| Total | 70 (100.0%) | $112,639 |
Family Income by Number of Earners in Nespelem Community
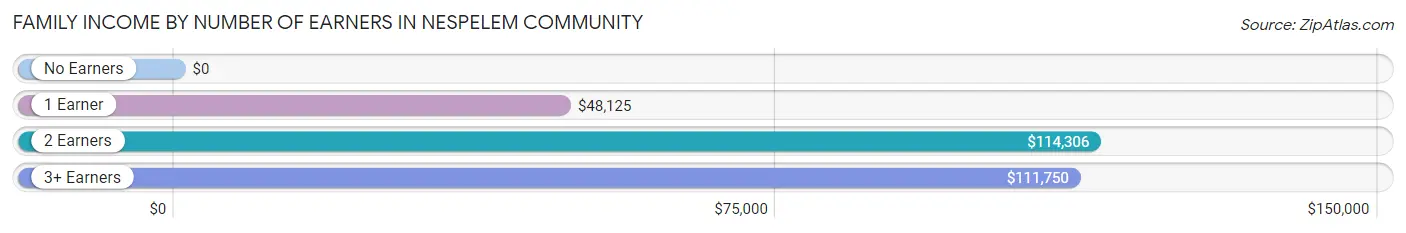
| Number of Earners | # Families | Median Income |
| No Earners | 4 (5.7%) | $0 |
| 1 Earner | 17 (24.3%) | $48,125 |
| 2 Earners | 32 (45.7%) | $114,306 |
| 3+ Earners | 17 (24.3%) | $111,750 |
| Total | 70 (100.0%) | $112,639 |
Household Income in Nespelem Community
Household Income Brackets in Nespelem Community
With 27 households falling in the category, the $100,000 to $149,999 income range is the most frequent in Nespelem Community, accounting for 32.5% of all households.
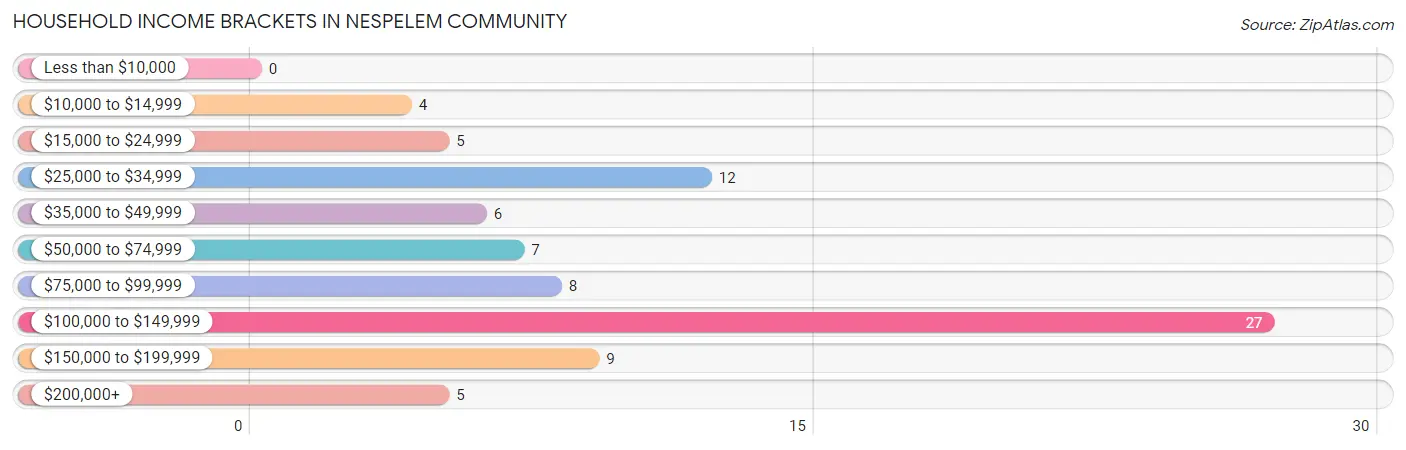
| Income Bracket | # Households | % Households |
| Less than $10,000 | 0 | 0.0% |
| $10,000 to $14,999 | 4 | 4.8% |
| $15,000 to $24,999 | 5 | 6.0% |
| $25,000 to $34,999 | 12 | 14.5% |
| $35,000 to $49,999 | 6 | 7.2% |
| $50,000 to $74,999 | 7 | 8.4% |
| $75,000 to $99,999 | 8 | 9.6% |
| $100,000 to $149,999 | 27 | 32.5% |
| $150,000 to $199,999 | 9 | 10.8% |
| $200,000+ | 5 | 6.0% |
Household Income by Householder Age in Nespelem Community
The median household income in Nespelem Community is $96,250, with the highest median household income of $165,278 found in the 25 to 44 years age bracket for the primary householder. A total of 16 households (19.3%) fall into this category.
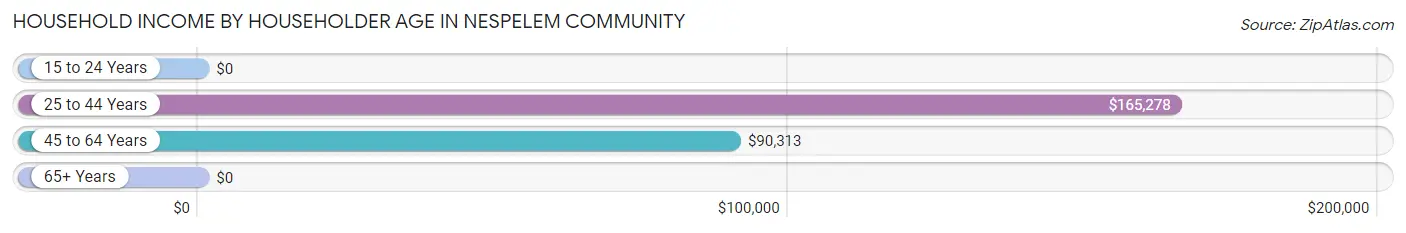
| Income Bracket | # Households | Median Income |
| 15 to 24 Years | 0 (0.0%) | $0 |
| 25 to 44 Years | 16 (19.3%) | $165,278 |
| 45 to 64 Years | 27 (32.5%) | $90,313 |
| 65+ Years | 40 (48.2%) | $0 |
| Total | 83 (100.0%) | $96,250 |
Poverty in Nespelem Community
Income Below Poverty by Sex and Age in Nespelem Community
With 6.3% poverty level for males and 4.9% for females among the residents of Nespelem Community, 16 and 17 year old males and 18 to 24 year old females are the most vulnerable to poverty, with 3 males (100.0%) and 4 females (12.5%) in their respective age groups living below the poverty level.
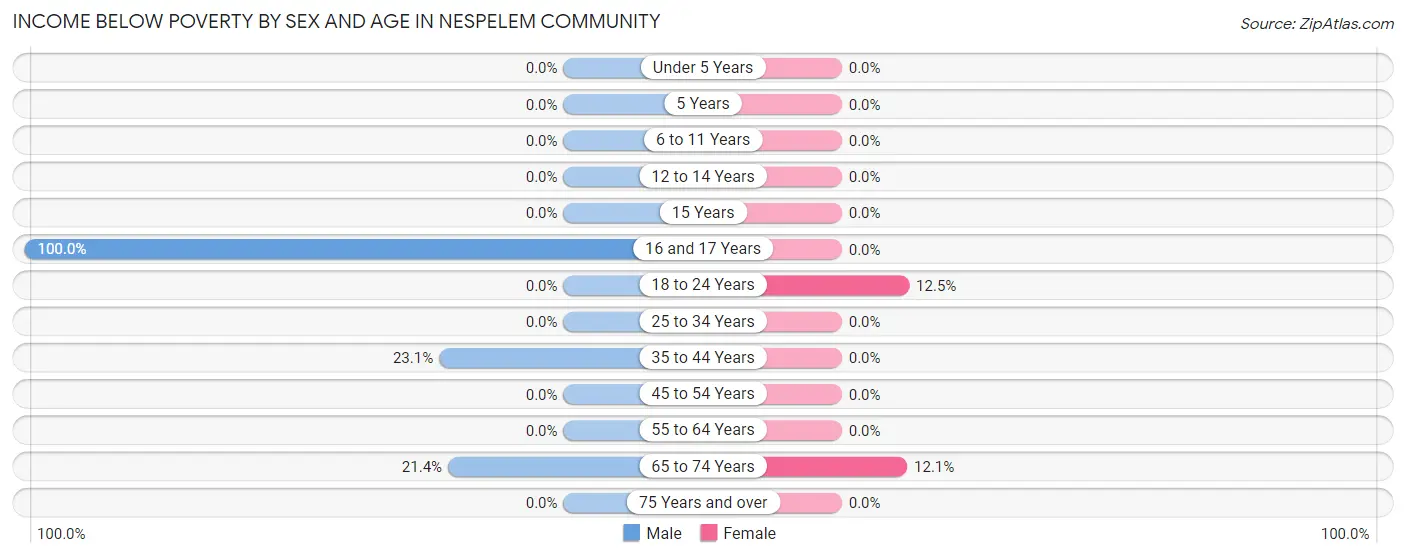
| Age Bracket | Male | Female |
| Under 5 Years | 0 (0.0%) | 0 (0.0%) |
| 5 Years | 0 (0.0%) | 0 (0.0%) |
| 6 to 11 Years | 0 (0.0%) | 0 (0.0%) |
| 12 to 14 Years | 0 (0.0%) | 0 (0.0%) |
| 15 Years | 0 (0.0%) | 0 (0.0%) |
| 16 and 17 Years | 3 (100.0%) | 0 (0.0%) |
| 18 to 24 Years | 0 (0.0%) | 4 (12.5%) |
| 25 to 34 Years | 0 (0.0%) | 0 (0.0%) |
| 35 to 44 Years | 3 (23.1%) | 0 (0.0%) |
| 45 to 54 Years | 0 (0.0%) | 0 (0.0%) |
| 55 to 64 Years | 0 (0.0%) | 0 (0.0%) |
| 65 to 74 Years | 3 (21.4%) | 4 (12.1%) |
| 75 Years and over | 0 (0.0%) | 0 (0.0%) |
| Total | 9 (6.3%) | 8 (4.9%) |
Income Above Poverty by Sex and Age in Nespelem Community
According to the poverty statistics in Nespelem Community, males aged under 5 years and females aged under 5 years are the age groups that are most secure financially, with 100.0% of males and 100.0% of females in these age groups living above the poverty line.
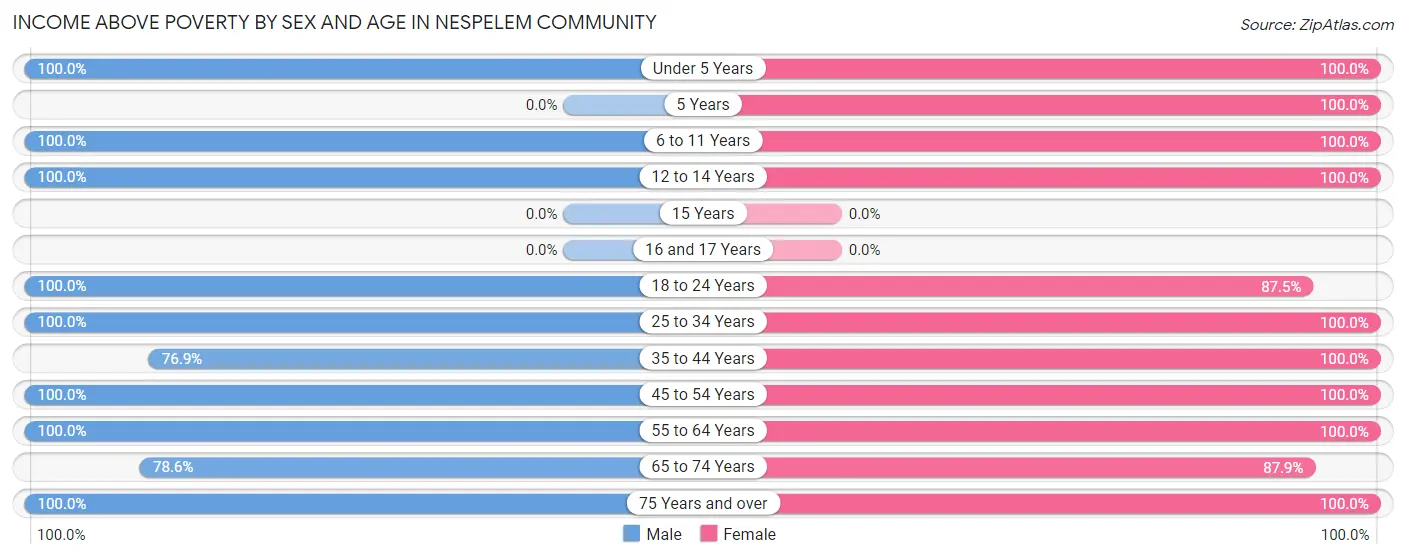
| Age Bracket | Male | Female |
| Under 5 Years | 28 (100.0%) | 9 (100.0%) |
| 5 Years | 0 (0.0%) | 3 (100.0%) |
| 6 to 11 Years | 20 (100.0%) | 2 (100.0%) |
| 12 to 14 Years | 4 (100.0%) | 2 (100.0%) |
| 15 Years | 0 (0.0%) | 0 (0.0%) |
| 16 and 17 Years | 0 (0.0%) | 0 (0.0%) |
| 18 to 24 Years | 15 (100.0%) | 28 (87.5%) |
| 25 to 34 Years | 22 (100.0%) | 33 (100.0%) |
| 35 to 44 Years | 10 (76.9%) | 8 (100.0%) |
| 45 to 54 Years | 7 (100.0%) | 28 (100.0%) |
| 55 to 64 Years | 12 (100.0%) | 9 (100.0%) |
| 65 to 74 Years | 11 (78.6%) | 29 (87.9%) |
| 75 Years and over | 4 (100.0%) | 4 (100.0%) |
| Total | 133 (93.7%) | 155 (95.1%) |
Income Below Poverty Among Married-Couple Families in Nespelem Community
The poverty statistics for married-couple families in Nespelem Community show that 11.1% or 3 of the total 27 families live below the poverty line. Families with 1 or 2 children have the highest poverty rate of 20.0%, comprising of 3 families. On the other hand, families with no children have the lowest poverty rate of 0.0%, which includes 0 families.
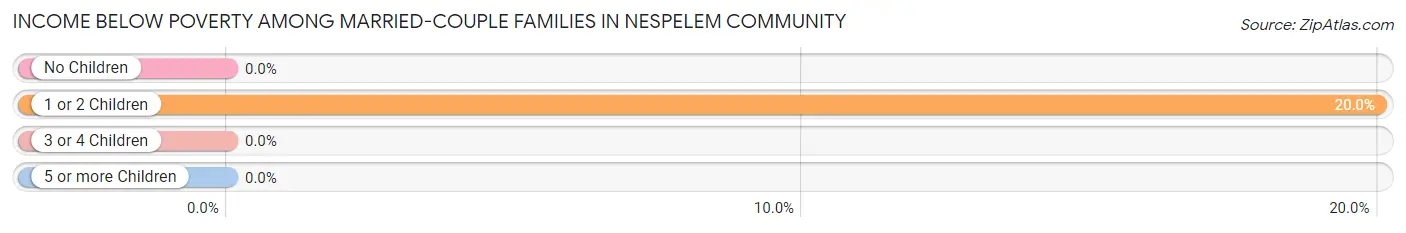
| Children | Above Poverty | Below Poverty |
| No Children | 6 (100.0%) | 0 (0.0%) |
| 1 or 2 Children | 12 (80.0%) | 3 (20.0%) |
| 3 or 4 Children | 5 (100.0%) | 0 (0.0%) |
| 5 or more Children | 1 (100.0%) | 0 (0.0%) |
| Total | 24 (88.9%) | 3 (11.1%) |
Income Below Poverty Among Single-Parent Households in Nespelem Community
| Children | Single Father | Single Mother |
| No Children | 0 (0.0%) | 0 (0.0%) |
| 1 or 2 Children | 0 (0.0%) | 0 (0.0%) |
| 3 or 4 Children | 0 (0.0%) | 0 (0.0%) |
| 5 or more Children | 0 (0.0%) | 0 (0.0%) |
| Total | 0 (0.0%) | 0 (0.0%) |
Income Below Poverty Among Married-Couple vs Single-Parent Households in Nespelem Community
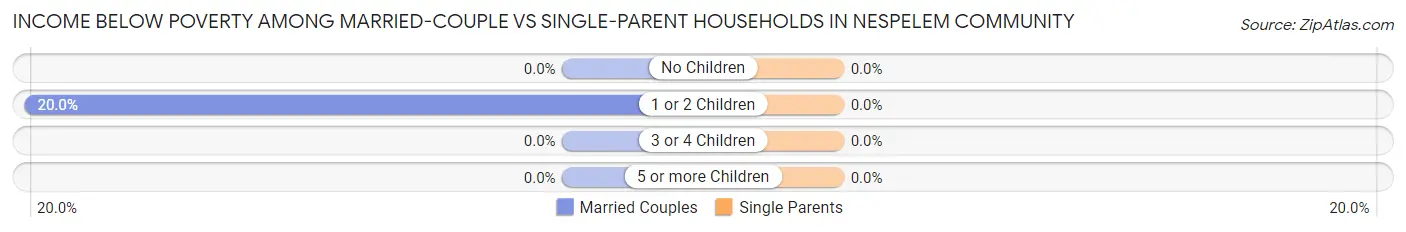
| Children | Married-Couple Families | Single-Parent Households |
| No Children | 0 (0.0%) | 0 (0.0%) |
| 1 or 2 Children | 3 (20.0%) | 0 (0.0%) |
| 3 or 4 Children | 0 (0.0%) | 0 (0.0%) |
| 5 or more Children | 0 (0.0%) | 0 (0.0%) |
| Total | 3 (11.1%) | 0 (0.0%) |
Race in Nespelem Community
The most populous races in Nespelem Community are Native / Alaskan (289 | 93.5%), White / Caucasian (16 | 5.2%), and Hispanic or Latino (4 | 1.3%).
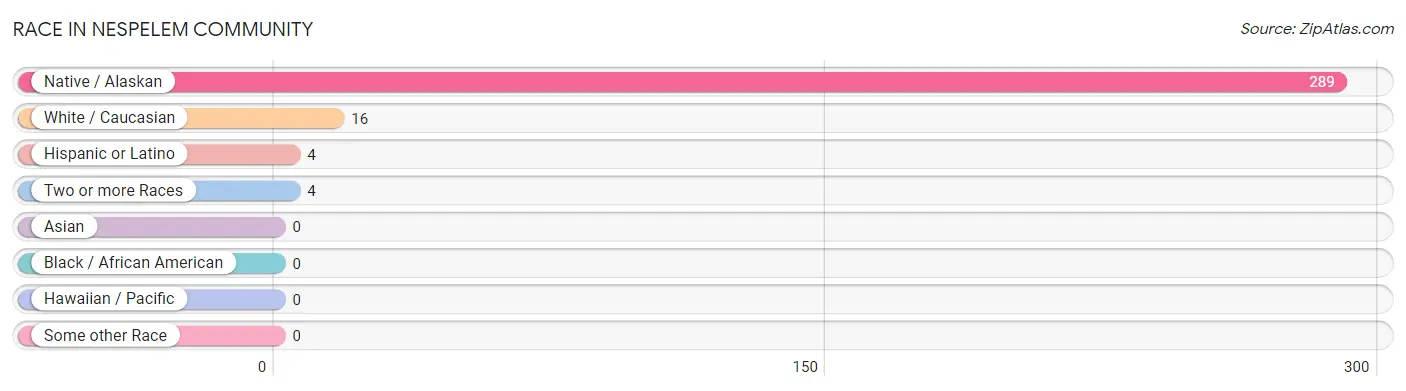
| Race | # Population | % Population |
| Asian | 0 | 0.0% |
| Black / African American | 0 | 0.0% |
| Hawaiian / Pacific | 0 | 0.0% |
| Hispanic or Latino | 4 | 1.3% |
| Native / Alaskan | 289 | 93.5% |
| White / Caucasian | 16 | 5.2% |
| Two or more Races | 4 | 1.3% |
| Some other Race | 0 | 0.0% |
| Total | 309 | 100.0% |
Ancestry in Nespelem Community
The most populous ancestries reported in Nespelem Community are Colville (263 | 85.1%), Paiute (10 | 3.2%), American (8 | 2.6%), Yakama (6 | 1.9%), and German (4 | 1.3%), together accounting for 94.2% of all Nespelem Community residents.
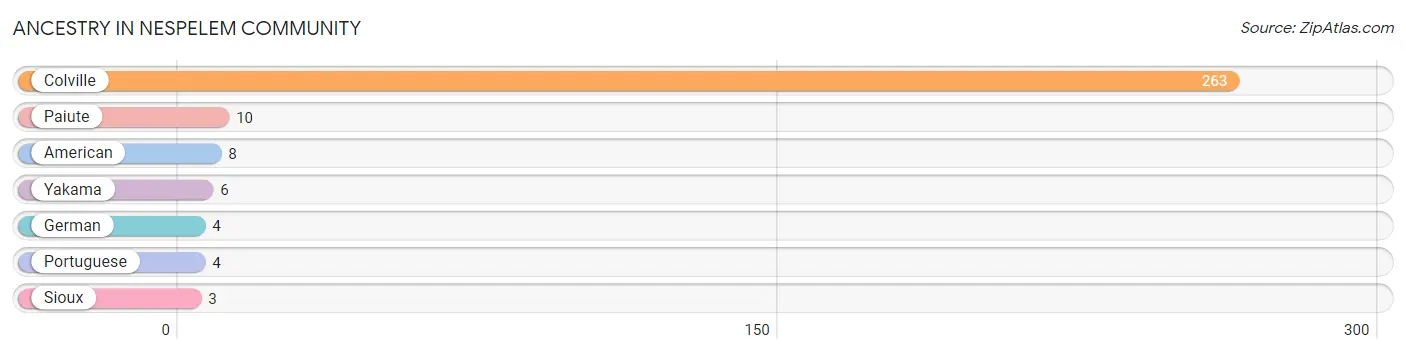
| Ancestry | # Population | % Population |
| American | 8 | 2.6% |
| Colville | 263 | 85.1% |
| German | 4 | 1.3% |
| Paiute | 10 | 3.2% |
| Portuguese | 4 | 1.3% |
| Sioux | 3 | 1.0% |
| Yakama | 6 | 1.9% | View All 7 Rows |
Immigrants in Nespelem Community
The most numerous immigrant groups reported in Nespelem Community came from Central America (4 | 1.3%), Latin America (4 | 1.3%), and Mexico (4 | 1.3%), together accounting for 3.9% of all Nespelem Community residents.
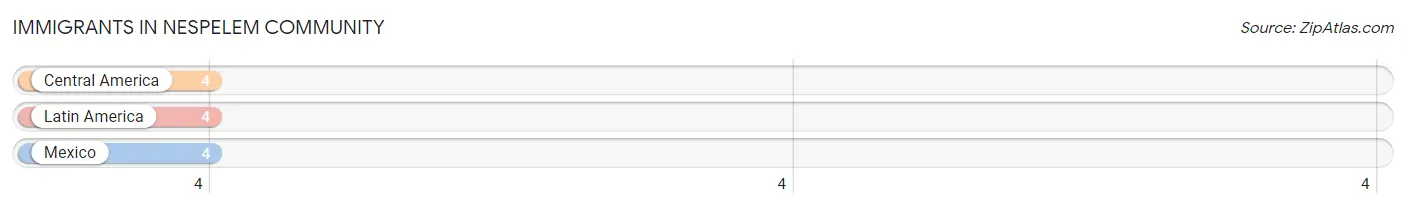
| Immigration Origin | # Population | % Population |
| Central America | 4 | 1.3% |
| Latin America | 4 | 1.3% |
| Mexico | 4 | 1.3% | View All 3 Rows |
Sex and Age in Nespelem Community
Sex and Age in Nespelem Community
The most populous age groups in Nespelem Community are Under 5 Years (28 | 19.2%) for men and 70 to 74 Years (27 | 16.6%) for women.
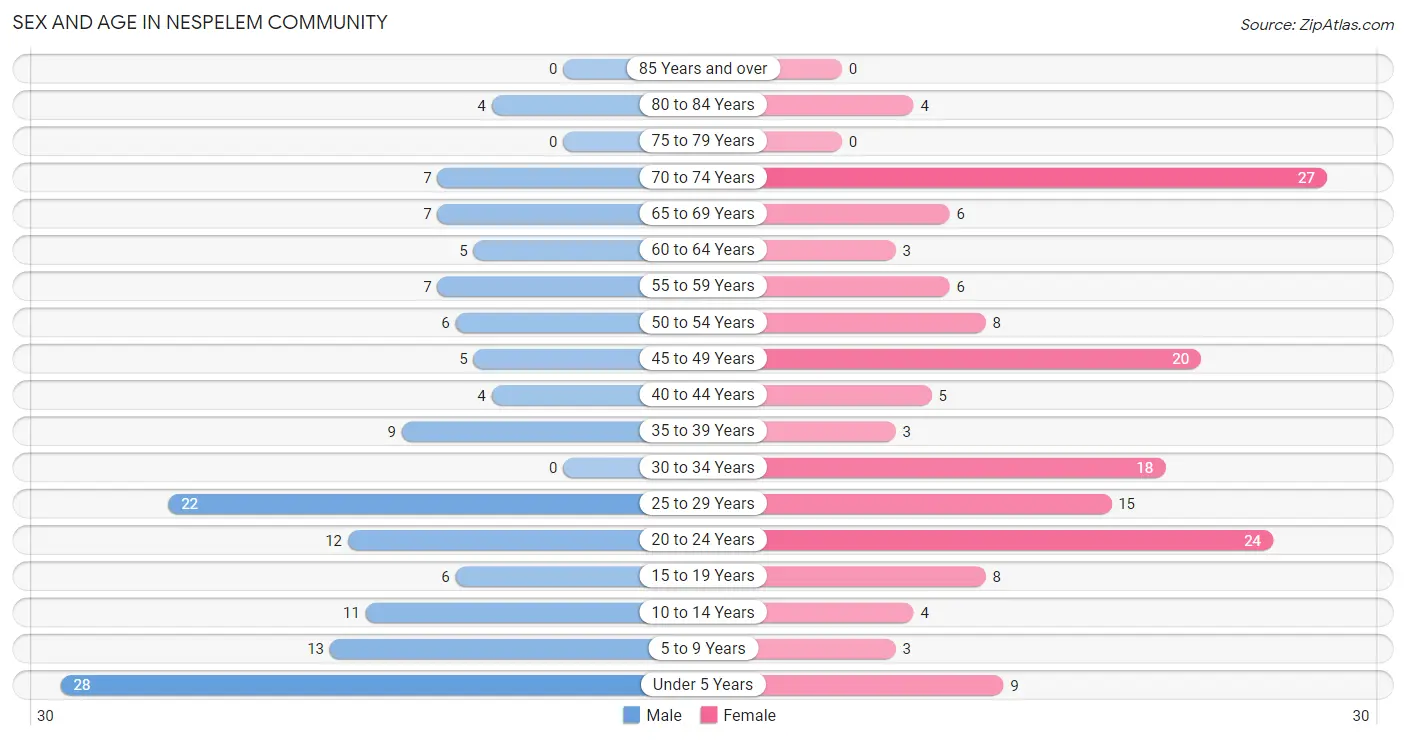
| Age Bracket | Male | Female |
| Under 5 Years | 28 (19.2%) | 9 (5.5%) |
| 5 to 9 Years | 13 (8.9%) | 3 (1.8%) |
| 10 to 14 Years | 11 (7.5%) | 4 (2.5%) |
| 15 to 19 Years | 6 (4.1%) | 8 (4.9%) |
| 20 to 24 Years | 12 (8.2%) | 24 (14.7%) |
| 25 to 29 Years | 22 (15.1%) | 15 (9.2%) |
| 30 to 34 Years | 0 (0.0%) | 18 (11.0%) |
| 35 to 39 Years | 9 (6.2%) | 3 (1.8%) |
| 40 to 44 Years | 4 (2.7%) | 5 (3.1%) |
| 45 to 49 Years | 5 (3.4%) | 20 (12.3%) |
| 50 to 54 Years | 6 (4.1%) | 8 (4.9%) |
| 55 to 59 Years | 7 (4.8%) | 6 (3.7%) |
| 60 to 64 Years | 5 (3.4%) | 3 (1.8%) |
| 65 to 69 Years | 7 (4.8%) | 6 (3.7%) |
| 70 to 74 Years | 7 (4.8%) | 27 (16.6%) |
| 75 to 79 Years | 0 (0.0%) | 0 (0.0%) |
| 80 to 84 Years | 4 (2.7%) | 4 (2.5%) |
| 85 Years and over | 0 (0.0%) | 0 (0.0%) |
| Total | 146 (100.0%) | 163 (100.0%) |
Families and Households in Nespelem Community
Median Family Size in Nespelem Community
The median family size in Nespelem Community is 4.10 persons per family, with married-couple families (27 | 38.6%) accounting for the largest median family size of 6.85 persons per family. On the other hand, single female/mother families (39 | 55.7%) represent the smallest median family size with 2.18 persons per family.
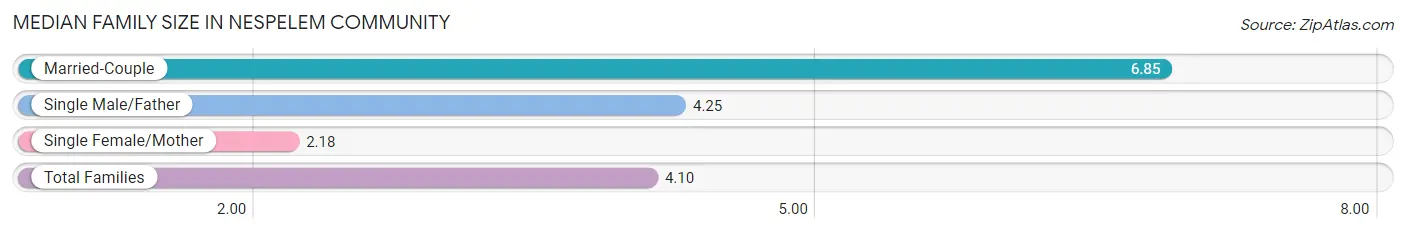
| Family Type | # Families | Family Size |
| Married-Couple | 27 (38.6%) | 6.85 |
| Single Male/Father | 4 (5.7%) | 4.25 |
| Single Female/Mother | 39 (55.7%) | 2.18 |
| Total Families | 70 (100.0%) | 4.10 |
Median Household Size in Nespelem Community
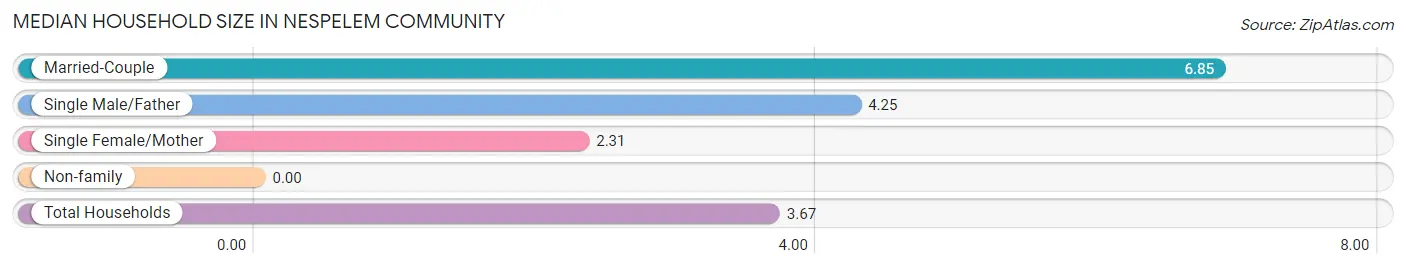
| Household Type | # Households | Household Size |
| Married-Couple | 27 (32.5%) | 6.85 |
| Single Male/Father | 4 (4.8%) | 4.25 |
| Single Female/Mother | 39 (47.0%) | 2.31 |
| Non-family | 13 (15.7%) | - |
| Total Households | 83 (100.0%) | 3.67 |
Household Size by Marriage Status in Nespelem Community
Out of a total of 83 households in Nespelem Community, 70 (84.3%) are family households, while 13 (15.7%) are nonfamily households. The most numerous type of family households are 4-person households, comprising 24, and the most common type of nonfamily households are 1-person households, comprising 13.
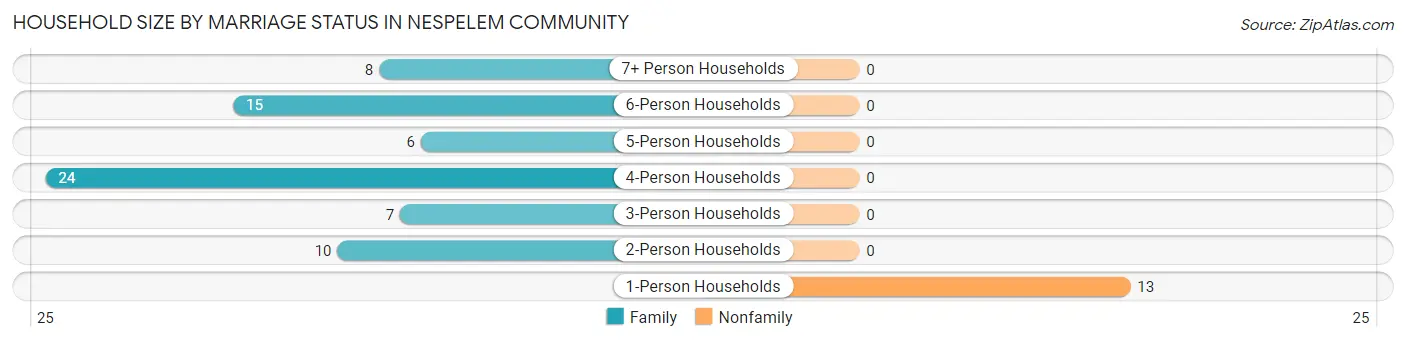
| Household Size | Family Households | Nonfamily Households |
| 1-Person Households | - | 13 (15.7%) |
| 2-Person Households | 10 (12.0%) | 0 (0.0%) |
| 3-Person Households | 7 (8.4%) | 0 (0.0%) |
| 4-Person Households | 24 (28.9%) | 0 (0.0%) |
| 5-Person Households | 6 (7.2%) | 0 (0.0%) |
| 6-Person Households | 15 (18.1%) | 0 (0.0%) |
| 7+ Person Households | 8 (9.6%) | 0 (0.0%) |
| Total | 70 (84.3%) | 13 (15.7%) |
Female Fertility in Nespelem Community
Fertility by Age in Nespelem Community
| Age Bracket | Women with Births | Births / 1,000 Women |
| 15 to 19 years | 0 (0.0%) | 0.0 |
| 20 to 34 years | 0 (0.0%) | 0.0 |
| 35 to 50 years | 0 (0.0%) | 0.0 |
| Total | 0 (0.0%) | 0.0 |
Fertility by Age by Marriage Status in Nespelem Community
| Age Bracket | Married | Unmarried |
| 15 to 19 years | 0 (0.0%) | 0 (0.0%) |
| 20 to 34 years | 0 (0.0%) | 0 (0.0%) |
| 35 to 50 years | 0 (0.0%) | 0 (0.0%) |
| Total | 0 (0.0%) | 0 (0.0%) |
Fertility by Education in Nespelem Community
| Educational Attainment | Women with Births | Births / 1,000 Women |
| Less than High School | 0 (0.0%) | 0.0 |
| High School Diploma | 0 (0.0%) | 0.0 |
| College or Associate's Degree | 0 (0.0%) | 0.0 |
| Bachelor's Degree | 0 (0.0%) | 0.0 |
| Graduate Degree | 0 (0.0%) | 0.0 |
| Total | 0 (0.0%) | 0.0 |
Fertility by Education by Marriage Status in Nespelem Community
| Educational Attainment | Married | Unmarried |
| Less than High School | 0 (0.0%) | 0 (0.0%) |
| High School Diploma | 0 (0.0%) | 0 (0.0%) |
| College or Associate's Degree | 0 (0.0%) | 0 (0.0%) |
| Bachelor's Degree | 0 (0.0%) | 0 (0.0%) |
| Graduate Degree | 0 (0.0%) | 0 (0.0%) |
| Total | 0 (0.0%) | 0 (0.0%) |
Employment Characteristics in Nespelem Community
Employment by Class of Employer in Nespelem Community
Among the 110 employed individuals in Nespelem Community, local government employees (69 | 62.7%), federal government employees (20 | 18.2%), and state government employees (8 | 7.3%) make up the most common classes of employment.
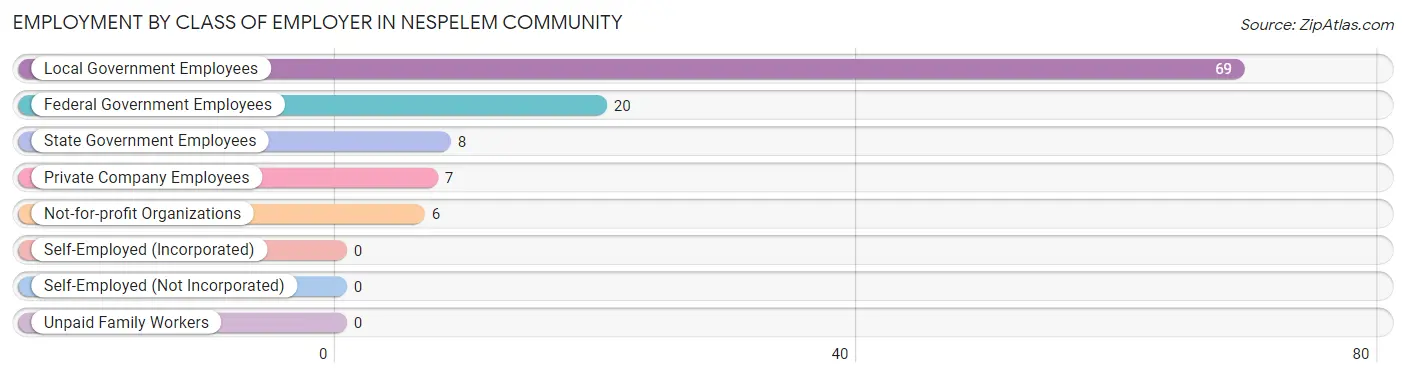
| Employer Class | # Employees | % Employees |
| Private Company Employees | 7 | 6.4% |
| Self-Employed (Incorporated) | 0 | 0.0% |
| Self-Employed (Not Incorporated) | 0 | 0.0% |
| Not-for-profit Organizations | 6 | 5.4% |
| Local Government Employees | 69 | 62.7% |
| State Government Employees | 8 | 7.3% |
| Federal Government Employees | 20 | 18.2% |
| Unpaid Family Workers | 0 | 0.0% |
| Total | 110 | 100.0% |
Employment Status by Age in Nespelem Community
According to the labor force statistics for Nespelem Community, out of the total population over 16 years of age (241), 51.0% or 123 individuals are in the labor force, with 10.6% or 13 of them unemployed. The age group with the highest labor force participation rate is 30 to 34 years, with 100.0% or 18 individuals in the labor force. Within the labor force, the 20 to 24 years age range has the highest percentage of unemployed individuals, with 26.7% or 4 of them being unemployed.
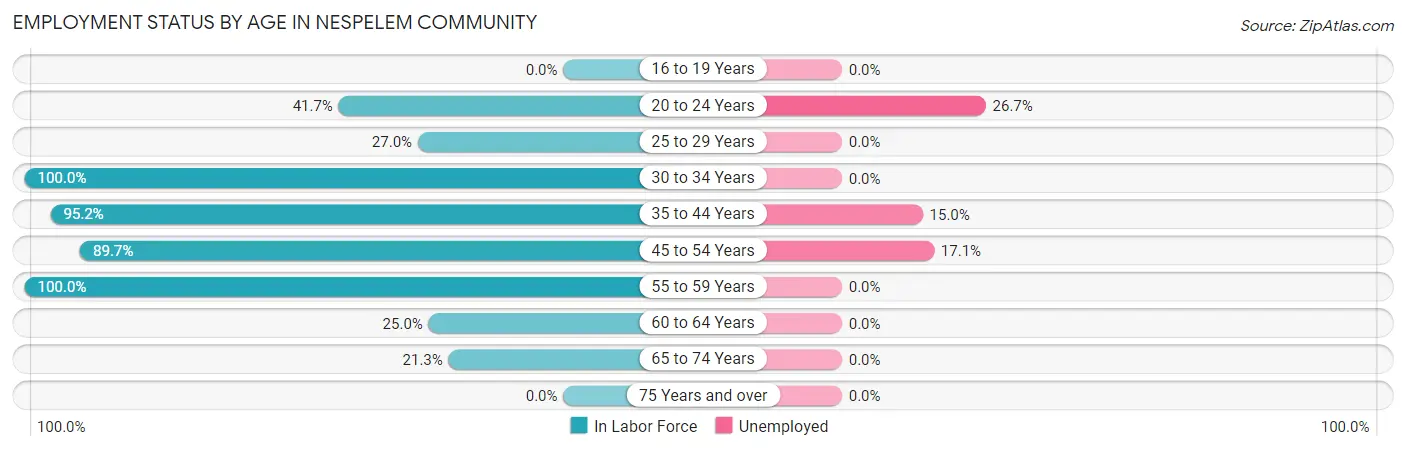
| Age Bracket | In Labor Force | Unemployed |
| 16 to 19 Years | 0 (0.0%) | 0 (0.0%) |
| 20 to 24 Years | 15 (41.7%) | 4 (26.7%) |
| 25 to 29 Years | 10 (27.0%) | 0 (0.0%) |
| 30 to 34 Years | 18 (100.0%) | 0 (0.0%) |
| 35 to 44 Years | 20 (95.2%) | 3 (15.0%) |
| 45 to 54 Years | 35 (89.7%) | 6 (17.1%) |
| 55 to 59 Years | 13 (100.0%) | 0 (0.0%) |
| 60 to 64 Years | 2 (25.0%) | 0 (0.0%) |
| 65 to 74 Years | 10 (21.3%) | 0 (0.0%) |
| 75 Years and over | 0 (0.0%) | 0 (0.0%) |
| Total | 123 (51.0%) | 13 (10.6%) |
Employment Status by Educational Attainment in Nespelem Community
According to labor force statistics for Nespelem Community, 72.1% of individuals (98) out of the total population between 25 and 64 years of age (136) are in the labor force, with 9.2% or 9 of them being unemployed. The group with the highest labor force participation rate are those with the educational attainment of bachelor's degree or higher, with 100.0% or 9 individuals in the labor force. Within the labor force, individuals with college / associate degree education have the highest percentage of unemployment, with 10.5% or 6 of them being unemployed.
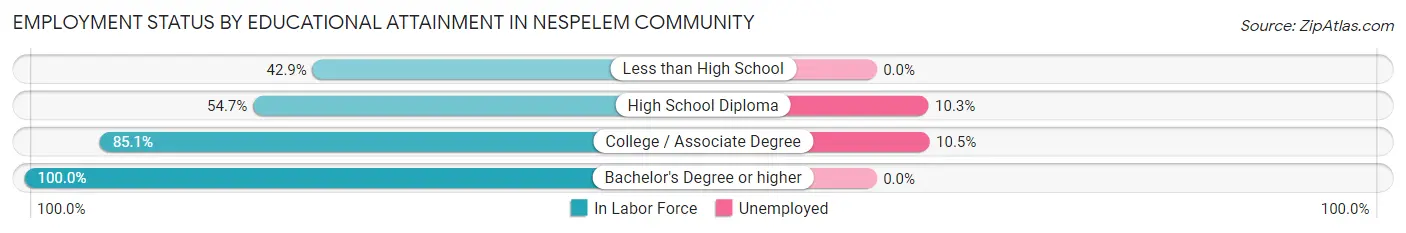
| Educational Attainment | In Labor Force | Unemployed |
| Less than High School | 3 (42.9%) | 0 (0.0%) |
| High School Diploma | 29 (54.7%) | 5 (10.3%) |
| College / Associate Degree | 57 (85.1%) | 7 (10.5%) |
| Bachelor's Degree or higher | 9 (100.0%) | 0 (0.0%) |
| Total | 98 (72.1%) | 13 (9.2%) |
Employment Occupations by Sex in Nespelem Community
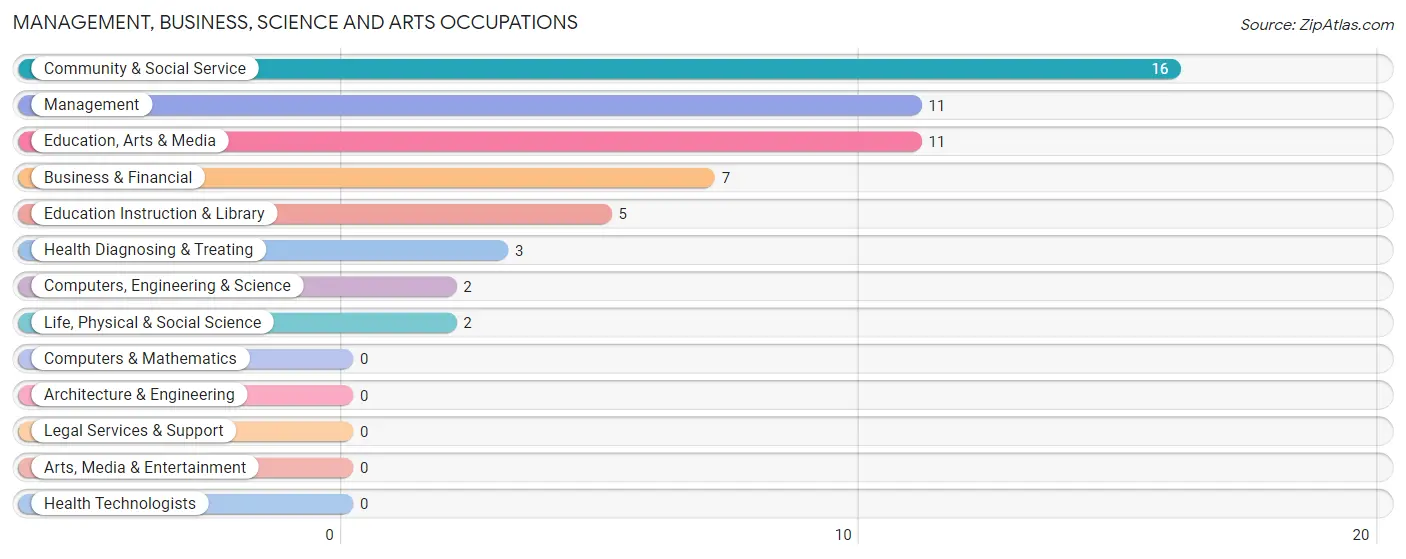
Management, Business, Science and Arts Occupations
The most common Management, Business, Science and Arts occupations in Nespelem Community are Community & Social Service (16 | 14.5%), Management (11 | 10.0%), Education, Arts & Media (11 | 10.0%), Business & Financial (7 | 6.4%), and Education Instruction & Library (5 | 4.5%).
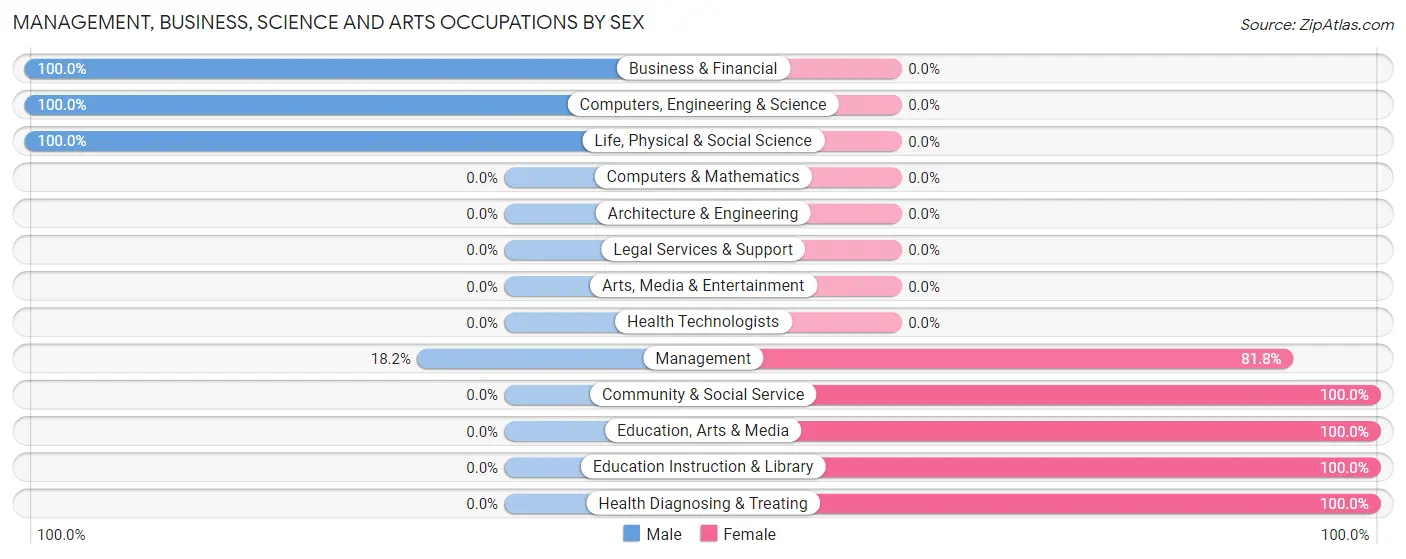
Management, Business, Science and Arts Occupations by Sex
Within the Management, Business, Science and Arts occupations in Nespelem Community, the most male-oriented occupations are Business & Financial (100.0%), Computers, Engineering & Science (100.0%), and Life, Physical & Social Science (100.0%), while the most female-oriented occupations are Community & Social Service (100.0%), Education, Arts & Media (100.0%), and Education Instruction & Library (100.0%).
| Occupation | Male | Female |
| Management | 2 (18.2%) | 9 (81.8%) |
| Business & Financial | 7 (100.0%) | 0 (0.0%) |
| Computers, Engineering & Science | 2 (100.0%) | 0 (0.0%) |
| Computers & Mathematics | 0 (0.0%) | 0 (0.0%) |
| Architecture & Engineering | 0 (0.0%) | 0 (0.0%) |
| Life, Physical & Social Science | 2 (100.0%) | 0 (0.0%) |
| Community & Social Service | 0 (0.0%) | 16 (100.0%) |
| Education, Arts & Media | 0 (0.0%) | 11 (100.0%) |
| Legal Services & Support | 0 (0.0%) | 0 (0.0%) |
| Education Instruction & Library | 0 (0.0%) | 5 (100.0%) |
| Arts, Media & Entertainment | 0 (0.0%) | 0 (0.0%) |
| Health Diagnosing & Treating | 0 (0.0%) | 3 (100.0%) |
| Health Technologists | 0 (0.0%) | 0 (0.0%) |
| Total (Category) | 11 (28.2%) | 28 (71.8%) |
| Total (Overall) | 44 (40.0%) | 66 (60.0%) |
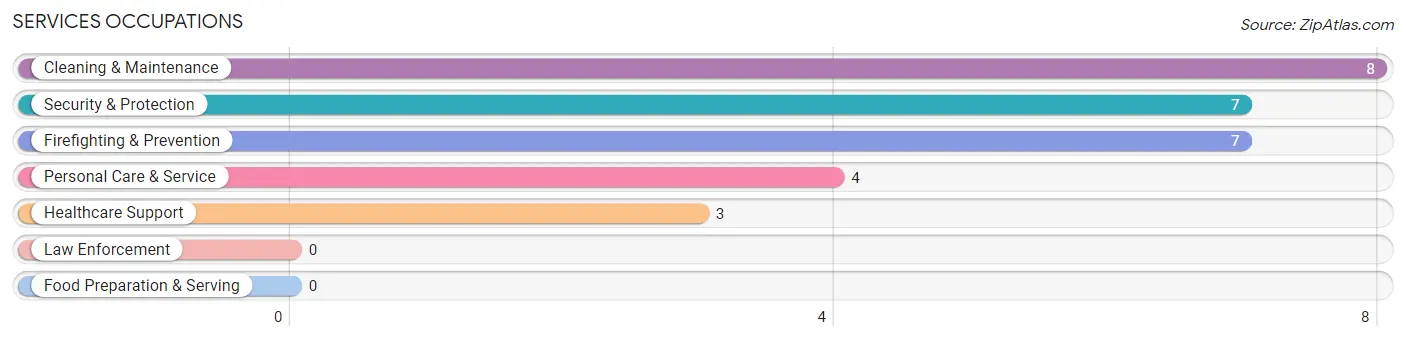
Services Occupations
The most common Services occupations in Nespelem Community are Cleaning & Maintenance (8 | 7.3%), Security & Protection (7 | 6.4%), Firefighting & Prevention (7 | 6.4%), Personal Care & Service (4 | 3.6%), and Healthcare Support (3 | 2.7%).
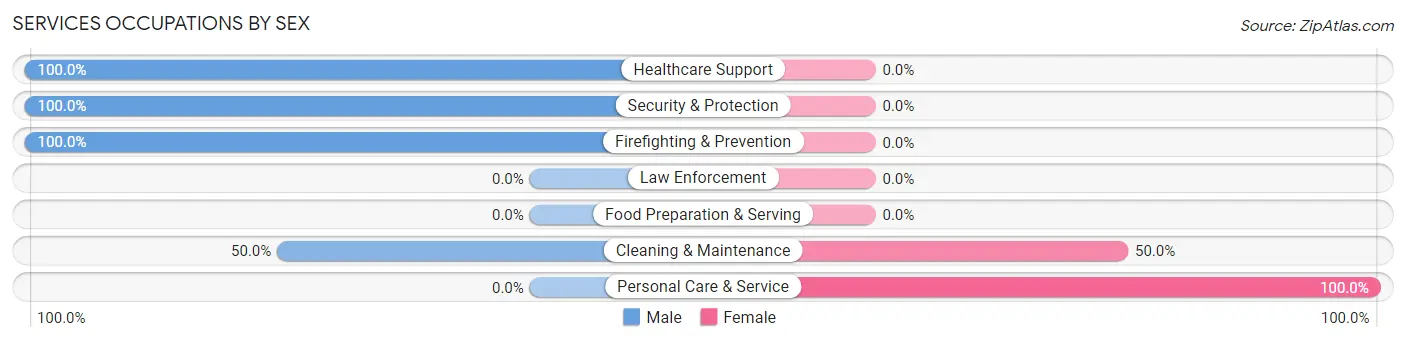
Services Occupations by Sex
Within the Services occupations in Nespelem Community, the most male-oriented occupations are Healthcare Support (100.0%), Security & Protection (100.0%), and Firefighting & Prevention (100.0%), while the most female-oriented occupations are Personal Care & Service (100.0%), and Cleaning & Maintenance (50.0%).
| Occupation | Male | Female |
| Healthcare Support | 3 (100.0%) | 0 (0.0%) |
| Security & Protection | 7 (100.0%) | 0 (0.0%) |
| Firefighting & Prevention | 7 (100.0%) | 0 (0.0%) |
| Law Enforcement | 0 (0.0%) | 0 (0.0%) |
| Food Preparation & Serving | 0 (0.0%) | 0 (0.0%) |
| Cleaning & Maintenance | 4 (50.0%) | 4 (50.0%) |
| Personal Care & Service | 0 (0.0%) | 4 (100.0%) |
| Total (Category) | 14 (63.6%) | 8 (36.4%) |
| Total (Overall) | 44 (40.0%) | 66 (60.0%) |
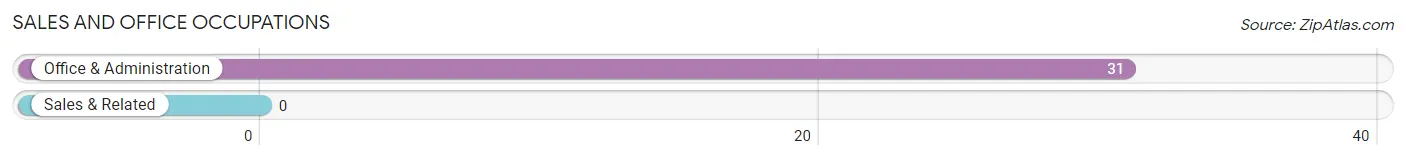
Sales and Office Occupations
The most common Sales and Office occupations in Nespelem Community are , and Office & Administration (31 | 28.2%).
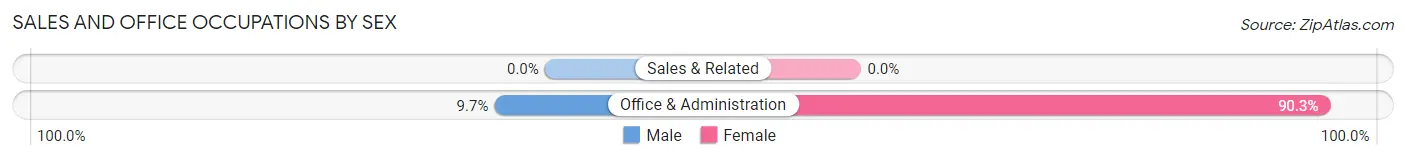
Sales and Office Occupations by Sex
| Occupation | Male | Female |
| Sales & Related | 0 (0.0%) | 0 (0.0%) |
| Office & Administration | 3 (9.7%) | 28 (90.3%) |
| Total (Category) | 3 (9.7%) | 28 (90.3%) |
| Total (Overall) | 44 (40.0%) | 66 (60.0%) |
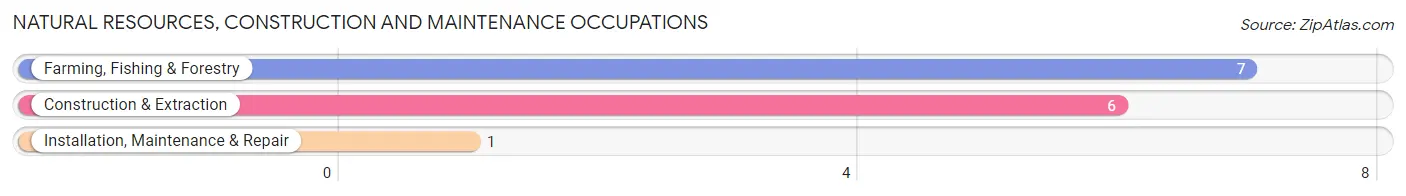
Natural Resources, Construction and Maintenance Occupations
The most common Natural Resources, Construction and Maintenance occupations in Nespelem Community are Farming, Fishing & Forestry (7 | 6.4%), Construction & Extraction (6 | 5.4%), and Installation, Maintenance & Repair (1 | 0.9%).
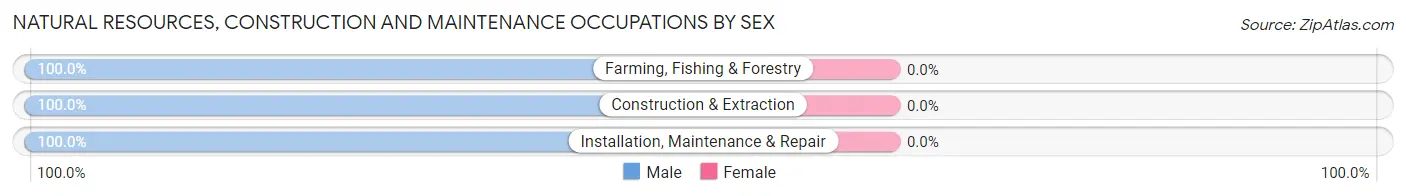
Natural Resources, Construction and Maintenance Occupations by Sex
| Occupation | Male | Female |
| Farming, Fishing & Forestry | 7 (100.0%) | 0 (0.0%) |
| Construction & Extraction | 6 (100.0%) | 0 (0.0%) |
| Installation, Maintenance & Repair | 1 (100.0%) | 0 (0.0%) |
| Total (Category) | 14 (100.0%) | 0 (0.0%) |
| Total (Overall) | 44 (40.0%) | 66 (60.0%) |
Production, Transportation and Moving Occupations
The most common Production, Transportation and Moving occupations in Nespelem Community are Transportation (2 | 1.8%), and Material Moving (2 | 1.8%).
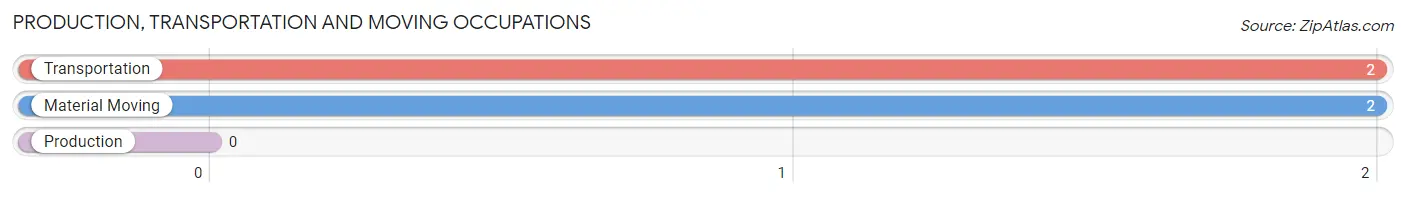
Production, Transportation and Moving Occupations by Sex
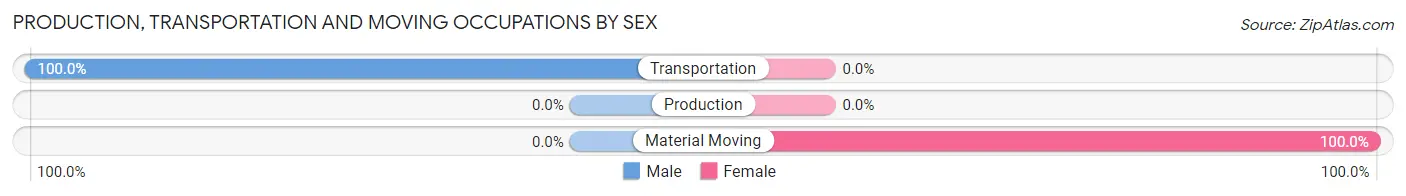
| Occupation | Male | Female |
| Production | 0 (0.0%) | 0 (0.0%) |
| Transportation | 2 (100.0%) | 0 (0.0%) |
| Material Moving | 0 (0.0%) | 2 (100.0%) |
| Total (Category) | 2 (50.0%) | 2 (50.0%) |
| Total (Overall) | 44 (40.0%) | 66 (60.0%) |
Employment Industries by Sex in Nespelem Community
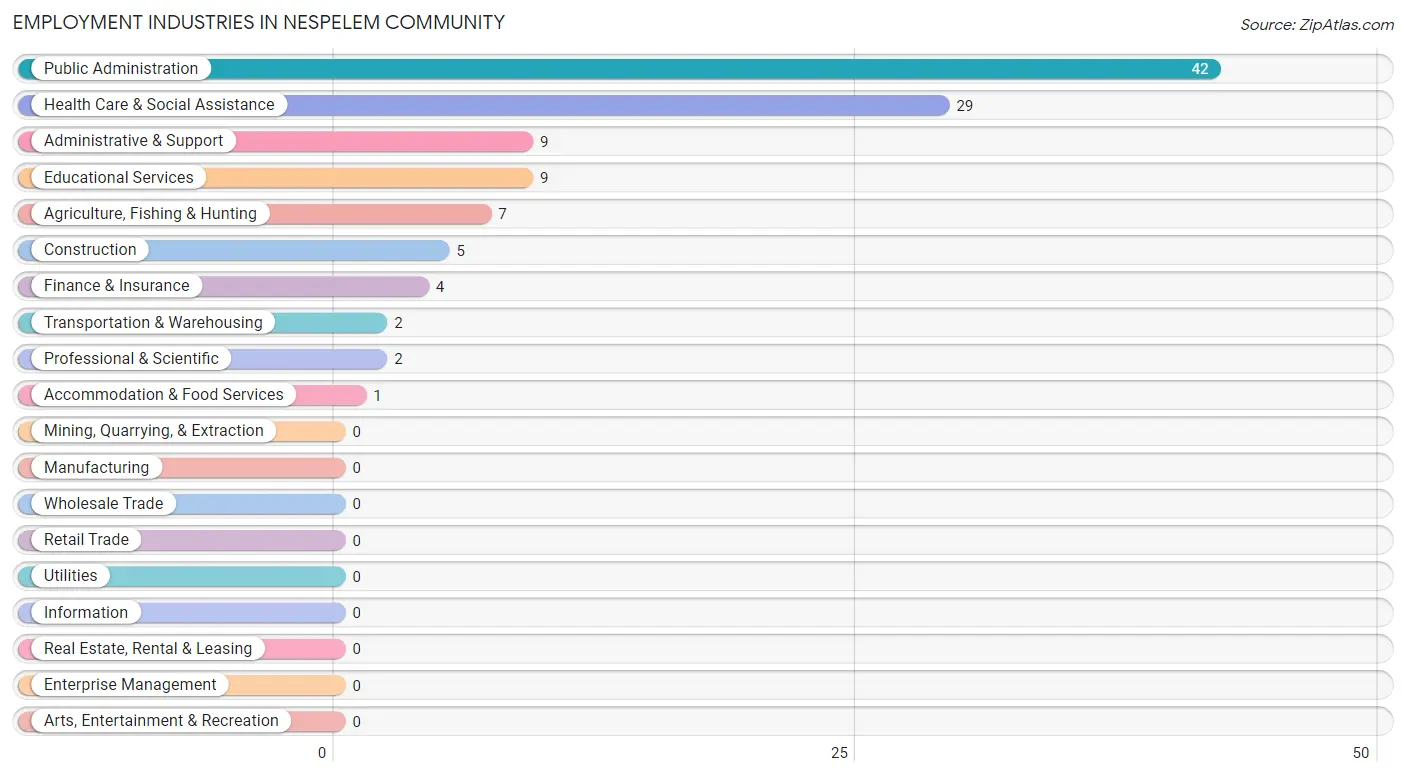
Employment Industries in Nespelem Community
The major employment industries in Nespelem Community include Public Administration (42 | 38.2%), Health Care & Social Assistance (29 | 26.4%), Administrative & Support (9 | 8.2%), Educational Services (9 | 8.2%), and Agriculture, Fishing & Hunting (7 | 6.4%).
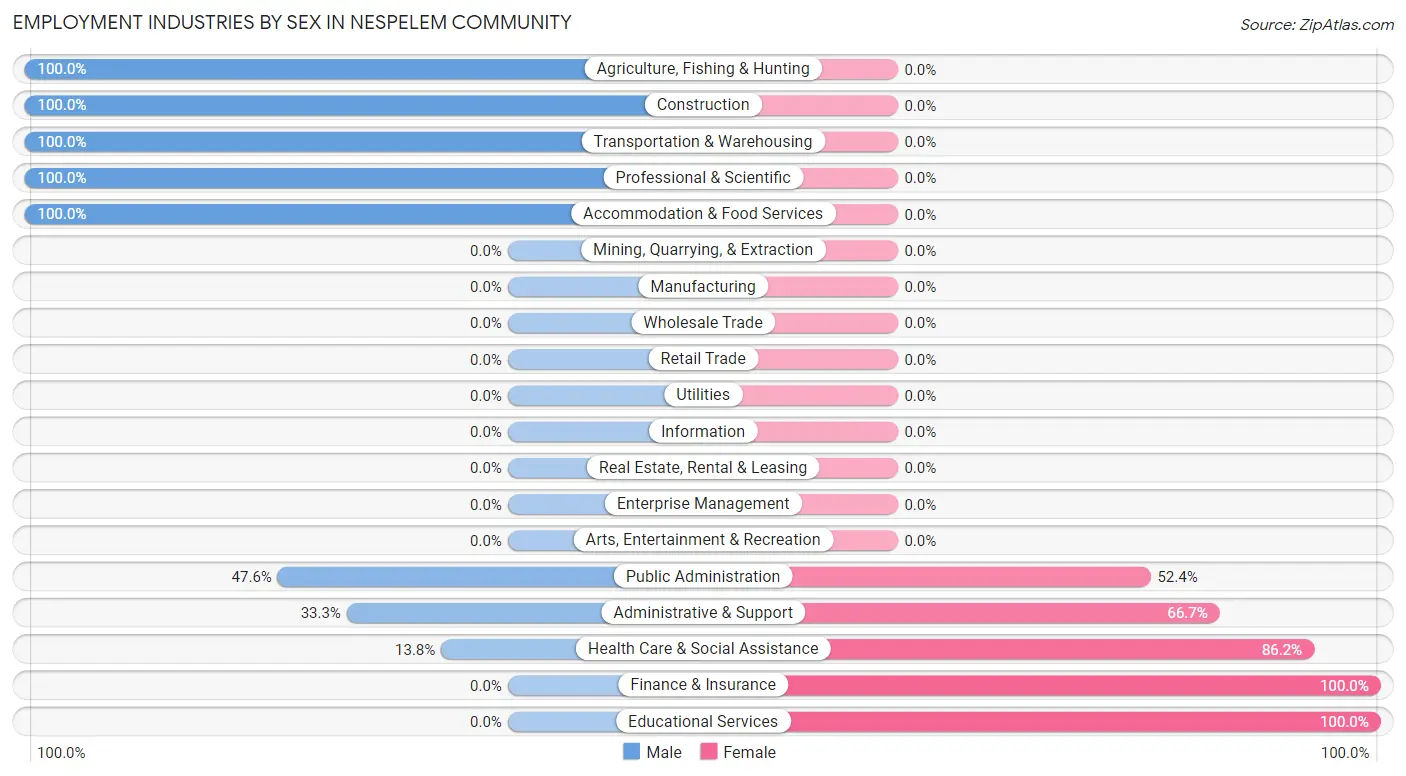
Employment Industries by Sex in Nespelem Community
The Nespelem Community industries that see more men than women are Agriculture, Fishing & Hunting (100.0%), Construction (100.0%), and Transportation & Warehousing (100.0%), whereas the industries that tend to have a higher number of women are Finance & Insurance (100.0%), Educational Services (100.0%), and Health Care & Social Assistance (86.2%).
| Industry | Male | Female |
| Agriculture, Fishing & Hunting | 7 (100.0%) | 0 (0.0%) |
| Mining, Quarrying, & Extraction | 0 (0.0%) | 0 (0.0%) |
| Construction | 5 (100.0%) | 0 (0.0%) |
| Manufacturing | 0 (0.0%) | 0 (0.0%) |
| Wholesale Trade | 0 (0.0%) | 0 (0.0%) |
| Retail Trade | 0 (0.0%) | 0 (0.0%) |
| Transportation & Warehousing | 2 (100.0%) | 0 (0.0%) |
| Utilities | 0 (0.0%) | 0 (0.0%) |
| Information | 0 (0.0%) | 0 (0.0%) |
| Finance & Insurance | 0 (0.0%) | 4 (100.0%) |
| Real Estate, Rental & Leasing | 0 (0.0%) | 0 (0.0%) |
| Professional & Scientific | 2 (100.0%) | 0 (0.0%) |
| Enterprise Management | 0 (0.0%) | 0 (0.0%) |
| Administrative & Support | 3 (33.3%) | 6 (66.7%) |
| Educational Services | 0 (0.0%) | 9 (100.0%) |
| Health Care & Social Assistance | 4 (13.8%) | 25 (86.2%) |
| Arts, Entertainment & Recreation | 0 (0.0%) | 0 (0.0%) |
| Accommodation & Food Services | 1 (100.0%) | 0 (0.0%) |
| Public Administration | 20 (47.6%) | 22 (52.4%) |
| Total | 44 (40.0%) | 66 (60.0%) |
Education in Nespelem Community
School Enrollment in Nespelem Community
The most common levels of schooling among the 99 students in Nespelem Community are college / undergraduate (40 | 40.4%), elementary school (20 | 20.2%), and nursery / preschool (18 | 18.2%).
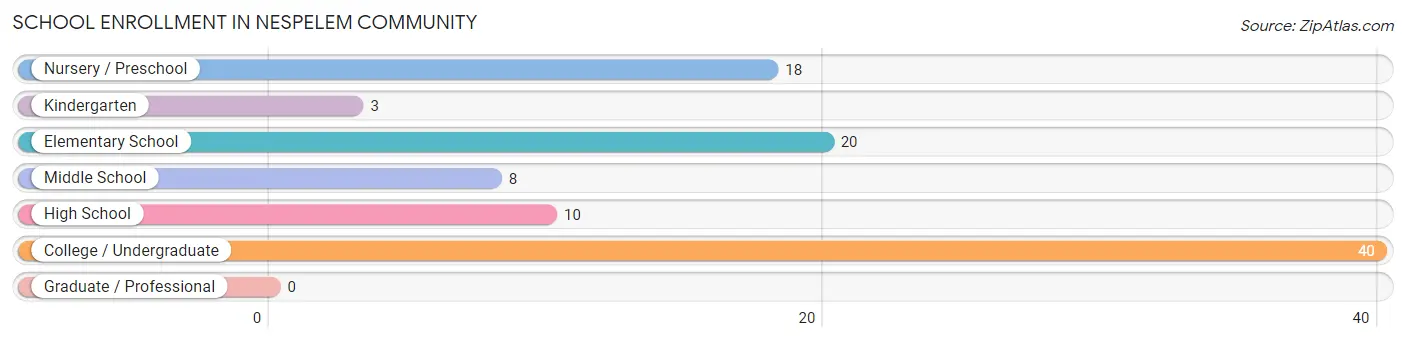
| School Level | # Students | % Students |
| Nursery / Preschool | 18 | 18.2% |
| Kindergarten | 3 | 3.0% |
| Elementary School | 20 | 20.2% |
| Middle School | 8 | 8.1% |
| High School | 10 | 10.1% |
| College / Undergraduate | 40 | 40.4% |
| Graduate / Professional | 0 | 0.0% |
| Total | 99 | 100.0% |
School Enrollment by Age by Funding Source in Nespelem Community
Out of a total of 99 students who are enrolled in schools in Nespelem Community, 2 (2.0%) attend a private institution, while the remaining 97 (98.0%) are enrolled in public schools. The age group of 5 to 9 year old has the highest likelihood of being enrolled in private schools, with 2 (12.5% in the age bracket) enrolled. Conversely, the age group of 3 to 4 year olds has the lowest likelihood of being enrolled in a private school, with 18 (100.0% in the age bracket) attending a public institution.
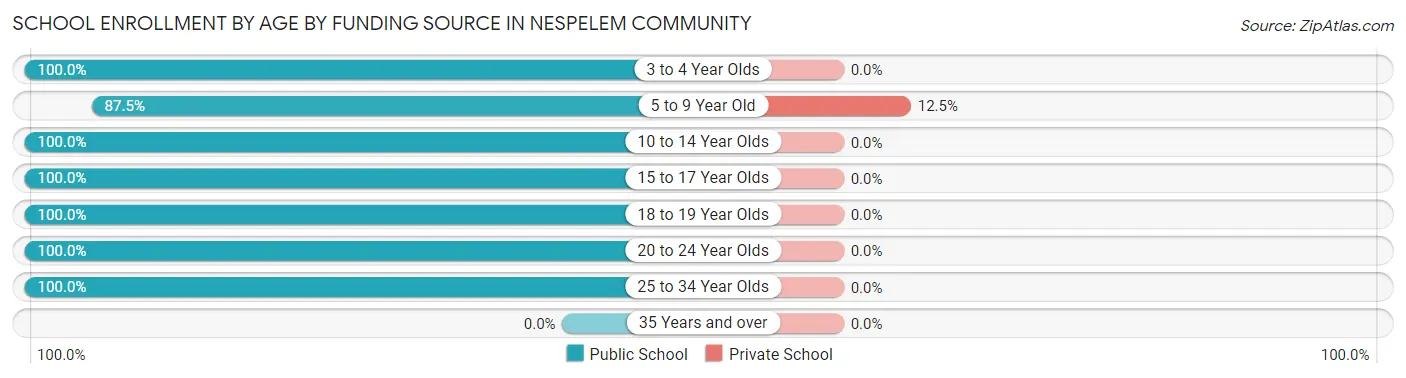
| Age Bracket | Public School | Private School |
| 3 to 4 Year Olds | 18 (100.0%) | 0 (0.0%) |
| 5 to 9 Year Old | 14 (87.5%) | 2 (12.5%) |
| 10 to 14 Year Olds | 15 (100.0%) | 0 (0.0%) |
| 15 to 17 Year Olds | 3 (100.0%) | 0 (0.0%) |
| 18 to 19 Year Olds | 11 (100.0%) | 0 (0.0%) |
| 20 to 24 Year Olds | 20 (100.0%) | 0 (0.0%) |
| 25 to 34 Year Olds | 16 (100.0%) | 0 (0.0%) |
| 35 Years and over | 0 (0.0%) | 0 (0.0%) |
| Total | 97 (98.0%) | 2 (2.0%) |
Educational Attainment by Field of Study in Nespelem Community
Physical & health sciences (18 | 66.7%), business (4 | 14.8%), multidisciplinary studies (3 | 11.1%), and arts & humanities (2 | 7.4%) are the most common fields of study among 27 individuals in Nespelem Community who have obtained a bachelor's degree or higher.
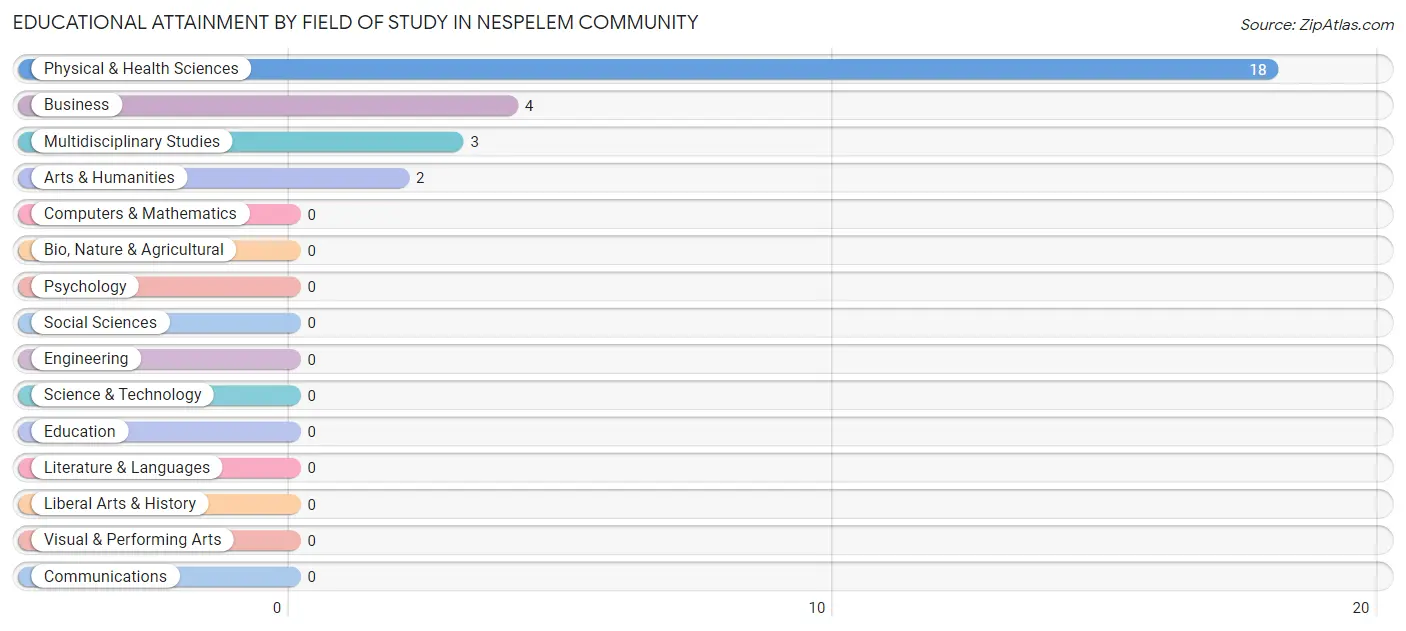
| Field of Study | # Graduates | % Graduates |
| Computers & Mathematics | 0 | 0.0% |
| Bio, Nature & Agricultural | 0 | 0.0% |
| Physical & Health Sciences | 18 | 66.7% |
| Psychology | 0 | 0.0% |
| Social Sciences | 0 | 0.0% |
| Engineering | 0 | 0.0% |
| Multidisciplinary Studies | 3 | 11.1% |
| Science & Technology | 0 | 0.0% |
| Business | 4 | 14.8% |
| Education | 0 | 0.0% |
| Literature & Languages | 0 | 0.0% |
| Liberal Arts & History | 0 | 0.0% |
| Visual & Performing Arts | 0 | 0.0% |
| Communications | 0 | 0.0% |
| Arts & Humanities | 2 | 7.4% |
| Total | 27 | 100.0% |
Transportation & Commute in Nespelem Community
Vehicle Availability by Sex in Nespelem Community
The most prevalent vehicle ownership categories in Nespelem Community are males with 5 or more vehicles (17, accounting for 38.6%) and females with 5 or more vehicles (14, making up 25.8%).
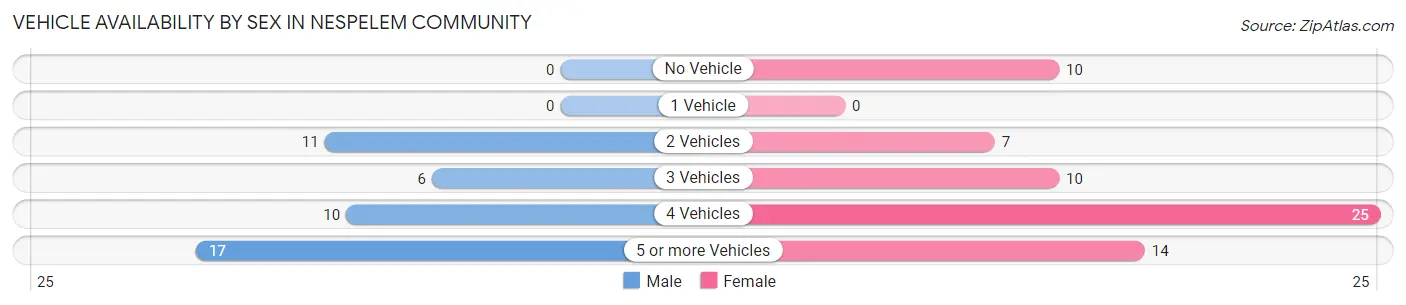
| Vehicles Available | Male | Female |
| No Vehicle | 0 (0.0%) | 10 (15.1%) |
| 1 Vehicle | 0 (0.0%) | 0 (0.0%) |
| 2 Vehicles | 11 (25.0%) | 7 (10.6%) |
| 3 Vehicles | 6 (13.6%) | 10 (15.1%) |
| 4 Vehicles | 10 (22.7%) | 25 (37.9%) |
| 5 or more Vehicles | 17 (38.6%) | 14 (21.2%) |
| Total | 44 (100.0%) | 66 (100.0%) |
Commute Time in Nespelem Community
The most frequently occuring commute durations in Nespelem Community are 5 to 9 minutes (31 commuters, 30.4%), 15 to 19 minutes (24 commuters, 23.5%), and 10 to 14 minutes (20 commuters, 19.6%).
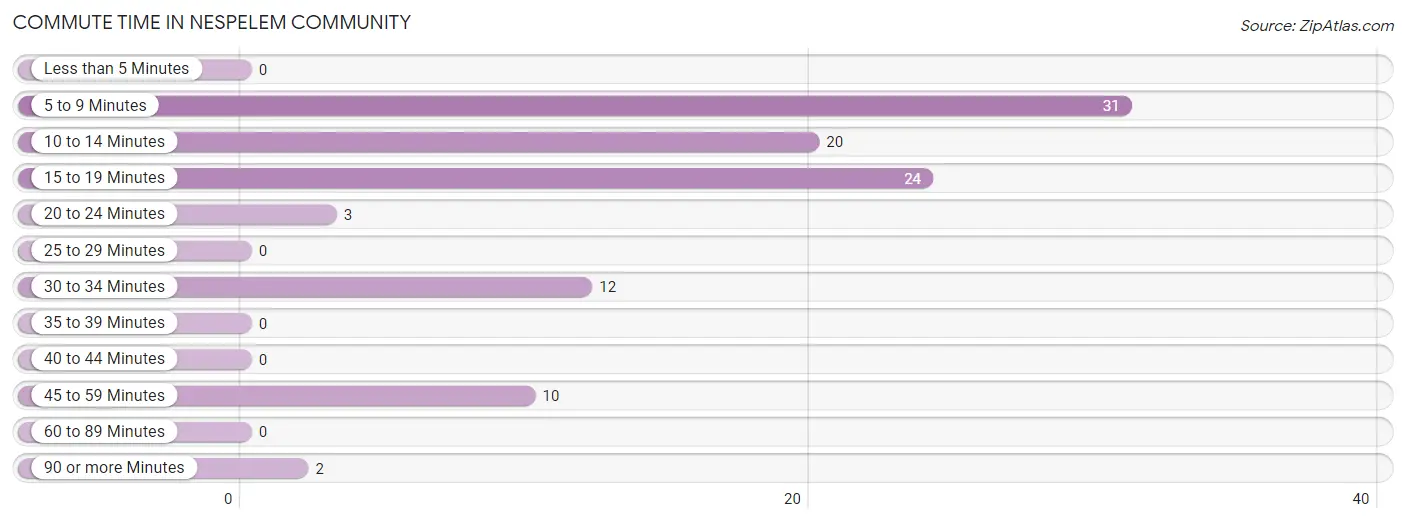
| Commute Time | # Commuters | % Commuters |
| Less than 5 Minutes | 0 | 0.0% |
| 5 to 9 Minutes | 31 | 30.4% |
| 10 to 14 Minutes | 20 | 19.6% |
| 15 to 19 Minutes | 24 | 23.5% |
| 20 to 24 Minutes | 3 | 2.9% |
| 25 to 29 Minutes | 0 | 0.0% |
| 30 to 34 Minutes | 12 | 11.8% |
| 35 to 39 Minutes | 0 | 0.0% |
| 40 to 44 Minutes | 0 | 0.0% |
| 45 to 59 Minutes | 10 | 9.8% |
| 60 to 89 Minutes | 0 | 0.0% |
| 90 or more Minutes | 2 | 2.0% |
Commute Time by Sex in Nespelem Community
The most common commute times in Nespelem Community are 10 to 14 minutes (13 commuters, 29.5%) for males and 5 to 9 minutes (21 commuters, 36.2%) for females.
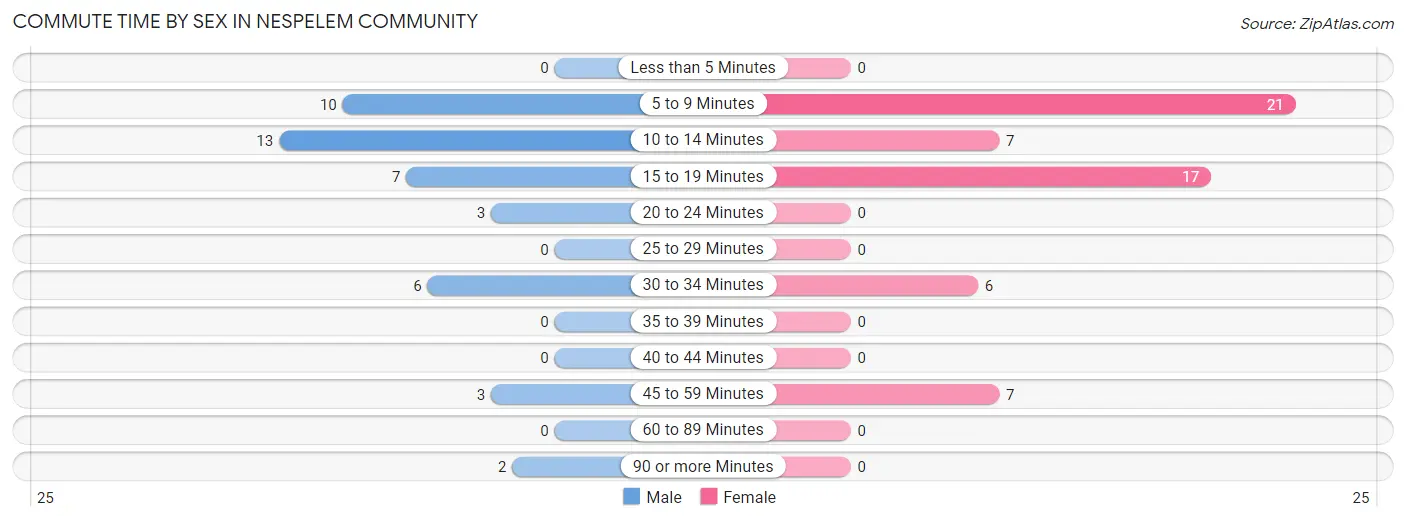
| Commute Time | Male | Female |
| Less than 5 Minutes | 0 (0.0%) | 0 (0.0%) |
| 5 to 9 Minutes | 10 (22.7%) | 21 (36.2%) |
| 10 to 14 Minutes | 13 (29.5%) | 7 (12.1%) |
| 15 to 19 Minutes | 7 (15.9%) | 17 (29.3%) |
| 20 to 24 Minutes | 3 (6.8%) | 0 (0.0%) |
| 25 to 29 Minutes | 0 (0.0%) | 0 (0.0%) |
| 30 to 34 Minutes | 6 (13.6%) | 6 (10.3%) |
| 35 to 39 Minutes | 0 (0.0%) | 0 (0.0%) |
| 40 to 44 Minutes | 0 (0.0%) | 0 (0.0%) |
| 45 to 59 Minutes | 3 (6.8%) | 7 (12.1%) |
| 60 to 89 Minutes | 0 (0.0%) | 0 (0.0%) |
| 90 or more Minutes | 2 (4.5%) | 0 (0.0%) |
Time of Departure to Work by Sex in Nespelem Community
The most frequent times of departure to work in Nespelem Community are 6:30 AM to 6:59 AM (13, 29.5%) for males and 7:00 AM to 7:29 AM (21, 36.2%) for females.
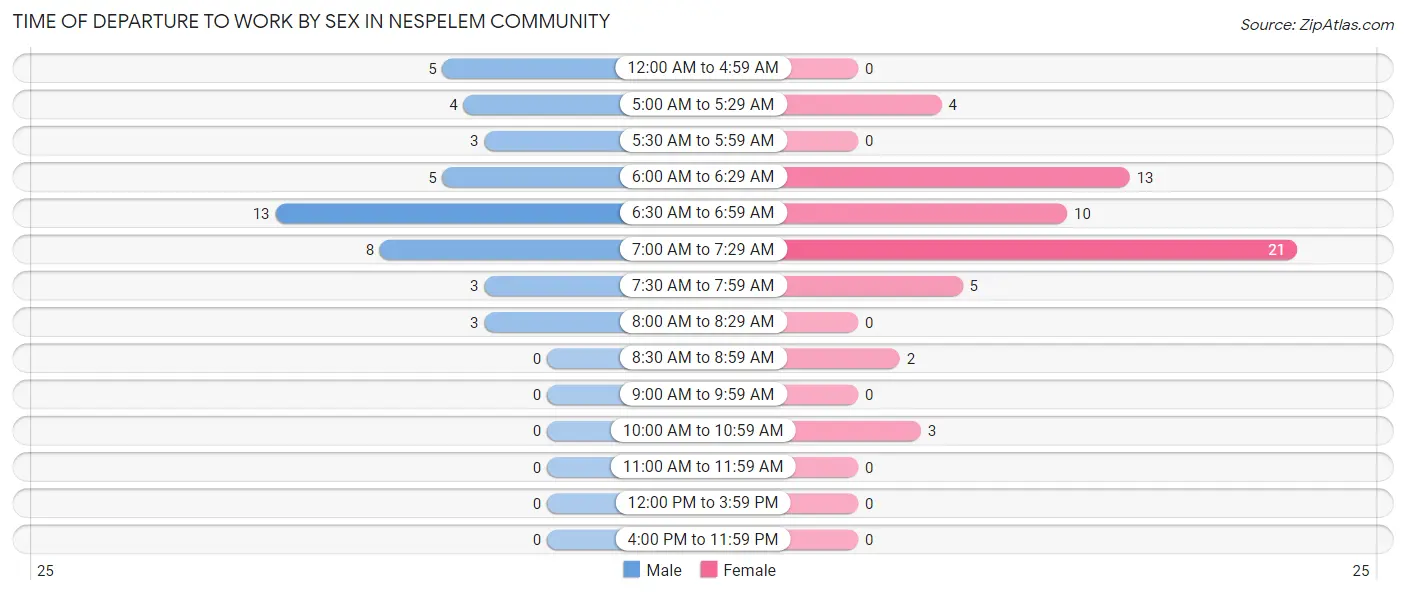
| Time of Departure | Male | Female |
| 12:00 AM to 4:59 AM | 5 (11.4%) | 0 (0.0%) |
| 5:00 AM to 5:29 AM | 4 (9.1%) | 4 (6.9%) |
| 5:30 AM to 5:59 AM | 3 (6.8%) | 0 (0.0%) |
| 6:00 AM to 6:29 AM | 5 (11.4%) | 13 (22.4%) |
| 6:30 AM to 6:59 AM | 13 (29.5%) | 10 (17.2%) |
| 7:00 AM to 7:29 AM | 8 (18.2%) | 21 (36.2%) |
| 7:30 AM to 7:59 AM | 3 (6.8%) | 5 (8.6%) |
| 8:00 AM to 8:29 AM | 3 (6.8%) | 0 (0.0%) |
| 8:30 AM to 8:59 AM | 0 (0.0%) | 2 (3.5%) |
| 9:00 AM to 9:59 AM | 0 (0.0%) | 0 (0.0%) |
| 10:00 AM to 10:59 AM | 0 (0.0%) | 3 (5.2%) |
| 11:00 AM to 11:59 AM | 0 (0.0%) | 0 (0.0%) |
| 12:00 PM to 3:59 PM | 0 (0.0%) | 0 (0.0%) |
| 4:00 PM to 11:59 PM | 0 (0.0%) | 0 (0.0%) |
| Total | 44 (100.0%) | 58 (100.0%) |
Housing Occupancy in Nespelem Community
Occupancy by Ownership in Nespelem Community
Of the total 83 dwellings in Nespelem Community, owner-occupied units account for 73 (87.9%), while renter-occupied units make up 10 (12.0%).
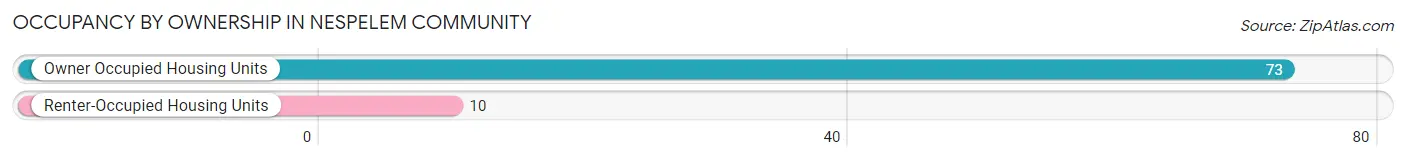
| Occupancy | # Housing Units | % Housing Units |
| Owner Occupied Housing Units | 73 | 87.9% |
| Renter-Occupied Housing Units | 10 | 12.0% |
| Total Occupied Housing Units | 83 | 100.0% |
Occupancy by Household Size in Nespelem Community
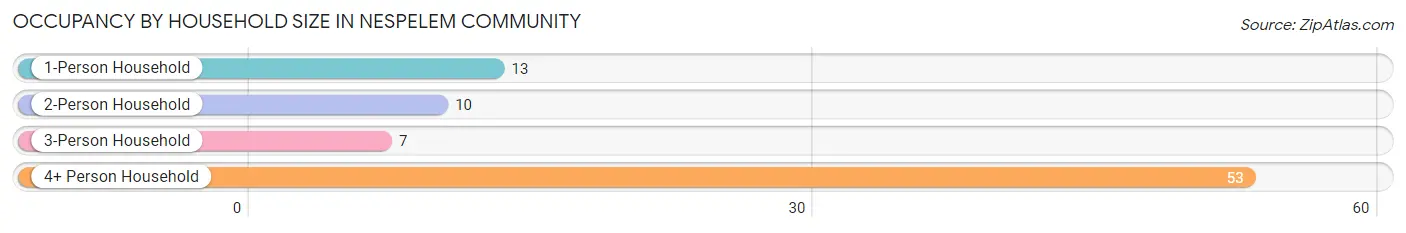
| Household Size | # Housing Units | % Housing Units |
| 1-Person Household | 13 | 15.7% |
| 2-Person Household | 10 | 12.0% |
| 3-Person Household | 7 | 8.4% |
| 4+ Person Household | 53 | 63.9% |
| Total Housing Units | 83 | 100.0% |
Occupancy by Ownership by Household Size in Nespelem Community
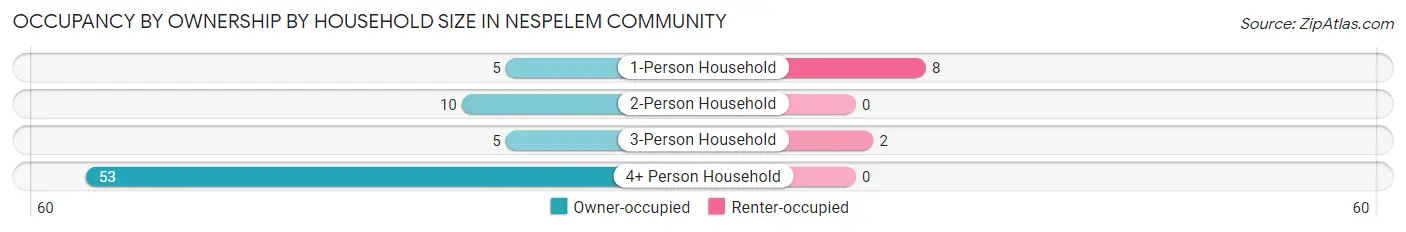
| Household Size | Owner-occupied | Renter-occupied |
| 1-Person Household | 5 (38.5%) | 8 (61.5%) |
| 2-Person Household | 10 (100.0%) | 0 (0.0%) |
| 3-Person Household | 5 (71.4%) | 2 (28.6%) |
| 4+ Person Household | 53 (100.0%) | 0 (0.0%) |
| Total Housing Units | 73 (87.9%) | 10 (12.0%) |
Occupancy by Educational Attainment in Nespelem Community
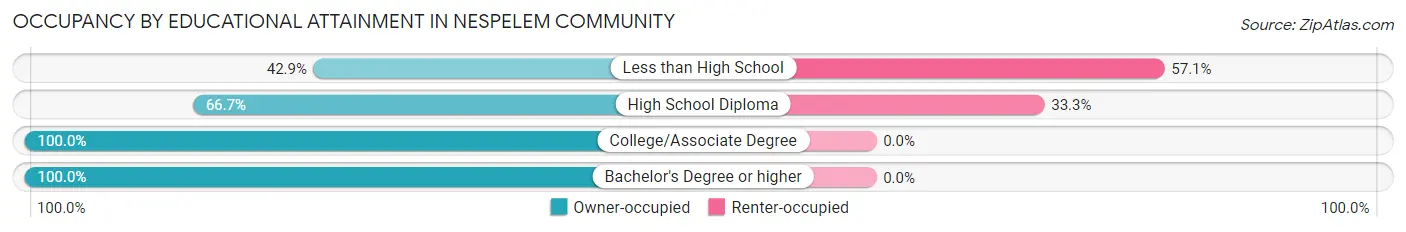
| Household Size | Owner-occupied | Renter-occupied |
| Less than High School | 3 (42.9%) | 4 (57.1%) |
| High School Diploma | 12 (66.7%) | 6 (33.3%) |
| College/Associate Degree | 40 (100.0%) | 0 (0.0%) |
| Bachelor's Degree or higher | 18 (100.0%) | 0 (0.0%) |
Occupancy by Age of Householder in Nespelem Community
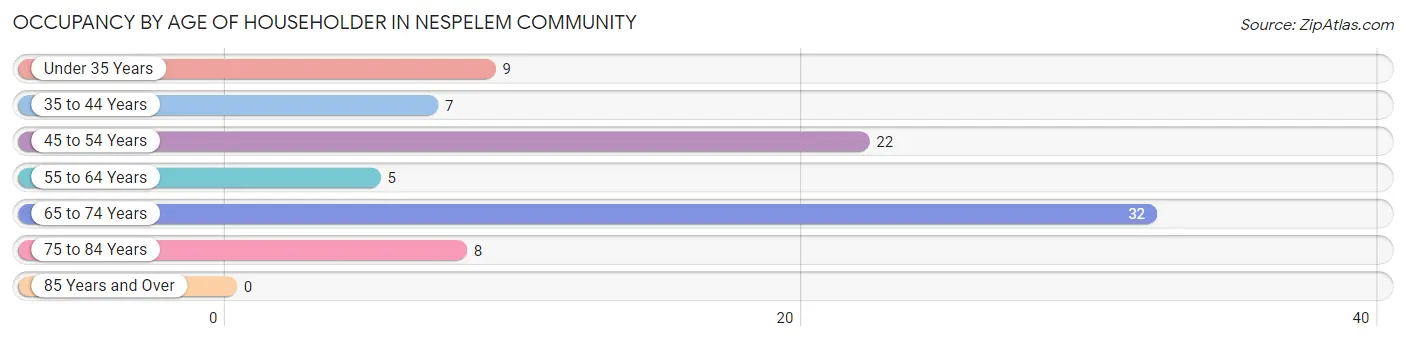
| Age Bracket | # Households | % Households |
| Under 35 Years | 9 | 10.8% |
| 35 to 44 Years | 7 | 8.4% |
| 45 to 54 Years | 22 | 26.5% |
| 55 to 64 Years | 5 | 6.0% |
| 65 to 74 Years | 32 | 38.6% |
| 75 to 84 Years | 8 | 9.6% |
| 85 Years and Over | 0 | 0.0% |
| Total | 83 | 100.0% |
Housing Finances in Nespelem Community
Median Income by Occupancy in Nespelem Community
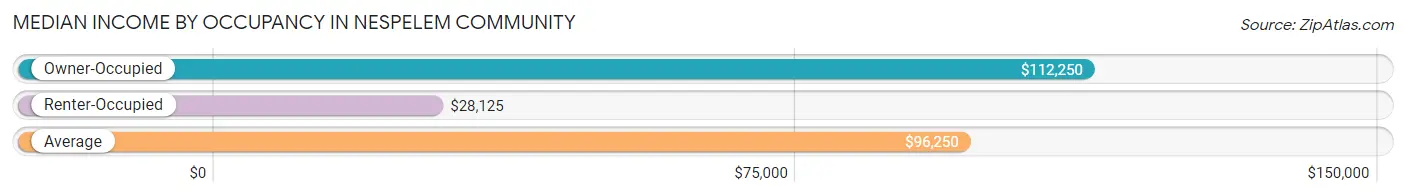
| Occupancy Type | # Households | Median Income |
| Owner-Occupied | 73 (87.9%) | $112,250 |
| Renter-Occupied | 10 (12.0%) | $28,125 |
| Average | 83 (100.0%) | $96,250 |
Occupancy by Householder Income Bracket in Nespelem Community
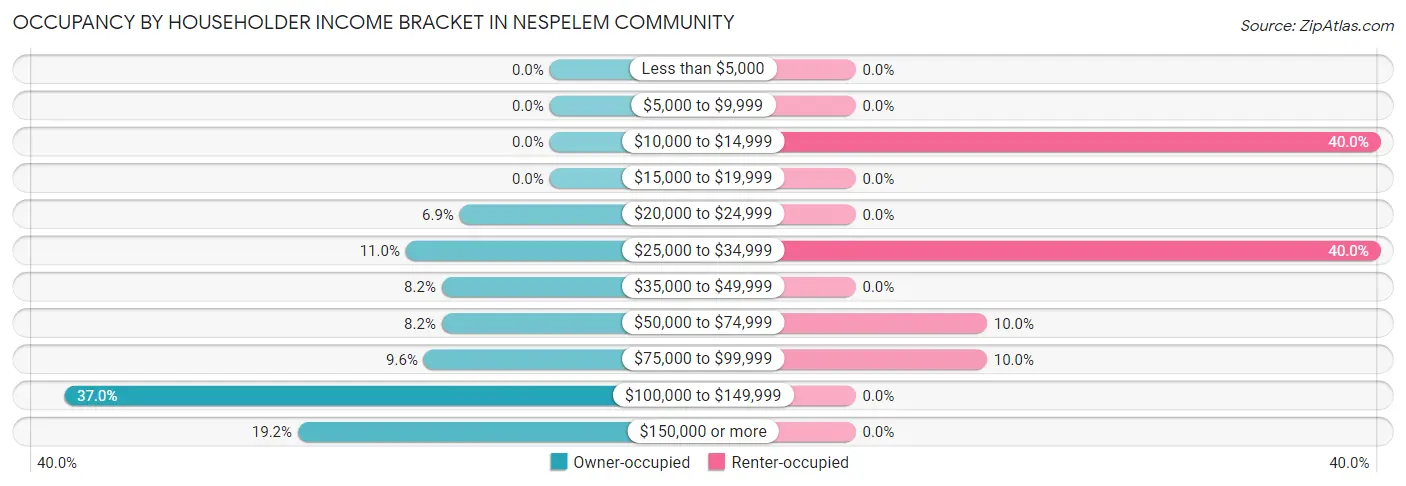
| Income Bracket | Owner-occupied | Renter-occupied |
| Less than $5,000 | 0 (0.0%) | 0 (0.0%) |
| $5,000 to $9,999 | 0 (0.0%) | 0 (0.0%) |
| $10,000 to $14,999 | 0 (0.0%) | 4 (40.0%) |
| $15,000 to $19,999 | 0 (0.0%) | 0 (0.0%) |
| $20,000 to $24,999 | 5 (6.9%) | 0 (0.0%) |
| $25,000 to $34,999 | 8 (11.0%) | 4 (40.0%) |
| $35,000 to $49,999 | 6 (8.2%) | 0 (0.0%) |
| $50,000 to $74,999 | 6 (8.2%) | 1 (10.0%) |
| $75,000 to $99,999 | 7 (9.6%) | 1 (10.0%) |
| $100,000 to $149,999 | 27 (37.0%) | 0 (0.0%) |
| $150,000 or more | 14 (19.2%) | 0 (0.0%) |
| Total | 73 (100.0%) | 10 (100.0%) |
Monthly Housing Cost Tiers in Nespelem Community
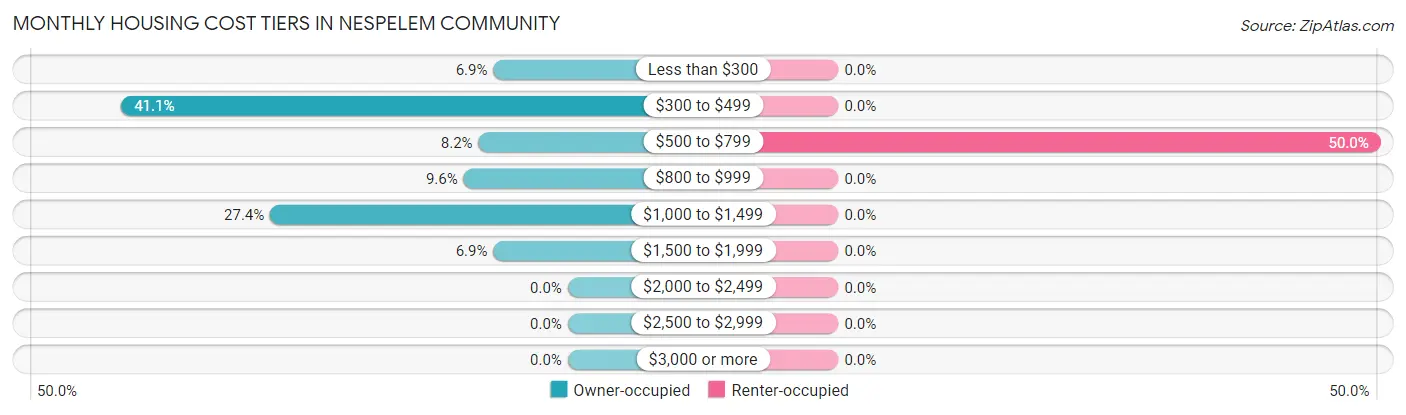
| Monthly Cost | Owner-occupied | Renter-occupied |
| Less than $300 | 5 (6.9%) | 0 (0.0%) |
| $300 to $499 | 30 (41.1%) | 0 (0.0%) |
| $500 to $799 | 6 (8.2%) | 5 (50.0%) |
| $800 to $999 | 7 (9.6%) | 0 (0.0%) |
| $1,000 to $1,499 | 20 (27.4%) | 0 (0.0%) |
| $1,500 to $1,999 | 5 (6.9%) | 0 (0.0%) |
| $2,000 to $2,499 | 0 (0.0%) | 0 (0.0%) |
| $2,500 to $2,999 | 0 (0.0%) | 0 (0.0%) |
| $3,000 or more | 0 (0.0%) | 0 (0.0%) |
| Total | 73 (100.0%) | 10 (100.0%) |
Physical Housing Characteristics in Nespelem Community
Housing Structures in Nespelem Community
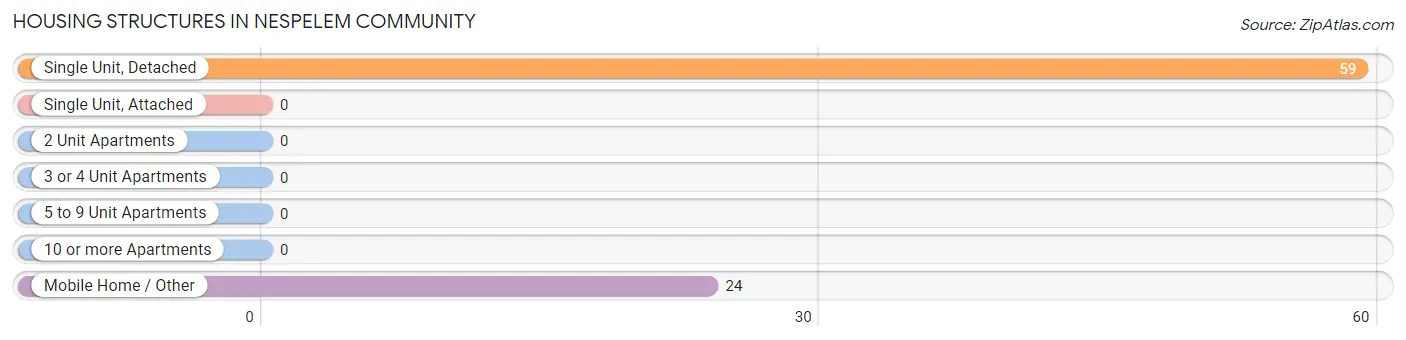
| Structure Type | # Housing Units | % Housing Units |
| Single Unit, Detached | 59 | 71.1% |
| Single Unit, Attached | 0 | 0.0% |
| 2 Unit Apartments | 0 | 0.0% |
| 3 or 4 Unit Apartments | 0 | 0.0% |
| 5 to 9 Unit Apartments | 0 | 0.0% |
| 10 or more Apartments | 0 | 0.0% |
| Mobile Home / Other | 24 | 28.9% |
| Total | 83 | 100.0% |
Housing Structures by Occupancy in Nespelem Community
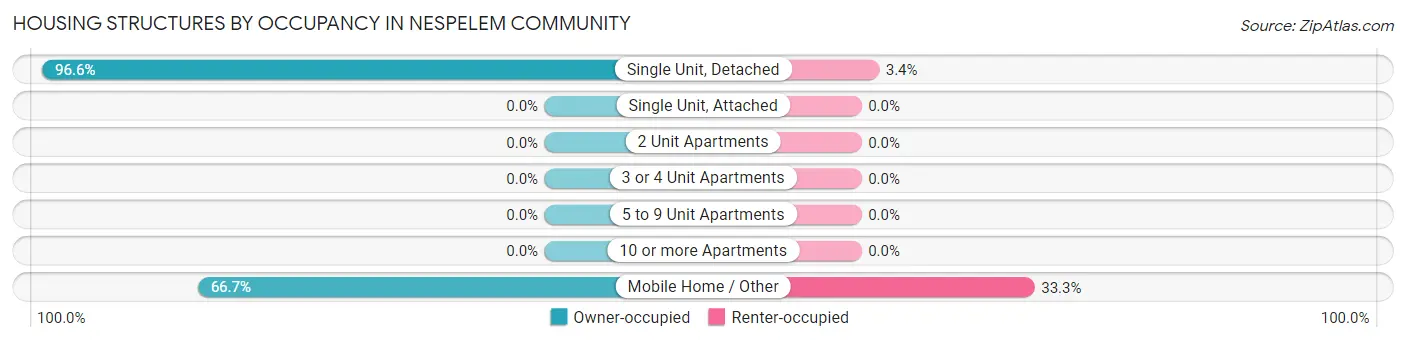
| Structure Type | Owner-occupied | Renter-occupied |
| Single Unit, Detached | 57 (96.6%) | 2 (3.4%) |
| Single Unit, Attached | 0 (0.0%) | 0 (0.0%) |
| 2 Unit Apartments | 0 (0.0%) | 0 (0.0%) |
| 3 or 4 Unit Apartments | 0 (0.0%) | 0 (0.0%) |
| 5 to 9 Unit Apartments | 0 (0.0%) | 0 (0.0%) |
| 10 or more Apartments | 0 (0.0%) | 0 (0.0%) |
| Mobile Home / Other | 16 (66.7%) | 8 (33.3%) |
| Total | 73 (87.9%) | 10 (12.0%) |
Housing Structures by Number of Rooms in Nespelem Community
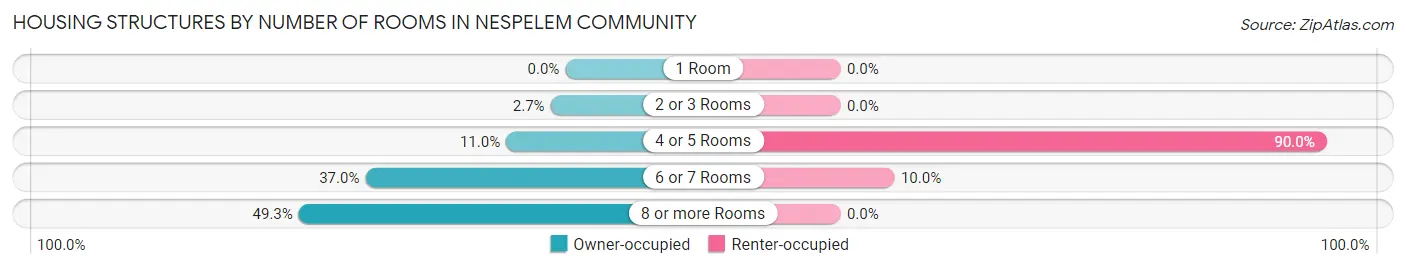
| Number of Rooms | Owner-occupied | Renter-occupied |
| 1 Room | 0 (0.0%) | 0 (0.0%) |
| 2 or 3 Rooms | 2 (2.7%) | 0 (0.0%) |
| 4 or 5 Rooms | 8 (11.0%) | 9 (90.0%) |
| 6 or 7 Rooms | 27 (37.0%) | 1 (10.0%) |
| 8 or more Rooms | 36 (49.3%) | 0 (0.0%) |
| Total | 73 (100.0%) | 10 (100.0%) |
Housing Structure by Heating Type in Nespelem Community
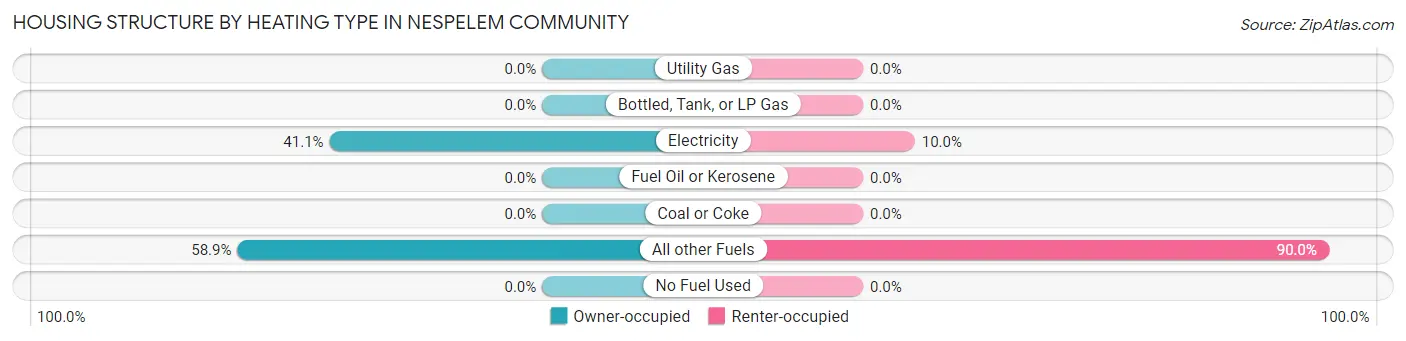
| Heating Type | Owner-occupied | Renter-occupied |
| Utility Gas | 0 (0.0%) | 0 (0.0%) |
| Bottled, Tank, or LP Gas | 0 (0.0%) | 0 (0.0%) |
| Electricity | 30 (41.1%) | 1 (10.0%) |
| Fuel Oil or Kerosene | 0 (0.0%) | 0 (0.0%) |
| Coal or Coke | 0 (0.0%) | 0 (0.0%) |
| All other Fuels | 43 (58.9%) | 9 (90.0%) |
| No Fuel Used | 0 (0.0%) | 0 (0.0%) |
| Total | 73 (100.0%) | 10 (100.0%) |
Household Vehicle Usage in Nespelem Community
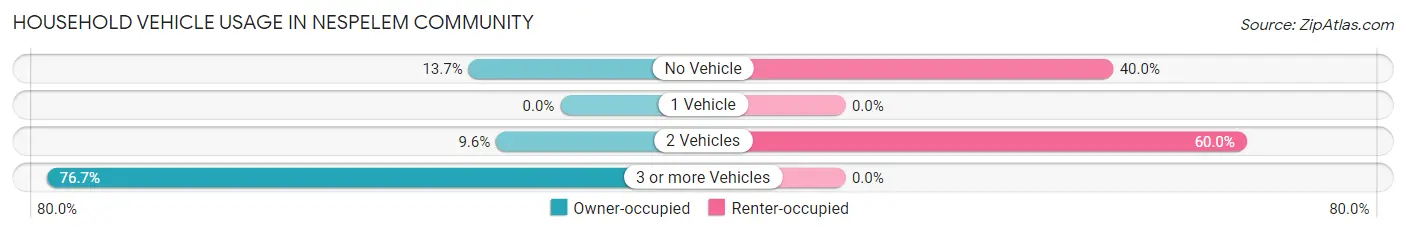
| Vehicles per Household | Owner-occupied | Renter-occupied |
| No Vehicle | 10 (13.7%) | 4 (40.0%) |
| 1 Vehicle | 0 (0.0%) | 0 (0.0%) |
| 2 Vehicles | 7 (9.6%) | 6 (60.0%) |
| 3 or more Vehicles | 56 (76.7%) | 0 (0.0%) |
| Total | 73 (100.0%) | 10 (100.0%) |
Real Estate & Mortgages in Nespelem Community
Real Estate and Mortgage Overview in Nespelem Community
| Characteristic | Without Mortgage | With Mortgage |
| Housing Units | 19 | 54 |
| Median Property Value | $177,100 | $152,500 |
| Median Household Income | $48,542 | $12 |
| Monthly Housing Costs | $338 | $0 |
| Real Estate Taxes | - | - |
Property Value by Mortgage Status in Nespelem Community
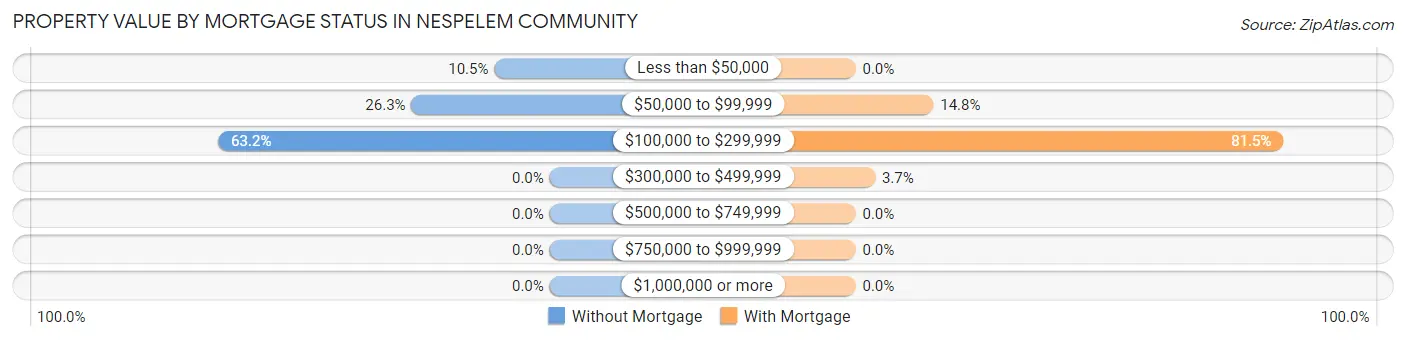
| Property Value | Without Mortgage | With Mortgage |
| Less than $50,000 | 2 (10.5%) | 0 (0.0%) |
| $50,000 to $99,999 | 5 (26.3%) | 8 (14.8%) |
| $100,000 to $299,999 | 12 (63.2%) | 44 (81.5%) |
| $300,000 to $499,999 | 0 (0.0%) | 2 (3.7%) |
| $500,000 to $749,999 | 0 (0.0%) | 0 (0.0%) |
| $750,000 to $999,999 | 0 (0.0%) | 0 (0.0%) |
| $1,000,000 or more | 0 (0.0%) | 0 (0.0%) |
| Total | 19 (100.0%) | 54 (100.0%) |
Household Income by Mortgage Status in Nespelem Community
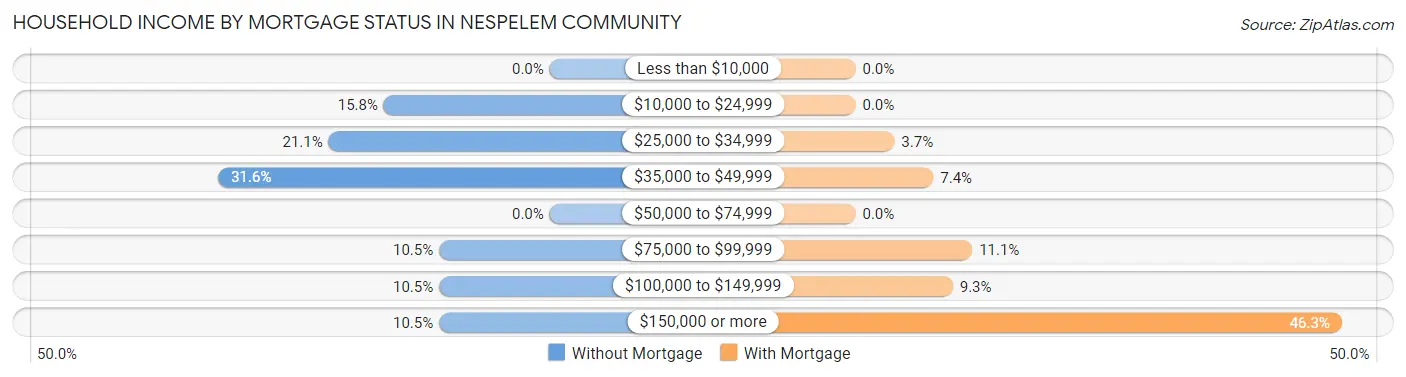
| Household Income | Without Mortgage | With Mortgage |
| Less than $10,000 | 0 (0.0%) | 0 (0.0%) |
| $10,000 to $24,999 | 3 (15.8%) | 0 (0.0%) |
| $25,000 to $34,999 | 4 (21.0%) | 2 (3.7%) |
| $35,000 to $49,999 | 6 (31.6%) | 4 (7.4%) |
| $50,000 to $74,999 | 0 (0.0%) | 0 (0.0%) |
| $75,000 to $99,999 | 2 (10.5%) | 6 (11.1%) |
| $100,000 to $149,999 | 2 (10.5%) | 5 (9.3%) |
| $150,000 or more | 2 (10.5%) | 25 (46.3%) |
| Total | 19 (100.0%) | 54 (100.0%) |
Property Value to Household Income Ratio in Nespelem Community
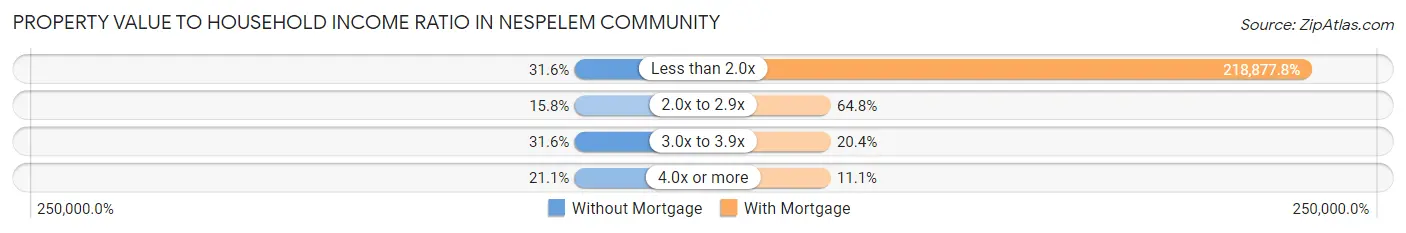
| Value-to-Income Ratio | Without Mortgage | With Mortgage |
| Less than 2.0x | 6 (31.6%) | 118,194 (218,877.8%) |
| 2.0x to 2.9x | 3 (15.8%) | 35 (64.8%) |
| 3.0x to 3.9x | 6 (31.6%) | 11 (20.4%) |
| 4.0x or more | 4 (21.0%) | 6 (11.1%) |
| Total | 19 (100.0%) | 54 (100.0%) |
Real Estate Taxes by Mortgage Status in Nespelem Community
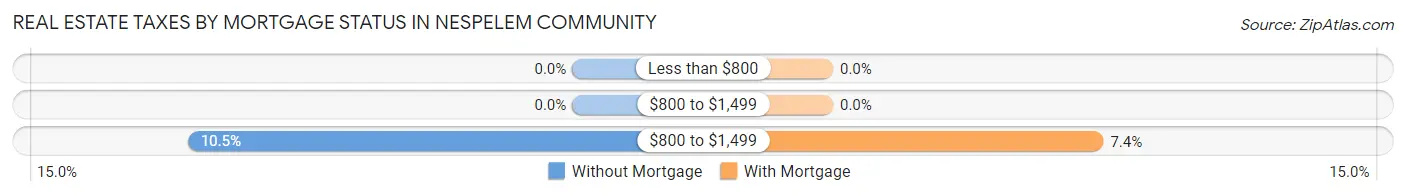
| Property Taxes | Without Mortgage | With Mortgage |
| Less than $800 | 0 (0.0%) | 0 (0.0%) |
| $800 to $1,499 | 0 (0.0%) | 0 (0.0%) |
| $800 to $1,499 | 2 (10.5%) | 4 (7.4%) |
| Total | 19 (100.0%) | 54 (100.0%) |
Health & Disability in Nespelem Community
Health Insurance Coverage by Age in Nespelem Community
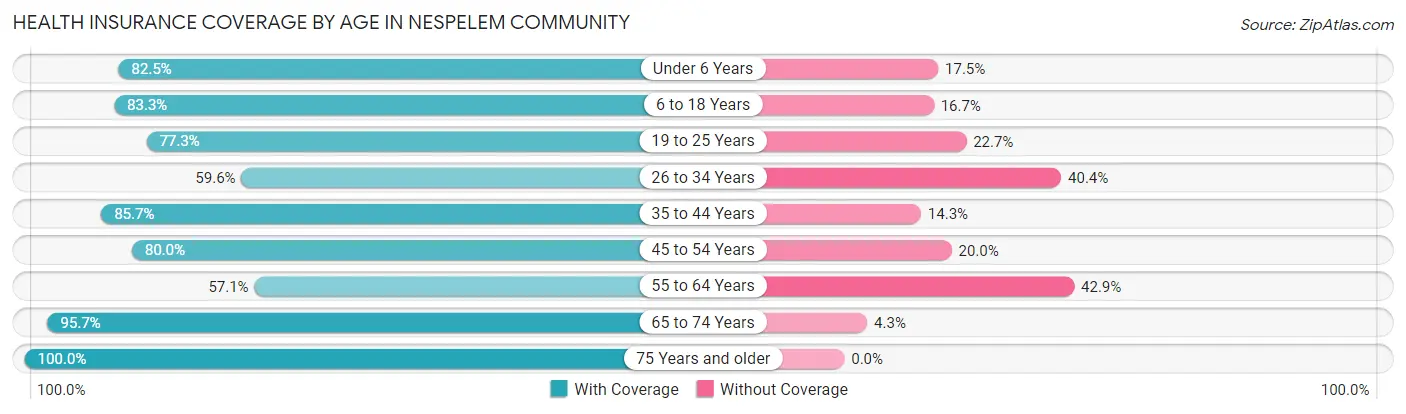
| Age Bracket | With Coverage | Without Coverage |
| Under 6 Years | 33 (82.5%) | 7 (17.5%) |
| 6 to 18 Years | 35 (83.3%) | 7 (16.7%) |
| 19 to 25 Years | 34 (77.3%) | 10 (22.7%) |
| 26 to 34 Years | 28 (59.6%) | 19 (40.4%) |
| 35 to 44 Years | 18 (85.7%) | 3 (14.3%) |
| 45 to 54 Years | 28 (80.0%) | 7 (20.0%) |
| 55 to 64 Years | 12 (57.1%) | 9 (42.9%) |
| 65 to 74 Years | 45 (95.7%) | 2 (4.3%) |
| 75 Years and older | 8 (100.0%) | 0 (0.0%) |
| Total | 241 (79.0%) | 64 (21.0%) |
Health Insurance Coverage by Citizenship Status in Nespelem Community
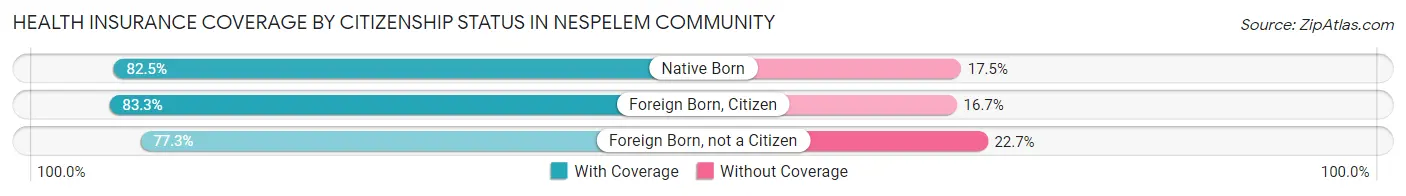
| Citizenship Status | With Coverage | Without Coverage |
| Native Born | 33 (82.5%) | 7 (17.5%) |
| Foreign Born, Citizen | 35 (83.3%) | 7 (16.7%) |
| Foreign Born, not a Citizen | 34 (77.3%) | 10 (22.7%) |
Health Insurance Coverage by Household Income in Nespelem Community
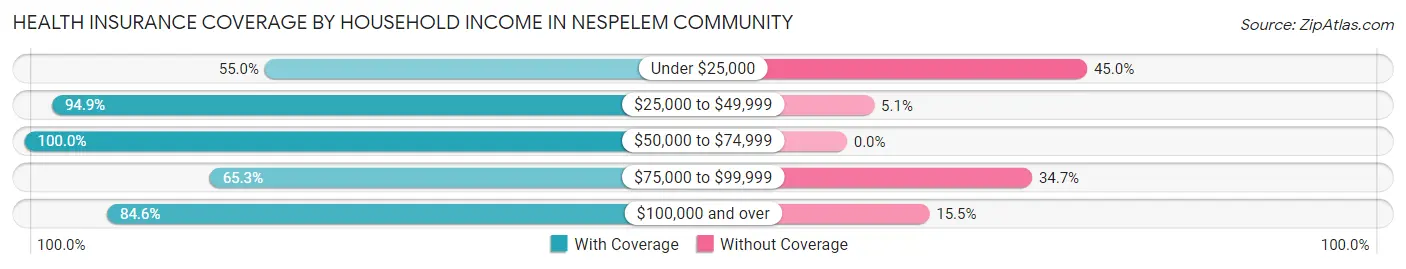
| Household Income | With Coverage | Without Coverage |
| Under $25,000 | 11 (55.0%) | 9 (45.0%) |
| $25,000 to $49,999 | 37 (94.9%) | 2 (5.1%) |
| $50,000 to $74,999 | 25 (100.0%) | 0 (0.0%) |
| $75,000 to $99,999 | 64 (65.3%) | 34 (34.7%) |
| $100,000 and over | 104 (84.6%) | 19 (15.4%) |
Public vs Private Health Insurance Coverage by Age in Nespelem Community
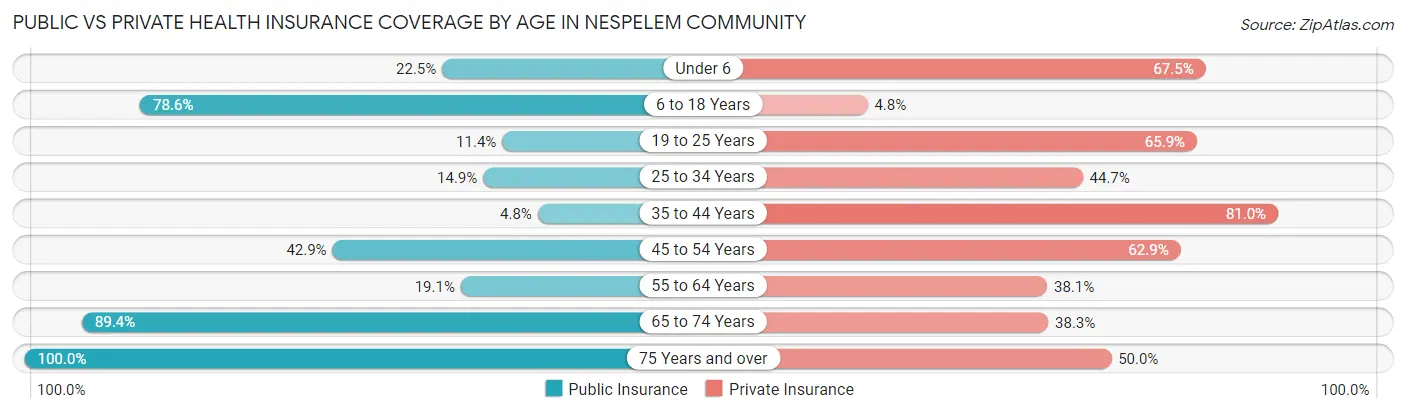
| Age Bracket | Public Insurance | Private Insurance |
| Under 6 | 9 (22.5%) | 27 (67.5%) |
| 6 to 18 Years | 33 (78.6%) | 2 (4.8%) |
| 19 to 25 Years | 5 (11.4%) | 29 (65.9%) |
| 25 to 34 Years | 7 (14.9%) | 21 (44.7%) |
| 35 to 44 Years | 1 (4.8%) | 17 (80.9%) |
| 45 to 54 Years | 15 (42.9%) | 22 (62.9%) |
| 55 to 64 Years | 4 (19.1%) | 8 (38.1%) |
| 65 to 74 Years | 42 (89.4%) | 18 (38.3%) |
| 75 Years and over | 8 (100.0%) | 4 (50.0%) |
| Total | 124 (40.7%) | 148 (48.5%) |
Disability Status by Sex by Age in Nespelem Community
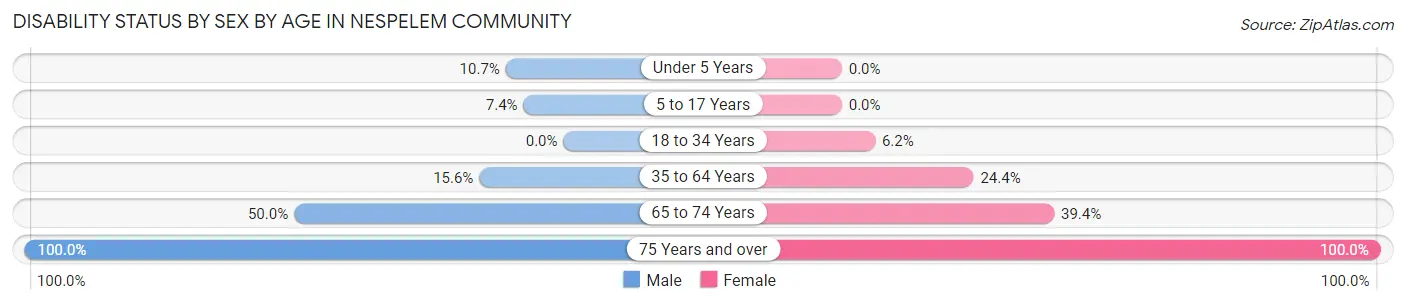
| Age Bracket | Male | Female |
| Under 5 Years | 3 (10.7%) | 0 (0.0%) |
| 5 to 17 Years | 2 (7.4%) | 0 (0.0%) |
| 18 to 34 Years | 0 (0.0%) | 4 (6.1%) |
| 35 to 64 Years | 5 (15.6%) | 11 (24.4%) |
| 65 to 74 Years | 7 (50.0%) | 13 (39.4%) |
| 75 Years and over | 4 (100.0%) | 4 (100.0%) |
Disability Class by Sex by Age in Nespelem Community
Disability Class: Hearing Difficulty
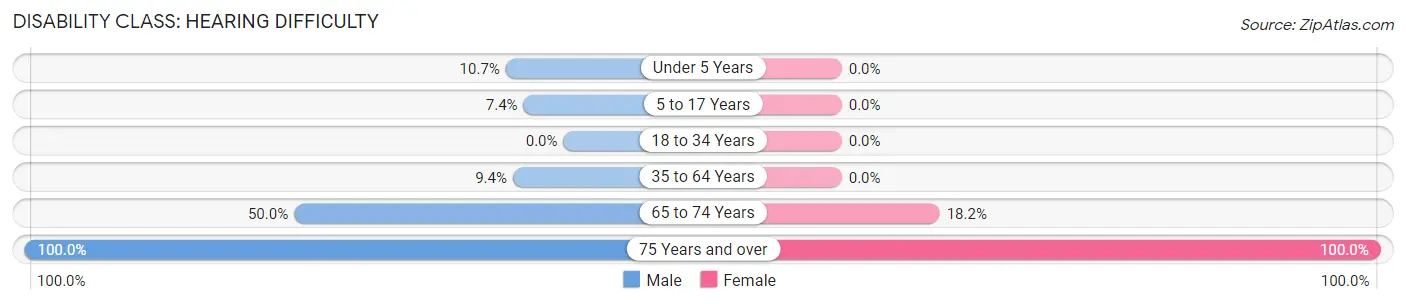
| Age Bracket | Male | Female |
| Under 5 Years | 3 (10.7%) | 0 (0.0%) |
| 5 to 17 Years | 2 (7.4%) | 0 (0.0%) |
| 18 to 34 Years | 0 (0.0%) | 0 (0.0%) |
| 35 to 64 Years | 3 (9.4%) | 0 (0.0%) |
| 65 to 74 Years | 7 (50.0%) | 6 (18.2%) |
| 75 Years and over | 4 (100.0%) | 4 (100.0%) |
Disability Class: Vision Difficulty
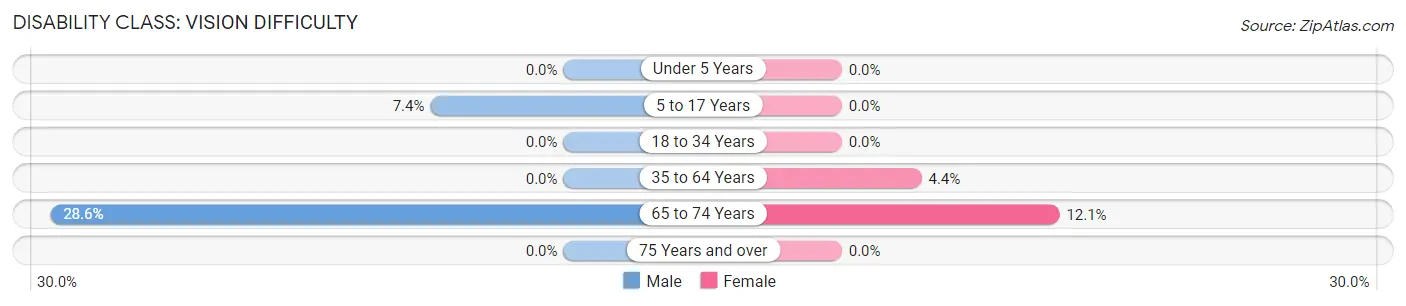
| Age Bracket | Male | Female |
| Under 5 Years | 0 (0.0%) | 0 (0.0%) |
| 5 to 17 Years | 2 (7.4%) | 0 (0.0%) |
| 18 to 34 Years | 0 (0.0%) | 0 (0.0%) |
| 35 to 64 Years | 0 (0.0%) | 2 (4.4%) |
| 65 to 74 Years | 4 (28.6%) | 4 (12.1%) |
| 75 Years and over | 0 (0.0%) | 0 (0.0%) |
Disability Class: Cognitive Difficulty
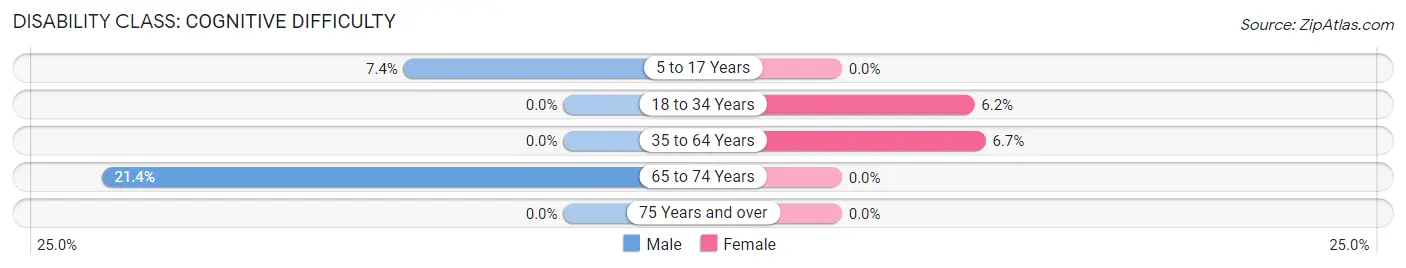
| Age Bracket | Male | Female |
| 5 to 17 Years | 2 (7.4%) | 0 (0.0%) |
| 18 to 34 Years | 0 (0.0%) | 4 (6.1%) |
| 35 to 64 Years | 0 (0.0%) | 3 (6.7%) |
| 65 to 74 Years | 3 (21.4%) | 0 (0.0%) |
| 75 Years and over | 0 (0.0%) | 0 (0.0%) |
Disability Class: Ambulatory Difficulty
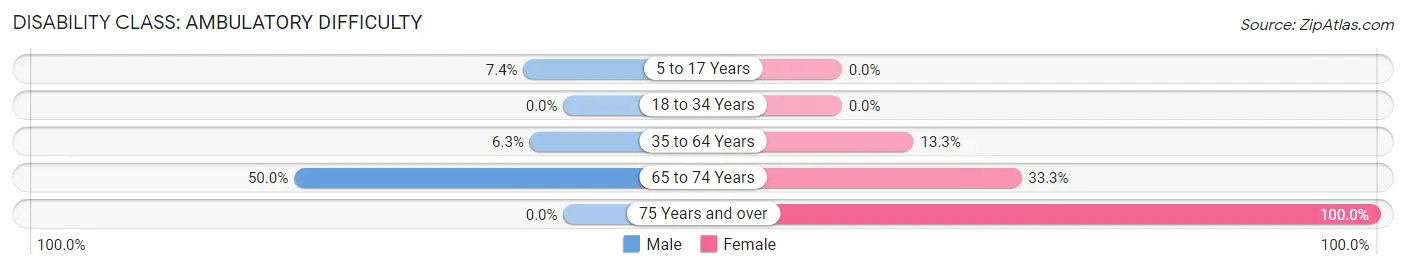
| Age Bracket | Male | Female |
| 5 to 17 Years | 2 (7.4%) | 0 (0.0%) |
| 18 to 34 Years | 0 (0.0%) | 0 (0.0%) |
| 35 to 64 Years | 2 (6.2%) | 6 (13.3%) |
| 65 to 74 Years | 7 (50.0%) | 11 (33.3%) |
| 75 Years and over | 0 (0.0%) | 4 (100.0%) |
Disability Class: Self-Care Difficulty
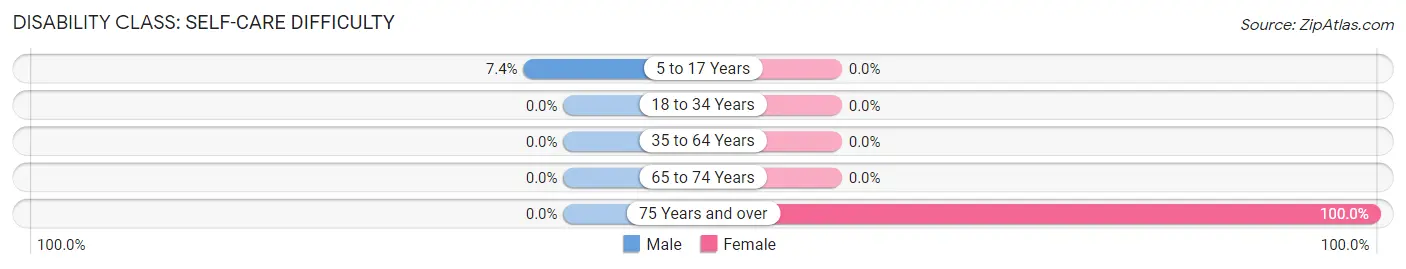
| Age Bracket | Male | Female |
| 5 to 17 Years | 2 (7.4%) | 0 (0.0%) |
| 18 to 34 Years | 0 (0.0%) | 0 (0.0%) |
| 35 to 64 Years | 0 (0.0%) | 0 (0.0%) |
| 65 to 74 Years | 0 (0.0%) | 0 (0.0%) |
| 75 Years and over | 0 (0.0%) | 4 (100.0%) |
Technology Access in Nespelem Community
Computing Device Access in Nespelem Community
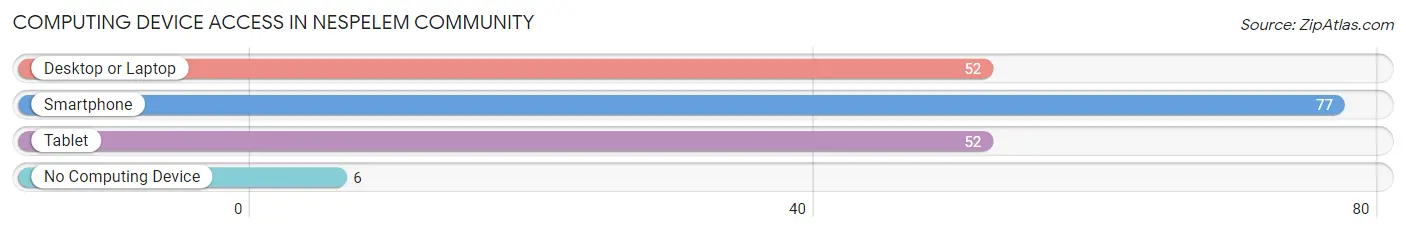
| Device Type | # Households | % Households |
| Desktop or Laptop | 52 | 62.6% |
| Smartphone | 77 | 92.8% |
| Tablet | 52 | 62.6% |
| No Computing Device | 6 | 7.2% |
| Total | 83 | 100.0% |
Internet Access in Nespelem Community
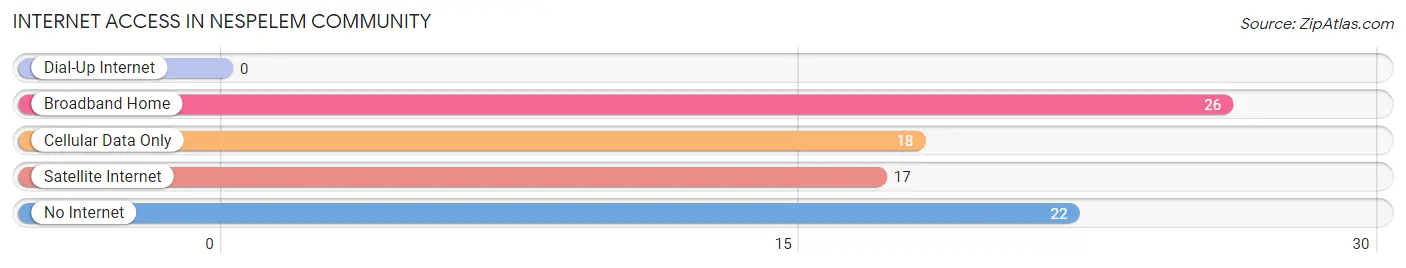
| Internet Type | # Households | % Households |
| Dial-Up Internet | 0 | 0.0% |
| Broadband Home | 26 | 31.3% |
| Cellular Data Only | 18 | 21.7% |
| Satellite Internet | 17 | 20.5% |
| No Internet | 22 | 26.5% |
| Total | 83 | 100.0% |
Nespelem Community Summary
Nespelem is a small unincorporated community located in the Colville Indian Reservation in Okanogan County, Washington. It is situated on the banks of the Nespelem River, a tributary of the Columbia River. The community is home to the Confederated Tribes of the Colville Reservation, a federally recognized Native American tribe.
History
The Nespelem area has been inhabited by Native Americans for thousands of years. The area was originally inhabited by the Sanpoil and Nespelem tribes, who were part of the Salishan-speaking peoples. The area was later inhabited by the Colville tribe, who were part of the Plateau culture.
The first non-Native American settlers arrived in the area in the late 1800s. The town of Nespelem was established in 1902 and was named after the Nespelem River. The town was originally a trading post and was used as a stopping point for travelers.
In the early 1900s, the Colville tribe was relocated to the Nespelem area. The tribe was granted a reservation in the area in 1914, and the town of Nespelem became the center of the reservation.
Geography
Nespelem is located in the Colville Indian Reservation in Okanogan County, Washington. The town is situated on the banks of the Nespelem River, a tributary of the Columbia River. The town is located in a semi-arid region of the state, with an average annual precipitation of just over 10 inches.
The town is located in a valley surrounded by rolling hills and mountains. The area is home to a variety of wildlife, including deer, elk, bear, and cougar.
Economy
The economy of Nespelem is largely based on agriculture and tourism. The Colville tribe operates a number of businesses in the area, including a casino, a hotel, and a golf course. The tribe also operates a number of agricultural businesses, including a cattle ranch and a fruit orchard.
The town is also home to a number of small businesses, including restaurants, stores, and gas stations. The town is also home to a number of art galleries and craft stores.
Demographics
As of the 2010 census, the population of Nespelem was 1,039. The population is largely Native American, with the Colville tribe making up the majority of the population. The median household income in the town is $25,000, and the median age is 33.
Conclusion
Nespelem is a small unincorporated community located in the Colville Indian Reservation in Okanogan County, Washington. The town has a long history of Native American habitation, and was established in 1902. The town is situated on the banks of the Nespelem River, and is home to the Confederated Tribes of the Colville Reservation. The economy of Nespelem is largely based on agriculture and tourism, and the population is largely Native American.
Common Questions
What is Per Capita Income in Nespelem Community?
Per Capita income in Nespelem Community is $24,568.
What is the Median Family Income in Nespelem Community?
Median Family Income in Nespelem Community is $112,639.
What is the Median Household income in Nespelem Community?
Median Household Income in Nespelem Community is $96,250.
What is Inequality or Gini Index in Nespelem Community?
Inequality or Gini Index in Nespelem Community is 0.39.
What is the Total Population of Nespelem Community?
Total Population of Nespelem Community is 309.
What is the Total Male Population of Nespelem Community?
Total Male Population of Nespelem Community is 146.
What is the Total Female Population of Nespelem Community?
Total Female Population of Nespelem Community is 163.
What is the Ratio of Males per 100 Females in Nespelem Community?
There are 89.57 Males per 100 Females in Nespelem Community.
What is the Ratio of Females per 100 Males in Nespelem Community?
There are 111.64 Females per 100 Males in Nespelem Community.
What is the Median Population Age in Nespelem Community?
Median Population Age in Nespelem Community is 29.0 Years.
What is the Average Family Size in Nespelem Community
Average Family Size in Nespelem Community is 4.1 People.
What is the Average Household Size in Nespelem Community
Average Household Size in Nespelem Community is 3.7 People.
How Large is the Labor Force in Nespelem Community?
There are 123 People in the Labor Forcein in Nespelem Community.
What is the Percentage of People in the Labor Force in Nespelem Community?
51.0% of People are in the Labor Force in Nespelem Community.
What is the Unemployment Rate in Nespelem Community?
Unemployment Rate in Nespelem Community is 10.6%.