Zip Codes with the Highest Percentage of Population Employed in Security & Protection in Seattle, WA
RELATED REPORTS & OPTIONS
Security & Protection
Seattle
Compare Zip Codes
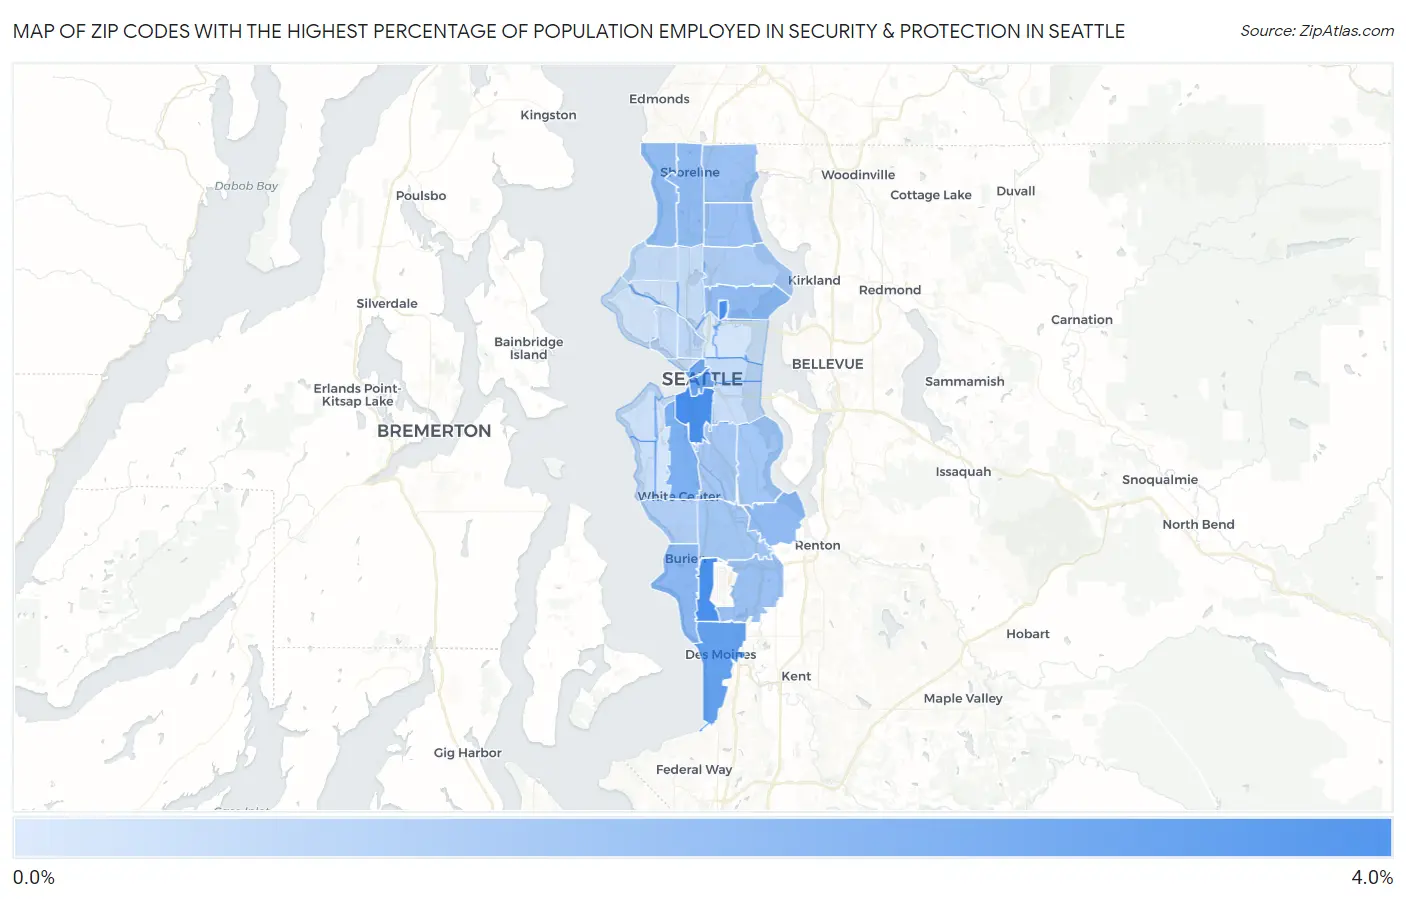
Map of Zip Codes with the Highest Percentage of Population Employed in Security & Protection in Seattle
0.065%
3.4%
Zip Codes with the Highest Percentage of Population Employed in Security & Protection in Seattle, WA
| Zip Code | % Employed | vs State | vs National | |
| 1. | 98195 | 3.4% | 1.8%(+1.57)#94 | 2.1%(+1.24)#5,992 |
| 2. | 98148 | 3.3% | 1.8%(+1.50)#99 | 2.1%(+1.16)#6,205 |
| 3. | 98134 | 3.3% | 1.8%(+1.50)#100 | 2.1%(+1.16)#6,209 |
| 4. | 98198 | 2.7% | 1.8%(+0.923)#144 | 2.1%(+0.588)#8,375 |
| 5. | 98104 | 2.6% | 1.8%(+0.792)#155 | 2.1%(+0.457)#8,983 |
| 6. | 98101 | 2.4% | 1.8%(+0.573)#176 | 2.1%(+0.238)#10,117 |
| 7. | 98106 | 2.2% | 1.8%(+0.357)#205 | 2.1%(+0.022)#11,444 |
| 8. | 98166 | 1.8% | 1.8%(+0.020)#257 | 2.1%(-0.315)#13,694 |
| 9. | 98178 | 1.8% | 1.8%(-0.056)#271 | 2.1%(-0.391)#14,248 |
| 10. | 98105 | 1.7% | 1.8%(-0.094)#279 | 2.1%(-0.429)#14,532 |
| 11. | 98133 | 1.7% | 1.8%(-0.100)#281 | 2.1%(-0.435)#14,573 |
| 12. | 98177 | 1.7% | 1.8%(-0.148)#289 | 2.1%(-0.483)#14,937 |
| 13. | 98155 | 1.5% | 1.8%(-0.299)#308 | 2.1%(-0.634)#16,082 |
| 14. | 98188 | 1.5% | 1.8%(-0.327)#316 | 2.1%(-0.662)#16,316 |
| 15. | 98125 | 1.5% | 1.8%(-0.356)#320 | 2.1%(-0.691)#16,515 |
| 16. | 98118 | 1.3% | 1.8%(-0.471)#331 | 2.1%(-0.806)#17,403 |
| 17. | 98168 | 1.3% | 1.8%(-0.508)#338 | 2.1%(-0.843)#17,693 |
| 18. | 98108 | 1.3% | 1.8%(-0.521)#340 | 2.1%(-0.856)#17,797 |
| 19. | 98115 | 1.1% | 1.8%(-0.684)#362 | 2.1%(-1.02)#19,061 |
| 20. | 98146 | 1.1% | 1.8%(-0.759)#375 | 2.1%(-1.09)#19,630 |
| 21. | 98109 | 0.77% | 1.8%(-1.05)#409 | 2.1%(-1.38)#21,617 |
| 22. | 98119 | 0.61% | 1.8%(-1.20)#423 | 2.1%(-1.53)#22,579 |
| 23. | 98117 | 0.60% | 1.8%(-1.22)#425 | 2.1%(-1.55)#22,687 |
| 24. | 98122 | 0.56% | 1.8%(-1.25)#428 | 2.1%(-1.59)#22,871 |
| 25. | 98103 | 0.55% | 1.8%(-1.27)#429 | 2.1%(-1.60)#22,983 |
| 26. | 98144 | 0.54% | 1.8%(-1.27)#430 | 2.1%(-1.61)#23,017 |
| 27. | 98136 | 0.50% | 1.8%(-1.32)#435 | 2.1%(-1.65)#23,241 |
| 28. | 98107 | 0.43% | 1.8%(-1.39)#442 | 2.1%(-1.72)#23,608 |
| 29. | 98121 | 0.42% | 1.8%(-1.40)#443 | 2.1%(-1.73)#23,648 |
| 30. | 98116 | 0.40% | 1.8%(-1.41)#445 | 2.1%(-1.74)#23,706 |
| 31. | 98199 | 0.32% | 1.8%(-1.50)#451 | 2.1%(-1.83)#24,102 |
| 32. | 98126 | 0.26% | 1.8%(-1.55)#454 | 2.1%(-1.89)#24,317 |
| 33. | 98112 | 0.26% | 1.8%(-1.56)#456 | 2.1%(-1.89)#24,343 |
| 34. | 98102 | 0.065% | 1.8%(-1.75)#461 | 2.1%(-2.08)#24,752 |
1
Common Questions
What are the Top 10 Zip Codes with the Highest Percentage of Population Employed in Security & Protection in Seattle, WA?
Top 10 Zip Codes with the Highest Percentage of Population Employed in Security & Protection in Seattle, WA are:
What zip code has the Highest Percentage of Population Employed in Security & Protection in Seattle, WA?
98195 has the Highest Percentage of Population Employed in Security & Protection in Seattle, WA with 3.4%.
What is the Percentage of Population Employed in Security & Protection in Seattle, WA?
Percentage of Population Employed in Security & Protection in Seattle is 0.90%.
What is the Percentage of Population Employed in Security & Protection in Washington?
Percentage of Population Employed in Security & Protection in Washington is 1.8%.
What is the Percentage of Population Employed in Security & Protection in the United States?
Percentage of Population Employed in Security & Protection in the United States is 2.1%.