Okanogan, WA Map & Demographics
Okanogan Map
Okanogan Overview
$31,313
PER CAPITA INCOME
$80,694
AVG FAMILY INCOME
$68,850
AVG HOUSEHOLD INCOME
25.7%
WAGE / INCOME GAP [ % ]
74.3¢/ $1
WAGE / INCOME GAP [ $ ]
0.40
INEQUALITY / GINI INDEX
2,640
TOTAL POPULATION
1,195
MALE POPULATION
1,445
FEMALE POPULATION
82.70
MALES / 100 FEMALES
120.92
FEMALES / 100 MALES
40.8
MEDIAN AGE
2.9
AVG FAMILY SIZE
2.4
AVG HOUSEHOLD SIZE
1,107
LABOR FORCE [ PEOPLE ]
54.1%
PERCENT IN LABOR FORCE
3.1%
UNEMPLOYMENT RATE
Okanogan Zip Codes
Okanogan Area Codes
Income in Okanogan
Income Overview in Okanogan
Per Capita Income in Okanogan is $31,313, while median incomes of families and households are $80,694 and $68,850 respectively.
| Characteristic | Number | Measure |
| Per Capita Income | 2,640 | $31,313 |
| Median Family Income | 704 | $80,694 |
| Mean Family Income | 704 | $82,294 |
| Median Household Income | 1,045 | $68,850 |
| Mean Household Income | 1,045 | $78,794 |
| Income Deficit | 704 | $0 |
| Wage / Income Gap (%) | 2,640 | 25.67% |
| Wage / Income Gap ($) | 2,640 | 74.33¢ per $1 |
| Gini / Inequality Index | 2,640 | 0.40 |
Earnings by Sex in Okanogan
Average Earnings in Okanogan are $33,083, $41,563 for men and $30,893 for women, a difference of 25.7%.
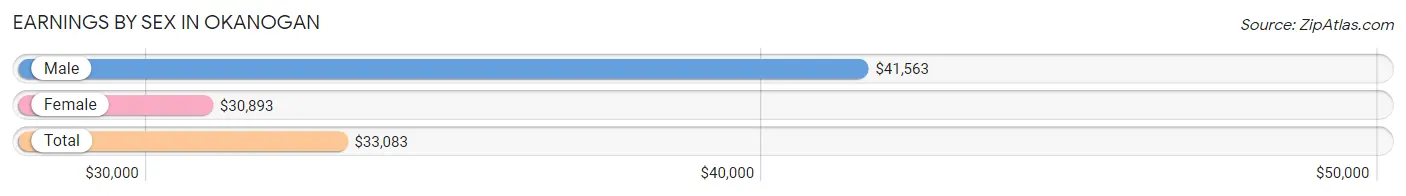
| Sex | Number | Average Earnings |
| Male | 515 (42.6%) | $41,563 |
| Female | 694 (57.4%) | $30,893 |
| Total | 1,209 (100.0%) | $33,083 |
Earnings by Sex by Income Bracket in Okanogan
The most common earnings brackets in Okanogan are $100,000+ for men (82 | 15.9%) and $35,000 to $39,999 for women (112 | 16.1%).
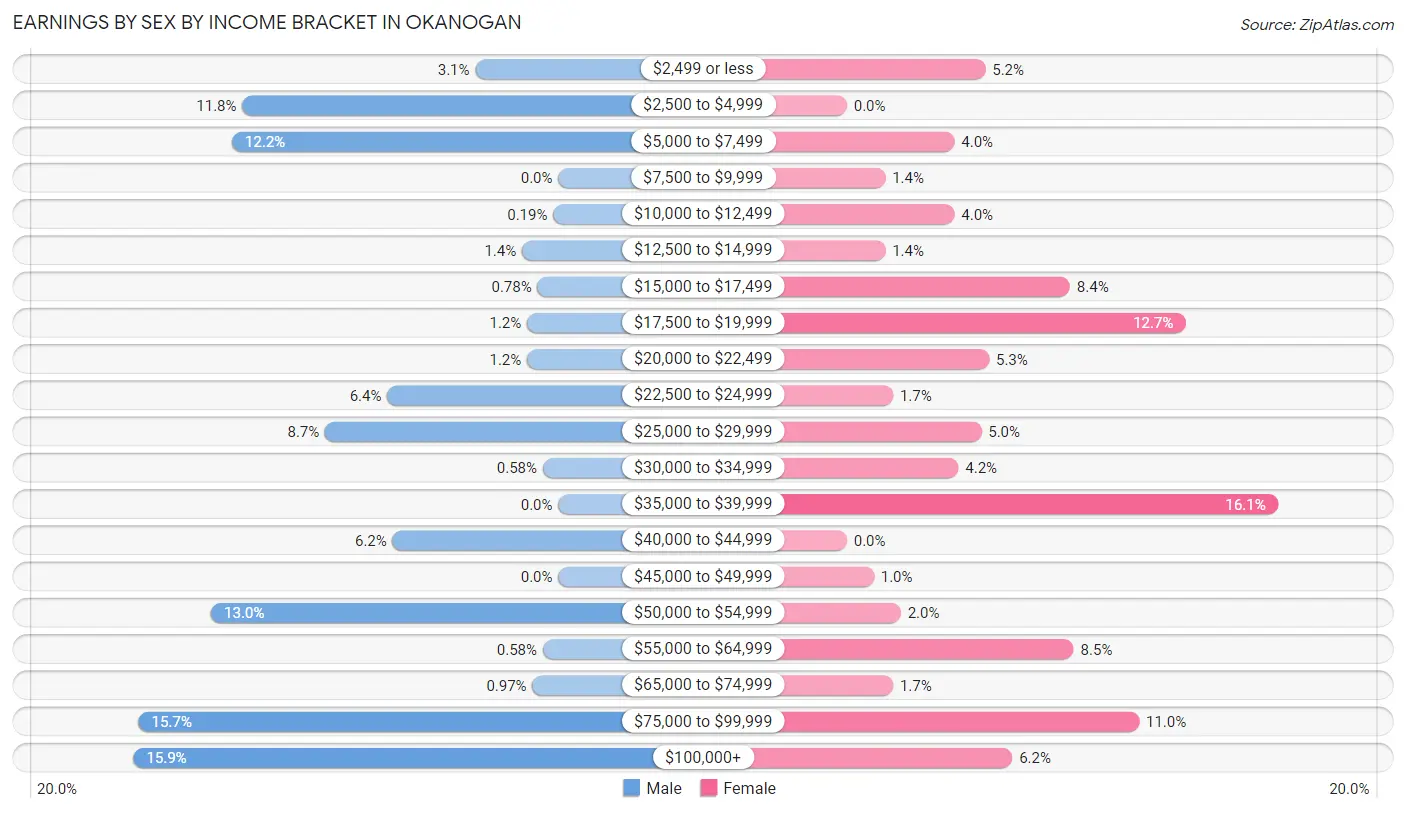
| Income | Male | Female |
| $2,499 or less | 16 (3.1%) | 36 (5.2%) |
| $2,500 to $4,999 | 61 (11.8%) | 0 (0.0%) |
| $5,000 to $7,499 | 63 (12.2%) | 28 (4.0%) |
| $7,500 to $9,999 | 0 (0.0%) | 10 (1.4%) |
| $10,000 to $12,499 | 1 (0.2%) | 28 (4.0%) |
| $12,500 to $14,999 | 7 (1.4%) | 10 (1.4%) |
| $15,000 to $17,499 | 4 (0.8%) | 58 (8.4%) |
| $17,500 to $19,999 | 6 (1.2%) | 88 (12.7%) |
| $20,000 to $22,499 | 6 (1.2%) | 37 (5.3%) |
| $22,500 to $24,999 | 33 (6.4%) | 12 (1.7%) |
| $25,000 to $29,999 | 45 (8.7%) | 35 (5.0%) |
| $30,000 to $34,999 | 3 (0.6%) | 29 (4.2%) |
| $35,000 to $39,999 | 0 (0.0%) | 112 (16.1%) |
| $40,000 to $44,999 | 32 (6.2%) | 0 (0.0%) |
| $45,000 to $49,999 | 0 (0.0%) | 7 (1.0%) |
| $50,000 to $54,999 | 67 (13.0%) | 14 (2.0%) |
| $55,000 to $64,999 | 3 (0.6%) | 59 (8.5%) |
| $65,000 to $74,999 | 5 (1.0%) | 12 (1.7%) |
| $75,000 to $99,999 | 81 (15.7%) | 76 (11.0%) |
| $100,000+ | 82 (15.9%) | 43 (6.2%) |
| Total | 515 (100.0%) | 694 (100.0%) |
Earnings by Sex by Educational Attainment in Okanogan
Average earnings in Okanogan are $52,799 for men and $35,492 for women, a difference of 32.8%. Men with an educational attainment of graduate degree enjoy the highest average annual earnings of $113,594, while those with high school diploma education earn the least with $27,889. Women with an educational attainment of bachelor's degree earn the most with the average annual earnings of $57,656, while those with less than high school education have the smallest earnings of $25,625.
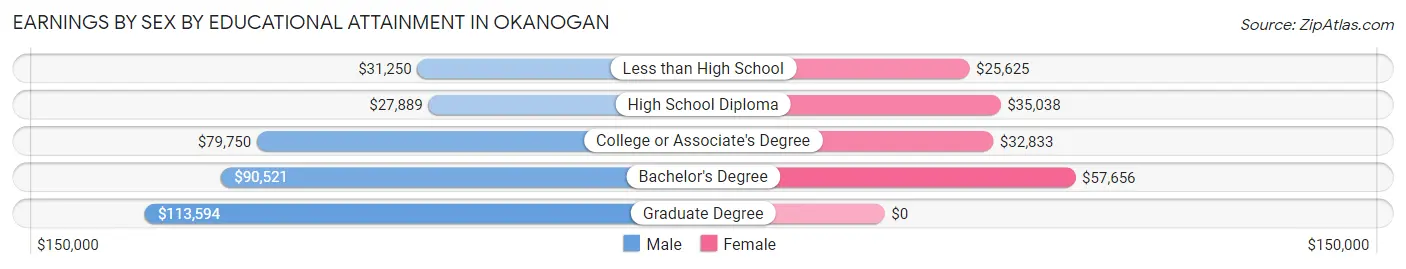
| Educational Attainment | Male Income | Female Income |
| Less than High School | $31,250 | $25,625 |
| High School Diploma | $27,889 | $35,038 |
| College or Associate's Degree | $79,750 | $32,833 |
| Bachelor's Degree | $90,521 | $57,656 |
| Graduate Degree | $113,594 | $0 |
| Total | $52,799 | $35,492 |
Family Income in Okanogan
Family Income Brackets in Okanogan
According to the Okanogan family income data, there are 185 families falling into the $75,000 to $99,999 income range, which is the most common income bracket and makes up 26.3% of all families. Conversely, the less than $10,000 income bracket is the least frequent group with only 23 families (3.3%) belonging to this category.
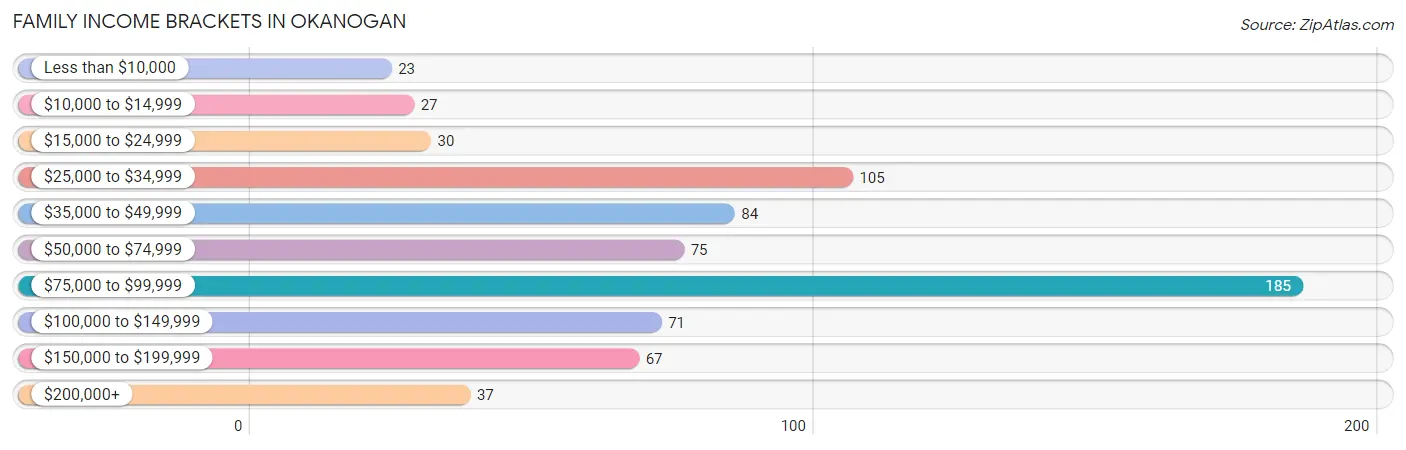
| Income Bracket | # Families | % Families |
| Less than $10,000 | 23 | 3.3% |
| $10,000 to $14,999 | 27 | 3.8% |
| $15,000 to $24,999 | 30 | 4.3% |
| $25,000 to $34,999 | 105 | 14.9% |
| $35,000 to $49,999 | 84 | 11.9% |
| $50,000 to $74,999 | 75 | 10.7% |
| $75,000 to $99,999 | 185 | 26.3% |
| $100,000 to $149,999 | 71 | 10.1% |
| $150,000 to $199,999 | 67 | 9.5% |
| $200,000+ | 37 | 5.3% |
Family Income by Famaliy Size in Okanogan
4-person families (177 | 25.1%) account for the highest median family income in Okanogan with $84,013 per family, while 2-person families (284 | 40.3%) have the highest median income of $36,944 per family member.
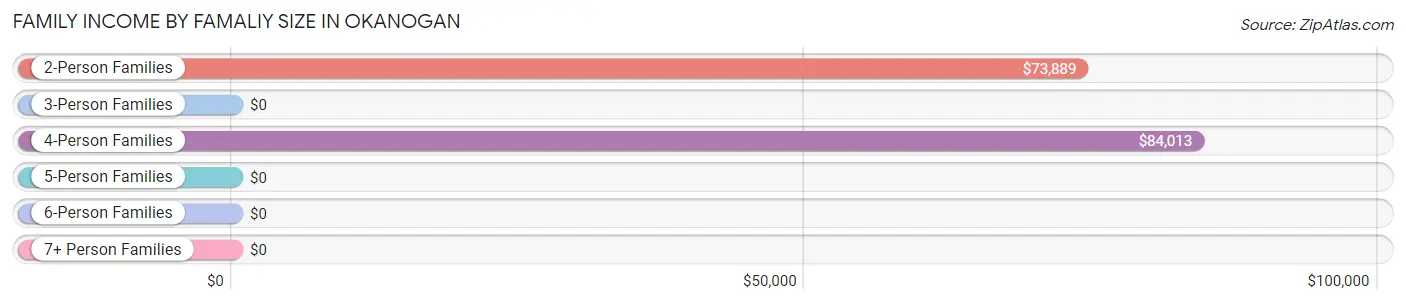
| Income Bracket | # Families | Median Income |
| 2-Person Families | 284 (40.3%) | $73,889 |
| 3-Person Families | 203 (28.8%) | $0 |
| 4-Person Families | 177 (25.1%) | $84,013 |
| 5-Person Families | 14 (2.0%) | $0 |
| 6-Person Families | 26 (3.7%) | $0 |
| 7+ Person Families | 0 (0.0%) | $0 |
| Total | 704 (100.0%) | $80,694 |
Family Income by Number of Earners in Okanogan
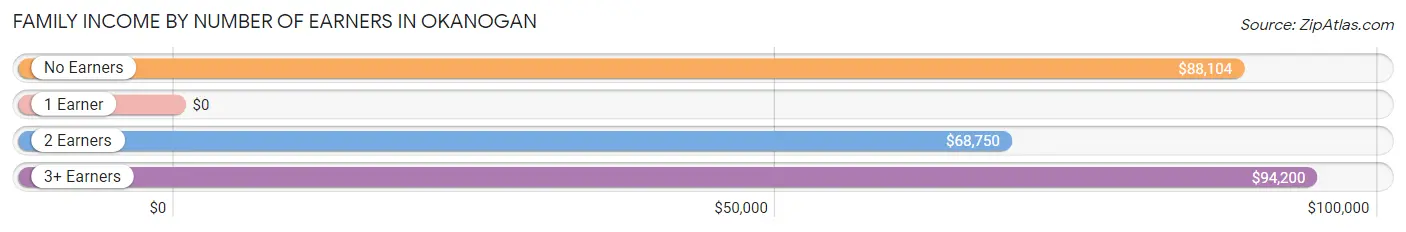
| Number of Earners | # Families | Median Income |
| No Earners | 164 (23.3%) | $88,104 |
| 1 Earner | 186 (26.4%) | $0 |
| 2 Earners | 298 (42.3%) | $68,750 |
| 3+ Earners | 56 (8.0%) | $94,200 |
| Total | 704 (100.0%) | $80,694 |
Household Income in Okanogan
Household Income Brackets in Okanogan
With 239 households falling in the category, the $75,000 to $99,999 income range is the most frequent in Okanogan, accounting for 22.9% of all households. In contrast, only 32 households (3.1%) fall into the $15,000 to $24,999 income bracket, making it the least populous group.
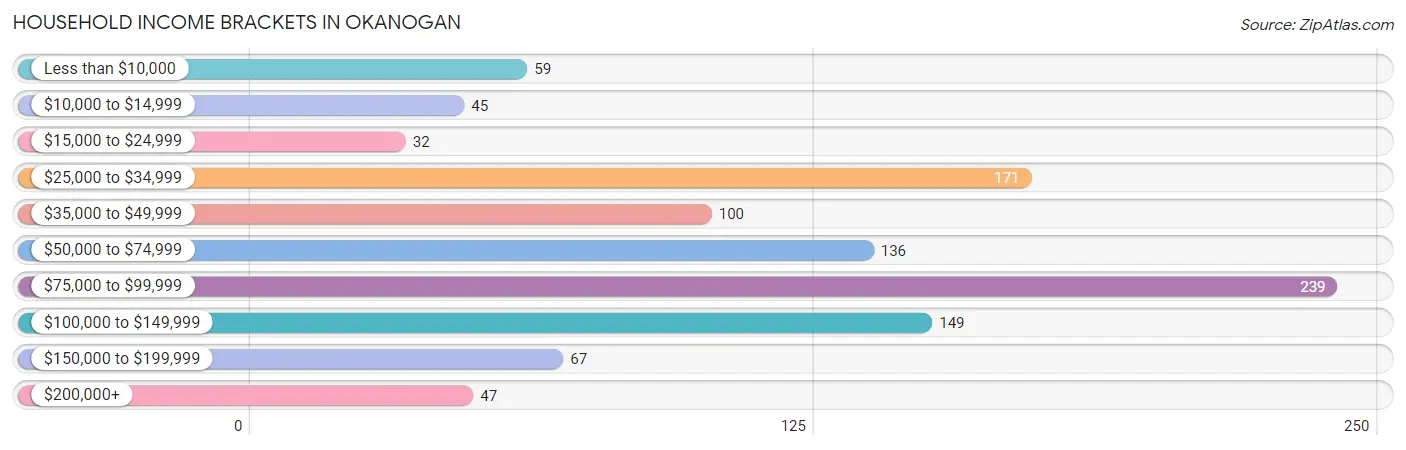
| Income Bracket | # Households | % Households |
| Less than $10,000 | 59 | 5.6% |
| $10,000 to $14,999 | 45 | 4.3% |
| $15,000 to $24,999 | 32 | 3.1% |
| $25,000 to $34,999 | 171 | 16.4% |
| $35,000 to $49,999 | 100 | 9.6% |
| $50,000 to $74,999 | 136 | 13.0% |
| $75,000 to $99,999 | 239 | 22.9% |
| $100,000 to $149,999 | 149 | 14.3% |
| $150,000 to $199,999 | 67 | 6.4% |
| $200,000+ | 47 | 4.5% |
Household Income by Householder Age in Okanogan
The median household income in Okanogan is $68,850, with the highest median household income of $88,214 found in the 45 to 64 years age bracket for the primary householder. A total of 316 households (30.2%) fall into this category. Meanwhile, the 15 to 24 years age bracket for the primary householder has the lowest median household income of $3,478, with 28 households (2.7%) in this group.
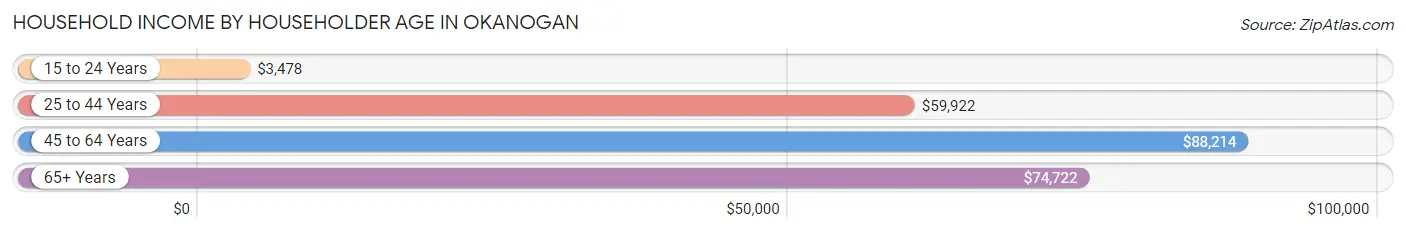
| Income Bracket | # Households | Median Income |
| 15 to 24 Years | 28 (2.7%) | $3,478 |
| 25 to 44 Years | 367 (35.1%) | $59,922 |
| 45 to 64 Years | 316 (30.2%) | $88,214 |
| 65+ Years | 334 (32.0%) | $74,722 |
| Total | 1,045 (100.0%) | $68,850 |
Poverty in Okanogan
Income Below Poverty by Sex and Age in Okanogan
With 13.4% poverty level for males and 16.8% for females among the residents of Okanogan, 25 to 34 year old males and under 5 year old females are the most vulnerable to poverty, with 38 males (44.7%) and 33 females (71.7%) in their respective age groups living below the poverty level.
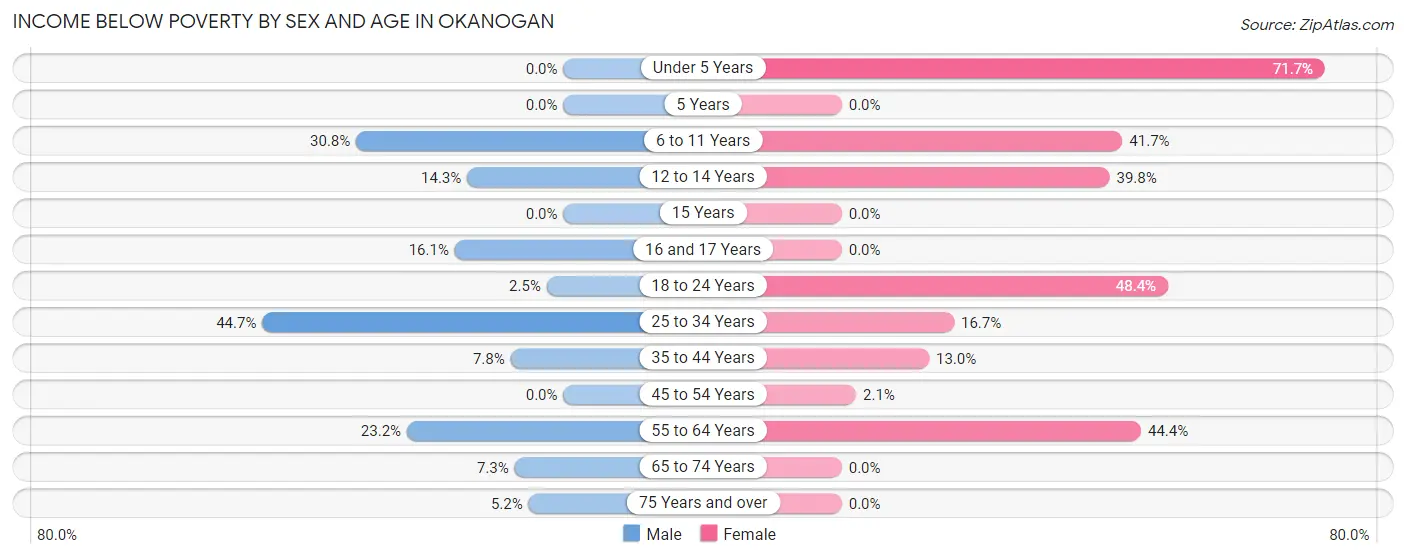
| Age Bracket | Male | Female |
| Under 5 Years | 0 (0.0%) | 33 (71.7%) |
| 5 Years | 0 (0.0%) | 0 (0.0%) |
| 6 to 11 Years | 36 (30.8%) | 50 (41.7%) |
| 12 to 14 Years | 18 (14.3%) | 33 (39.8%) |
| 15 Years | 0 (0.0%) | 0 (0.0%) |
| 16 and 17 Years | 5 (16.1%) | 0 (0.0%) |
| 18 to 24 Years | 2 (2.5%) | 46 (48.4%) |
| 25 to 34 Years | 38 (44.7%) | 15 (16.7%) |
| 35 to 44 Years | 8 (7.8%) | 32 (13.0%) |
| 45 to 54 Years | 0 (0.0%) | 5 (2.1%) |
| 55 to 64 Years | 23 (23.2%) | 20 (44.4%) |
| 65 to 74 Years | 10 (7.2%) | 0 (0.0%) |
| 75 Years and over | 3 (5.2%) | 0 (0.0%) |
| Total | 143 (13.4%) | 234 (16.8%) |
Income Above Poverty by Sex and Age in Okanogan
According to the poverty statistics in Okanogan, males aged under 5 years and females aged 15 years are the age groups that are most secure financially, with 100.0% of males and 100.0% of females in these age groups living above the poverty line.
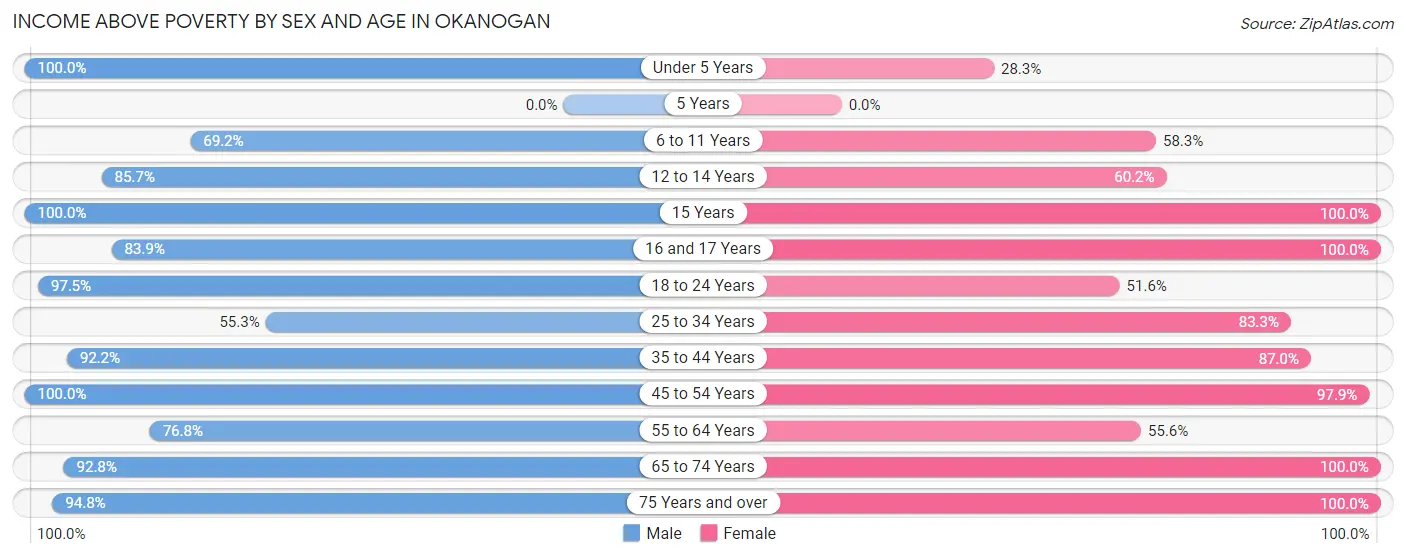
| Age Bracket | Male | Female |
| Under 5 Years | 45 (100.0%) | 13 (28.3%) |
| 5 Years | 0 (0.0%) | 0 (0.0%) |
| 6 to 11 Years | 81 (69.2%) | 70 (58.3%) |
| 12 to 14 Years | 108 (85.7%) | 50 (60.2%) |
| 15 Years | 20 (100.0%) | 33 (100.0%) |
| 16 and 17 Years | 26 (83.9%) | 75 (100.0%) |
| 18 to 24 Years | 79 (97.5%) | 49 (51.6%) |
| 25 to 34 Years | 47 (55.3%) | 75 (83.3%) |
| 35 to 44 Years | 94 (92.2%) | 215 (87.0%) |
| 45 to 54 Years | 168 (100.0%) | 231 (97.9%) |
| 55 to 64 Years | 76 (76.8%) | 25 (55.6%) |
| 65 to 74 Years | 128 (92.7%) | 191 (100.0%) |
| 75 Years and over | 55 (94.8%) | 132 (100.0%) |
| Total | 927 (86.6%) | 1,159 (83.2%) |
Income Below Poverty Among Married-Couple Families in Okanogan
The poverty statistics for married-couple families in Okanogan show that 4.2% or 19 of the total 452 families live below the poverty line. Families with 1 or 2 children have the highest poverty rate of 8.3%, comprising of 19 families. On the other hand, families with no children have the lowest poverty rate of 0.0%, which includes 0 families.
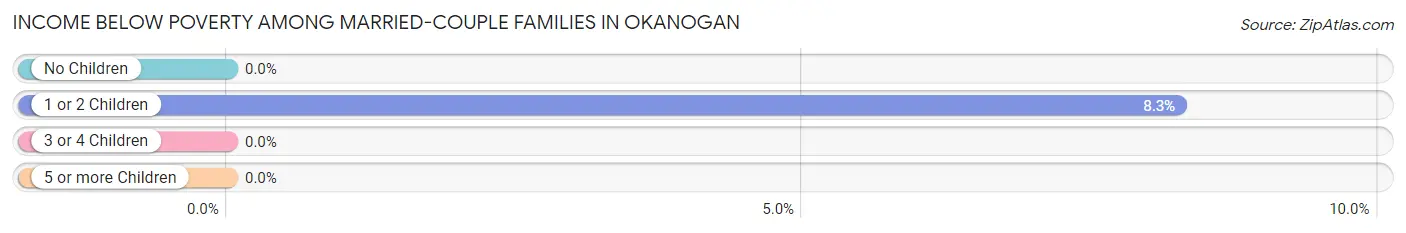
| Children | Above Poverty | Below Poverty |
| No Children | 206 (100.0%) | 0 (0.0%) |
| 1 or 2 Children | 211 (91.7%) | 19 (8.3%) |
| 3 or 4 Children | 16 (100.0%) | 0 (0.0%) |
| 5 or more Children | 0 (0.0%) | 0 (0.0%) |
| Total | 433 (95.8%) | 19 (4.2%) |
Income Below Poverty Among Single-Parent Households in Okanogan
According to the poverty data in Okanogan, 11.1% or 2 single-father households and 22.7% or 53 single-mother households are living below the poverty line. Among single-father households, those with 1 or 2 children have the highest poverty rate, with 2 households (11.1%) experiencing poverty. Likewise, among single-mother households, those with 3 or 4 children have the highest poverty rate, with 10 households (100.0%) falling below the poverty line.
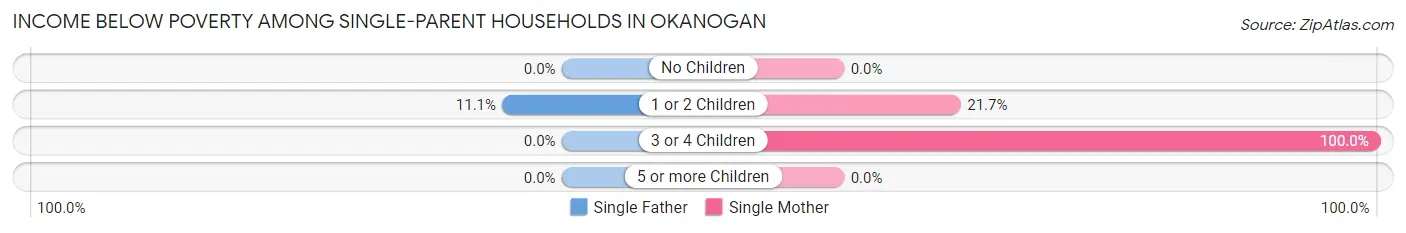
| Children | Single Father | Single Mother |
| No Children | 0 (0.0%) | 0 (0.0%) |
| 1 or 2 Children | 2 (11.1%) | 43 (21.7%) |
| 3 or 4 Children | 0 (0.0%) | 10 (100.0%) |
| 5 or more Children | 0 (0.0%) | 0 (0.0%) |
| Total | 2 (11.1%) | 53 (22.7%) |
Income Below Poverty Among Married-Couple vs Single-Parent Households in Okanogan
The poverty data for Okanogan shows that 19 of the married-couple family households (4.2%) and 55 of the single-parent households (21.8%) are living below the poverty level. Within the married-couple family households, those with 1 or 2 children have the highest poverty rate, with 19 households (8.3%) falling below the poverty line. Among the single-parent households, those with 3 or 4 children have the highest poverty rate, with 10 household (100.0%) living below poverty.
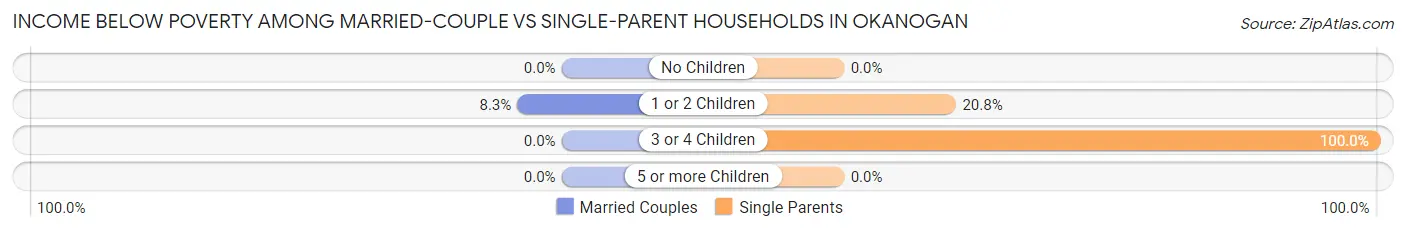
| Children | Married-Couple Families | Single-Parent Households |
| No Children | 0 (0.0%) | 0 (0.0%) |
| 1 or 2 Children | 19 (8.3%) | 45 (20.8%) |
| 3 or 4 Children | 0 (0.0%) | 10 (100.0%) |
| 5 or more Children | 0 (0.0%) | 0 (0.0%) |
| Total | 19 (4.2%) | 55 (21.8%) |
Race in Okanogan
The most populous races in Okanogan are White / Caucasian (2,045 | 77.5%), Hispanic or Latino (377 | 14.3%), and Two or more Races (272 | 10.3%).
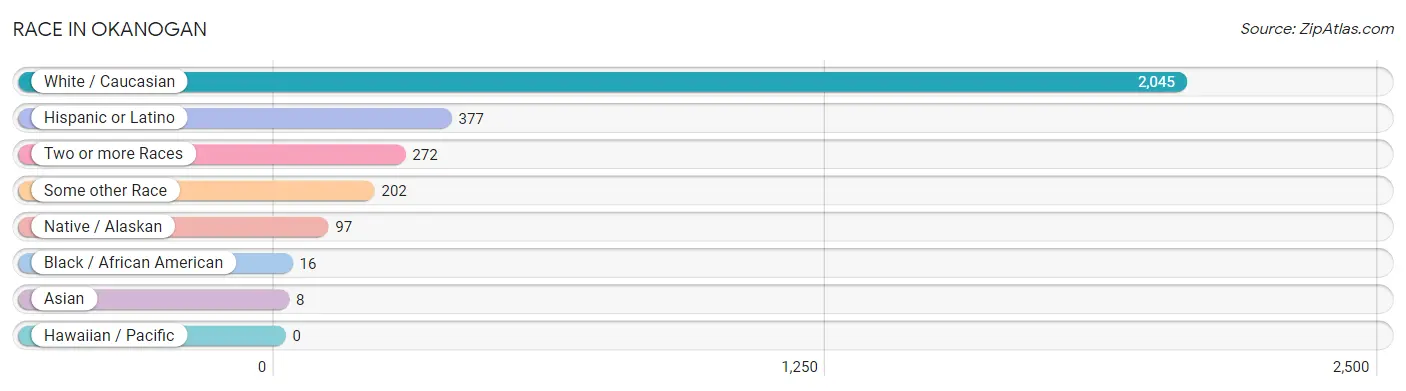
| Race | # Population | % Population |
| Asian | 8 | 0.3% |
| Black / African American | 16 | 0.6% |
| Hawaiian / Pacific | 0 | 0.0% |
| Hispanic or Latino | 377 | 14.3% |
| Native / Alaskan | 97 | 3.7% |
| White / Caucasian | 2,045 | 77.5% |
| Two or more Races | 272 | 10.3% |
| Some other Race | 202 | 7.6% |
| Total | 2,640 | 100.0% |
Ancestry in Okanogan
The most populous ancestries reported in Okanogan are Irish (467 | 17.7%), German (410 | 15.5%), Mexican (370 | 14.0%), English (298 | 11.3%), and American (203 | 7.7%), together accounting for 66.2% of all Okanogan residents.
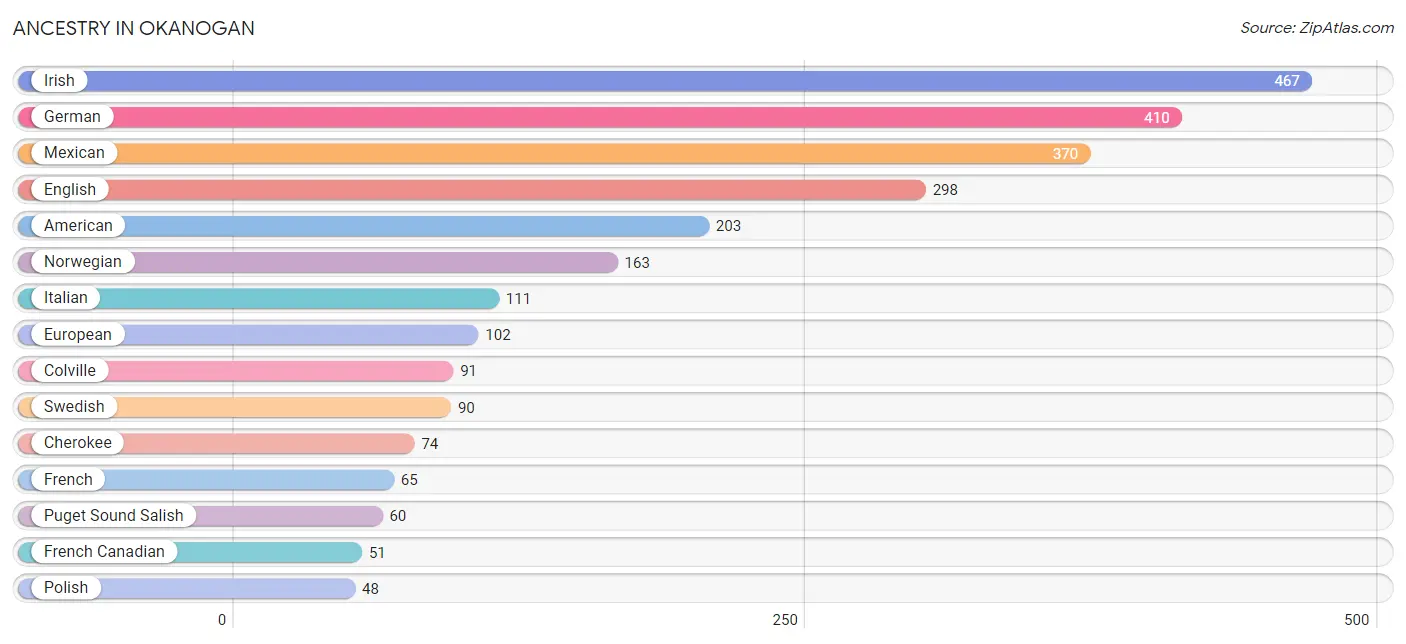
| Ancestry | # Population | % Population |
| American | 203 | 7.7% |
| Apache | 47 | 1.8% |
| Canadian | 10 | 0.4% |
| Cherokee | 74 | 2.8% |
| Chippewa | 7 | 0.3% |
| Colville | 91 | 3.5% |
| Croatian | 47 | 1.8% |
| Danish | 14 | 0.5% |
| Delaware | 23 | 0.9% |
| Dutch | 21 | 0.8% |
| Eastern European | 14 | 0.5% |
| English | 298 | 11.3% |
| European | 102 | 3.9% |
| French | 65 | 2.5% |
| French Canadian | 51 | 1.9% |
| German | 410 | 15.5% |
| Hungarian | 3 | 0.1% |
| Irish | 467 | 17.7% |
| Italian | 111 | 4.2% |
| Korean | 28 | 1.1% |
| Mexican | 370 | 14.0% |
| Northern European | 19 | 0.7% |
| Norwegian | 163 | 6.2% |
| Polish | 48 | 1.8% |
| Portuguese | 4 | 0.2% |
| Puerto Rican | 7 | 0.3% |
| Puget Sound Salish | 60 | 2.3% |
| Scotch-Irish | 29 | 1.1% |
| Scottish | 46 | 1.7% |
| Sioux | 4 | 0.2% |
| Swedish | 90 | 3.4% |
| Swiss | 15 | 0.6% |
| Ute | 1 | 0.0% |
| Welsh | 9 | 0.3% | View All 34 Rows |
Immigrants in Okanogan
The most numerous immigrant groups reported in Okanogan came from Central America (60 | 2.3%), Latin America (60 | 2.3%), Mexico (60 | 2.3%), Canada (22 | 0.8%), and Asia (13 | 0.5%), together accounting for 8.1% of all Okanogan residents.
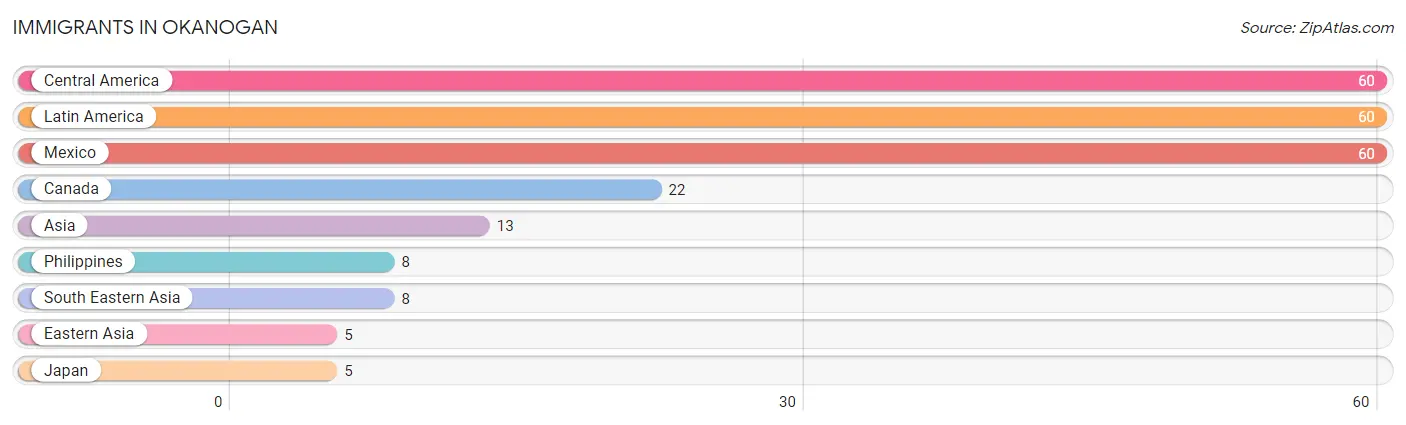
| Immigration Origin | # Population | % Population |
| Asia | 13 | 0.5% |
| Canada | 22 | 0.8% |
| Central America | 60 | 2.3% |
| Eastern Asia | 5 | 0.2% |
| Japan | 5 | 0.2% |
| Latin America | 60 | 2.3% |
| Mexico | 60 | 2.3% |
| Philippines | 8 | 0.3% |
| South Eastern Asia | 8 | 0.3% | View All 9 Rows |
Sex and Age in Okanogan
Sex and Age in Okanogan
The most populous age groups in Okanogan are 10 to 14 Years (155 | 13.0%) for men and 45 to 49 Years (204 | 14.1%) for women.
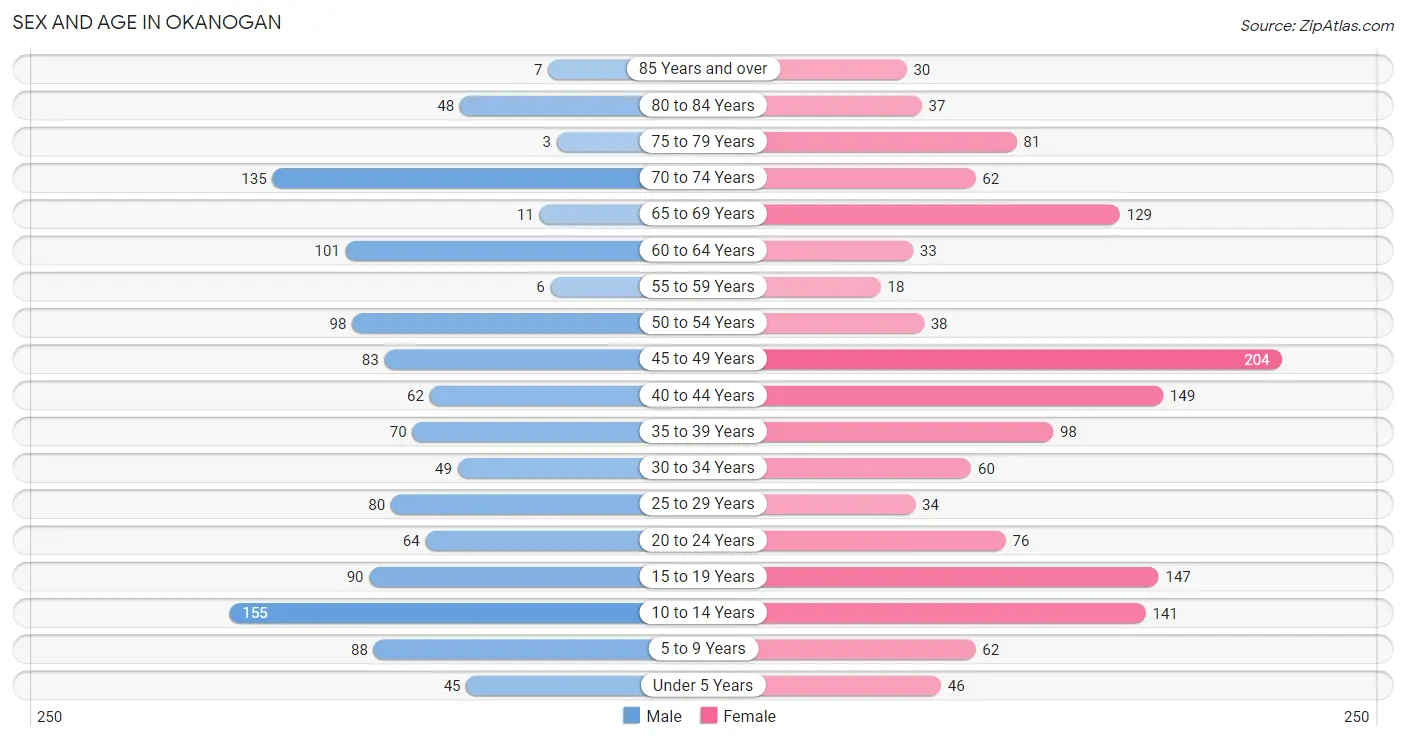
| Age Bracket | Male | Female |
| Under 5 Years | 45 (3.8%) | 46 (3.2%) |
| 5 to 9 Years | 88 (7.4%) | 62 (4.3%) |
| 10 to 14 Years | 155 (13.0%) | 141 (9.8%) |
| 15 to 19 Years | 90 (7.5%) | 147 (10.2%) |
| 20 to 24 Years | 64 (5.4%) | 76 (5.3%) |
| 25 to 29 Years | 80 (6.7%) | 34 (2.4%) |
| 30 to 34 Years | 49 (4.1%) | 60 (4.2%) |
| 35 to 39 Years | 70 (5.9%) | 98 (6.8%) |
| 40 to 44 Years | 62 (5.2%) | 149 (10.3%) |
| 45 to 49 Years | 83 (7.0%) | 204 (14.1%) |
| 50 to 54 Years | 98 (8.2%) | 38 (2.6%) |
| 55 to 59 Years | 6 (0.5%) | 18 (1.3%) |
| 60 to 64 Years | 101 (8.5%) | 33 (2.3%) |
| 65 to 69 Years | 11 (0.9%) | 129 (8.9%) |
| 70 to 74 Years | 135 (11.3%) | 62 (4.3%) |
| 75 to 79 Years | 3 (0.3%) | 81 (5.6%) |
| 80 to 84 Years | 48 (4.0%) | 37 (2.6%) |
| 85 Years and over | 7 (0.6%) | 30 (2.1%) |
| Total | 1,195 (100.0%) | 1,445 (100.0%) |
Families and Households in Okanogan
Median Family Size in Okanogan
The median family size in Okanogan is 2.90 persons per family, with married-couple families (452 | 64.2%) accounting for the largest median family size of 3.09 persons per family. On the other hand, single male/father families (18 | 2.6%) represent the smallest median family size with 2.22 persons per family.
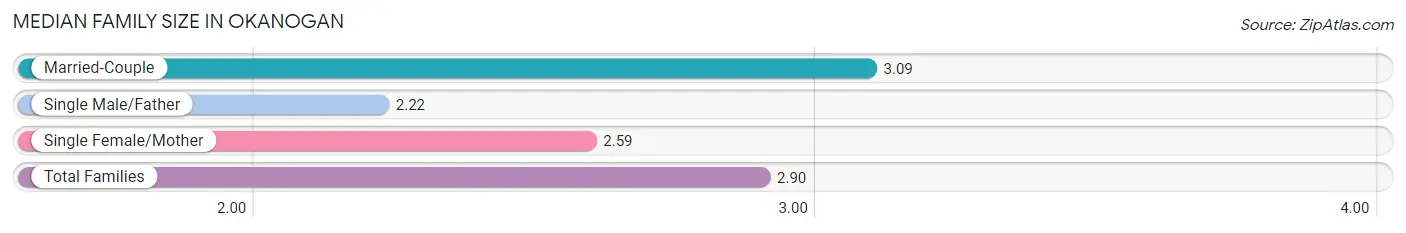
| Family Type | # Families | Family Size |
| Married-Couple | 452 (64.2%) | 3.09 |
| Single Male/Father | 18 (2.6%) | 2.22 |
| Single Female/Mother | 234 (33.2%) | 2.59 |
| Total Families | 704 (100.0%) | 2.90 |
Median Household Size in Okanogan
The median household size in Okanogan is 2.36 persons per household, with married-couple households (452 | 43.2%) accounting for the largest median household size of 3.11 persons per household. non-family households (341 | 32.6%) represent the smallest median household size with 1.14 persons per household.
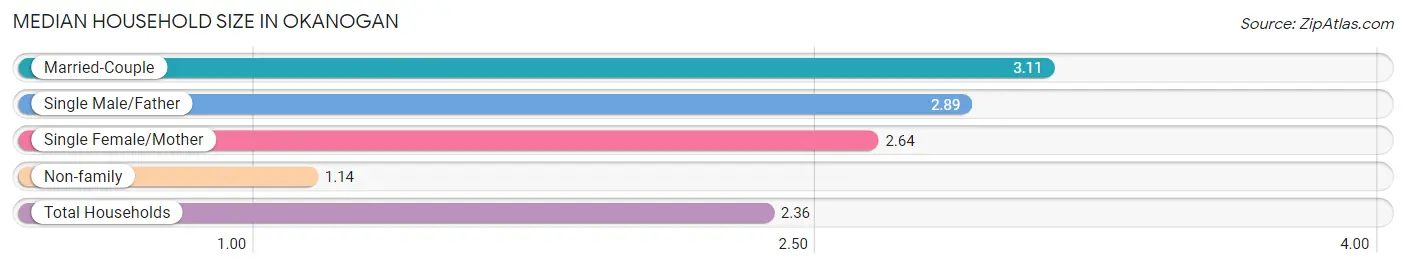
| Household Type | # Households | Household Size |
| Married-Couple | 452 (43.2%) | 3.11 |
| Single Male/Father | 18 (1.7%) | 2.89 |
| Single Female/Mother | 234 (22.4%) | 2.64 |
| Non-family | 341 (32.6%) | 1.14 |
| Total Households | 1,045 (100.0%) | 2.36 |
Household Size by Marriage Status in Okanogan
Out of a total of 1,045 households in Okanogan, 704 (67.4%) are family households, while 341 (32.6%) are nonfamily households. The most numerous type of family households are 2-person households, comprising 268, and the most common type of nonfamily households are 1-person households, comprising 281.
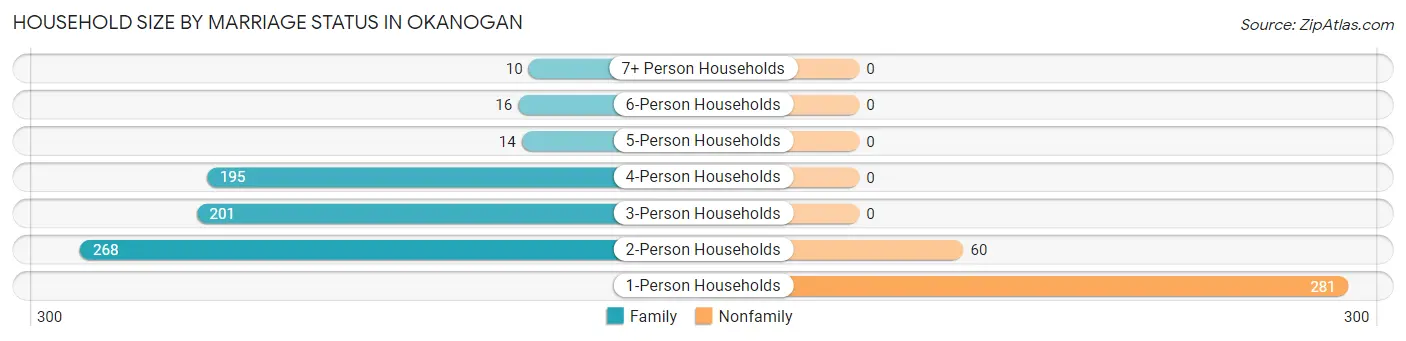
| Household Size | Family Households | Nonfamily Households |
| 1-Person Households | - | 281 (26.9%) |
| 2-Person Households | 268 (25.7%) | 60 (5.7%) |
| 3-Person Households | 201 (19.2%) | 0 (0.0%) |
| 4-Person Households | 195 (18.7%) | 0 (0.0%) |
| 5-Person Households | 14 (1.3%) | 0 (0.0%) |
| 6-Person Households | 16 (1.5%) | 0 (0.0%) |
| 7+ Person Households | 10 (1.0%) | 0 (0.0%) |
| Total | 704 (67.4%) | 341 (32.6%) |
Female Fertility in Okanogan
Fertility by Age in Okanogan
| Age Bracket | Women with Births | Births / 1,000 Women |
| 15 to 19 years | 0 (0.0%) | 0.0 |
| 20 to 34 years | 0 (0.0%) | 0.0 |
| 35 to 50 years | 0 (0.0%) | 0.0 |
| Total | 0 (0.0%) | 0.0 |
Fertility by Age by Marriage Status in Okanogan
| Age Bracket | Married | Unmarried |
| 15 to 19 years | 0 (0.0%) | 0 (0.0%) |
| 20 to 34 years | 0 (0.0%) | 0 (0.0%) |
| 35 to 50 years | 0 (0.0%) | 0 (0.0%) |
| Total | 0 (0.0%) | 0 (0.0%) |
Fertility by Education in Okanogan
| Educational Attainment | Women with Births | Births / 1,000 Women |
| Less than High School | 0 (0.0%) | 0.0 |
| High School Diploma | 0 (0.0%) | 0.0 |
| College or Associate's Degree | 0 (0.0%) | 0.0 |
| Bachelor's Degree | 0 (0.0%) | 0.0 |
| Graduate Degree | 0 (0.0%) | 0.0 |
| Total | 0 (0.0%) | 0.0 |
Fertility by Education by Marriage Status in Okanogan
| Educational Attainment | Married | Unmarried |
| Less than High School | 0 (0.0%) | 0 (0.0%) |
| High School Diploma | 0 (0.0%) | 0 (0.0%) |
| College or Associate's Degree | 0 (0.0%) | 0 (0.0%) |
| Bachelor's Degree | 0 (0.0%) | 0 (0.0%) |
| Graduate Degree | 0 (0.0%) | 0 (0.0%) |
| Total | 0 (0.0%) | 0 (0.0%) |
Employment Characteristics in Okanogan
Employment by Class of Employer in Okanogan
Among the 1,051 employed individuals in Okanogan, private company employees (580 | 55.2%), local government employees (139 | 13.2%), and state government employees (129 | 12.3%) make up the most common classes of employment.
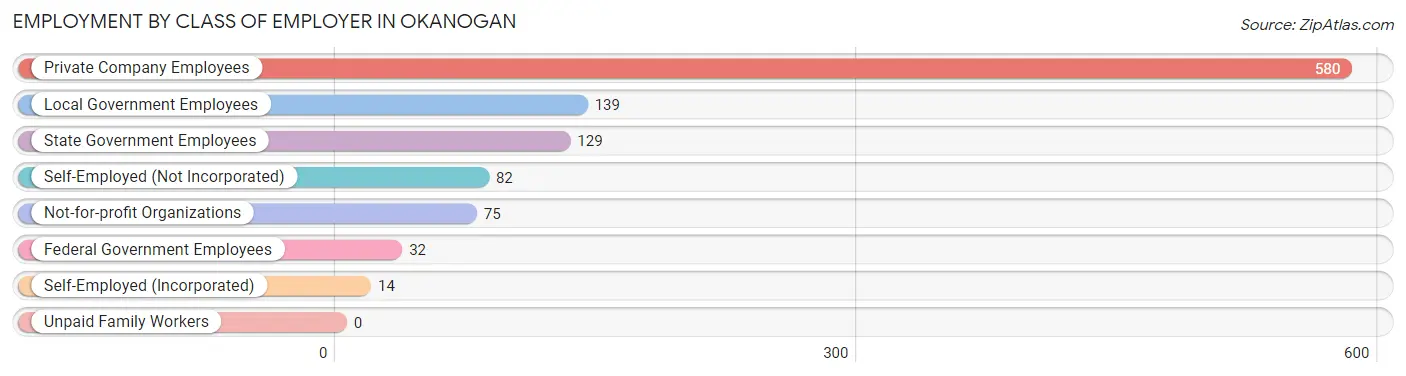
| Employer Class | # Employees | % Employees |
| Private Company Employees | 580 | 55.2% |
| Self-Employed (Incorporated) | 14 | 1.3% |
| Self-Employed (Not Incorporated) | 82 | 7.8% |
| Not-for-profit Organizations | 75 | 7.1% |
| Local Government Employees | 139 | 13.2% |
| State Government Employees | 129 | 12.3% |
| Federal Government Employees | 32 | 3.0% |
| Unpaid Family Workers | 0 | 0.0% |
| Total | 1,051 | 100.0% |
Employment Status by Age in Okanogan
According to the labor force statistics for Okanogan, out of the total population over 16 years of age (2,047), 54.1% or 1,107 individuals are in the labor force, with 3.1% or 34 of them unemployed. The age group with the highest labor force participation rate is 45 to 54 years, with 86.1% or 364 individuals in the labor force. Within the labor force, the 25 to 29 years age range has the highest percentage of unemployed individuals, with 31.2% or 24 of them being unemployed.
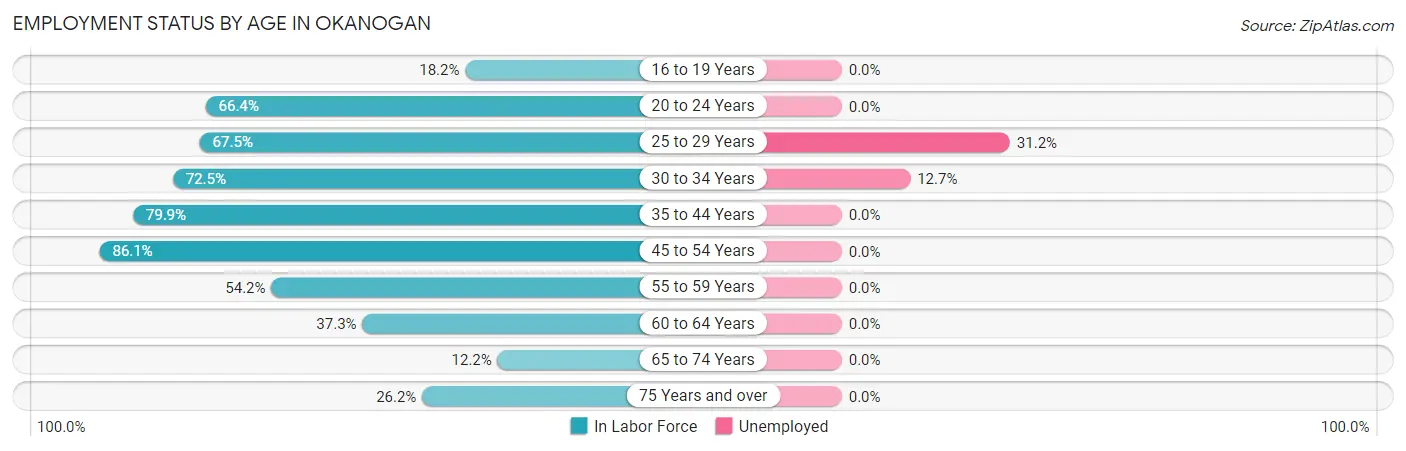
| Age Bracket | In Labor Force | Unemployed |
| 16 to 19 Years | 33 (18.2%) | 0 (0.0%) |
| 20 to 24 Years | 93 (66.4%) | 0 (0.0%) |
| 25 to 29 Years | 77 (67.5%) | 24 (31.2%) |
| 30 to 34 Years | 79 (72.5%) | 10 (12.7%) |
| 35 to 44 Years | 303 (79.9%) | 0 (0.0%) |
| 45 to 54 Years | 364 (86.1%) | 0 (0.0%) |
| 55 to 59 Years | 13 (54.2%) | 0 (0.0%) |
| 60 to 64 Years | 50 (37.3%) | 0 (0.0%) |
| 65 to 74 Years | 41 (12.2%) | 0 (0.0%) |
| 75 Years and over | 54 (26.2%) | 0 (0.0%) |
| Total | 1,107 (54.1%) | 34 (3.1%) |
Employment Status by Educational Attainment in Okanogan
According to labor force statistics for Okanogan, 74.9% of individuals (886) out of the total population between 25 and 64 years of age (1,183) are in the labor force, with 3.8% or 34 of them being unemployed. The group with the highest labor force participation rate are those with the educational attainment of bachelor's degree or higher, with 94.2% or 356 individuals in the labor force. Within the labor force, individuals with high school diploma education have the highest percentage of unemployment, with 11.4% or 24 of them being unemployed.
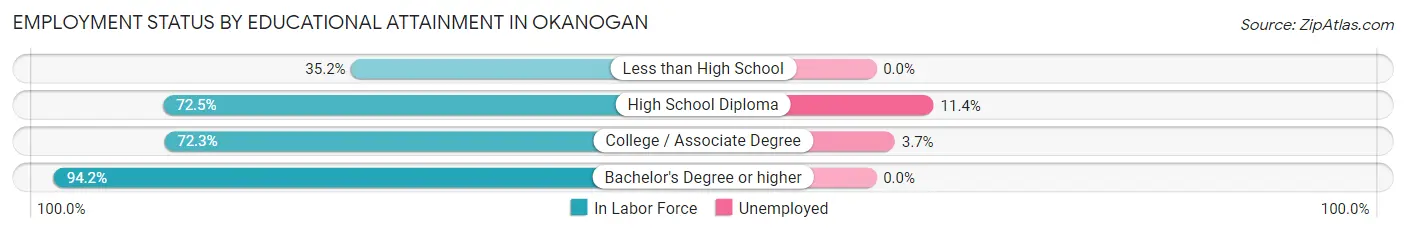
| Educational Attainment | In Labor Force | Unemployed |
| Less than High School | 50 (35.2%) | 0 (0.0%) |
| High School Diploma | 211 (72.5%) | 33 (11.4%) |
| College / Associate Degree | 269 (72.3%) | 14 (3.7%) |
| Bachelor's Degree or higher | 356 (94.2%) | 0 (0.0%) |
| Total | 886 (74.9%) | 45 (3.8%) |
Employment Occupations by Sex in Okanogan
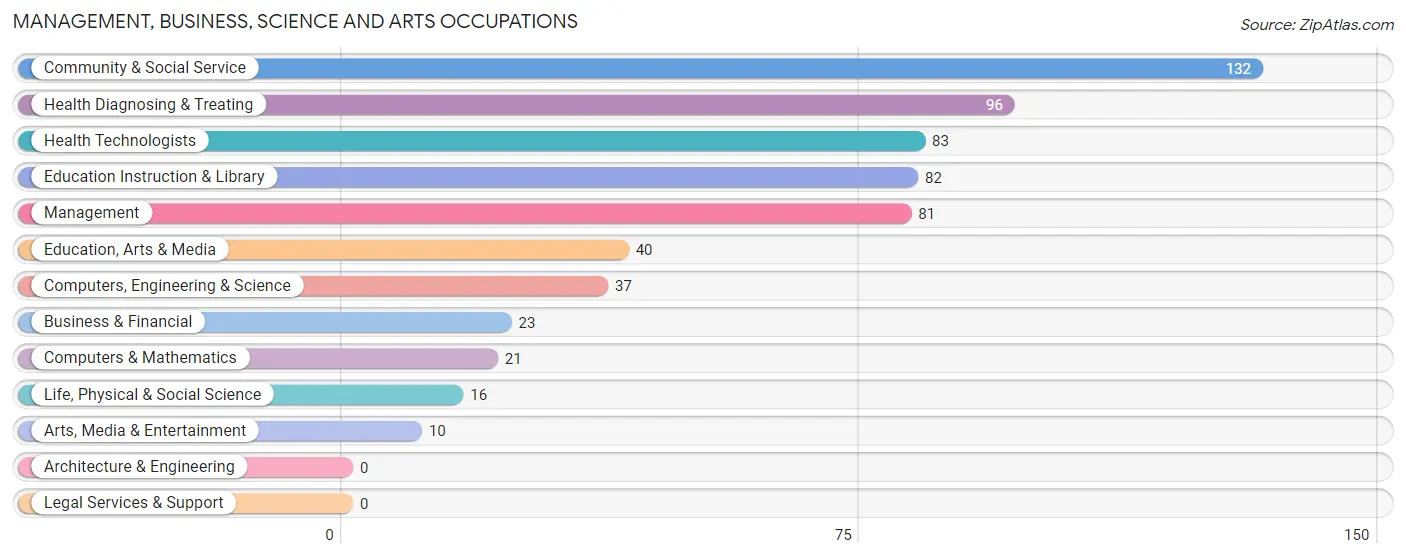
Management, Business, Science and Arts Occupations
The most common Management, Business, Science and Arts occupations in Okanogan are Community & Social Service (132 | 12.3%), Health Diagnosing & Treating (96 | 8.9%), Health Technologists (83 | 7.7%), Education Instruction & Library (82 | 7.6%), and Management (81 | 7.5%).
Management, Business, Science and Arts Occupations by Sex
Within the Management, Business, Science and Arts occupations in Okanogan, the most male-oriented occupations are Computers & Mathematics (100.0%), Computers, Engineering & Science (56.8%), and Health Diagnosing & Treating (53.1%), while the most female-oriented occupations are Business & Financial (100.0%), Life, Physical & Social Science (100.0%), and Education, Arts & Media (100.0%).
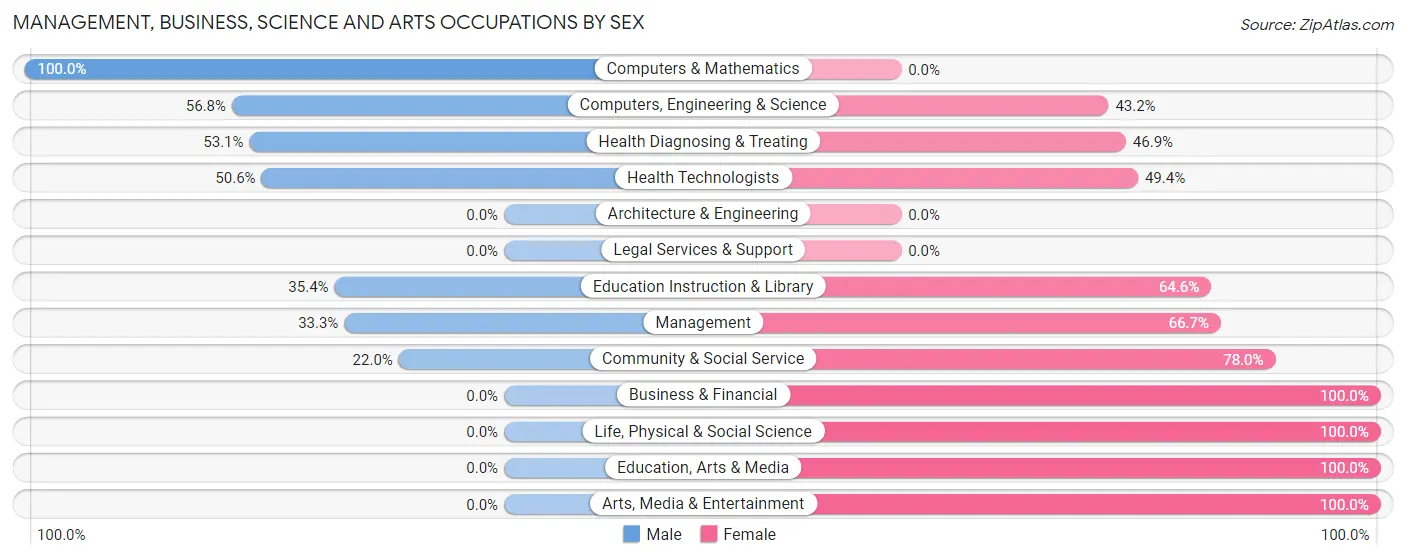
| Occupation | Male | Female |
| Management | 27 (33.3%) | 54 (66.7%) |
| Business & Financial | 0 (0.0%) | 23 (100.0%) |
| Computers, Engineering & Science | 21 (56.8%) | 16 (43.2%) |
| Computers & Mathematics | 21 (100.0%) | 0 (0.0%) |
| Architecture & Engineering | 0 (0.0%) | 0 (0.0%) |
| Life, Physical & Social Science | 0 (0.0%) | 16 (100.0%) |
| Community & Social Service | 29 (22.0%) | 103 (78.0%) |
| Education, Arts & Media | 0 (0.0%) | 40 (100.0%) |
| Legal Services & Support | 0 (0.0%) | 0 (0.0%) |
| Education Instruction & Library | 29 (35.4%) | 53 (64.6%) |
| Arts, Media & Entertainment | 0 (0.0%) | 10 (100.0%) |
| Health Diagnosing & Treating | 51 (53.1%) | 45 (46.9%) |
| Health Technologists | 42 (50.6%) | 41 (49.4%) |
| Total (Category) | 128 (34.7%) | 241 (65.3%) |
| Total (Overall) | 423 (39.4%) | 650 (60.6%) |
Services Occupations
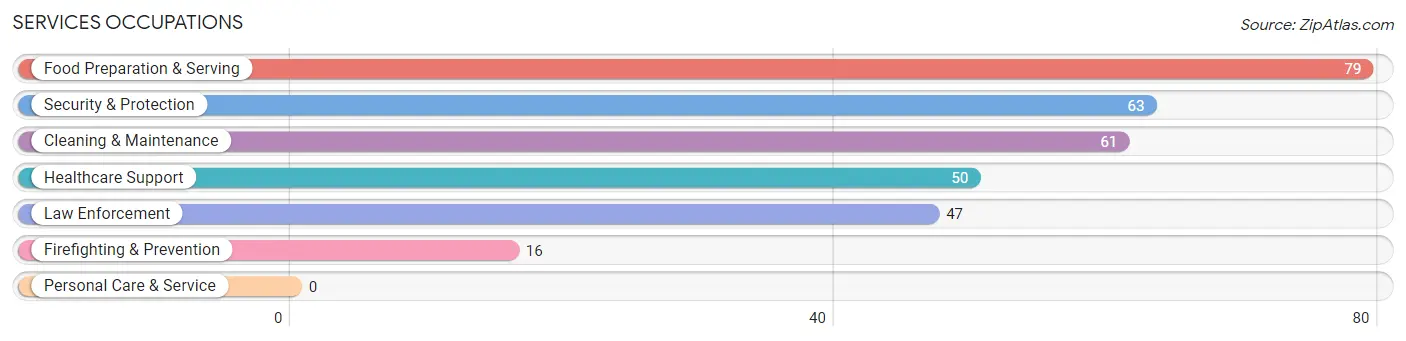
The most common Services occupations in Okanogan are Food Preparation & Serving (79 | 7.4%), Security & Protection (63 | 5.9%), Cleaning & Maintenance (61 | 5.7%), Healthcare Support (50 | 4.7%), and Law Enforcement (47 | 4.4%).
Services Occupations by Sex
Within the Services occupations in Okanogan, the most male-oriented occupations are Law Enforcement (100.0%), Security & Protection (74.6%), and Healthcare Support (16.0%), while the most female-oriented occupations are Firefighting & Prevention (100.0%), Food Preparation & Serving (100.0%), and Cleaning & Maintenance (100.0%).
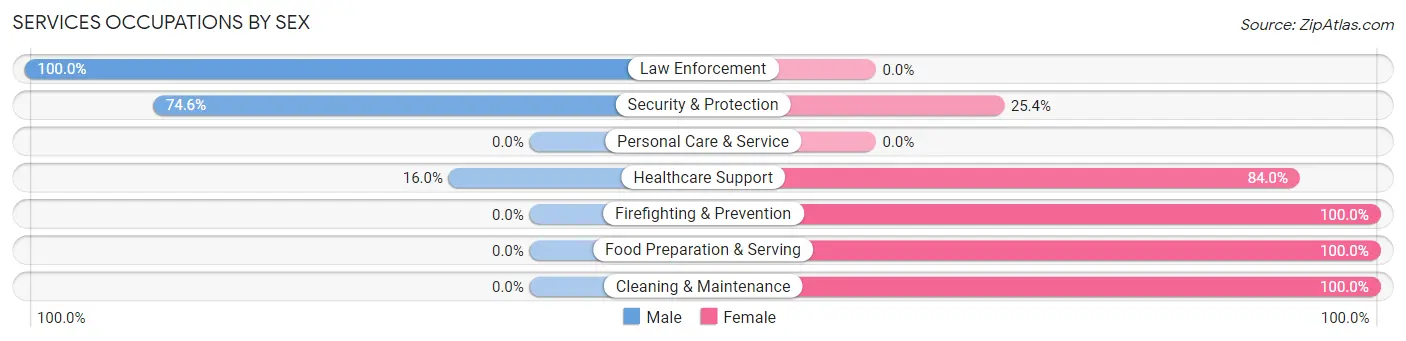
| Occupation | Male | Female |
| Healthcare Support | 8 (16.0%) | 42 (84.0%) |
| Security & Protection | 47 (74.6%) | 16 (25.4%) |
| Firefighting & Prevention | 0 (0.0%) | 16 (100.0%) |
| Law Enforcement | 47 (100.0%) | 0 (0.0%) |
| Food Preparation & Serving | 0 (0.0%) | 79 (100.0%) |
| Cleaning & Maintenance | 0 (0.0%) | 61 (100.0%) |
| Personal Care & Service | 0 (0.0%) | 0 (0.0%) |
| Total (Category) | 55 (21.7%) | 198 (78.3%) |
| Total (Overall) | 423 (39.4%) | 650 (60.6%) |
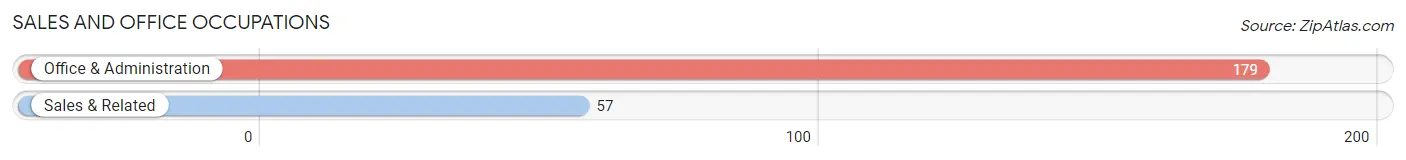
Sales and Office Occupations
The most common Sales and Office occupations in Okanogan are Office & Administration (179 | 16.7%), and Sales & Related (57 | 5.3%).
Sales and Office Occupations by Sex
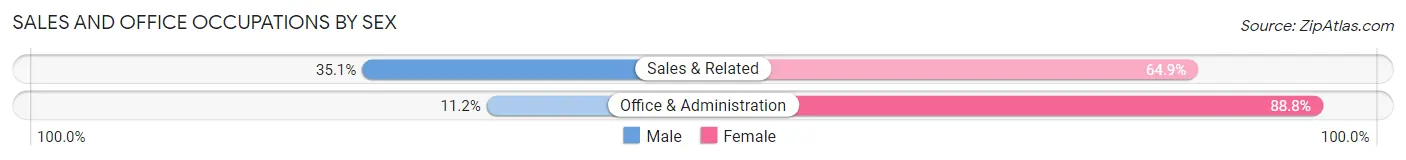
| Occupation | Male | Female |
| Sales & Related | 20 (35.1%) | 37 (64.9%) |
| Office & Administration | 20 (11.2%) | 159 (88.8%) |
| Total (Category) | 40 (17.0%) | 196 (83.1%) |
| Total (Overall) | 423 (39.4%) | 650 (60.6%) |
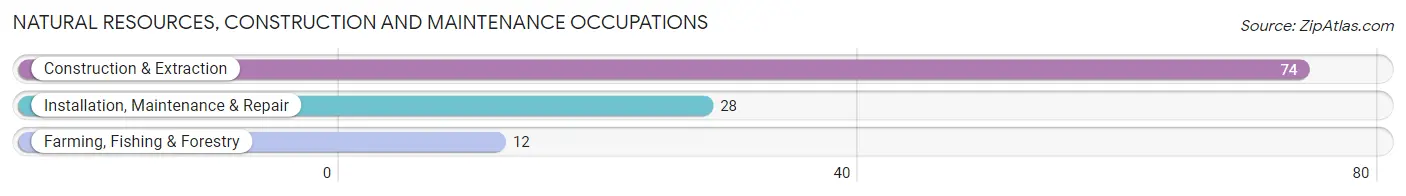
Natural Resources, Construction and Maintenance Occupations
The most common Natural Resources, Construction and Maintenance occupations in Okanogan are Construction & Extraction (74 | 6.9%), Installation, Maintenance & Repair (28 | 2.6%), and Farming, Fishing & Forestry (12 | 1.1%).
Natural Resources, Construction and Maintenance Occupations by Sex
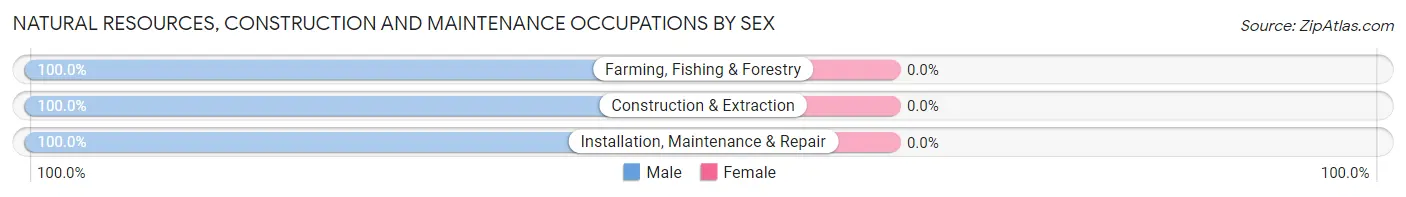
| Occupation | Male | Female |
| Farming, Fishing & Forestry | 12 (100.0%) | 0 (0.0%) |
| Construction & Extraction | 74 (100.0%) | 0 (0.0%) |
| Installation, Maintenance & Repair | 28 (100.0%) | 0 (0.0%) |
| Total (Category) | 114 (100.0%) | 0 (0.0%) |
| Total (Overall) | 423 (39.4%) | 650 (60.6%) |
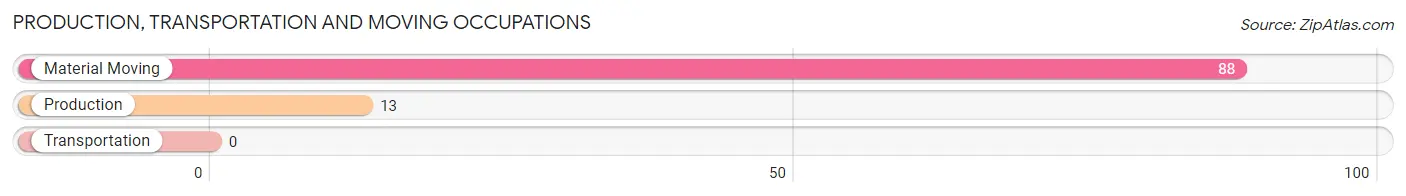
Production, Transportation and Moving Occupations
The most common Production, Transportation and Moving occupations in Okanogan are Material Moving (88 | 8.2%), and Production (13 | 1.2%).
Production, Transportation and Moving Occupations by Sex
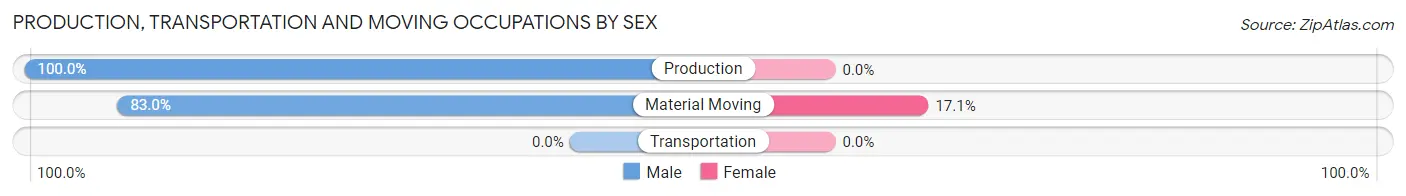
| Occupation | Male | Female |
| Production | 13 (100.0%) | 0 (0.0%) |
| Transportation | 0 (0.0%) | 0 (0.0%) |
| Material Moving | 73 (83.0%) | 15 (17.1%) |
| Total (Category) | 86 (85.2%) | 15 (14.8%) |
| Total (Overall) | 423 (39.4%) | 650 (60.6%) |
Employment Industries by Sex in Okanogan
Employment Industries in Okanogan
The major employment industries in Okanogan include Retail Trade (252 | 23.5%), Health Care & Social Assistance (219 | 20.4%), Public Administration (151 | 14.1%), Construction (82 | 7.6%), and Accommodation & Food Services (72 | 6.7%).
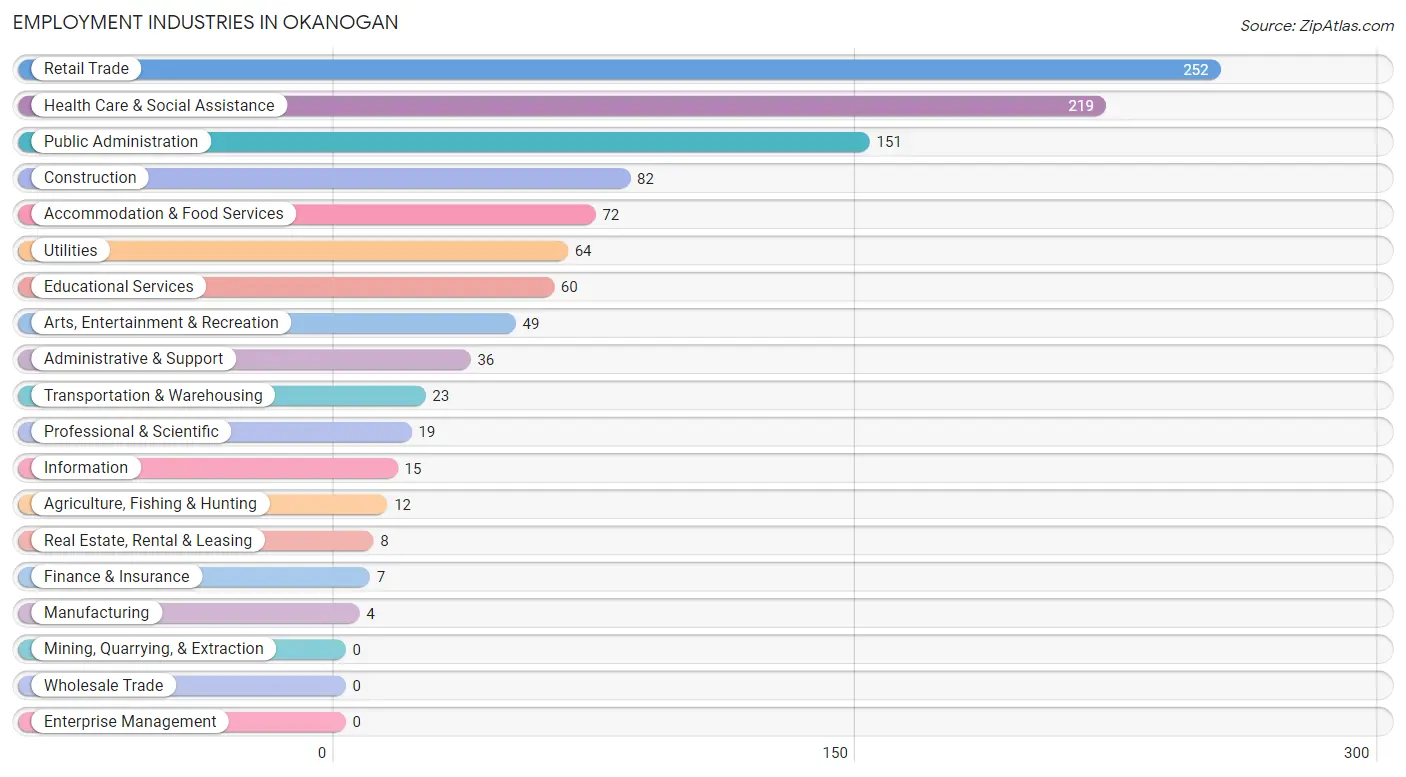
Employment Industries by Sex in Okanogan
The Okanogan industries that see more men than women are Agriculture, Fishing & Hunting (100.0%), Construction (100.0%), and Utilities (81.2%), whereas the industries that tend to have a higher number of women are Manufacturing (100.0%), Information (100.0%), and Finance & Insurance (100.0%).
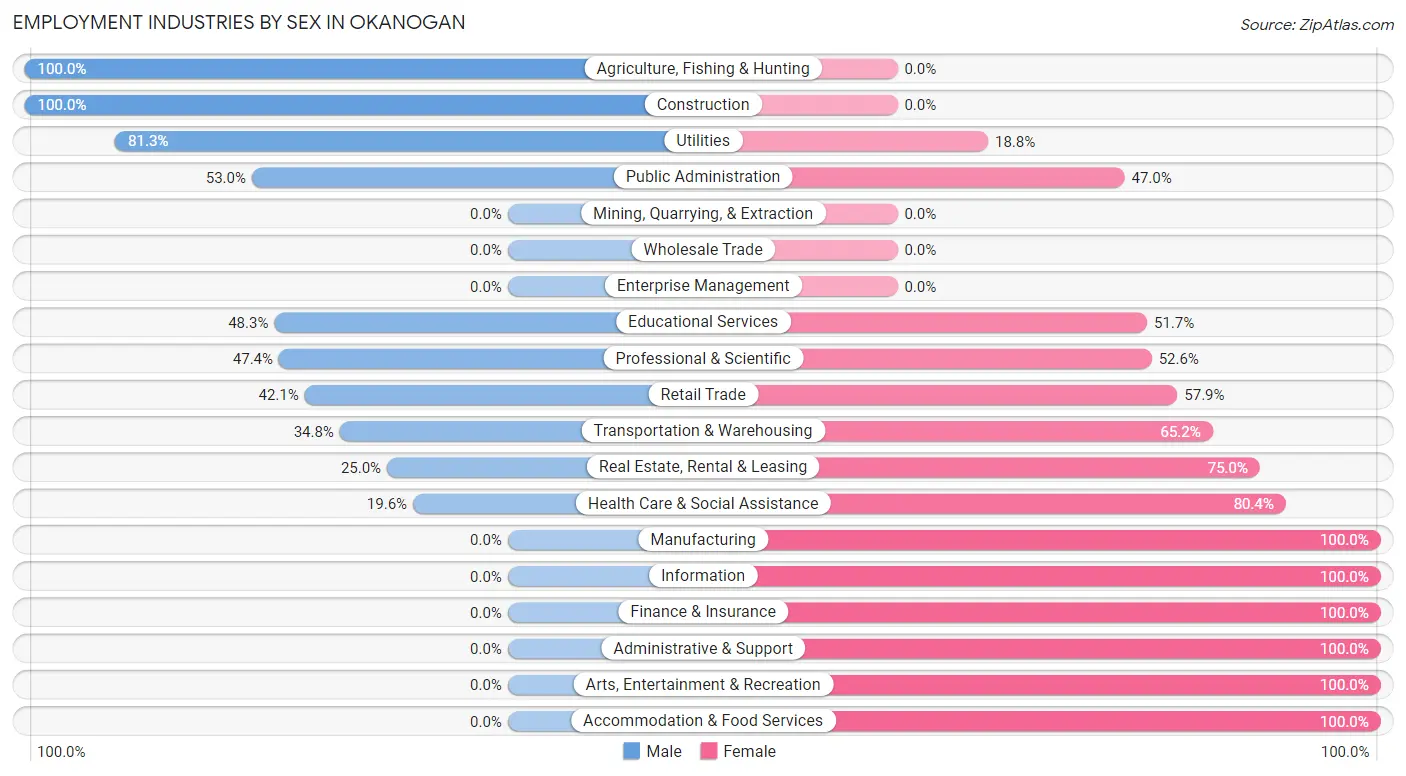
| Industry | Male | Female |
| Agriculture, Fishing & Hunting | 12 (100.0%) | 0 (0.0%) |
| Mining, Quarrying, & Extraction | 0 (0.0%) | 0 (0.0%) |
| Construction | 82 (100.0%) | 0 (0.0%) |
| Manufacturing | 0 (0.0%) | 4 (100.0%) |
| Wholesale Trade | 0 (0.0%) | 0 (0.0%) |
| Retail Trade | 106 (42.1%) | 146 (57.9%) |
| Transportation & Warehousing | 8 (34.8%) | 15 (65.2%) |
| Utilities | 52 (81.2%) | 12 (18.8%) |
| Information | 0 (0.0%) | 15 (100.0%) |
| Finance & Insurance | 0 (0.0%) | 7 (100.0%) |
| Real Estate, Rental & Leasing | 2 (25.0%) | 6 (75.0%) |
| Professional & Scientific | 9 (47.4%) | 10 (52.6%) |
| Enterprise Management | 0 (0.0%) | 0 (0.0%) |
| Administrative & Support | 0 (0.0%) | 36 (100.0%) |
| Educational Services | 29 (48.3%) | 31 (51.7%) |
| Health Care & Social Assistance | 43 (19.6%) | 176 (80.4%) |
| Arts, Entertainment & Recreation | 0 (0.0%) | 49 (100.0%) |
| Accommodation & Food Services | 0 (0.0%) | 72 (100.0%) |
| Public Administration | 80 (53.0%) | 71 (47.0%) |
| Total | 423 (39.4%) | 650 (60.6%) |
Education in Okanogan
School Enrollment in Okanogan
The most common levels of schooling among the 682 students in Okanogan are high school (232 | 34.0%), middle school (222 | 32.6%), and elementary school (170 | 24.9%).
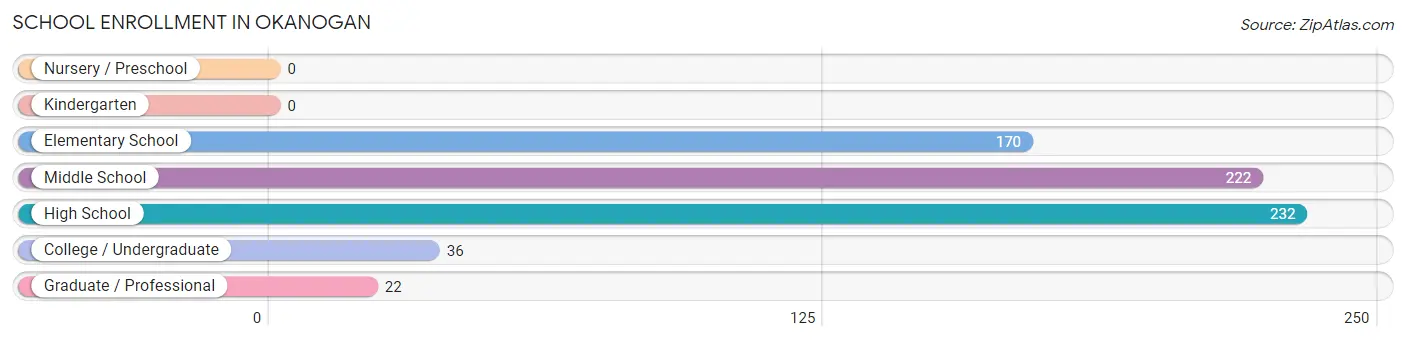
| School Level | # Students | % Students |
| Nursery / Preschool | 0 | 0.0% |
| Kindergarten | 0 | 0.0% |
| Elementary School | 170 | 24.9% |
| Middle School | 222 | 32.6% |
| High School | 232 | 34.0% |
| College / Undergraduate | 36 | 5.3% |
| Graduate / Professional | 22 | 3.2% |
| Total | 682 | 100.0% |
School Enrollment by Age by Funding Source in Okanogan
Out of a total of 682 students who are enrolled in schools in Okanogan, 66 (9.7%) attend a private institution, while the remaining 616 (90.3%) are enrolled in public schools. The age group of 25 to 34 year olds has the highest likelihood of being enrolled in private schools, with 11 (64.7% in the age bracket) enrolled. Conversely, the age group of 5 to 9 year old has the lowest likelihood of being enrolled in a private school, with 133 (100.0% in the age bracket) attending a public institution.
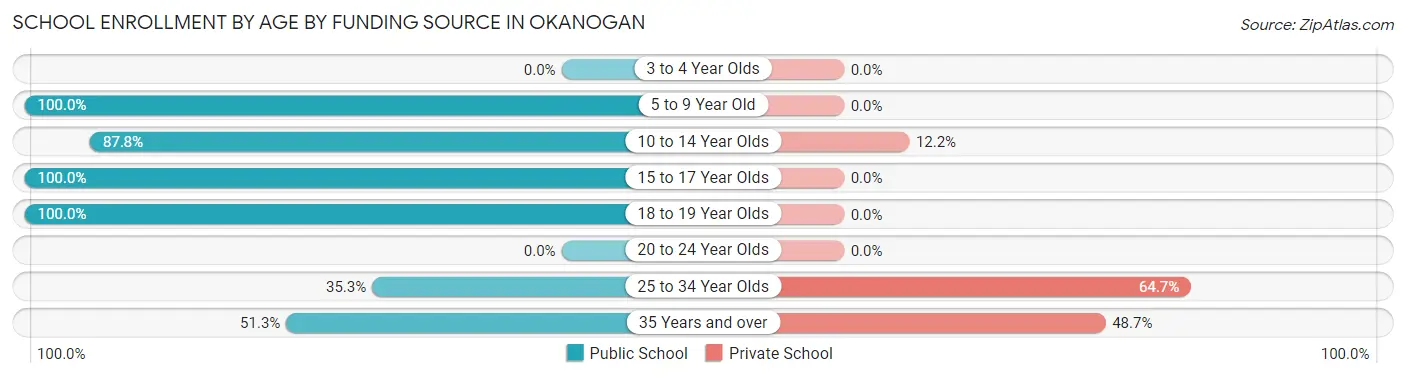
| Age Bracket | Public School | Private School |
| 3 to 4 Year Olds | 0 (0.0%) | 0 (0.0%) |
| 5 to 9 Year Old | 133 (100.0%) | 0 (0.0%) |
| 10 to 14 Year Olds | 260 (87.8%) | 36 (12.2%) |
| 15 to 17 Year Olds | 163 (100.0%) | 0 (0.0%) |
| 18 to 19 Year Olds | 34 (100.0%) | 0 (0.0%) |
| 20 to 24 Year Olds | 0 (0.0%) | 0 (0.0%) |
| 25 to 34 Year Olds | 6 (35.3%) | 11 (64.7%) |
| 35 Years and over | 20 (51.3%) | 19 (48.7%) |
| Total | 616 (90.3%) | 66 (9.7%) |
Educational Attainment by Field of Study in Okanogan
Psychology (70 | 15.2%), social sciences (61 | 13.3%), education (54 | 11.7%), arts & humanities (51 | 11.1%), and engineering (48 | 10.4%) are the most common fields of study among 460 individuals in Okanogan who have obtained a bachelor's degree or higher.
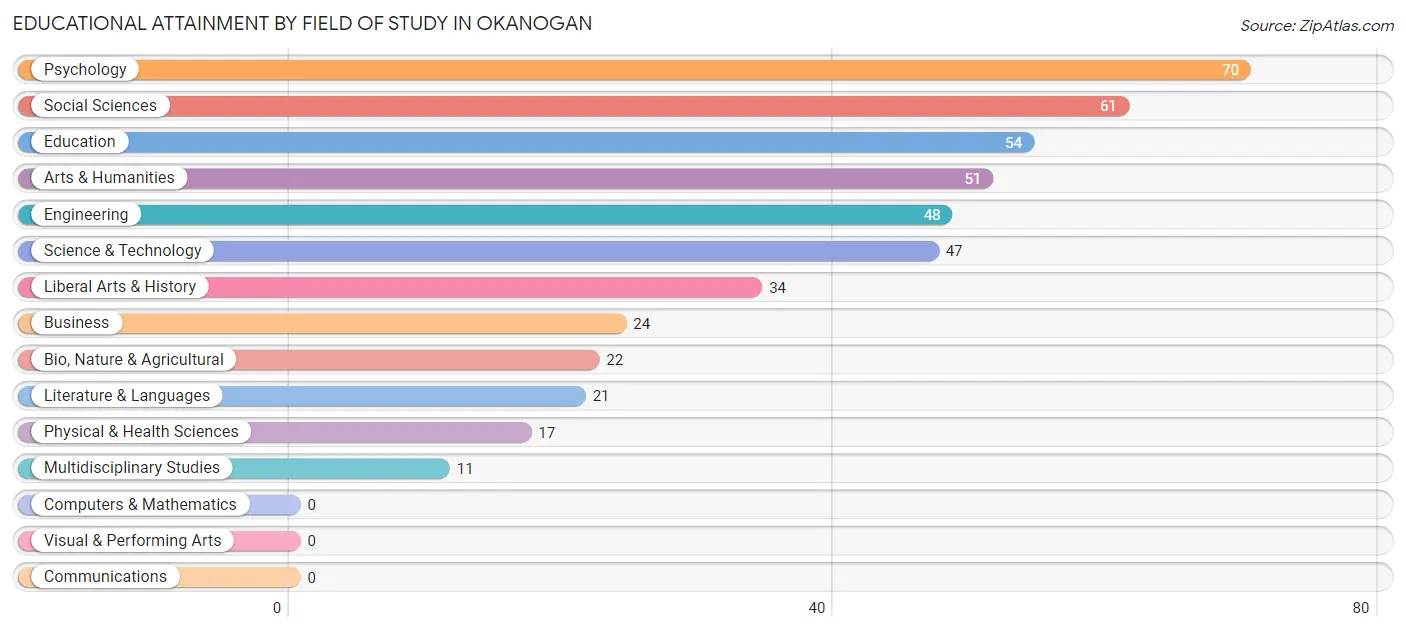
| Field of Study | # Graduates | % Graduates |
| Computers & Mathematics | 0 | 0.0% |
| Bio, Nature & Agricultural | 22 | 4.8% |
| Physical & Health Sciences | 17 | 3.7% |
| Psychology | 70 | 15.2% |
| Social Sciences | 61 | 13.3% |
| Engineering | 48 | 10.4% |
| Multidisciplinary Studies | 11 | 2.4% |
| Science & Technology | 47 | 10.2% |
| Business | 24 | 5.2% |
| Education | 54 | 11.7% |
| Literature & Languages | 21 | 4.6% |
| Liberal Arts & History | 34 | 7.4% |
| Visual & Performing Arts | 0 | 0.0% |
| Communications | 0 | 0.0% |
| Arts & Humanities | 51 | 11.1% |
| Total | 460 | 100.0% |
Transportation & Commute in Okanogan
Vehicle Availability by Sex in Okanogan
The most prevalent vehicle ownership categories in Okanogan are males with 2 vehicles (161, accounting for 38.1%) and females with 2 vehicles (239, making up 25.6%).
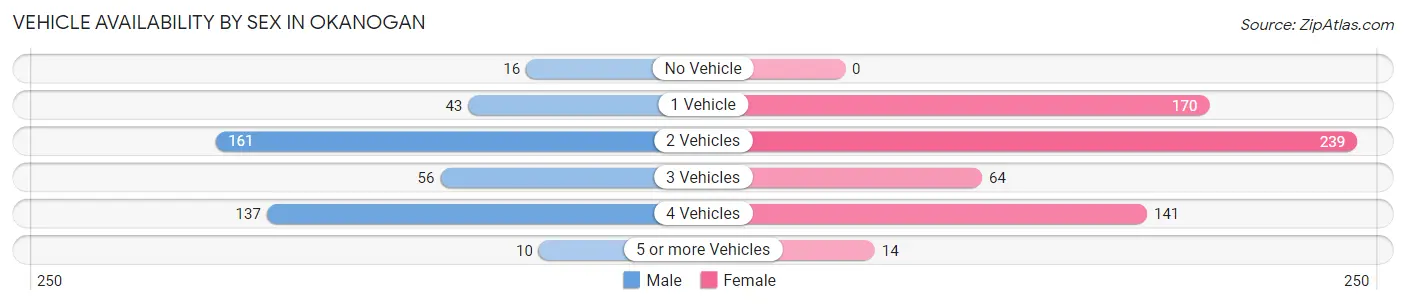
| Vehicles Available | Male | Female |
| No Vehicle | 16 (3.8%) | 0 (0.0%) |
| 1 Vehicle | 43 (10.2%) | 170 (27.1%) |
| 2 Vehicles | 161 (38.1%) | 239 (38.1%) |
| 3 Vehicles | 56 (13.2%) | 64 (10.2%) |
| 4 Vehicles | 137 (32.4%) | 141 (22.5%) |
| 5 or more Vehicles | 10 (2.4%) | 14 (2.2%) |
| Total | 423 (100.0%) | 628 (100.0%) |
Commute Time in Okanogan
The most frequently occuring commute durations in Okanogan are 10 to 14 minutes (279 commuters, 28.0%), 5 to 9 minutes (255 commuters, 25.6%), and 15 to 19 minutes (150 commuters, 15.1%).
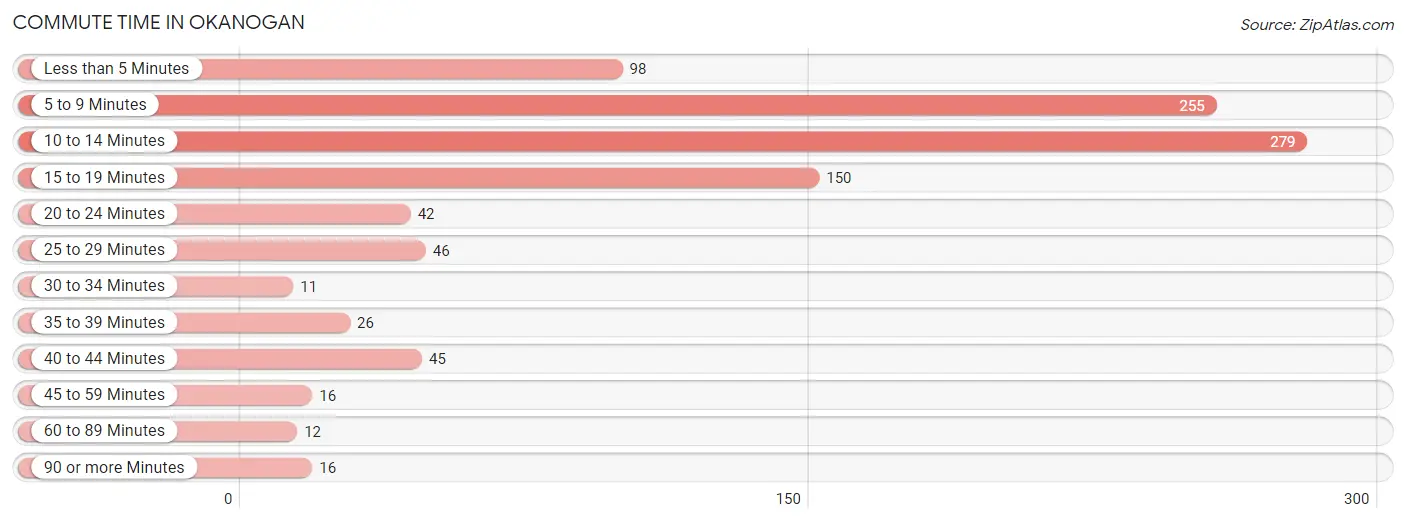
| Commute Time | # Commuters | % Commuters |
| Less than 5 Minutes | 98 | 9.8% |
| 5 to 9 Minutes | 255 | 25.6% |
| 10 to 14 Minutes | 279 | 28.0% |
| 15 to 19 Minutes | 150 | 15.1% |
| 20 to 24 Minutes | 42 | 4.2% |
| 25 to 29 Minutes | 46 | 4.6% |
| 30 to 34 Minutes | 11 | 1.1% |
| 35 to 39 Minutes | 26 | 2.6% |
| 40 to 44 Minutes | 45 | 4.5% |
| 45 to 59 Minutes | 16 | 1.6% |
| 60 to 89 Minutes | 12 | 1.2% |
| 90 or more Minutes | 16 | 1.6% |
Commute Time by Sex in Okanogan
The most common commute times in Okanogan are 10 to 14 minutes (114 commuters, 28.1%) for males and 5 to 9 minutes (180 commuters, 30.5%) for females.
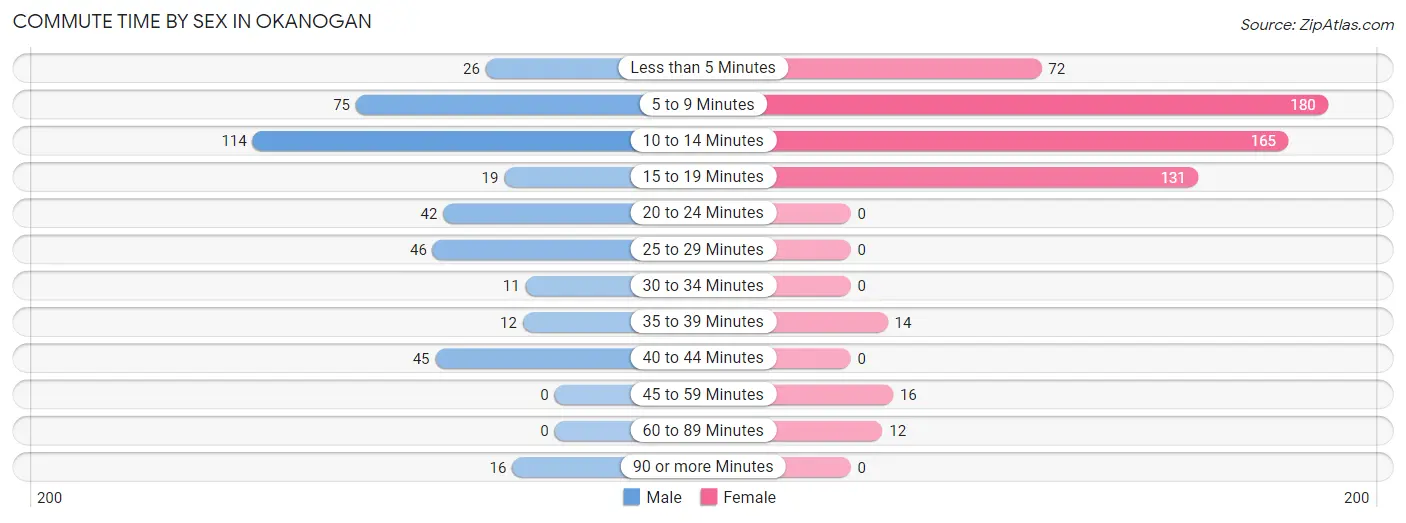
| Commute Time | Male | Female |
| Less than 5 Minutes | 26 (6.4%) | 72 (12.2%) |
| 5 to 9 Minutes | 75 (18.5%) | 180 (30.5%) |
| 10 to 14 Minutes | 114 (28.1%) | 165 (28.0%) |
| 15 to 19 Minutes | 19 (4.7%) | 131 (22.2%) |
| 20 to 24 Minutes | 42 (10.3%) | 0 (0.0%) |
| 25 to 29 Minutes | 46 (11.3%) | 0 (0.0%) |
| 30 to 34 Minutes | 11 (2.7%) | 0 (0.0%) |
| 35 to 39 Minutes | 12 (3.0%) | 14 (2.4%) |
| 40 to 44 Minutes | 45 (11.1%) | 0 (0.0%) |
| 45 to 59 Minutes | 0 (0.0%) | 16 (2.7%) |
| 60 to 89 Minutes | 0 (0.0%) | 12 (2.0%) |
| 90 or more Minutes | 16 (3.9%) | 0 (0.0%) |
Time of Departure to Work by Sex in Okanogan
The most frequent times of departure to work in Okanogan are 7:00 AM to 7:29 AM (124, 30.5%) for males and 7:30 AM to 7:59 AM (160, 27.1%) for females.
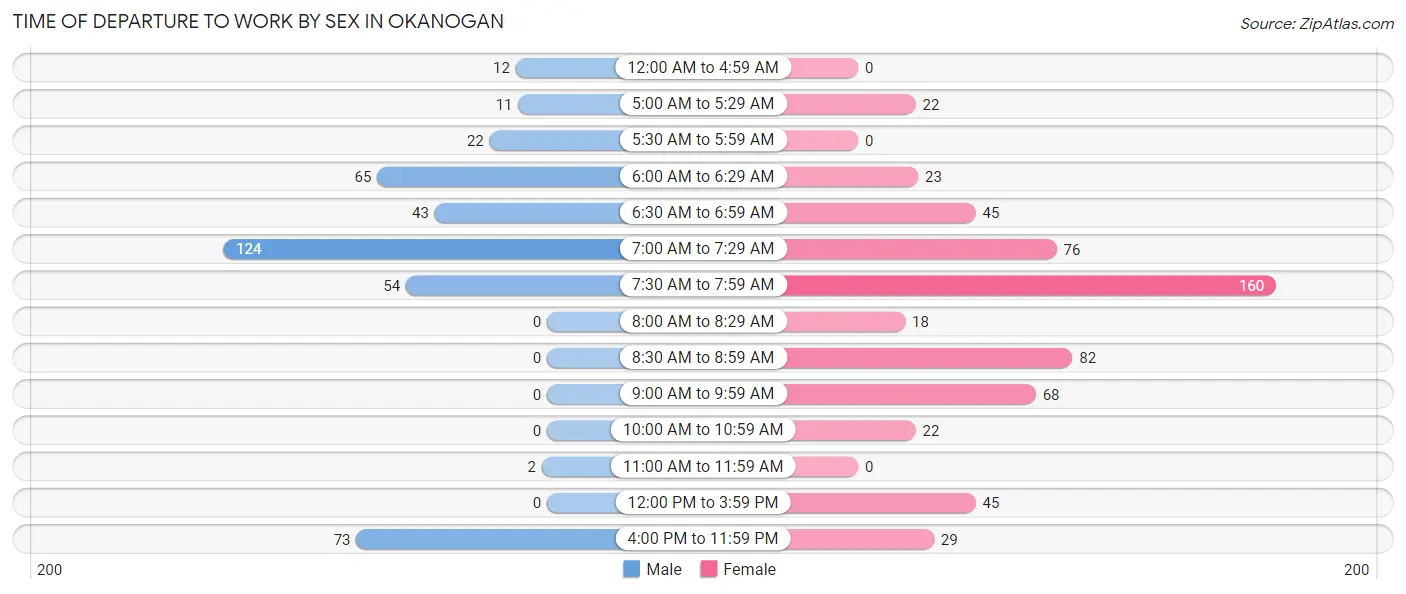
| Time of Departure | Male | Female |
| 12:00 AM to 4:59 AM | 12 (3.0%) | 0 (0.0%) |
| 5:00 AM to 5:29 AM | 11 (2.7%) | 22 (3.7%) |
| 5:30 AM to 5:59 AM | 22 (5.4%) | 0 (0.0%) |
| 6:00 AM to 6:29 AM | 65 (16.0%) | 23 (3.9%) |
| 6:30 AM to 6:59 AM | 43 (10.6%) | 45 (7.6%) |
| 7:00 AM to 7:29 AM | 124 (30.5%) | 76 (12.9%) |
| 7:30 AM to 7:59 AM | 54 (13.3%) | 160 (27.1%) |
| 8:00 AM to 8:29 AM | 0 (0.0%) | 18 (3.0%) |
| 8:30 AM to 8:59 AM | 0 (0.0%) | 82 (13.9%) |
| 9:00 AM to 9:59 AM | 0 (0.0%) | 68 (11.5%) |
| 10:00 AM to 10:59 AM | 0 (0.0%) | 22 (3.7%) |
| 11:00 AM to 11:59 AM | 2 (0.5%) | 0 (0.0%) |
| 12:00 PM to 3:59 PM | 0 (0.0%) | 45 (7.6%) |
| 4:00 PM to 11:59 PM | 73 (18.0%) | 29 (4.9%) |
| Total | 406 (100.0%) | 590 (100.0%) |
Housing Occupancy in Okanogan
Occupancy by Ownership in Okanogan
Of the total 1,045 dwellings in Okanogan, owner-occupied units account for 628 (60.1%), while renter-occupied units make up 417 (39.9%).
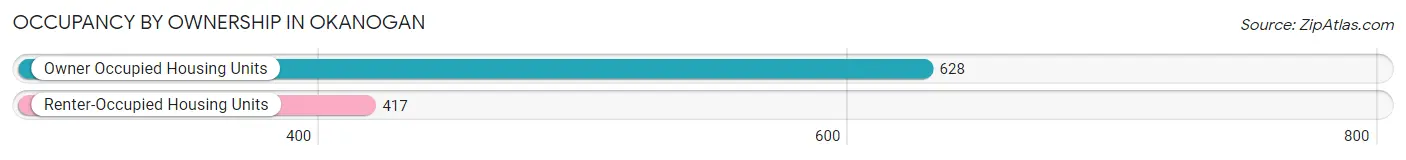
| Occupancy | # Housing Units | % Housing Units |
| Owner Occupied Housing Units | 628 | 60.1% |
| Renter-Occupied Housing Units | 417 | 39.9% |
| Total Occupied Housing Units | 1,045 | 100.0% |
Occupancy by Household Size in Okanogan
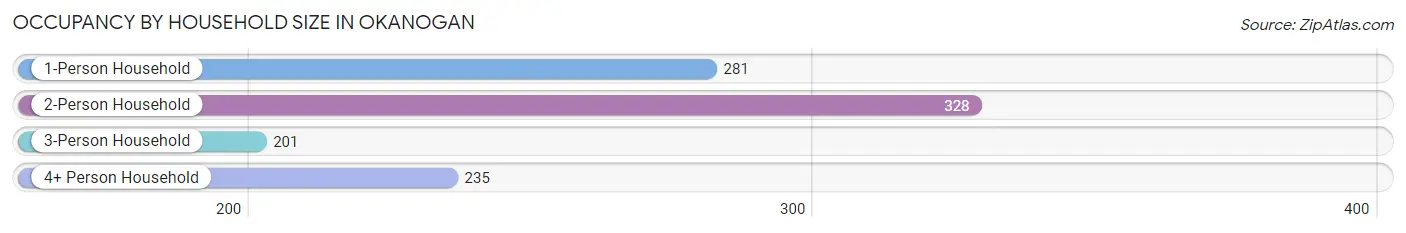
| Household Size | # Housing Units | % Housing Units |
| 1-Person Household | 281 | 26.9% |
| 2-Person Household | 328 | 31.4% |
| 3-Person Household | 201 | 19.2% |
| 4+ Person Household | 235 | 22.5% |
| Total Housing Units | 1,045 | 100.0% |
Occupancy by Ownership by Household Size in Okanogan
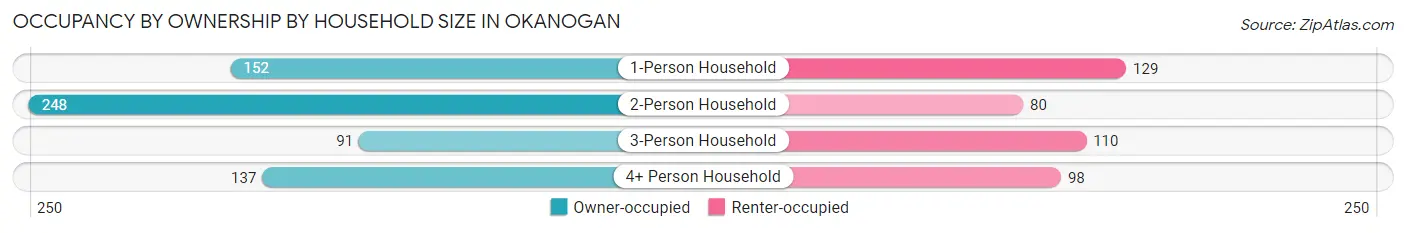
| Household Size | Owner-occupied | Renter-occupied |
| 1-Person Household | 152 (54.1%) | 129 (45.9%) |
| 2-Person Household | 248 (75.6%) | 80 (24.4%) |
| 3-Person Household | 91 (45.3%) | 110 (54.7%) |
| 4+ Person Household | 137 (58.3%) | 98 (41.7%) |
| Total Housing Units | 628 (60.1%) | 417 (39.9%) |
Occupancy by Educational Attainment in Okanogan
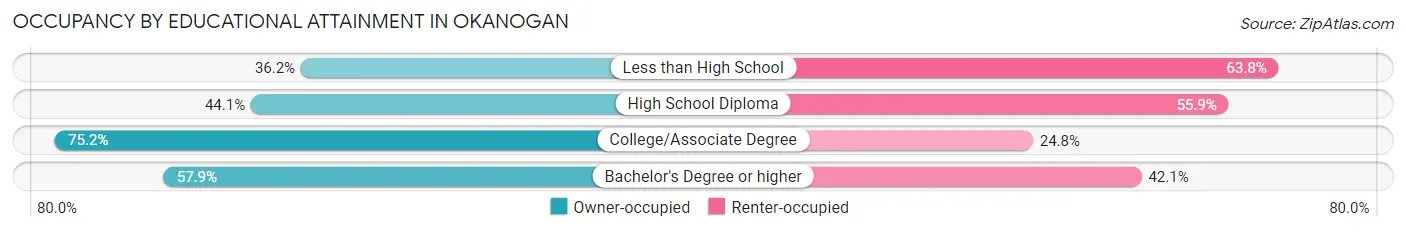
| Household Size | Owner-occupied | Renter-occupied |
| Less than High School | 51 (36.2%) | 90 (63.8%) |
| High School Diploma | 82 (44.1%) | 104 (55.9%) |
| College/Associate Degree | 345 (75.2%) | 114 (24.8%) |
| Bachelor's Degree or higher | 150 (57.9%) | 109 (42.1%) |
Occupancy by Age of Householder in Okanogan
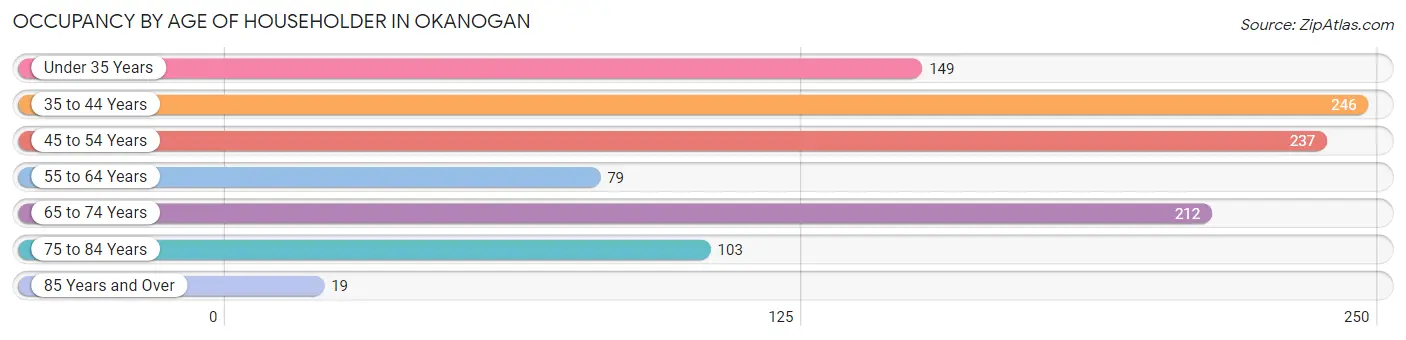
| Age Bracket | # Households | % Households |
| Under 35 Years | 149 | 14.3% |
| 35 to 44 Years | 246 | 23.5% |
| 45 to 54 Years | 237 | 22.7% |
| 55 to 64 Years | 79 | 7.6% |
| 65 to 74 Years | 212 | 20.3% |
| 75 to 84 Years | 103 | 9.9% |
| 85 Years and Over | 19 | 1.8% |
| Total | 1,045 | 100.0% |
Housing Finances in Okanogan
Median Income by Occupancy in Okanogan
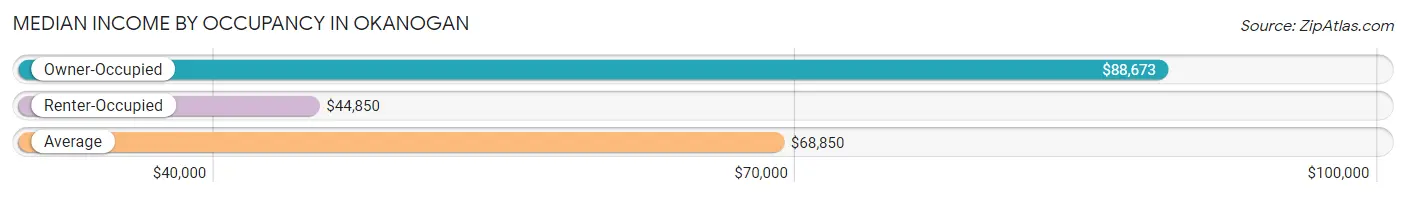
| Occupancy Type | # Households | Median Income |
| Owner-Occupied | 628 (60.1%) | $88,673 |
| Renter-Occupied | 417 (39.9%) | $44,850 |
| Average | 1,045 (100.0%) | $68,850 |
Occupancy by Householder Income Bracket in Okanogan
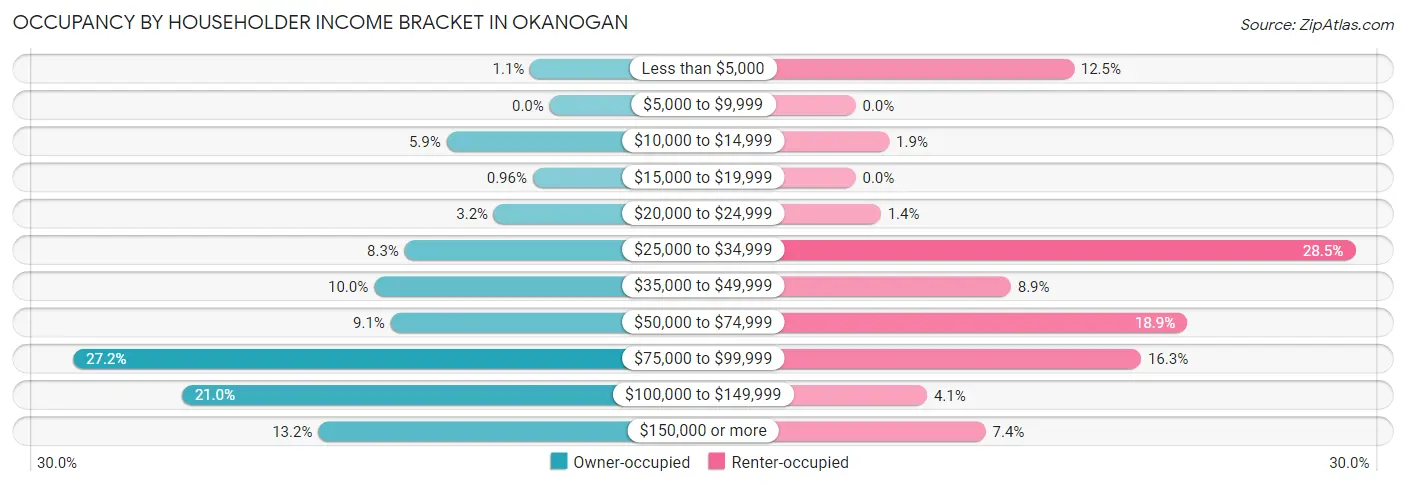
| Income Bracket | Owner-occupied | Renter-occupied |
| Less than $5,000 | 7 (1.1%) | 52 (12.5%) |
| $5,000 to $9,999 | 0 (0.0%) | 0 (0.0%) |
| $10,000 to $14,999 | 37 (5.9%) | 8 (1.9%) |
| $15,000 to $19,999 | 6 (1.0%) | 0 (0.0%) |
| $20,000 to $24,999 | 20 (3.2%) | 6 (1.4%) |
| $25,000 to $34,999 | 52 (8.3%) | 119 (28.5%) |
| $35,000 to $49,999 | 63 (10.0%) | 37 (8.9%) |
| $50,000 to $74,999 | 57 (9.1%) | 79 (18.9%) |
| $75,000 to $99,999 | 171 (27.2%) | 68 (16.3%) |
| $100,000 to $149,999 | 132 (21.0%) | 17 (4.1%) |
| $150,000 or more | 83 (13.2%) | 31 (7.4%) |
| Total | 628 (100.0%) | 417 (100.0%) |
Monthly Housing Cost Tiers in Okanogan
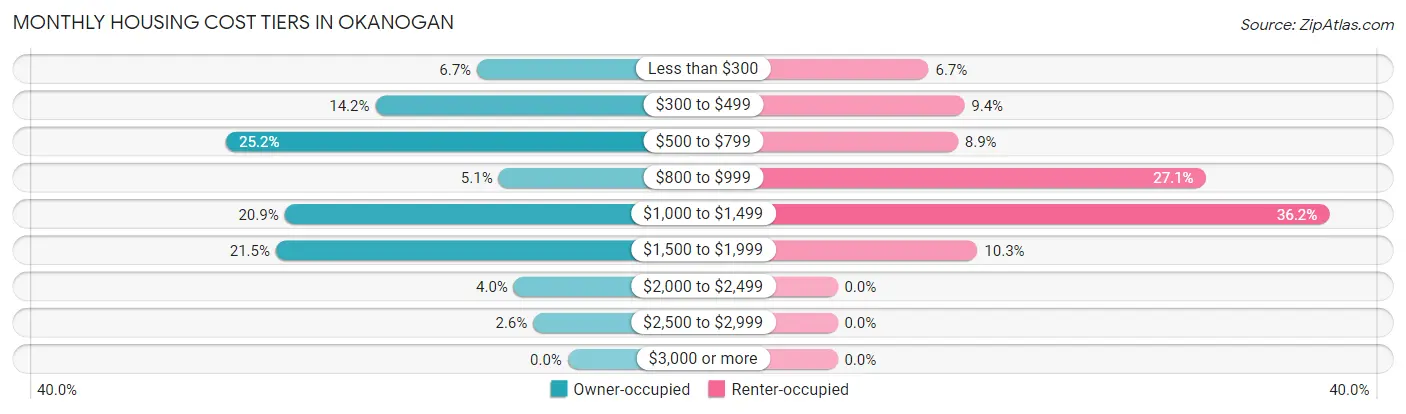
| Monthly Cost | Owner-occupied | Renter-occupied |
| Less than $300 | 42 (6.7%) | 28 (6.7%) |
| $300 to $499 | 89 (14.2%) | 39 (9.3%) |
| $500 to $799 | 158 (25.2%) | 37 (8.9%) |
| $800 to $999 | 32 (5.1%) | 113 (27.1%) |
| $1,000 to $1,499 | 131 (20.9%) | 151 (36.2%) |
| $1,500 to $1,999 | 135 (21.5%) | 43 (10.3%) |
| $2,000 to $2,499 | 25 (4.0%) | 0 (0.0%) |
| $2,500 to $2,999 | 16 (2.5%) | 0 (0.0%) |
| $3,000 or more | 0 (0.0%) | 0 (0.0%) |
| Total | 628 (100.0%) | 417 (100.0%) |
Physical Housing Characteristics in Okanogan
Housing Structures in Okanogan
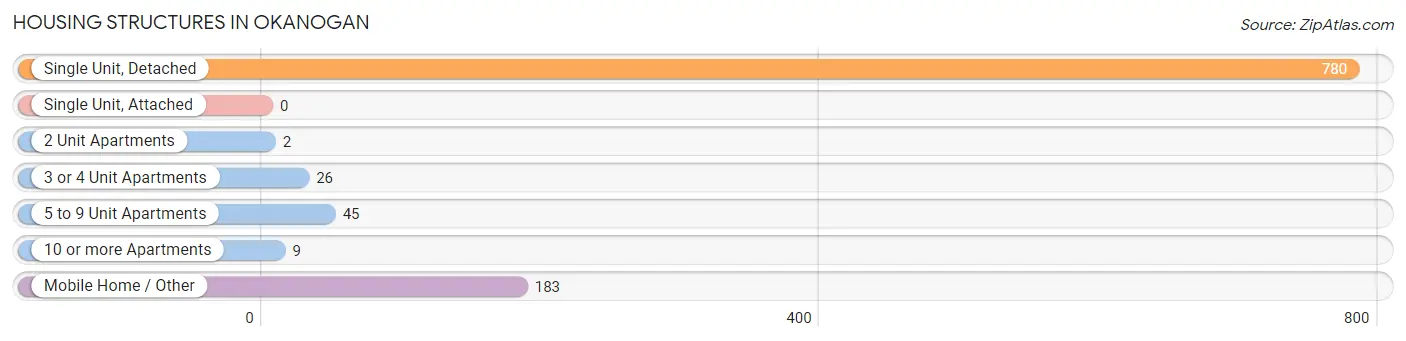
| Structure Type | # Housing Units | % Housing Units |
| Single Unit, Detached | 780 | 74.6% |
| Single Unit, Attached | 0 | 0.0% |
| 2 Unit Apartments | 2 | 0.2% |
| 3 or 4 Unit Apartments | 26 | 2.5% |
| 5 to 9 Unit Apartments | 45 | 4.3% |
| 10 or more Apartments | 9 | 0.9% |
| Mobile Home / Other | 183 | 17.5% |
| Total | 1,045 | 100.0% |
Housing Structures by Occupancy in Okanogan
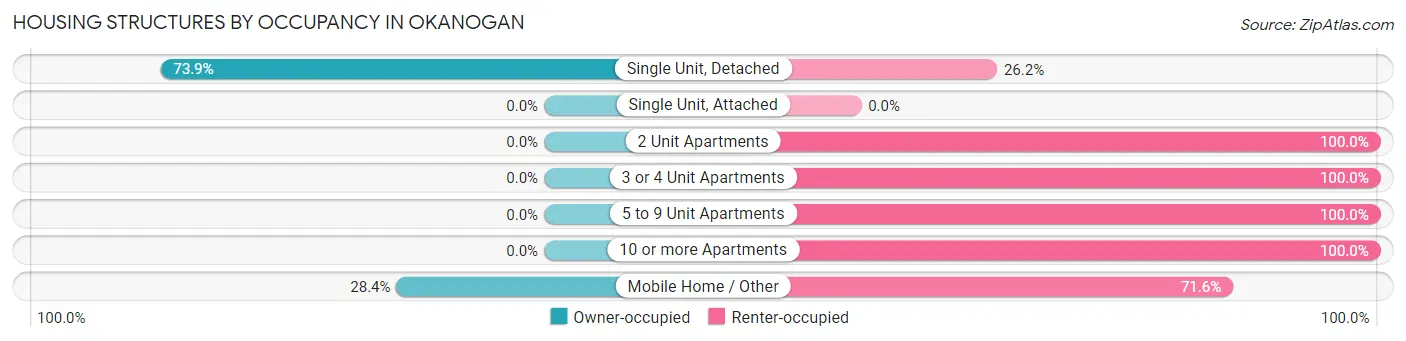
| Structure Type | Owner-occupied | Renter-occupied |
| Single Unit, Detached | 576 (73.9%) | 204 (26.2%) |
| Single Unit, Attached | 0 (0.0%) | 0 (0.0%) |
| 2 Unit Apartments | 0 (0.0%) | 2 (100.0%) |
| 3 or 4 Unit Apartments | 0 (0.0%) | 26 (100.0%) |
| 5 to 9 Unit Apartments | 0 (0.0%) | 45 (100.0%) |
| 10 or more Apartments | 0 (0.0%) | 9 (100.0%) |
| Mobile Home / Other | 52 (28.4%) | 131 (71.6%) |
| Total | 628 (60.1%) | 417 (39.9%) |
Housing Structures by Number of Rooms in Okanogan
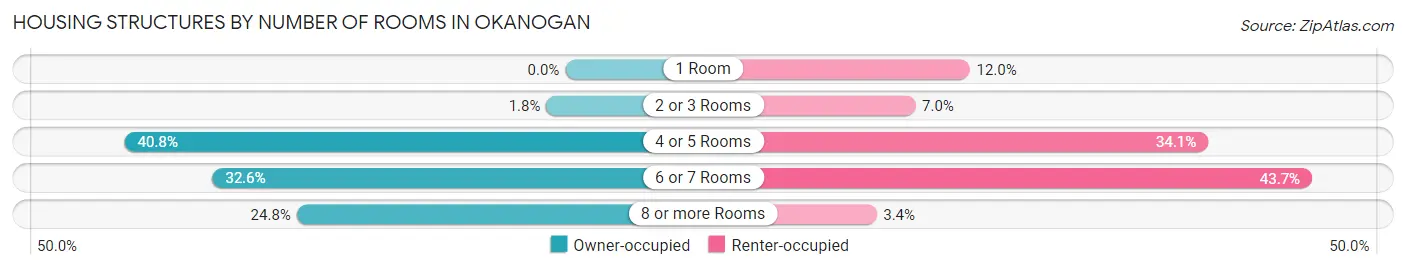
| Number of Rooms | Owner-occupied | Renter-occupied |
| 1 Room | 0 (0.0%) | 50 (12.0%) |
| 2 or 3 Rooms | 11 (1.8%) | 29 (7.0%) |
| 4 or 5 Rooms | 256 (40.8%) | 142 (34.1%) |
| 6 or 7 Rooms | 205 (32.6%) | 182 (43.6%) |
| 8 or more Rooms | 156 (24.8%) | 14 (3.4%) |
| Total | 628 (100.0%) | 417 (100.0%) |
Housing Structure by Heating Type in Okanogan
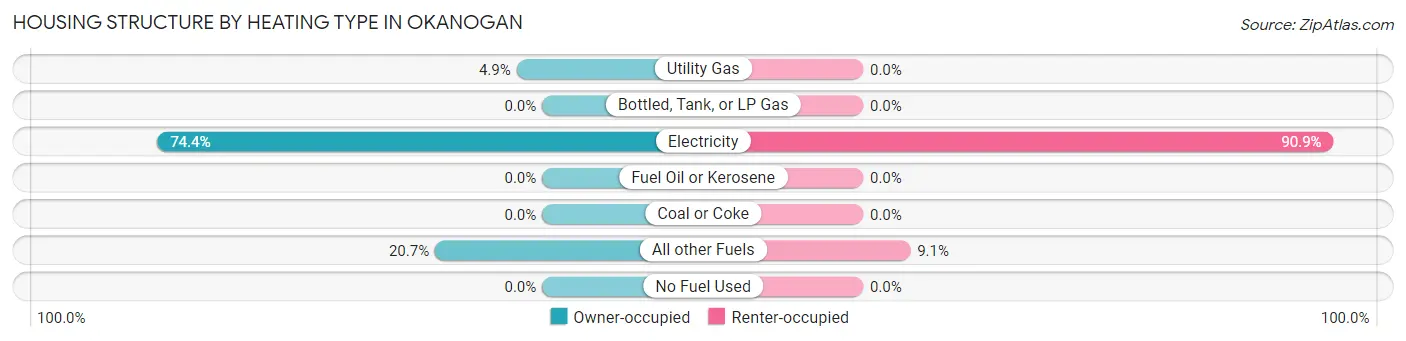
| Heating Type | Owner-occupied | Renter-occupied |
| Utility Gas | 31 (4.9%) | 0 (0.0%) |
| Bottled, Tank, or LP Gas | 0 (0.0%) | 0 (0.0%) |
| Electricity | 467 (74.4%) | 379 (90.9%) |
| Fuel Oil or Kerosene | 0 (0.0%) | 0 (0.0%) |
| Coal or Coke | 0 (0.0%) | 0 (0.0%) |
| All other Fuels | 130 (20.7%) | 38 (9.1%) |
| No Fuel Used | 0 (0.0%) | 0 (0.0%) |
| Total | 628 (100.0%) | 417 (100.0%) |
Household Vehicle Usage in Okanogan
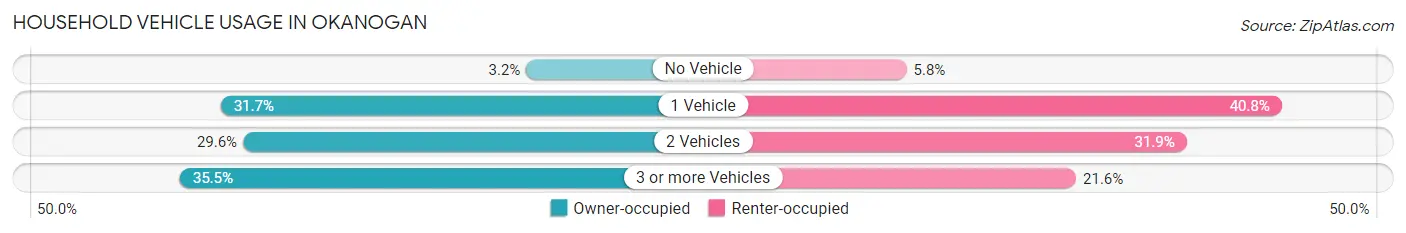
| Vehicles per Household | Owner-occupied | Renter-occupied |
| No Vehicle | 20 (3.2%) | 24 (5.8%) |
| 1 Vehicle | 199 (31.7%) | 170 (40.8%) |
| 2 Vehicles | 186 (29.6%) | 133 (31.9%) |
| 3 or more Vehicles | 223 (35.5%) | 90 (21.6%) |
| Total | 628 (100.0%) | 417 (100.0%) |
Real Estate & Mortgages in Okanogan
Real Estate and Mortgage Overview in Okanogan
| Characteristic | Without Mortgage | With Mortgage |
| Housing Units | 302 | 326 |
| Median Property Value | $226,900 | $213,400 |
| Median Household Income | $87,637 | $54 |
| Monthly Housing Costs | $553 | $0 |
| Real Estate Taxes | $2,435 | $22 |
Property Value by Mortgage Status in Okanogan
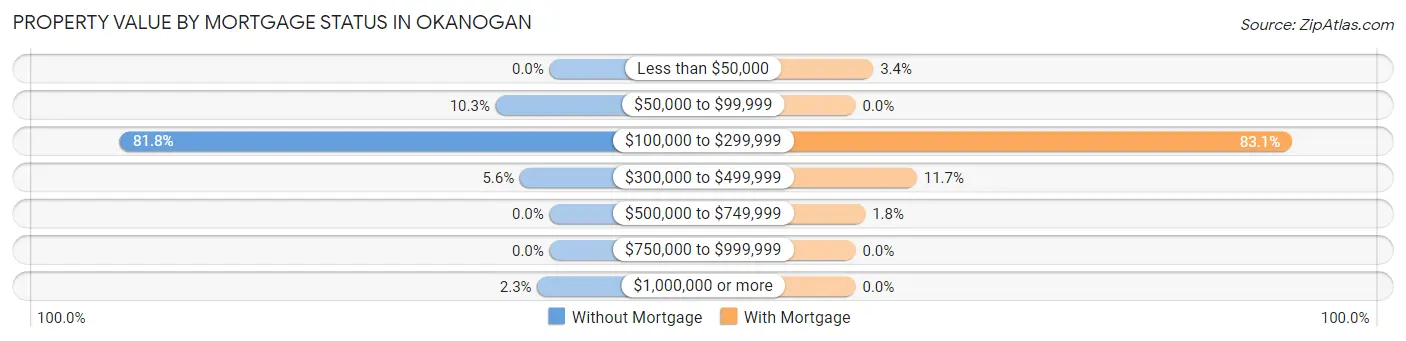
| Property Value | Without Mortgage | With Mortgage |
| Less than $50,000 | 0 (0.0%) | 11 (3.4%) |
| $50,000 to $99,999 | 31 (10.3%) | 0 (0.0%) |
| $100,000 to $299,999 | 247 (81.8%) | 271 (83.1%) |
| $300,000 to $499,999 | 17 (5.6%) | 38 (11.7%) |
| $500,000 to $749,999 | 0 (0.0%) | 6 (1.8%) |
| $750,000 to $999,999 | 0 (0.0%) | 0 (0.0%) |
| $1,000,000 or more | 7 (2.3%) | 0 (0.0%) |
| Total | 302 (100.0%) | 326 (100.0%) |
Household Income by Mortgage Status in Okanogan
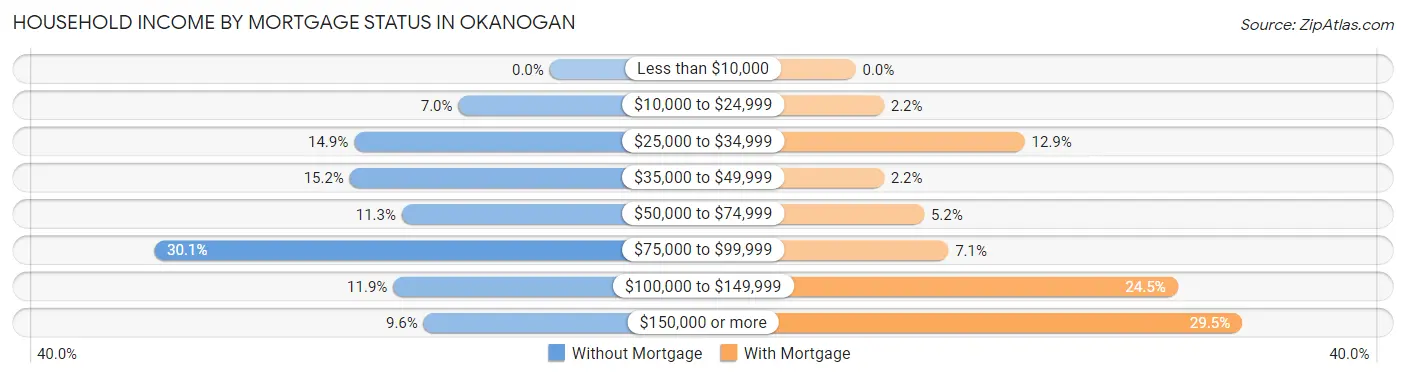
| Household Income | Without Mortgage | With Mortgage |
| Less than $10,000 | 0 (0.0%) | 0 (0.0%) |
| $10,000 to $24,999 | 21 (7.0%) | 7 (2.1%) |
| $25,000 to $34,999 | 45 (14.9%) | 42 (12.9%) |
| $35,000 to $49,999 | 46 (15.2%) | 7 (2.1%) |
| $50,000 to $74,999 | 34 (11.3%) | 17 (5.2%) |
| $75,000 to $99,999 | 91 (30.1%) | 23 (7.1%) |
| $100,000 to $149,999 | 36 (11.9%) | 80 (24.5%) |
| $150,000 or more | 29 (9.6%) | 96 (29.4%) |
| Total | 302 (100.0%) | 326 (100.0%) |
Property Value to Household Income Ratio in Okanogan
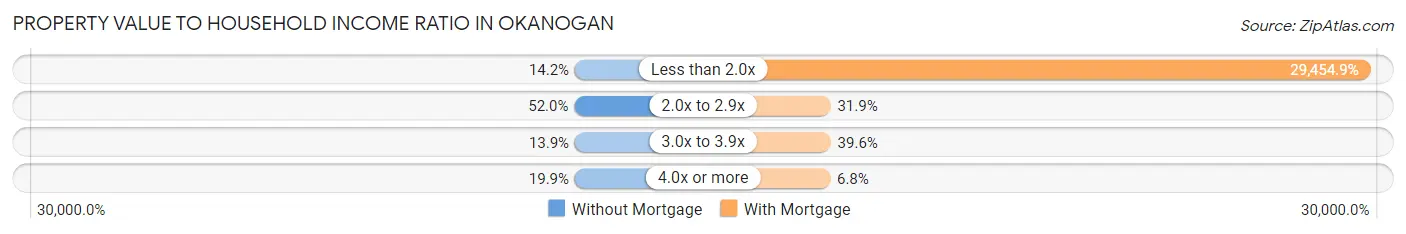
| Value-to-Income Ratio | Without Mortgage | With Mortgage |
| Less than 2.0x | 43 (14.2%) | 96,023 (29,454.9%) |
| 2.0x to 2.9x | 157 (52.0%) | 104 (31.9%) |
| 3.0x to 3.9x | 42 (13.9%) | 129 (39.6%) |
| 4.0x or more | 60 (19.9%) | 22 (6.8%) |
| Total | 302 (100.0%) | 326 (100.0%) |
Real Estate Taxes by Mortgage Status in Okanogan
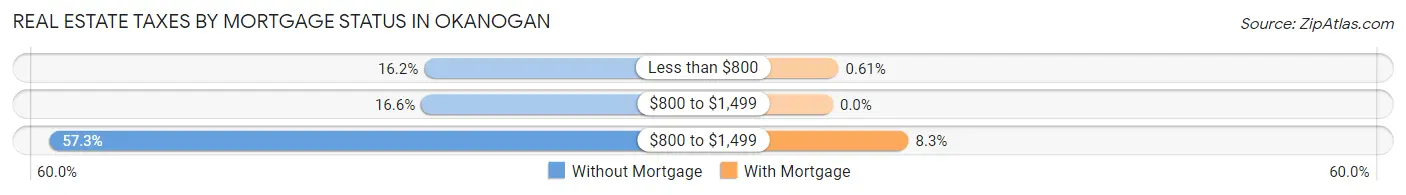
| Property Taxes | Without Mortgage | With Mortgage |
| Less than $800 | 49 (16.2%) | 2 (0.6%) |
| $800 to $1,499 | 50 (16.6%) | 0 (0.0%) |
| $800 to $1,499 | 173 (57.3%) | 27 (8.3%) |
| Total | 302 (100.0%) | 326 (100.0%) |
Health & Disability in Okanogan
Health Insurance Coverage by Age in Okanogan
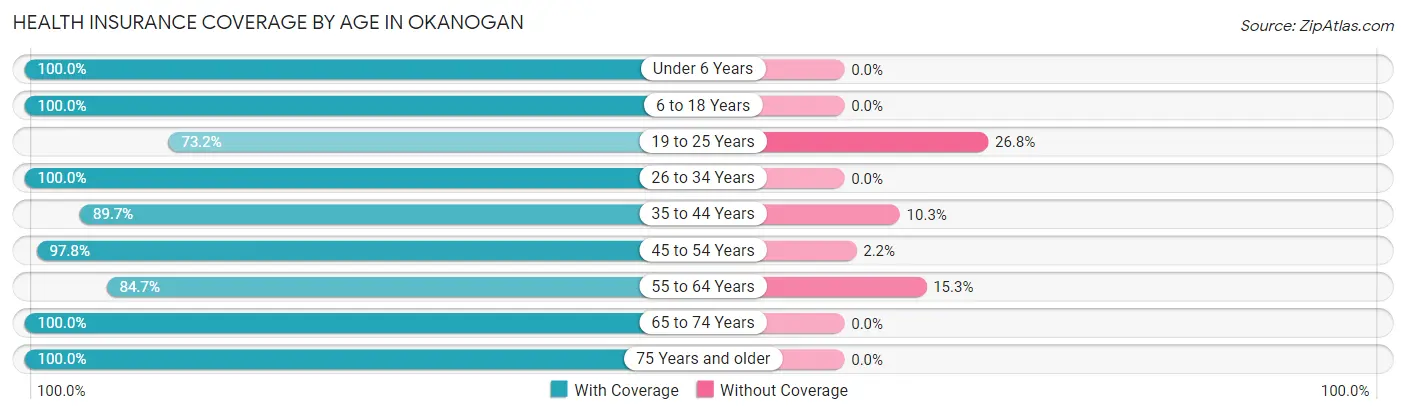
| Age Bracket | With Coverage | Without Coverage |
| Under 6 Years | 91 (100.0%) | 0 (0.0%) |
| 6 to 18 Years | 650 (100.0%) | 0 (0.0%) |
| 19 to 25 Years | 101 (73.2%) | 37 (26.8%) |
| 26 to 34 Years | 168 (100.0%) | 0 (0.0%) |
| 35 to 44 Years | 313 (89.7%) | 36 (10.3%) |
| 45 to 54 Years | 395 (97.8%) | 9 (2.2%) |
| 55 to 64 Years | 122 (84.7%) | 22 (15.3%) |
| 65 to 74 Years | 329 (100.0%) | 0 (0.0%) |
| 75 Years and older | 190 (100.0%) | 0 (0.0%) |
| Total | 2,359 (95.8%) | 104 (4.2%) |
Health Insurance Coverage by Citizenship Status in Okanogan
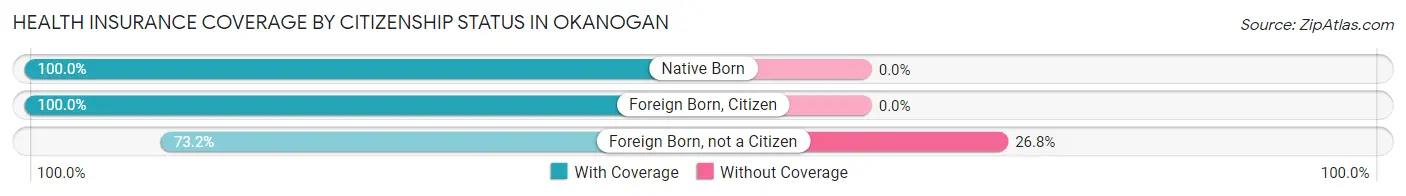
| Citizenship Status | With Coverage | Without Coverage |
| Native Born | 91 (100.0%) | 0 (0.0%) |
| Foreign Born, Citizen | 650 (100.0%) | 0 (0.0%) |
| Foreign Born, not a Citizen | 101 (73.2%) | 37 (26.8%) |
Health Insurance Coverage by Household Income in Okanogan
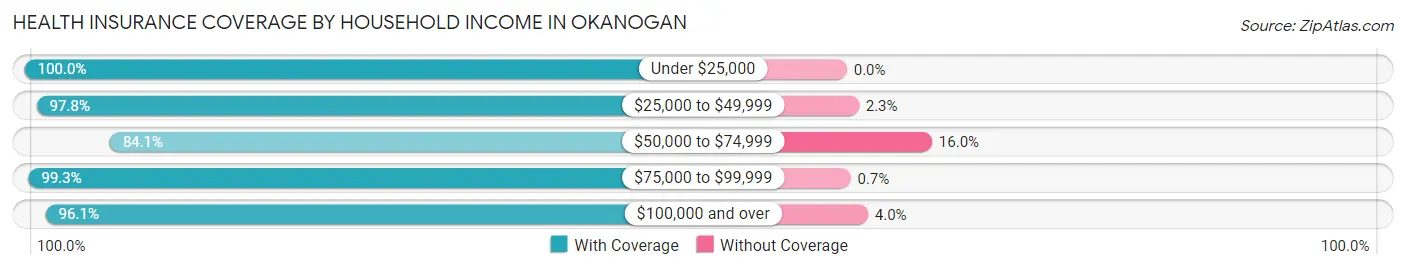
| Household Income | With Coverage | Without Coverage |
| Under $25,000 | 239 (100.0%) | 0 (0.0%) |
| $25,000 to $49,999 | 564 (97.8%) | 13 (2.2%) |
| $50,000 to $74,999 | 311 (84.1%) | 59 (16.0%) |
| $75,000 to $99,999 | 565 (99.3%) | 4 (0.7%) |
| $100,000 and over | 680 (96.1%) | 28 (4.0%) |
Public vs Private Health Insurance Coverage by Age in Okanogan
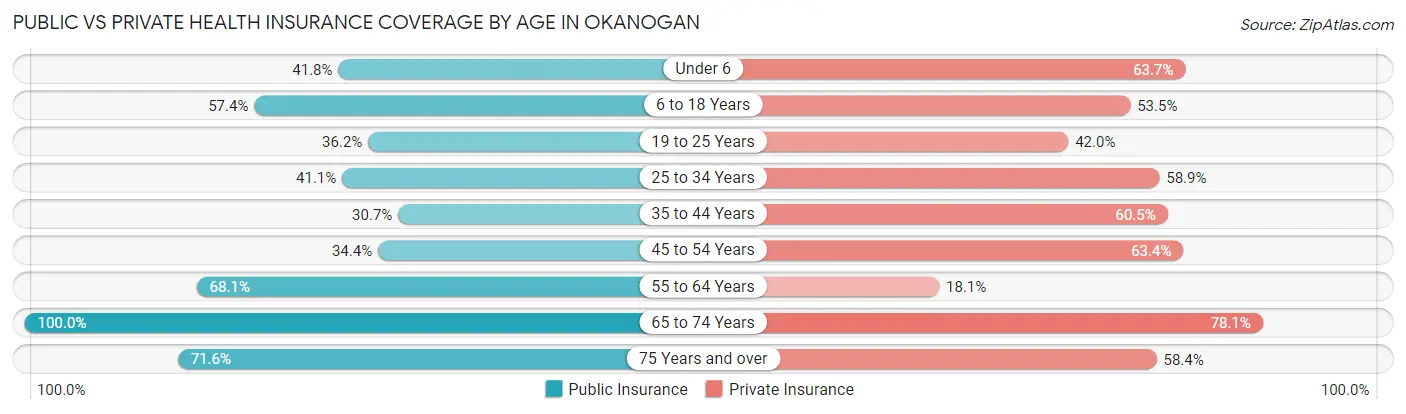
| Age Bracket | Public Insurance | Private Insurance |
| Under 6 | 38 (41.8%) | 58 (63.7%) |
| 6 to 18 Years | 373 (57.4%) | 348 (53.5%) |
| 19 to 25 Years | 50 (36.2%) | 58 (42.0%) |
| 25 to 34 Years | 69 (41.1%) | 99 (58.9%) |
| 35 to 44 Years | 107 (30.7%) | 211 (60.5%) |
| 45 to 54 Years | 139 (34.4%) | 256 (63.4%) |
| 55 to 64 Years | 98 (68.1%) | 26 (18.1%) |
| 65 to 74 Years | 329 (100.0%) | 257 (78.1%) |
| 75 Years and over | 136 (71.6%) | 111 (58.4%) |
| Total | 1,339 (54.4%) | 1,424 (57.8%) |
Disability Status by Sex by Age in Okanogan
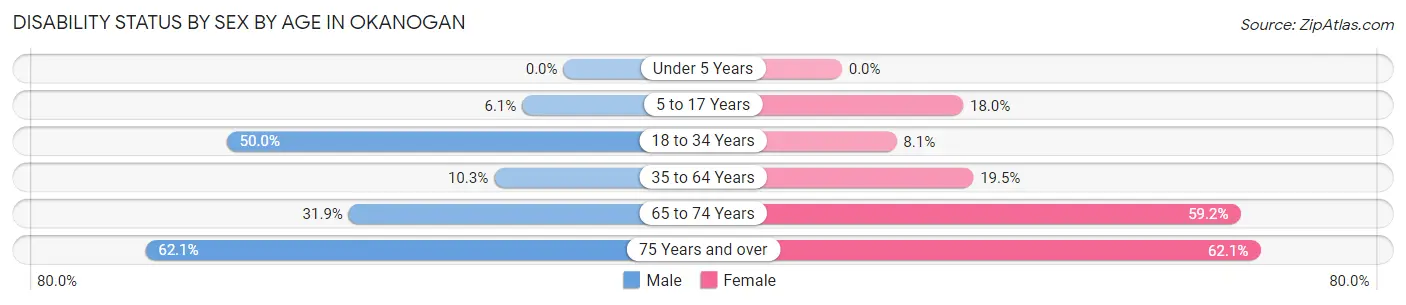
| Age Bracket | Male | Female |
| Under 5 Years | 0 (0.0%) | 0 (0.0%) |
| 5 to 17 Years | 18 (6.1%) | 56 (18.0%) |
| 18 to 34 Years | 83 (50.0%) | 15 (8.1%) |
| 35 to 64 Years | 38 (10.3%) | 103 (19.5%) |
| 65 to 74 Years | 44 (31.9%) | 113 (59.2%) |
| 75 Years and over | 36 (62.1%) | 82 (62.1%) |
Disability Class by Sex by Age in Okanogan
Disability Class: Hearing Difficulty
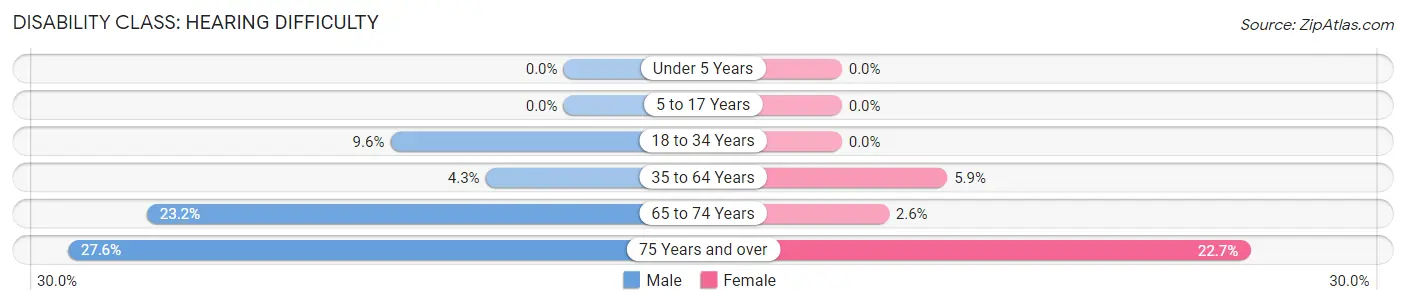
| Age Bracket | Male | Female |
| Under 5 Years | 0 (0.0%) | 0 (0.0%) |
| 5 to 17 Years | 0 (0.0%) | 0 (0.0%) |
| 18 to 34 Years | 16 (9.6%) | 0 (0.0%) |
| 35 to 64 Years | 16 (4.3%) | 31 (5.9%) |
| 65 to 74 Years | 32 (23.2%) | 5 (2.6%) |
| 75 Years and over | 16 (27.6%) | 30 (22.7%) |
Disability Class: Vision Difficulty
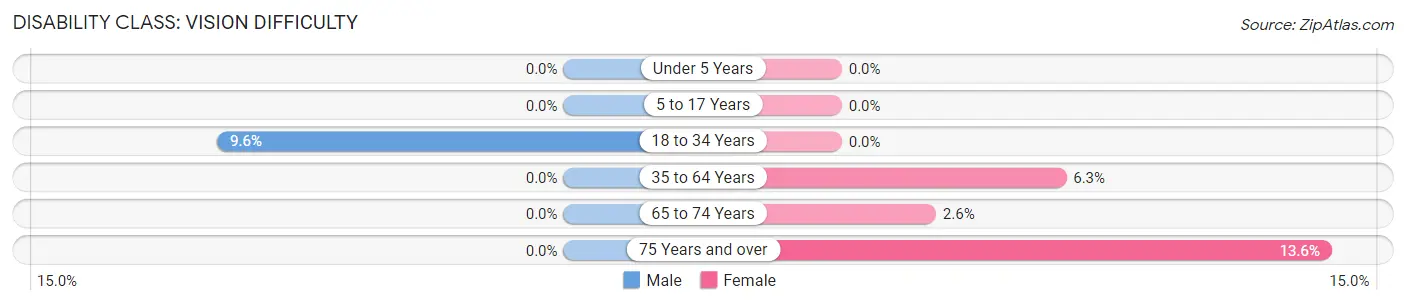
| Age Bracket | Male | Female |
| Under 5 Years | 0 (0.0%) | 0 (0.0%) |
| 5 to 17 Years | 0 (0.0%) | 0 (0.0%) |
| 18 to 34 Years | 16 (9.6%) | 0 (0.0%) |
| 35 to 64 Years | 0 (0.0%) | 33 (6.2%) |
| 65 to 74 Years | 0 (0.0%) | 5 (2.6%) |
| 75 Years and over | 0 (0.0%) | 18 (13.6%) |
Disability Class: Cognitive Difficulty
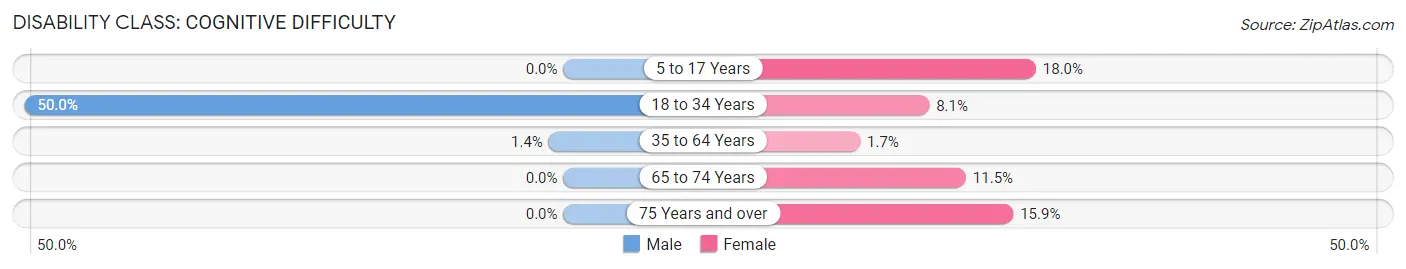
| Age Bracket | Male | Female |
| 5 to 17 Years | 0 (0.0%) | 56 (18.0%) |
| 18 to 34 Years | 83 (50.0%) | 15 (8.1%) |
| 35 to 64 Years | 5 (1.4%) | 9 (1.7%) |
| 65 to 74 Years | 0 (0.0%) | 22 (11.5%) |
| 75 Years and over | 0 (0.0%) | 21 (15.9%) |
Disability Class: Ambulatory Difficulty
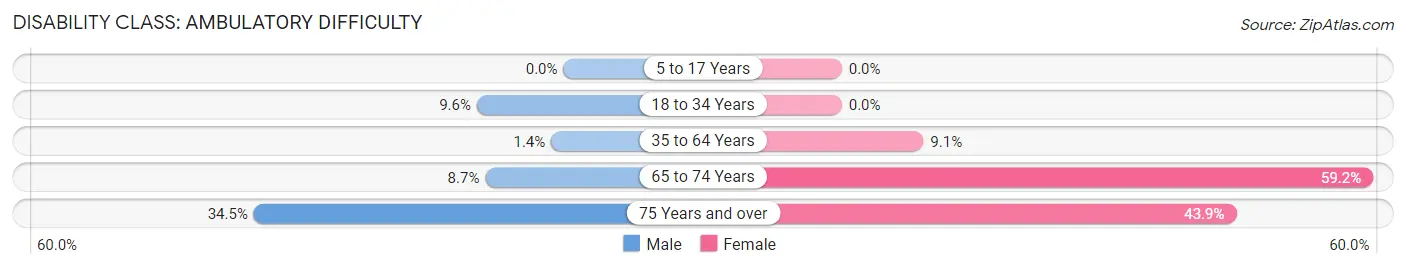
| Age Bracket | Male | Female |
| 5 to 17 Years | 0 (0.0%) | 0 (0.0%) |
| 18 to 34 Years | 16 (9.6%) | 0 (0.0%) |
| 35 to 64 Years | 5 (1.4%) | 48 (9.1%) |
| 65 to 74 Years | 12 (8.7%) | 113 (59.2%) |
| 75 Years and over | 20 (34.5%) | 58 (43.9%) |
Disability Class: Self-Care Difficulty
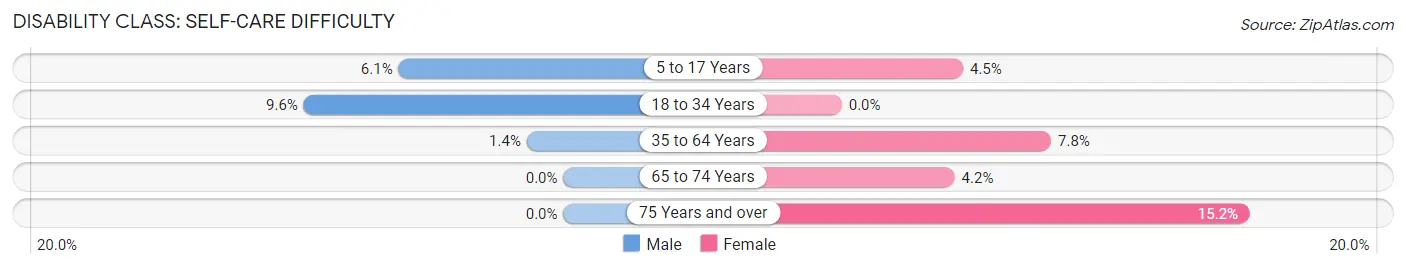
| Age Bracket | Male | Female |
| 5 to 17 Years | 18 (6.1%) | 14 (4.5%) |
| 18 to 34 Years | 16 (9.6%) | 0 (0.0%) |
| 35 to 64 Years | 5 (1.4%) | 41 (7.8%) |
| 65 to 74 Years | 0 (0.0%) | 8 (4.2%) |
| 75 Years and over | 0 (0.0%) | 20 (15.1%) |
Technology Access in Okanogan
Computing Device Access in Okanogan
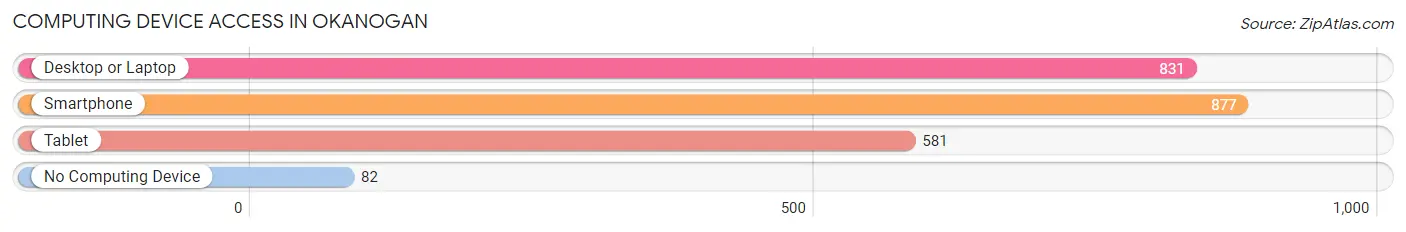
| Device Type | # Households | % Households |
| Desktop or Laptop | 831 | 79.5% |
| Smartphone | 877 | 83.9% |
| Tablet | 581 | 55.6% |
| No Computing Device | 82 | 7.9% |
| Total | 1,045 | 100.0% |
Internet Access in Okanogan
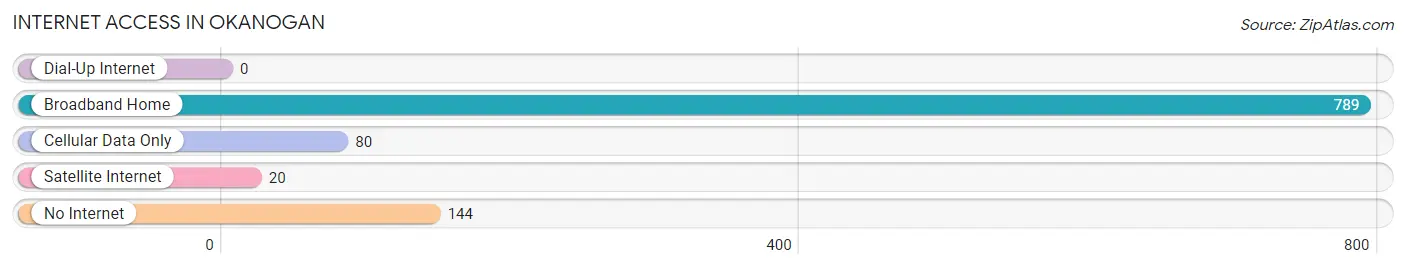
| Internet Type | # Households | % Households |
| Dial-Up Internet | 0 | 0.0% |
| Broadband Home | 789 | 75.5% |
| Cellular Data Only | 80 | 7.7% |
| Satellite Internet | 20 | 1.9% |
| No Internet | 144 | 13.8% |
| Total | 1,045 | 100.0% |
Okanogan Summary
Okanogan is a county located in the north-central region of Washington State. It is bordered by the Columbia River to the west, the Okanogan River to the east, and the Canadian province of British Columbia to the north. The county seat is Okanogan, and the largest city is Omak. The county has a total area of 5,315 square miles, making it the largest county in Washington State.
History
The area that is now Okanogan County was originally inhabited by the Okanagan people, a Salish-speaking tribe of the Interior Salish. The first European settlers arrived in the area in the late 1800s, and the county was officially established in 1888. The county was named after the Okanagan people, and the county seat was established in Okanogan.
The county experienced rapid growth in the early 1900s, as settlers moved into the area to take advantage of the fertile land and abundant natural resources. The county was home to several mining operations, and the timber industry was also a major source of employment. The county also became a major agricultural center, with the production of apples, cherries, and other fruits and vegetables.
Geography
Okanogan County is located in the north-central region of Washington State. It is bordered by the Columbia River to the west, the Okanogan River to the east, and the Canadian province of British Columbia to the north. The county has a total area of 5,315 square miles, making it the largest county in Washington State.
The county is mostly mountainous, with the Okanogan Range and the Cascade Range running through the county. The highest point in the county is Mount Bonaparte, which has an elevation of 8,200 feet. The county also contains several lakes, including Lake Osoyoos, Lake Chelan, and Lake Pateros.
Economy
Okanogan County has a diverse economy, with a mix of agriculture, manufacturing, and tourism. The county is home to several large agricultural operations, including apple orchards, cherry orchards, and vineyards. The county is also home to several manufacturing companies, including a paper mill and a lumber mill.
Tourism is also an important part of the county’s economy. The county is home to several popular tourist attractions, including the Grand Coulee Dam, the Okanogan National Forest, and the Lake Chelan National Recreation Area.
Demographics
As of the 2010 census, the population of Okanogan County was 41,120. The population is predominantly white (90.2%), with small percentages of Native American (3.2%), Hispanic (2.7%), and Asian (1.2%) populations. The median household income is $41,945, and the median age is 41.7 years.
Conclusion
Okanogan County is a large county located in the north-central region of Washington State. It is bordered by the Columbia River to the west, the Okanogan River to the east, and the Canadian province of British Columbia to the north. The county has a diverse economy, with a mix of agriculture, manufacturing, and tourism. The population of the county is predominantly white, with small percentages of Native American, Hispanic, and Asian populations.
Common Questions
What is Per Capita Income in Okanogan?
Per Capita income in Okanogan is $31,313.
What is the Median Family Income in Okanogan?
Median Family Income in Okanogan is $80,694.
What is the Median Household income in Okanogan?
Median Household Income in Okanogan is $68,850.
What is Income or Wage Gap in Okanogan?
Income or Wage Gap in Okanogan is 25.7%.
Women in Okanogan earn 74.3 cents for every dollar earned by a man.
What is Inequality or Gini Index in Okanogan?
Inequality or Gini Index in Okanogan is 0.40.
What is the Total Population of Okanogan?
Total Population of Okanogan is 2,640.
What is the Total Male Population of Okanogan?
Total Male Population of Okanogan is 1,195.
What is the Total Female Population of Okanogan?
Total Female Population of Okanogan is 1,445.
What is the Ratio of Males per 100 Females in Okanogan?
There are 82.70 Males per 100 Females in Okanogan.
What is the Ratio of Females per 100 Males in Okanogan?
There are 120.92 Females per 100 Males in Okanogan.
What is the Median Population Age in Okanogan?
Median Population Age in Okanogan is 40.8 Years.
What is the Average Family Size in Okanogan
Average Family Size in Okanogan is 2.9 People.
What is the Average Household Size in Okanogan
Average Household Size in Okanogan is 2.4 People.
How Large is the Labor Force in Okanogan?
There are 1,107 People in the Labor Forcein in Okanogan.
What is the Percentage of People in the Labor Force in Okanogan?
54.1% of People are in the Labor Force in Okanogan.
What is the Unemployment Rate in Okanogan?
Unemployment Rate in Okanogan is 3.1%.