Zip Codes with the Highest Percentage of Population Employed in Security & Protection in Redmond, WA
RELATED REPORTS & OPTIONS
Security & Protection
Redmond
Compare Zip Codes
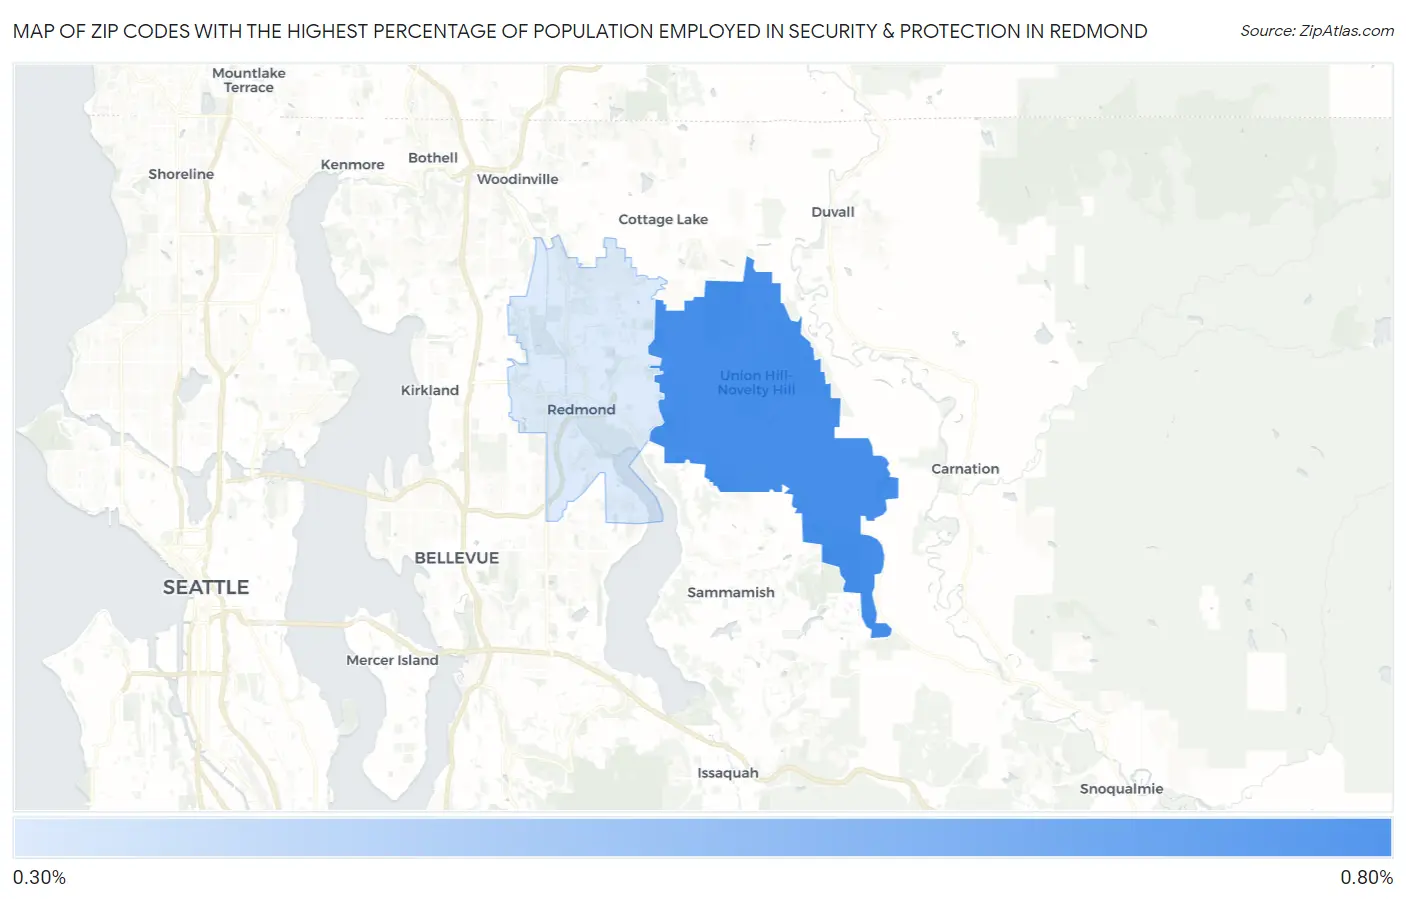
Map of Zip Codes with the Highest Percentage of Population Employed in Security & Protection in Redmond
0.30%
0.77%
Zip Codes with the Highest Percentage of Population Employed in Security & Protection in Redmond, WA
| Zip Code | % Employed | vs State | vs National | |
| 1. | 98053 | 0.77% | 1.8%(-1.04)#407 | 2.1%(-1.37)#21,573 |
| 2. | 98052 | 0.30% | 1.8%(-1.51)#453 | 2.1%(-1.85)#24,172 |
1
Common Questions
What are the Top Zip Codes with the Highest Percentage of Population Employed in Security & Protection in Redmond, WA?
Top Zip Codes with the Highest Percentage of Population Employed in Security & Protection in Redmond, WA are:
What zip code has the Highest Percentage of Population Employed in Security & Protection in Redmond, WA?
98053 has the Highest Percentage of Population Employed in Security & Protection in Redmond, WA with 0.77%.
What is the Percentage of Population Employed in Security & Protection in Redmond, WA?
Percentage of Population Employed in Security & Protection in Redmond is 0.30%.
What is the Percentage of Population Employed in Security & Protection in Washington?
Percentage of Population Employed in Security & Protection in Washington is 1.8%.
What is the Percentage of Population Employed in Security & Protection in the United States?
Percentage of Population Employed in Security & Protection in the United States is 2.1%.