Ten Mile Run, NJ Map & Demographics
Ten Mile Run Map
Ten Mile Run Overview
$60,805
PER CAPITA INCOME
$183,596
AVG FAMILY INCOME
$162,557
AVG HOUSEHOLD INCOME
0.34
INEQUALITY / GINI INDEX
2,241
TOTAL POPULATION
1,225
MALE POPULATION
1,016
FEMALE POPULATION
120.57
MALES / 100 FEMALES
82.94
FEMALES / 100 MALES
45.9
MEDIAN AGE
3.5
AVG FAMILY SIZE
3.1
AVG HOUSEHOLD SIZE
1,320
LABOR FORCE [ PEOPLE ]
72.5%
PERCENT IN LABOR FORCE
3.6%
UNEMPLOYMENT RATE
Income in Ten Mile Run
Income Overview in Ten Mile Run
Per Capita Income in Ten Mile Run is $60,805, while median incomes of families and households are $183,596 and $162,557 respectively.
| Characteristic | Number | Measure |
| Per Capita Income | 2,241 | $60,805 |
| Median Family Income | 602 | $183,596 |
| Mean Family Income | 602 | $200,913 |
| Median Household Income | 729 | $162,557 |
| Mean Household Income | 729 | $184,242 |
| Income Deficit | 602 | $0 |
| Wage / Income Gap (%) | 2,241 | 0.00% |
| Wage / Income Gap ($) | 2,241 | 100.00¢ per $1 |
| Gini / Inequality Index | 2,241 | 0.34 |
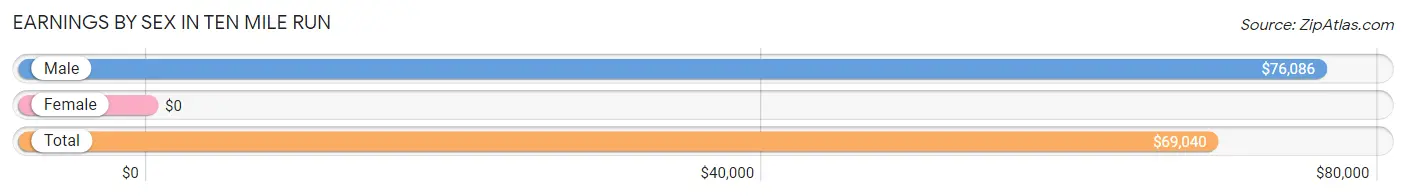
Earnings by Sex in Ten Mile Run
| Sex | Number | Average Earnings |
| Male | 839 (60.8%) | $76,086 |
| Female | 540 (39.2%) | $0 |
| Total | 1,379 (100.0%) | $69,040 |
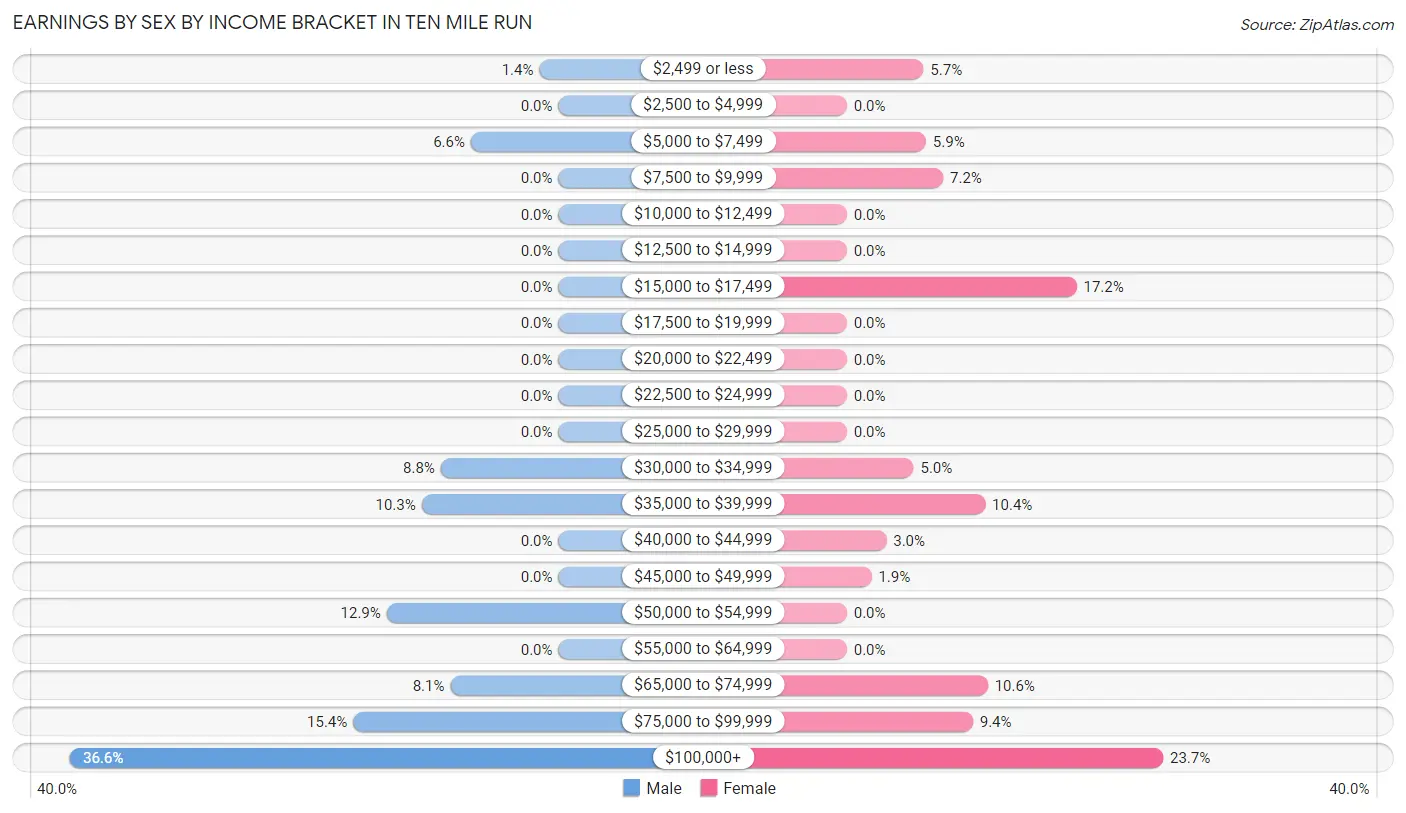
Earnings by Sex by Income Bracket in Ten Mile Run
The most common earnings brackets in Ten Mile Run are $100,000+ for men (307 | 36.6%) and $100,000+ for women (128 | 23.7%).
| Income | Male | Female |
| $2,499 or less | 12 (1.4%) | 31 (5.7%) |
| $2,500 to $4,999 | 0 (0.0%) | 0 (0.0%) |
| $5,000 to $7,499 | 55 (6.6%) | 32 (5.9%) |
| $7,500 to $9,999 | 0 (0.0%) | 39 (7.2%) |
| $10,000 to $12,499 | 0 (0.0%) | 0 (0.0%) |
| $12,500 to $14,999 | 0 (0.0%) | 0 (0.0%) |
| $15,000 to $17,499 | 0 (0.0%) | 93 (17.2%) |
| $17,500 to $19,999 | 0 (0.0%) | 0 (0.0%) |
| $20,000 to $22,499 | 0 (0.0%) | 0 (0.0%) |
| $22,500 to $24,999 | 0 (0.0%) | 0 (0.0%) |
| $25,000 to $29,999 | 0 (0.0%) | 0 (0.0%) |
| $30,000 to $34,999 | 74 (8.8%) | 27 (5.0%) |
| $35,000 to $39,999 | 86 (10.2%) | 56 (10.4%) |
| $40,000 to $44,999 | 0 (0.0%) | 16 (3.0%) |
| $45,000 to $49,999 | 0 (0.0%) | 10 (1.8%) |
| $50,000 to $54,999 | 108 (12.9%) | 0 (0.0%) |
| $55,000 to $64,999 | 0 (0.0%) | 0 (0.0%) |
| $65,000 to $74,999 | 68 (8.1%) | 57 (10.6%) |
| $75,000 to $99,999 | 129 (15.4%) | 51 (9.4%) |
| $100,000+ | 307 (36.6%) | 128 (23.7%) |
| Total | 839 (100.0%) | 540 (100.0%) |
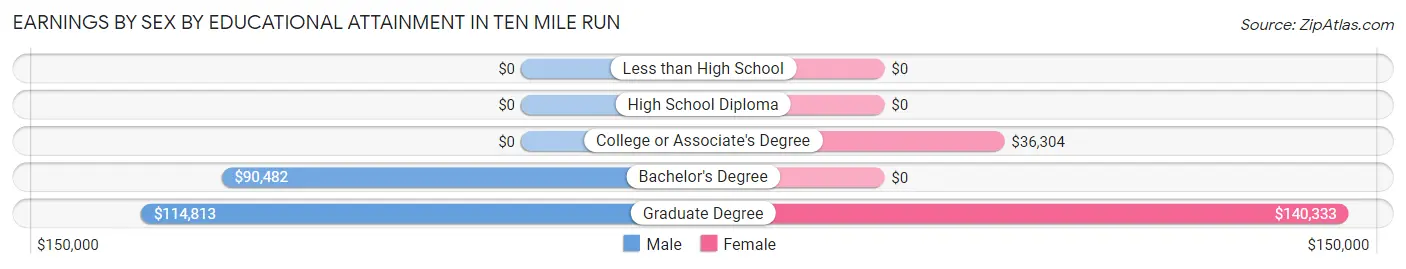
Earnings by Sex by Educational Attainment in Ten Mile Run
Average earnings in Ten Mile Run are $91,434 for men and $68,839 for women, a difference of 24.7%. Men with an educational attainment of graduate degree enjoy the highest average annual earnings of $114,813, while those with bachelor's degree education earn the least with $90,482. Women with an educational attainment of graduate degree earn the most with the average annual earnings of $140,333, while those with college or associate's degree education have the smallest earnings of $36,304.
| Educational Attainment | Male Income | Female Income |
| Less than High School | - | - |
| High School Diploma | - | - |
| College or Associate's Degree | - | - |
| Bachelor's Degree | $90,482 | $0 |
| Graduate Degree | $114,813 | $140,333 |
| Total | $91,434 | $68,839 |
Family Income in Ten Mile Run
Family Income Brackets in Ten Mile Run
According to the Ten Mile Run family income data, there are 216 families falling into the $200,000+ income range, which is the most common income bracket and makes up 35.9% of all families.
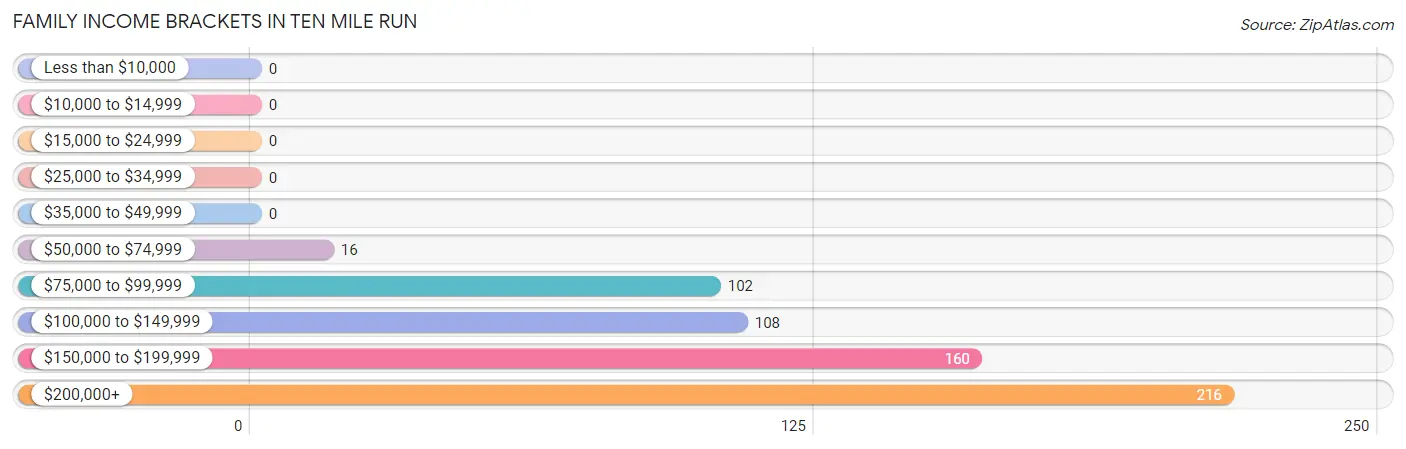
| Income Bracket | # Families | % Families |
| Less than $10,000 | 0 | 0.0% |
| $10,000 to $14,999 | 0 | 0.0% |
| $15,000 to $24,999 | 0 | 0.0% |
| $25,000 to $34,999 | 0 | 0.0% |
| $35,000 to $49,999 | 0 | 0.0% |
| $50,000 to $74,999 | 16 | 2.7% |
| $75,000 to $99,999 | 102 | 16.9% |
| $100,000 to $149,999 | 108 | 17.9% |
| $150,000 to $199,999 | 160 | 26.6% |
| $200,000+ | 216 | 35.9% |
Family Income by Famaliy Size in Ten Mile Run
3-person families (89 | 14.8%) account for the highest median family income in Ten Mile Run with $250,001 per family, while 3-person families (89 | 14.8%) have the highest median income of $83,334 per family member.
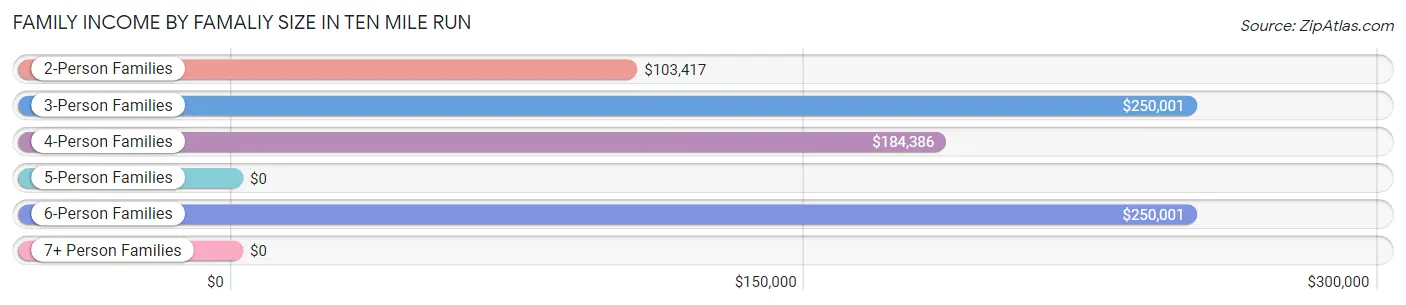
| Income Bracket | # Families | Median Income |
| 2-Person Families | 237 (39.4%) | $103,417 |
| 3-Person Families | 89 (14.8%) | $250,001 |
| 4-Person Families | 108 (17.9%) | $184,386 |
| 5-Person Families | 95 (15.8%) | $0 |
| 6-Person Families | 69 (11.5%) | $250,001 |
| 7+ Person Families | 4 (0.7%) | $0 |
| Total | 602 (100.0%) | $183,596 |
Family Income by Number of Earners in Ten Mile Run
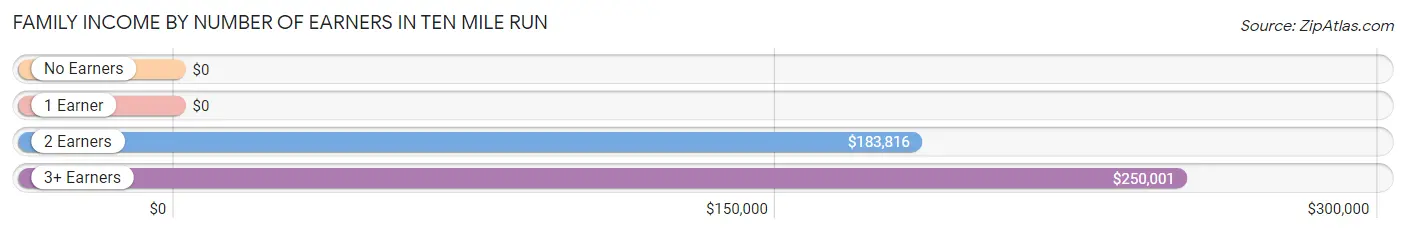
| Number of Earners | # Families | Median Income |
| No Earners | 13 (2.2%) | $0 |
| 1 Earner | 146 (24.2%) | $0 |
| 2 Earners | 302 (50.2%) | $183,816 |
| 3+ Earners | 141 (23.4%) | $250,001 |
| Total | 602 (100.0%) | $183,596 |
Household Income in Ten Mile Run
Household Income Brackets in Ten Mile Run
With 233 households falling in the category, the $200,000+ income range is the most frequent in Ten Mile Run, accounting for 32.0% of all households.
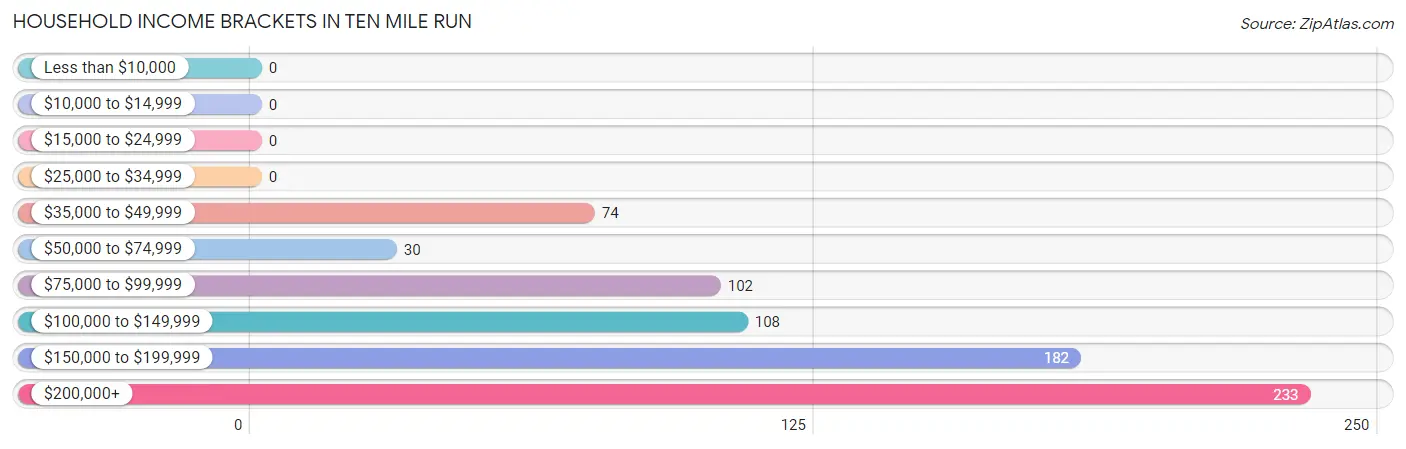
| Income Bracket | # Households | % Households |
| Less than $10,000 | 0 | 0.0% |
| $10,000 to $14,999 | 0 | 0.0% |
| $15,000 to $24,999 | 0 | 0.0% |
| $25,000 to $34,999 | 0 | 0.0% |
| $35,000 to $49,999 | 74 | 10.2% |
| $50,000 to $74,999 | 30 | 4.1% |
| $75,000 to $99,999 | 102 | 14.0% |
| $100,000 to $149,999 | 108 | 14.8% |
| $150,000 to $199,999 | 182 | 25.0% |
| $200,000+ | 233 | 32.0% |
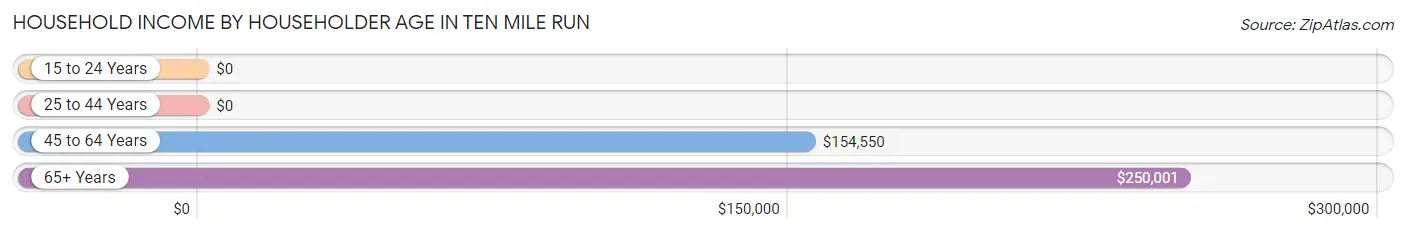
Household Income by Householder Age in Ten Mile Run
The median household income in Ten Mile Run is $162,557, with the highest median household income of $250,001 found in the 65+ years age bracket for the primary householder. A total of 51 households (7.0%) fall into this category.
| Income Bracket | # Households | Median Income |
| 15 to 24 Years | 0 (0.0%) | $0 |
| 25 to 44 Years | 210 (28.8%) | $0 |
| 45 to 64 Years | 468 (64.2%) | $154,550 |
| 65+ Years | 51 (7.0%) | $250,001 |
| Total | 729 (100.0%) | $162,557 |
Poverty in Ten Mile Run
Income Below Poverty by Sex and Age in Ten Mile Run
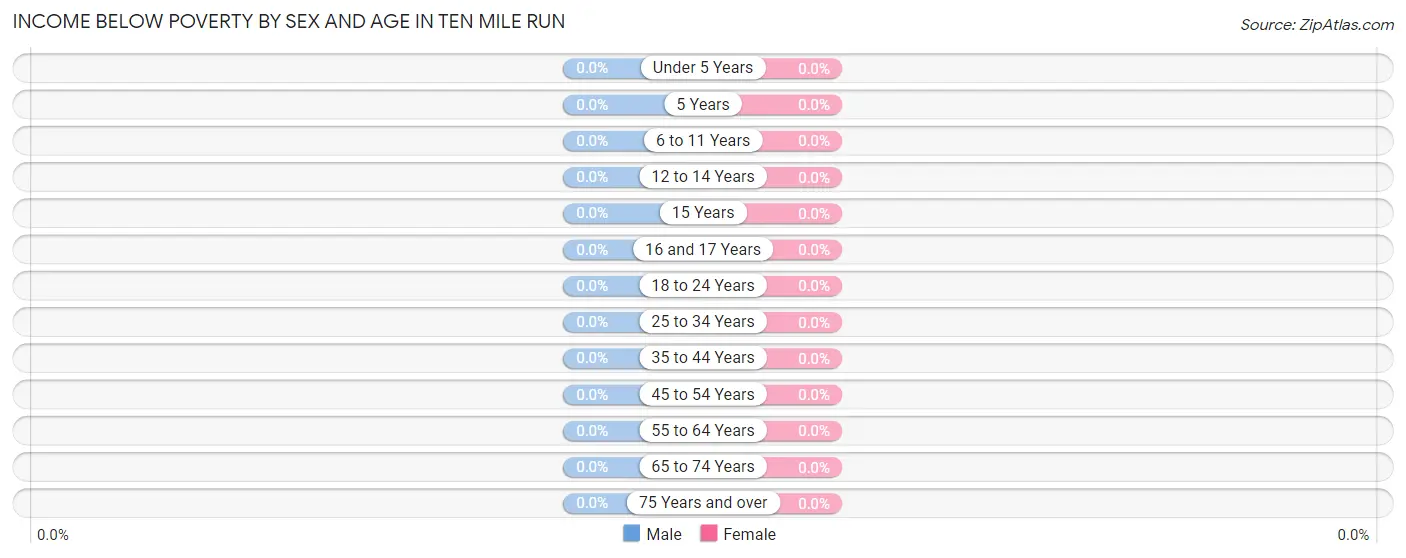
| Age Bracket | Male | Female |
| Under 5 Years | 0 (0.0%) | 0 (0.0%) |
| 5 Years | 0 (0.0%) | 0 (0.0%) |
| 6 to 11 Years | 0 (0.0%) | 0 (0.0%) |
| 12 to 14 Years | 0 (0.0%) | 0 (0.0%) |
| 15 Years | 0 (0.0%) | 0 (0.0%) |
| 16 and 17 Years | 0 (0.0%) | 0 (0.0%) |
| 18 to 24 Years | 0 (0.0%) | 0 (0.0%) |
| 25 to 34 Years | 0 (0.0%) | 0 (0.0%) |
| 35 to 44 Years | 0 (0.0%) | 0 (0.0%) |
| 45 to 54 Years | 0 (0.0%) | 0 (0.0%) |
| 55 to 64 Years | 0 (0.0%) | 0 (0.0%) |
| 65 to 74 Years | 0 (0.0%) | 0 (0.0%) |
| 75 Years and over | 0 (0.0%) | 0 (0.0%) |
| Total | 0 (0.0%) | 0 (0.0%) |
Income Above Poverty by Sex and Age in Ten Mile Run
According to the poverty statistics in Ten Mile Run, males aged under 5 years and females aged under 5 years are the age groups that are most secure financially, with 100.0% of males and 100.0% of females in these age groups living above the poverty line.
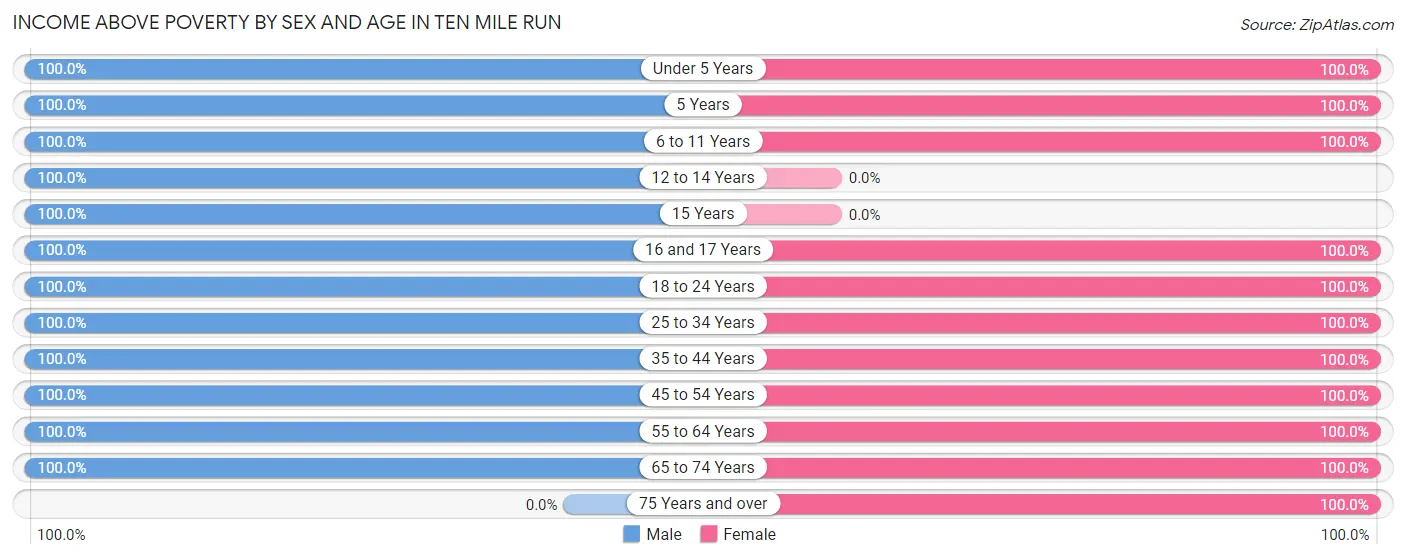
| Age Bracket | Male | Female |
| Under 5 Years | 42 (100.0%) | 35 (100.0%) |
| 5 Years | 28 (100.0%) | 11 (100.0%) |
| 6 to 11 Years | 139 (100.0%) | 98 (100.0%) |
| 12 to 14 Years | 53 (100.0%) | 0 (0.0%) |
| 15 Years | 14 (100.0%) | 0 (0.0%) |
| 16 and 17 Years | 42 (100.0%) | 19 (100.0%) |
| 18 to 24 Years | 125 (100.0%) | 83 (100.0%) |
| 25 to 34 Years | 12 (100.0%) | 145 (100.0%) |
| 35 to 44 Years | 128 (100.0%) | 129 (100.0%) |
| 45 to 54 Years | 259 (100.0%) | 184 (100.0%) |
| 55 to 64 Years | 229 (100.0%) | 116 (100.0%) |
| 65 to 74 Years | 154 (100.0%) | 109 (100.0%) |
| 75 Years and over | 0 (0.0%) | 87 (100.0%) |
| Total | 1,225 (100.0%) | 1,016 (100.0%) |
Income Below Poverty Among Married-Couple Families in Ten Mile Run
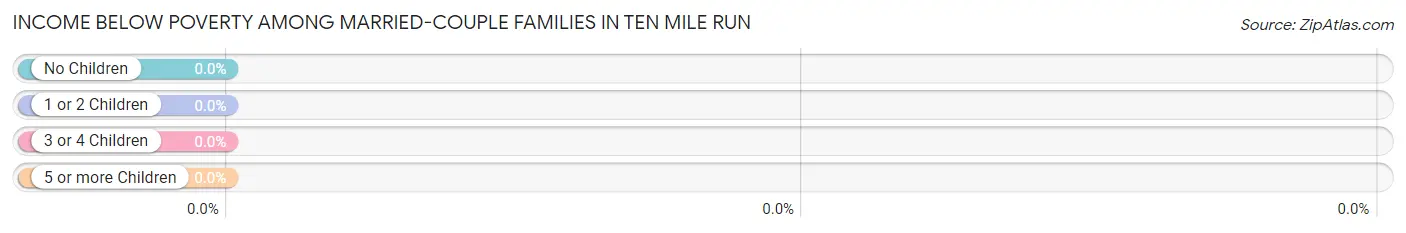
| Children | Above Poverty | Below Poverty |
| No Children | 177 (100.0%) | 0 (0.0%) |
| 1 or 2 Children | 209 (100.0%) | 0 (0.0%) |
| 3 or 4 Children | 27 (100.0%) | 0 (0.0%) |
| 5 or more Children | 0 (0.0%) | 0 (0.0%) |
| Total | 413 (100.0%) | 0 (0.0%) |
Income Below Poverty Among Single-Parent Households in Ten Mile Run
| Children | Single Father | Single Mother |
| No Children | 0 (0.0%) | 0 (0.0%) |
| 1 or 2 Children | 0 (0.0%) | 0 (0.0%) |
| 3 or 4 Children | 0 (0.0%) | 0 (0.0%) |
| 5 or more Children | 0 (0.0%) | 0 (0.0%) |
| Total | 0 (0.0%) | 0 (0.0%) |
Income Below Poverty Among Married-Couple vs Single-Parent Households in Ten Mile Run
| Children | Married-Couple Families | Single-Parent Households |
| No Children | 0 (0.0%) | 0 (0.0%) |
| 1 or 2 Children | 0 (0.0%) | 0 (0.0%) |
| 3 or 4 Children | 0 (0.0%) | 0 (0.0%) |
| 5 or more Children | 0 (0.0%) | 0 (0.0%) |
| Total | 0 (0.0%) | 0 (0.0%) |
Race in Ten Mile Run
The most populous races in Ten Mile Run are Asian (1,413 | 63.0%), White / Caucasian (586 | 26.2%), and Black / African American (199 | 8.9%).
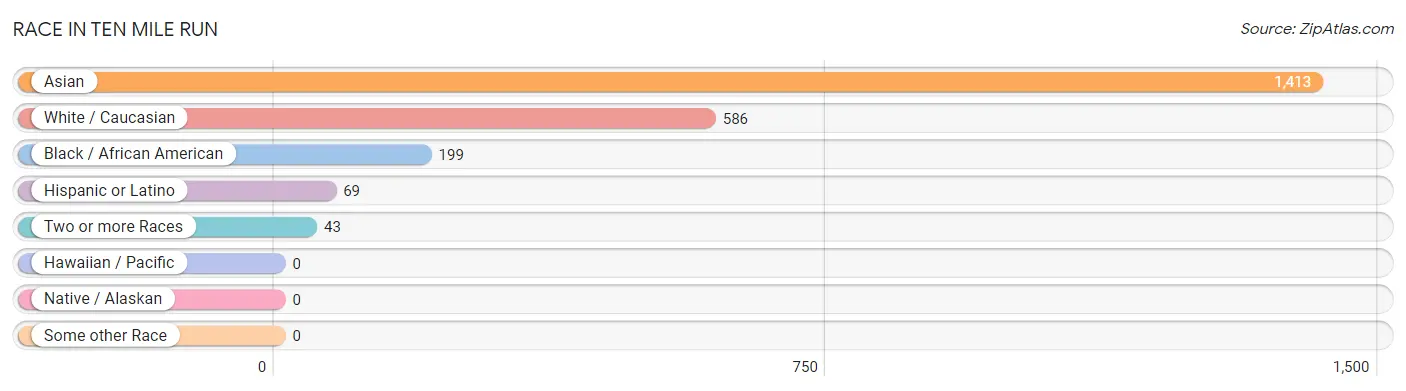
| Race | # Population | % Population |
| Asian | 1,413 | 63.0% |
| Black / African American | 199 | 8.9% |
| Hawaiian / Pacific | 0 | 0.0% |
| Hispanic or Latino | 69 | 3.1% |
| Native / Alaskan | 0 | 0.0% |
| White / Caucasian | 586 | 26.2% |
| Two or more Races | 43 | 1.9% |
| Some other Race | 0 | 0.0% |
| Total | 2,241 | 100.0% |
Ancestry in Ten Mile Run
The most populous ancestries reported in Ten Mile Run are Thai (1,229 | 54.8%), American (144 | 6.4%), Indian (Asian) (103 | 4.6%), Puerto Rican (69 | 3.1%), and Irish (56 | 2.5%), together accounting for 71.5% of all Ten Mile Run residents.
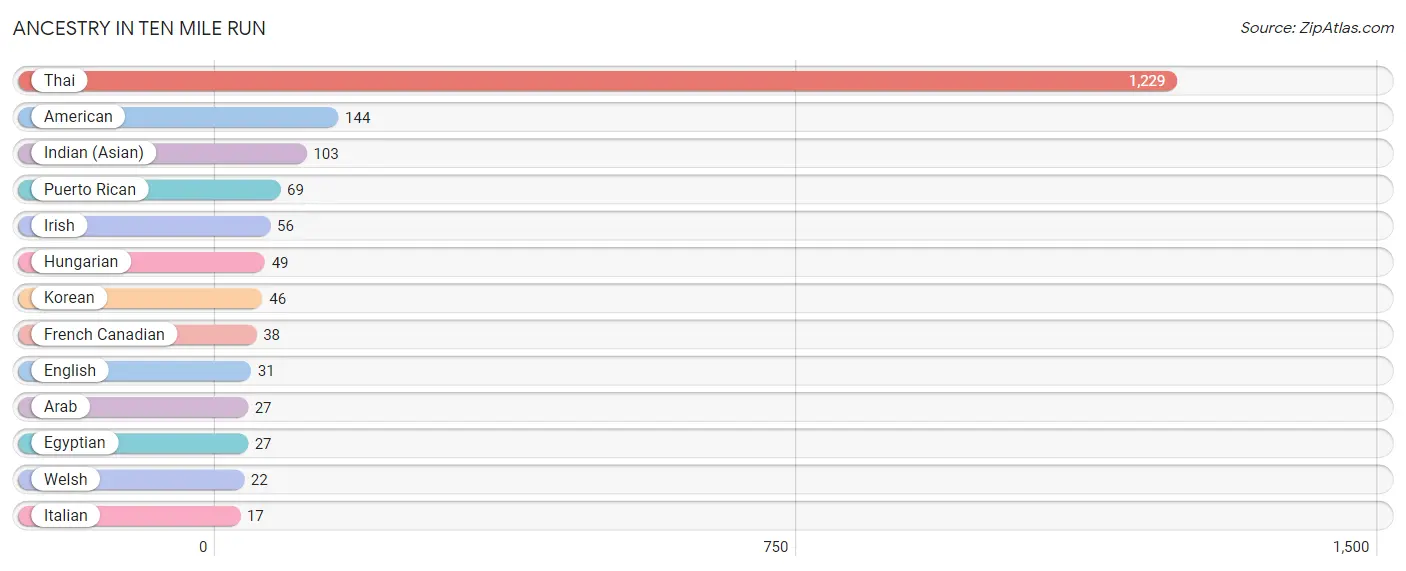
| Ancestry | # Population | % Population |
| American | 144 | 6.4% |
| Arab | 27 | 1.2% |
| Egyptian | 27 | 1.2% |
| English | 31 | 1.4% |
| French Canadian | 38 | 1.7% |
| Hungarian | 49 | 2.2% |
| Indian (Asian) | 103 | 4.6% |
| Irish | 56 | 2.5% |
| Italian | 17 | 0.8% |
| Korean | 46 | 2.1% |
| Puerto Rican | 69 | 3.1% |
| Thai | 1,229 | 54.8% |
| Welsh | 22 | 1.0% | View All 13 Rows |
Immigrants in Ten Mile Run
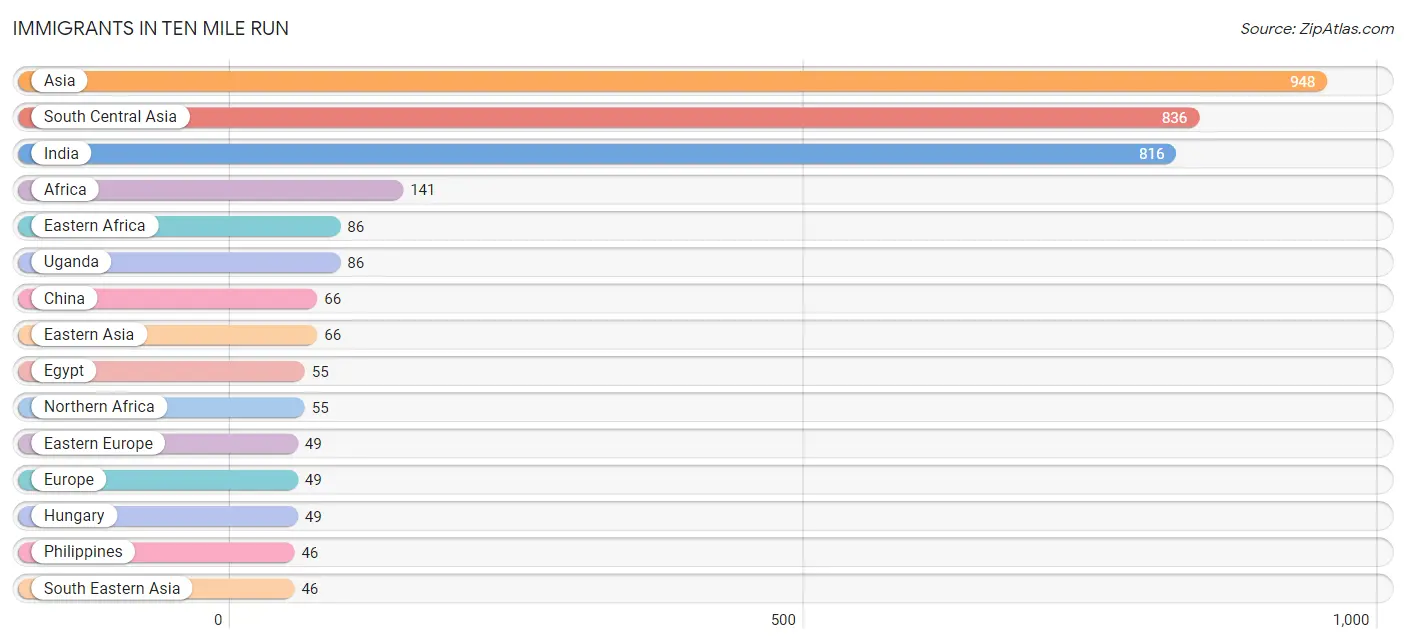
The most numerous immigrant groups reported in Ten Mile Run came from Asia (948 | 42.3%), South Central Asia (836 | 37.3%), India (816 | 36.4%), Africa (141 | 6.3%), and Eastern Africa (86 | 3.8%), together accounting for 126.1% of all Ten Mile Run residents.
| Immigration Origin | # Population | % Population |
| Africa | 141 | 6.3% |
| Asia | 948 | 42.3% |
| China | 66 | 2.9% |
| Eastern Africa | 86 | 3.8% |
| Eastern Asia | 66 | 2.9% |
| Eastern Europe | 49 | 2.2% |
| Egypt | 55 | 2.5% |
| Europe | 49 | 2.2% |
| Hong Kong | 16 | 0.7% |
| Hungary | 49 | 2.2% |
| India | 816 | 36.4% |
| Northern Africa | 55 | 2.5% |
| Oceania | 15 | 0.7% |
| Pakistan | 20 | 0.9% |
| Philippines | 46 | 2.1% |
| South Central Asia | 836 | 37.3% |
| South Eastern Asia | 46 | 2.1% |
| Taiwan | 21 | 0.9% |
| Uganda | 86 | 3.8% | View All 19 Rows |
Sex and Age in Ten Mile Run
Sex and Age in Ten Mile Run
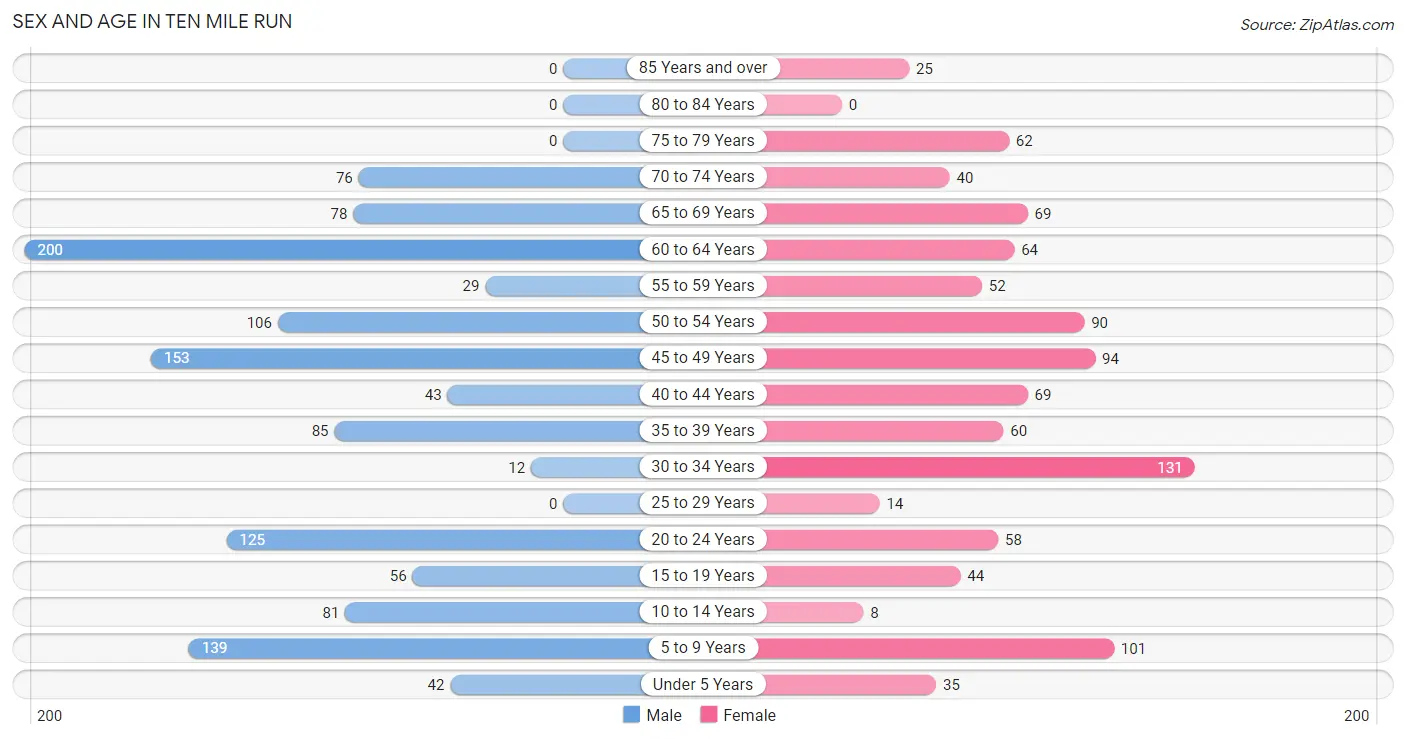
The most populous age groups in Ten Mile Run are 60 to 64 Years (200 | 16.3%) for men and 30 to 34 Years (131 | 12.9%) for women.
| Age Bracket | Male | Female |
| Under 5 Years | 42 (3.4%) | 35 (3.4%) |
| 5 to 9 Years | 139 (11.4%) | 101 (9.9%) |
| 10 to 14 Years | 81 (6.6%) | 8 (0.8%) |
| 15 to 19 Years | 56 (4.6%) | 44 (4.3%) |
| 20 to 24 Years | 125 (10.2%) | 58 (5.7%) |
| 25 to 29 Years | 0 (0.0%) | 14 (1.4%) |
| 30 to 34 Years | 12 (1.0%) | 131 (12.9%) |
| 35 to 39 Years | 85 (6.9%) | 60 (5.9%) |
| 40 to 44 Years | 43 (3.5%) | 69 (6.8%) |
| 45 to 49 Years | 153 (12.5%) | 94 (9.2%) |
| 50 to 54 Years | 106 (8.6%) | 90 (8.9%) |
| 55 to 59 Years | 29 (2.4%) | 52 (5.1%) |
| 60 to 64 Years | 200 (16.3%) | 64 (6.3%) |
| 65 to 69 Years | 78 (6.4%) | 69 (6.8%) |
| 70 to 74 Years | 76 (6.2%) | 40 (3.9%) |
| 75 to 79 Years | 0 (0.0%) | 62 (6.1%) |
| 80 to 84 Years | 0 (0.0%) | 0 (0.0%) |
| 85 Years and over | 0 (0.0%) | 25 (2.5%) |
| Total | 1,225 (100.0%) | 1,016 (100.0%) |
Families and Households in Ten Mile Run
Median Family Size in Ten Mile Run
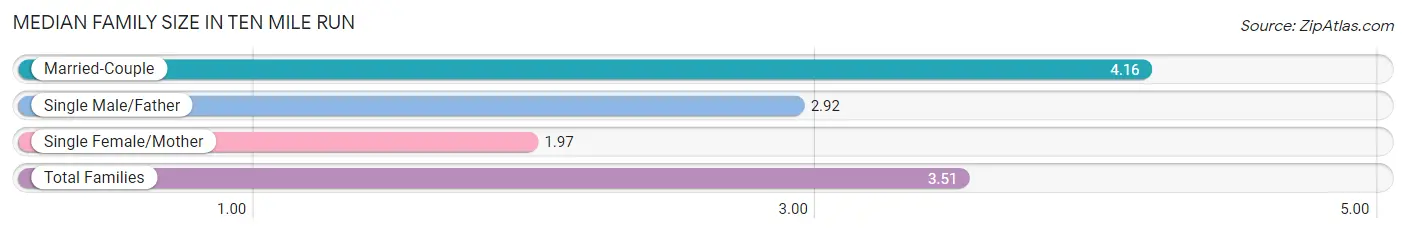
The median family size in Ten Mile Run is 3.51 persons per family, with married-couple families (413 | 68.6%) accounting for the largest median family size of 4.16 persons per family. On the other hand, single female/mother families (163 | 27.1%) represent the smallest median family size with 1.97 persons per family.
| Family Type | # Families | Family Size |
| Married-Couple | 413 (68.6%) | 4.16 |
| Single Male/Father | 26 (4.3%) | 2.92 |
| Single Female/Mother | 163 (27.1%) | 1.97 |
| Total Families | 602 (100.0%) | 3.51 |
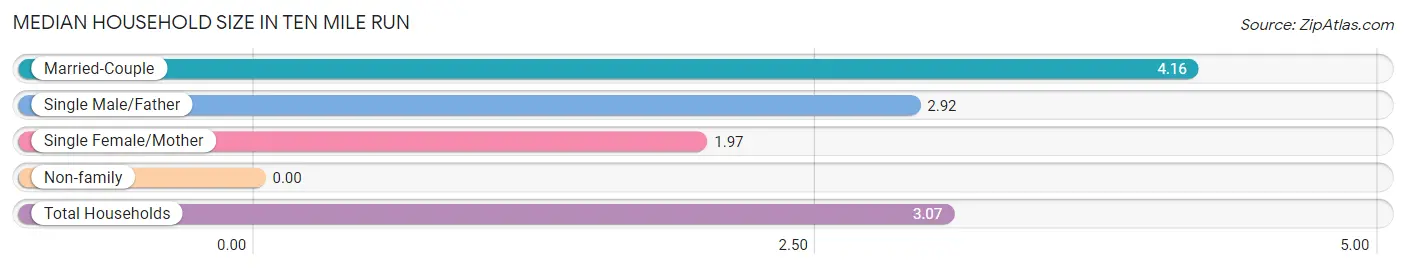
Median Household Size in Ten Mile Run
| Household Type | # Households | Household Size |
| Married-Couple | 413 (56.7%) | 4.16 |
| Single Male/Father | 26 (3.6%) | 2.92 |
| Single Female/Mother | 163 (22.4%) | 1.97 |
| Non-family | 127 (17.4%) | - |
| Total Households | 729 (100.0%) | 3.07 |
Household Size by Marriage Status in Ten Mile Run
Out of a total of 729 households in Ten Mile Run, 602 (82.6%) are family households, while 127 (17.4%) are nonfamily households. The most numerous type of family households are 2-person households, comprising 237, and the most common type of nonfamily households are 1-person households, comprising 127.
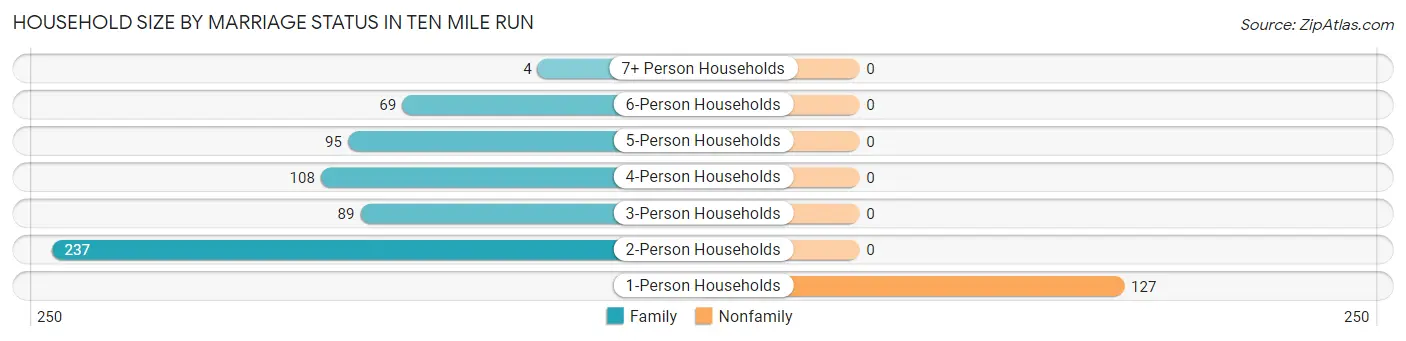
| Household Size | Family Households | Nonfamily Households |
| 1-Person Households | - | 127 (17.4%) |
| 2-Person Households | 237 (32.5%) | 0 (0.0%) |
| 3-Person Households | 89 (12.2%) | 0 (0.0%) |
| 4-Person Households | 108 (14.8%) | 0 (0.0%) |
| 5-Person Households | 95 (13.0%) | 0 (0.0%) |
| 6-Person Households | 69 (9.5%) | 0 (0.0%) |
| 7+ Person Households | 4 (0.5%) | 0 (0.0%) |
| Total | 602 (82.6%) | 127 (17.4%) |
Female Fertility in Ten Mile Run
Fertility by Age in Ten Mile Run
| Age Bracket | Women with Births | Births / 1,000 Women |
| 15 to 19 years | 0 (0.0%) | 0.0 |
| 20 to 34 years | 0 (0.0%) | 0.0 |
| 35 to 50 years | 0 (0.0%) | 0.0 |
| Total | 0 (0.0%) | 0.0 |
Fertility by Age by Marriage Status in Ten Mile Run
| Age Bracket | Married | Unmarried |
| 15 to 19 years | 0 (0.0%) | 0 (0.0%) |
| 20 to 34 years | 0 (0.0%) | 0 (0.0%) |
| 35 to 50 years | 0 (0.0%) | 0 (0.0%) |
| Total | 0 (0.0%) | 0 (0.0%) |
Fertility by Education in Ten Mile Run
| Educational Attainment | Women with Births | Births / 1,000 Women |
| Less than High School | 0 (0.0%) | 0.0 |
| High School Diploma | 0 (0.0%) | 0.0 |
| College or Associate's Degree | 0 (0.0%) | 0.0 |
| Bachelor's Degree | 0 (0.0%) | 0.0 |
| Graduate Degree | 0 (0.0%) | 0.0 |
| Total | 0 (0.0%) | 0.0 |
Fertility by Education by Marriage Status in Ten Mile Run
| Educational Attainment | Married | Unmarried |
| Less than High School | 0 (0.0%) | 0 (0.0%) |
| High School Diploma | 0 (0.0%) | 0 (0.0%) |
| College or Associate's Degree | 0 (0.0%) | 0 (0.0%) |
| Bachelor's Degree | 0 (0.0%) | 0 (0.0%) |
| Graduate Degree | 0 (0.0%) | 0 (0.0%) |
| Total | 0 (0.0%) | 0 (0.0%) |
Employment Characteristics in Ten Mile Run
Employment by Class of Employer in Ten Mile Run
Among the 1,195 employed individuals in Ten Mile Run, private company employees (959 | 80.2%), self-employed (not incorporated) (88 | 7.4%), and self-employed (incorporated) (54 | 4.5%) make up the most common classes of employment.
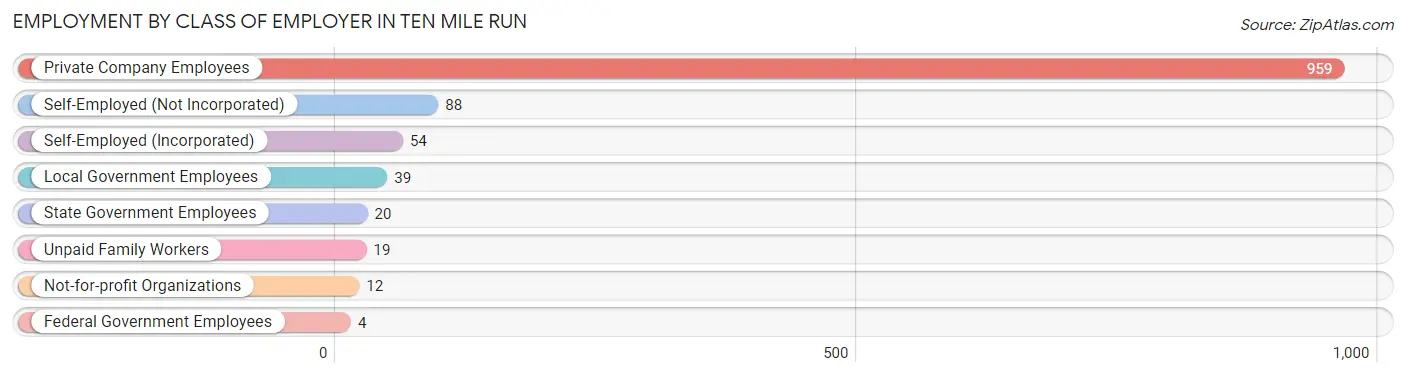
| Employer Class | # Employees | % Employees |
| Private Company Employees | 959 | 80.2% |
| Self-Employed (Incorporated) | 54 | 4.5% |
| Self-Employed (Not Incorporated) | 88 | 7.4% |
| Not-for-profit Organizations | 12 | 1.0% |
| Local Government Employees | 39 | 3.3% |
| State Government Employees | 20 | 1.7% |
| Federal Government Employees | 4 | 0.3% |
| Unpaid Family Workers | 19 | 1.6% |
| Total | 1,195 | 100.0% |
Employment Status by Age in Ten Mile Run
According to the labor force statistics for Ten Mile Run, out of the total population over 16 years of age (1,821), 72.5% or 1,320 individuals are in the labor force, with 3.6% or 48 of them unemployed. The age group with the highest labor force participation rate is 25 to 29 years, with 100.0% or 14 individuals in the labor force. Within the labor force, the 30 to 34 years age range has the highest percentage of unemployed individuals, with 22.4% or 32 of them being unemployed.
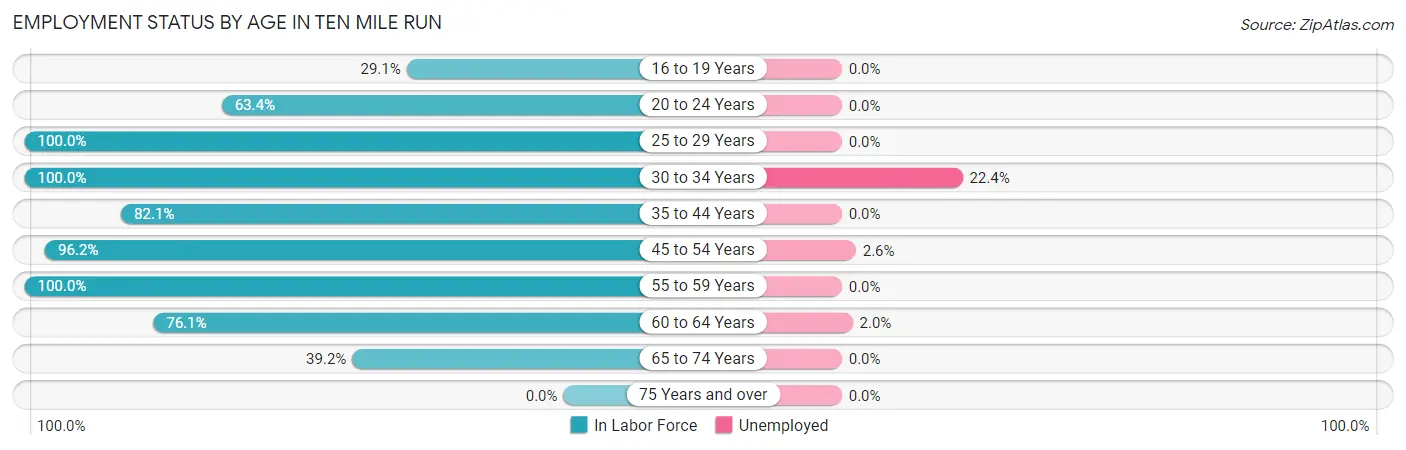
| Age Bracket | In Labor Force | Unemployed |
| 16 to 19 Years | 25 (29.1%) | 0 (0.0%) |
| 20 to 24 Years | 116 (63.4%) | 0 (0.0%) |
| 25 to 29 Years | 14 (100.0%) | 0 (0.0%) |
| 30 to 34 Years | 143 (100.0%) | 32 (22.4%) |
| 35 to 44 Years | 211 (82.1%) | 0 (0.0%) |
| 45 to 54 Years | 426 (96.2%) | 11 (2.6%) |
| 55 to 59 Years | 81 (100.0%) | 0 (0.0%) |
| 60 to 64 Years | 201 (76.1%) | 4 (2.0%) |
| 65 to 74 Years | 103 (39.2%) | 0 (0.0%) |
| 75 Years and over | 0 (0.0%) | 0 (0.0%) |
| Total | 1,320 (72.5%) | 48 (3.6%) |
Employment Status by Educational Attainment in Ten Mile Run
According to labor force statistics for Ten Mile Run, 89.5% of individuals (1,076) out of the total population between 25 and 64 years of age (1,202) are in the labor force, with 4.4% or 47 of them being unemployed. The group with the highest labor force participation rate are those with the educational attainment of less than high school, with 100.0% or 82 individuals in the labor force. Within the labor force, individuals with high school diploma education have the highest percentage of unemployment, with 100.0% or 4 of them being unemployed.
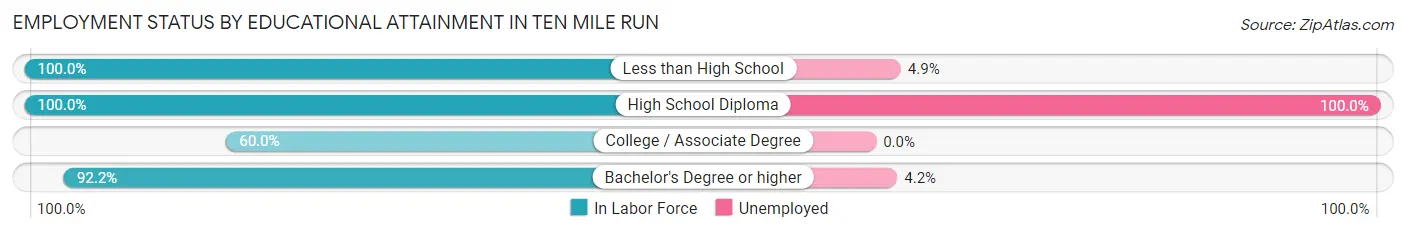
| Educational Attainment | In Labor Force | Unemployed |
| Less than High School | 82 (100.0%) | 4 (4.9%) |
| High School Diploma | 4 (100.0%) | 4 (100.0%) |
| College / Associate Degree | 72 (60.0%) | 0 (0.0%) |
| Bachelor's Degree or higher | 918 (92.2%) | 42 (4.2%) |
| Total | 1,076 (89.5%) | 53 (4.4%) |
Employment Occupations by Sex in Ten Mile Run
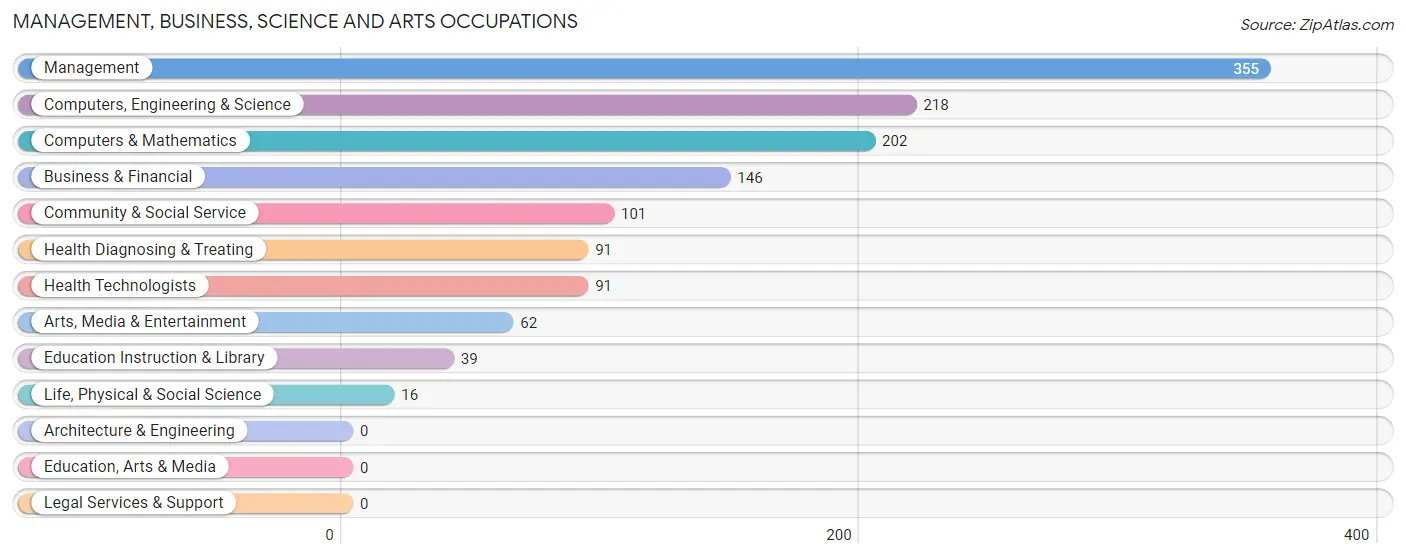
Management, Business, Science and Arts Occupations
The most common Management, Business, Science and Arts occupations in Ten Mile Run are Management (355 | 27.9%), Computers, Engineering & Science (218 | 17.1%), Computers & Mathematics (202 | 15.9%), Business & Financial (146 | 11.5%), and Community & Social Service (101 | 7.9%).
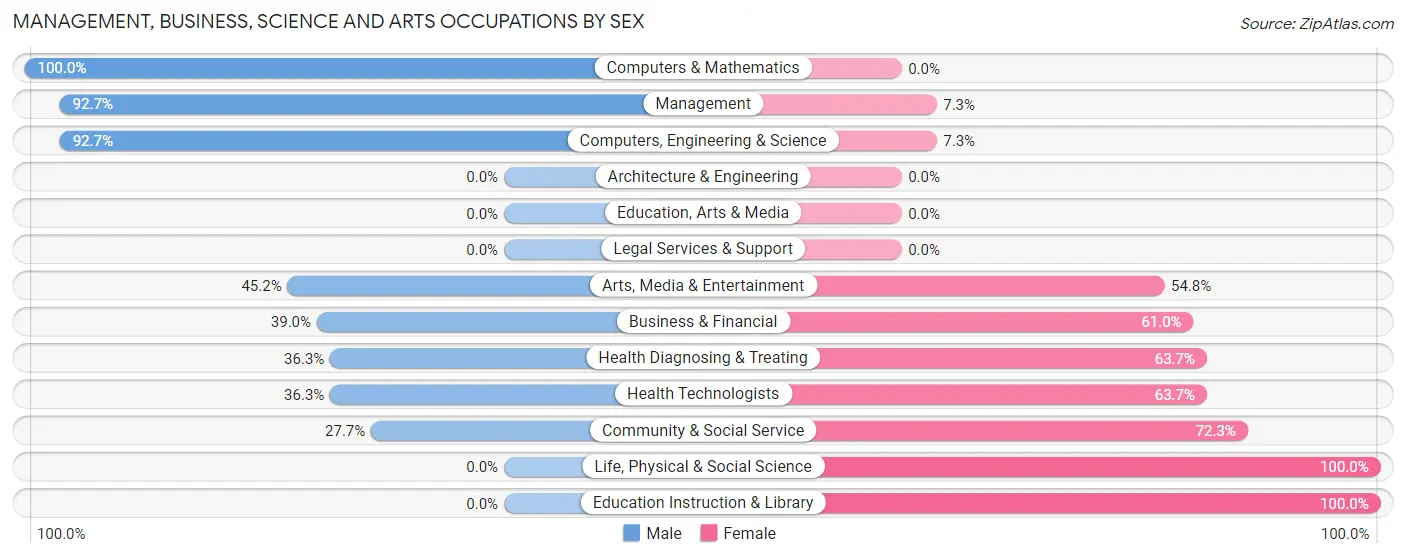
Management, Business, Science and Arts Occupations by Sex
Within the Management, Business, Science and Arts occupations in Ten Mile Run, the most male-oriented occupations are Computers & Mathematics (100.0%), Management (92.7%), and Computers, Engineering & Science (92.7%), while the most female-oriented occupations are Life, Physical & Social Science (100.0%), Education Instruction & Library (100.0%), and Community & Social Service (72.3%).
| Occupation | Male | Female |
| Management | 329 (92.7%) | 26 (7.3%) |
| Business & Financial | 57 (39.0%) | 89 (61.0%) |
| Computers, Engineering & Science | 202 (92.7%) | 16 (7.3%) |
| Computers & Mathematics | 202 (100.0%) | 0 (0.0%) |
| Architecture & Engineering | 0 (0.0%) | 0 (0.0%) |
| Life, Physical & Social Science | 0 (0.0%) | 16 (100.0%) |
| Community & Social Service | 28 (27.7%) | 73 (72.3%) |
| Education, Arts & Media | 0 (0.0%) | 0 (0.0%) |
| Legal Services & Support | 0 (0.0%) | 0 (0.0%) |
| Education Instruction & Library | 0 (0.0%) | 39 (100.0%) |
| Arts, Media & Entertainment | 28 (45.2%) | 34 (54.8%) |
| Health Diagnosing & Treating | 33 (36.3%) | 58 (63.7%) |
| Health Technologists | 33 (36.3%) | 58 (63.7%) |
| Total (Category) | 649 (71.2%) | 262 (28.8%) |
| Total (Overall) | 769 (60.4%) | 504 (39.6%) |
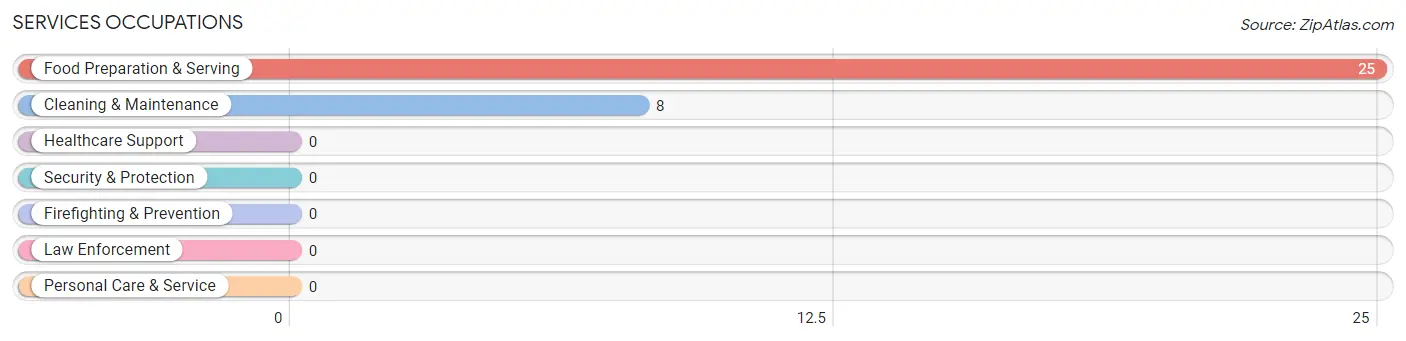
Services Occupations
The most common Services occupations in Ten Mile Run are Food Preparation & Serving (25 | 2.0%), and Cleaning & Maintenance (8 | 0.6%).
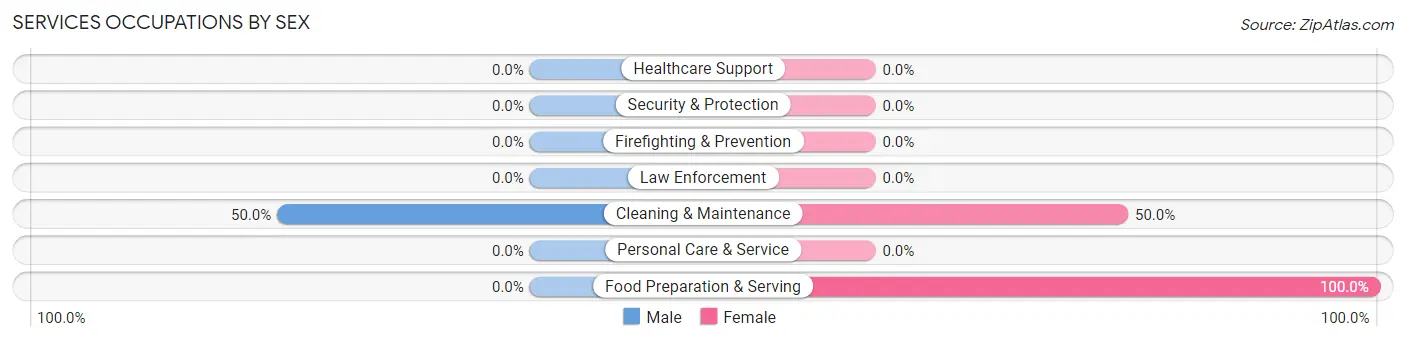
Services Occupations by Sex
| Occupation | Male | Female |
| Healthcare Support | 0 (0.0%) | 0 (0.0%) |
| Security & Protection | 0 (0.0%) | 0 (0.0%) |
| Firefighting & Prevention | 0 (0.0%) | 0 (0.0%) |
| Law Enforcement | 0 (0.0%) | 0 (0.0%) |
| Food Preparation & Serving | 0 (0.0%) | 25 (100.0%) |
| Cleaning & Maintenance | 4 (50.0%) | 4 (50.0%) |
| Personal Care & Service | 0 (0.0%) | 0 (0.0%) |
| Total (Category) | 4 (12.1%) | 29 (87.9%) |
| Total (Overall) | 769 (60.4%) | 504 (39.6%) |
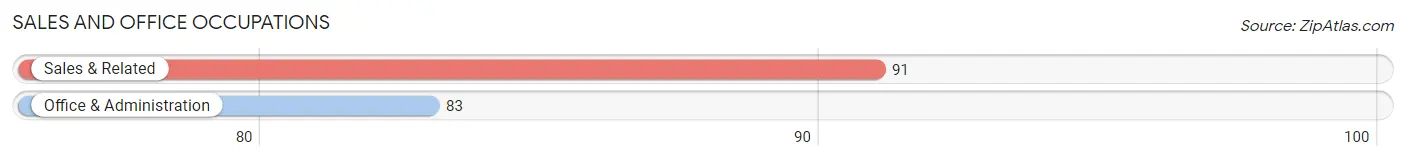
Sales and Office Occupations
The most common Sales and Office occupations in Ten Mile Run are Sales & Related (91 | 7.1%), and Office & Administration (83 | 6.5%).
Sales and Office Occupations by Sex
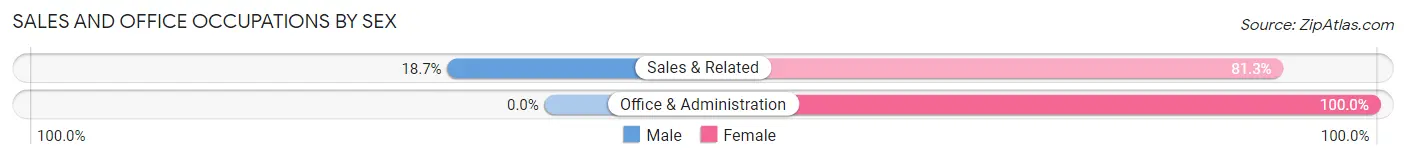
| Occupation | Male | Female |
| Sales & Related | 17 (18.7%) | 74 (81.3%) |
| Office & Administration | 0 (0.0%) | 83 (100.0%) |
| Total (Category) | 17 (9.8%) | 157 (90.2%) |
| Total (Overall) | 769 (60.4%) | 504 (39.6%) |
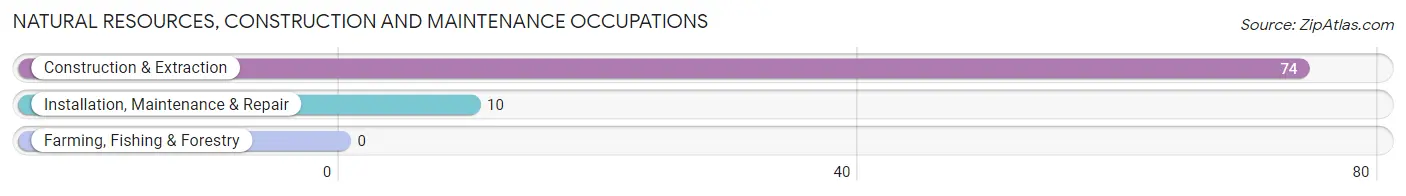
Natural Resources, Construction and Maintenance Occupations
The most common Natural Resources, Construction and Maintenance occupations in Ten Mile Run are Construction & Extraction (74 | 5.8%), and Installation, Maintenance & Repair (10 | 0.8%).
Natural Resources, Construction and Maintenance Occupations by Sex
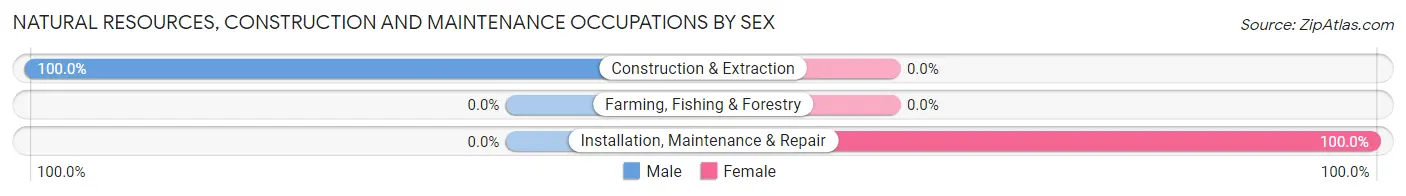
| Occupation | Male | Female |
| Farming, Fishing & Forestry | 0 (0.0%) | 0 (0.0%) |
| Construction & Extraction | 74 (100.0%) | 0 (0.0%) |
| Installation, Maintenance & Repair | 0 (0.0%) | 10 (100.0%) |
| Total (Category) | 74 (88.1%) | 10 (11.9%) |
| Total (Overall) | 769 (60.4%) | 504 (39.6%) |
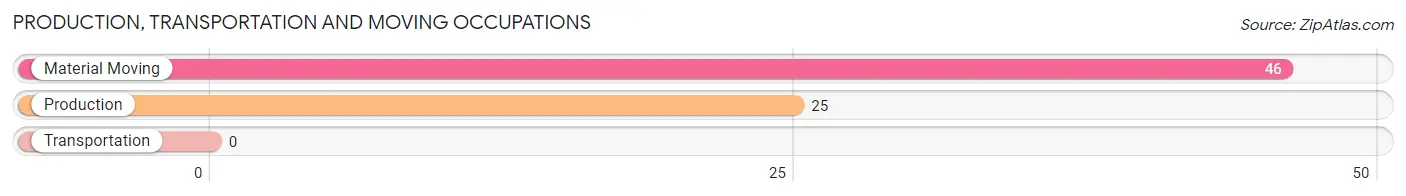
Production, Transportation and Moving Occupations
The most common Production, Transportation and Moving occupations in Ten Mile Run are Material Moving (46 | 3.6%), and Production (25 | 2.0%).
Production, Transportation and Moving Occupations by Sex
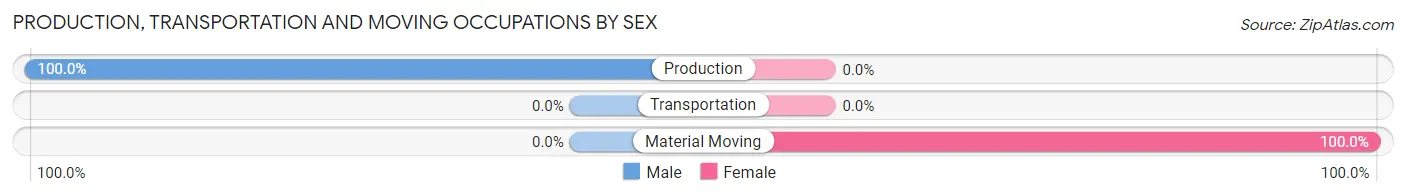
| Occupation | Male | Female |
| Production | 25 (100.0%) | 0 (0.0%) |
| Transportation | 0 (0.0%) | 0 (0.0%) |
| Material Moving | 0 (0.0%) | 46 (100.0%) |
| Total (Category) | 25 (35.2%) | 46 (64.8%) |
| Total (Overall) | 769 (60.4%) | 504 (39.6%) |
Employment Industries by Sex in Ten Mile Run
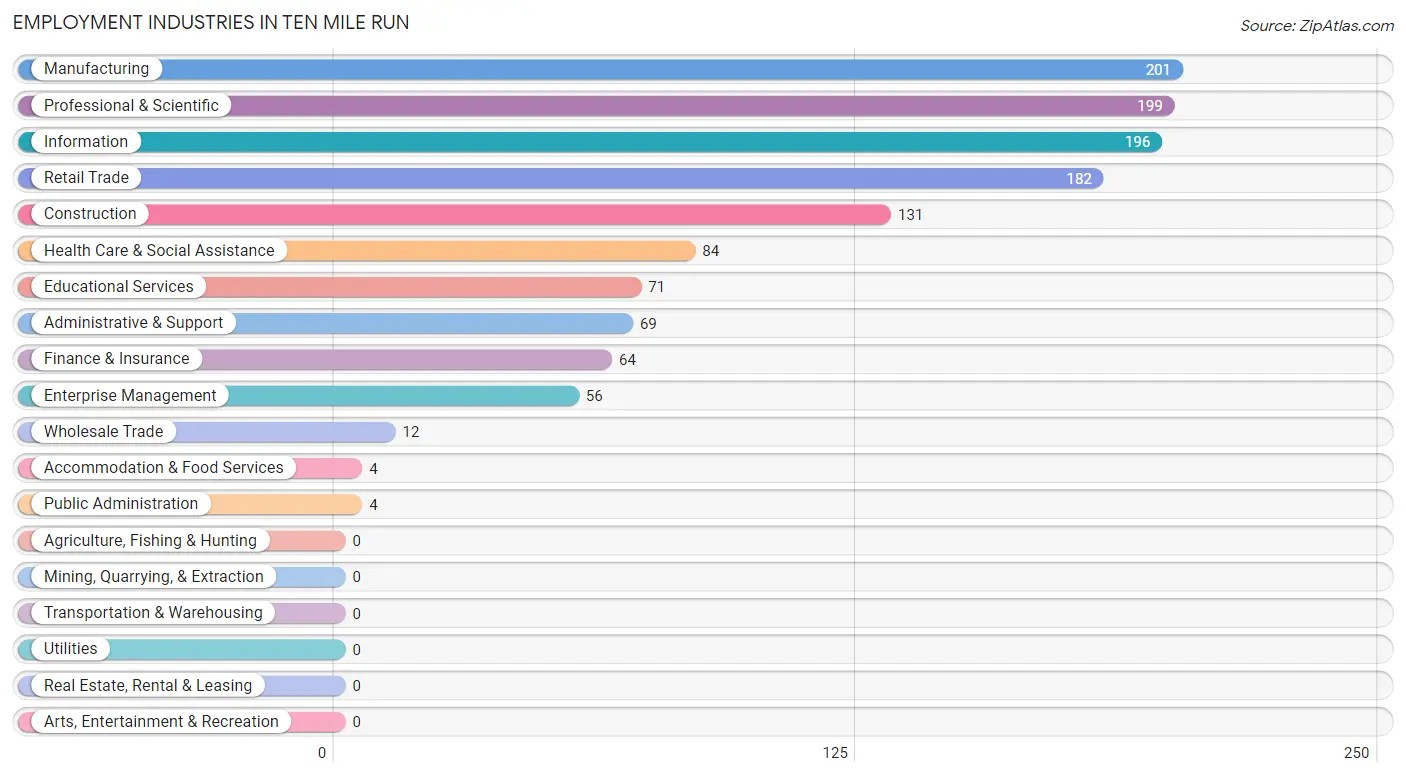
Employment Industries in Ten Mile Run
The major employment industries in Ten Mile Run include Manufacturing (201 | 15.8%), Professional & Scientific (199 | 15.6%), Information (196 | 15.4%), Retail Trade (182 | 14.3%), and Construction (131 | 10.3%).
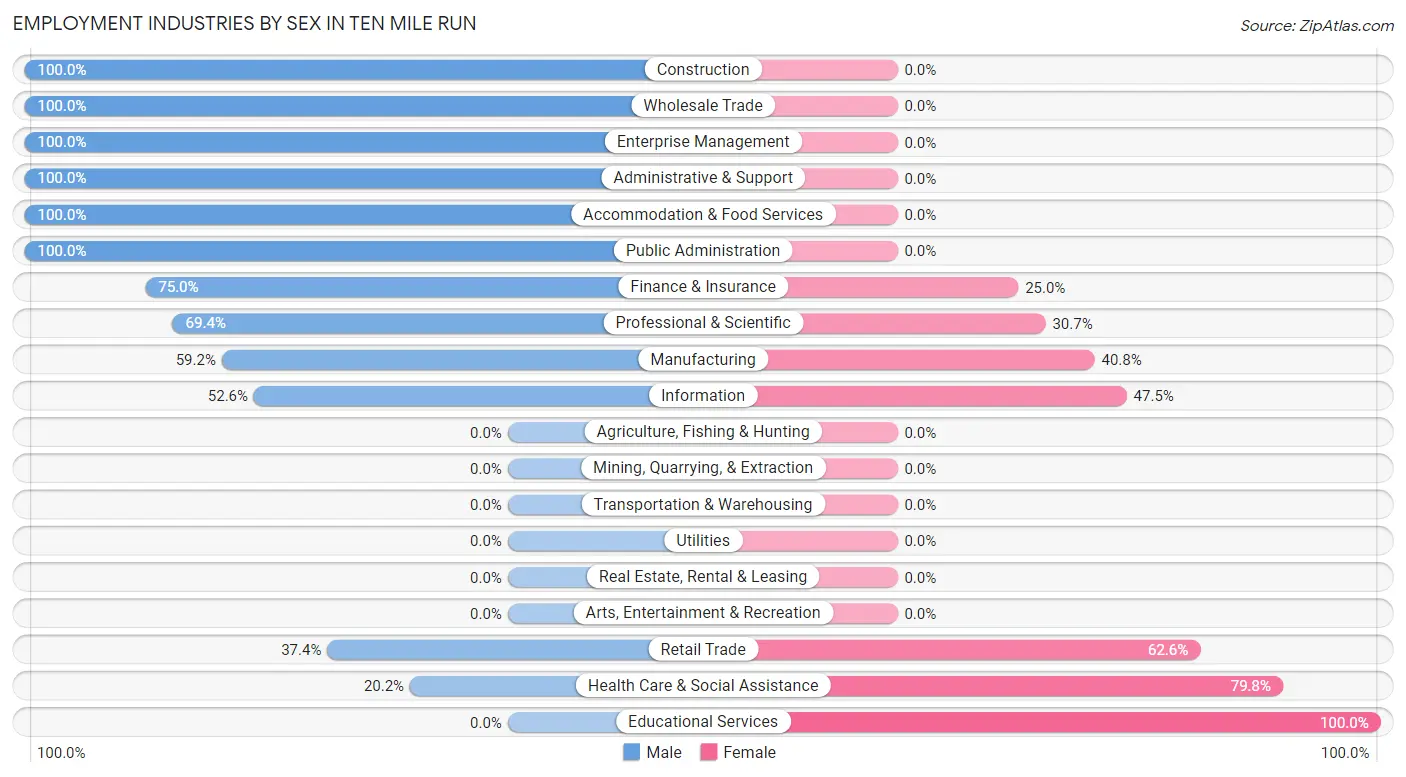
Employment Industries by Sex in Ten Mile Run
The Ten Mile Run industries that see more men than women are Construction (100.0%), Wholesale Trade (100.0%), and Enterprise Management (100.0%), whereas the industries that tend to have a higher number of women are Educational Services (100.0%), Health Care & Social Assistance (79.8%), and Retail Trade (62.6%).
| Industry | Male | Female |
| Agriculture, Fishing & Hunting | 0 (0.0%) | 0 (0.0%) |
| Mining, Quarrying, & Extraction | 0 (0.0%) | 0 (0.0%) |
| Construction | 131 (100.0%) | 0 (0.0%) |
| Manufacturing | 119 (59.2%) | 82 (40.8%) |
| Wholesale Trade | 12 (100.0%) | 0 (0.0%) |
| Retail Trade | 68 (37.4%) | 114 (62.6%) |
| Transportation & Warehousing | 0 (0.0%) | 0 (0.0%) |
| Utilities | 0 (0.0%) | 0 (0.0%) |
| Information | 103 (52.5%) | 93 (47.4%) |
| Finance & Insurance | 48 (75.0%) | 16 (25.0%) |
| Real Estate, Rental & Leasing | 0 (0.0%) | 0 (0.0%) |
| Professional & Scientific | 138 (69.4%) | 61 (30.6%) |
| Enterprise Management | 56 (100.0%) | 0 (0.0%) |
| Administrative & Support | 69 (100.0%) | 0 (0.0%) |
| Educational Services | 0 (0.0%) | 71 (100.0%) |
| Health Care & Social Assistance | 17 (20.2%) | 67 (79.8%) |
| Arts, Entertainment & Recreation | 0 (0.0%) | 0 (0.0%) |
| Accommodation & Food Services | 4 (100.0%) | 0 (0.0%) |
| Public Administration | 4 (100.0%) | 0 (0.0%) |
| Total | 769 (60.4%) | 504 (39.6%) |
Education in Ten Mile Run
School Enrollment in Ten Mile Run
The most common levels of schooling among the 589 students in Ten Mile Run are elementary school (154 | 26.2%), graduate / professional (93 | 15.8%), and college / undergraduate (92 | 15.6%).
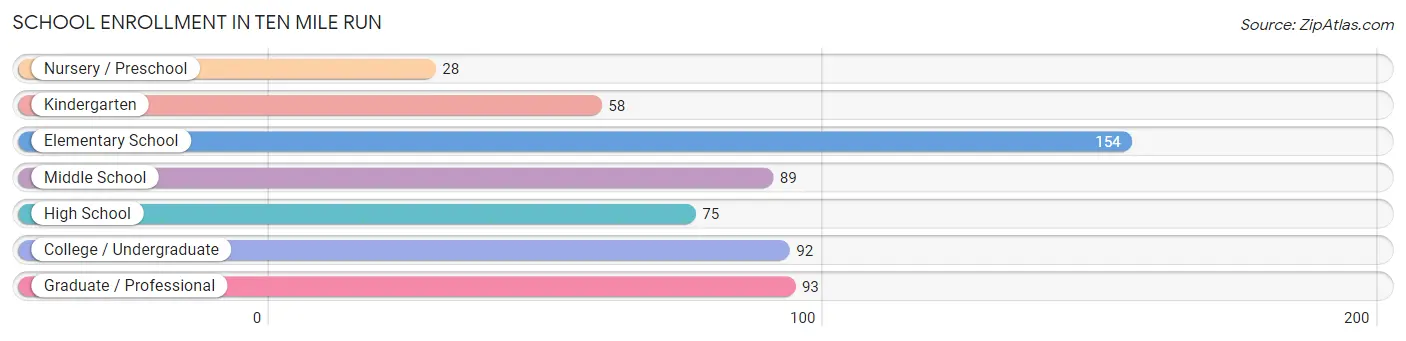
| School Level | # Students | % Students |
| Nursery / Preschool | 28 | 4.8% |
| Kindergarten | 58 | 9.9% |
| Elementary School | 154 | 26.2% |
| Middle School | 89 | 15.1% |
| High School | 75 | 12.7% |
| College / Undergraduate | 92 | 15.6% |
| Graduate / Professional | 93 | 15.8% |
| Total | 589 | 100.0% |
School Enrollment by Age by Funding Source in Ten Mile Run
Out of a total of 589 students who are enrolled in schools in Ten Mile Run, 51 (8.7%) attend a private institution, while the remaining 538 (91.3%) are enrolled in public schools. The age group of 10 to 14 year olds has the highest likelihood of being enrolled in private schools, with 16 (18.0% in the age bracket) enrolled. Conversely, the age group of 15 to 17 year olds has the lowest likelihood of being enrolled in a private school, with 75 (100.0% in the age bracket) attending a public institution.
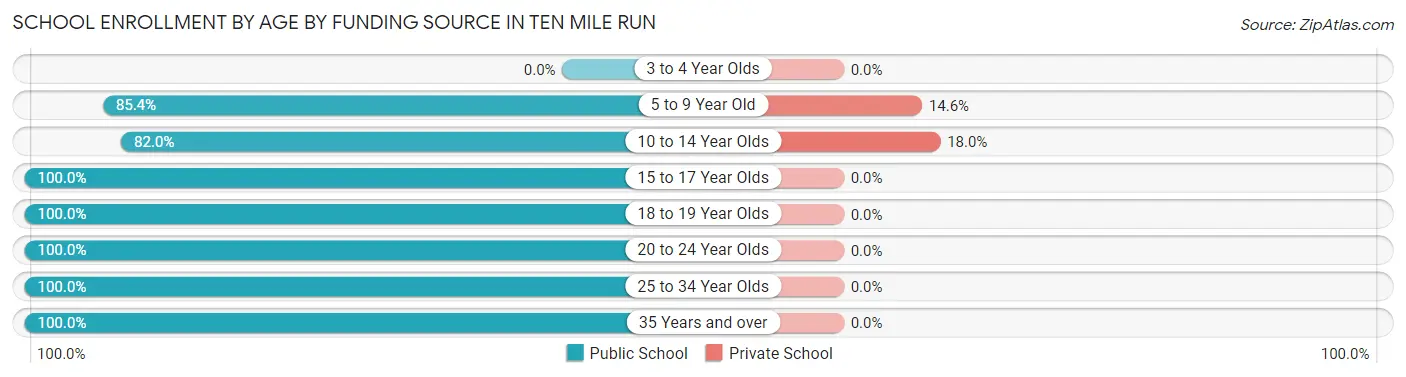
| Age Bracket | Public School | Private School |
| 3 to 4 Year Olds | 0 (0.0%) | 0 (0.0%) |
| 5 to 9 Year Old | 205 (85.4%) | 35 (14.6%) |
| 10 to 14 Year Olds | 73 (82.0%) | 16 (18.0%) |
| 15 to 17 Year Olds | 75 (100.0%) | 0 (0.0%) |
| 18 to 19 Year Olds | 25 (100.0%) | 0 (0.0%) |
| 20 to 24 Year Olds | 67 (100.0%) | 0 (0.0%) |
| 25 to 34 Year Olds | 7 (100.0%) | 0 (0.0%) |
| 35 Years and over | 86 (100.0%) | 0 (0.0%) |
| Total | 538 (91.3%) | 51 (8.7%) |
Educational Attainment by Field of Study in Ten Mile Run
Business (277 | 20.4%), computers & mathematics (228 | 16.8%), engineering (177 | 13.0%), science & technology (175 | 12.9%), and education (88 | 6.5%) are the most common fields of study among 1,357 individuals in Ten Mile Run who have obtained a bachelor's degree or higher.
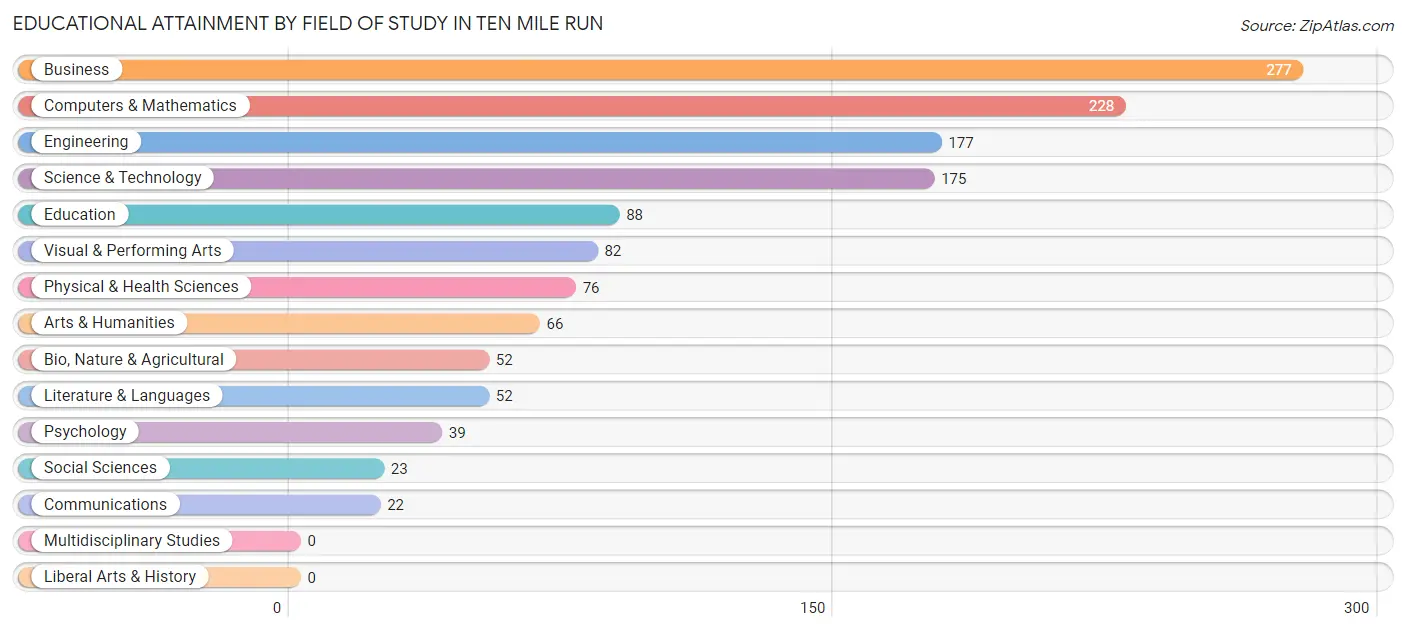
| Field of Study | # Graduates | % Graduates |
| Computers & Mathematics | 228 | 16.8% |
| Bio, Nature & Agricultural | 52 | 3.8% |
| Physical & Health Sciences | 76 | 5.6% |
| Psychology | 39 | 2.9% |
| Social Sciences | 23 | 1.7% |
| Engineering | 177 | 13.0% |
| Multidisciplinary Studies | 0 | 0.0% |
| Science & Technology | 175 | 12.9% |
| Business | 277 | 20.4% |
| Education | 88 | 6.5% |
| Literature & Languages | 52 | 3.8% |
| Liberal Arts & History | 0 | 0.0% |
| Visual & Performing Arts | 82 | 6.0% |
| Communications | 22 | 1.6% |
| Arts & Humanities | 66 | 4.9% |
| Total | 1,357 | 100.0% |
Transportation & Commute in Ten Mile Run
Vehicle Availability by Sex in Ten Mile Run
The most prevalent vehicle ownership categories in Ten Mile Run are males with 2 vehicles (338, accounting for 48.9%) and females with 2 vehicles (227, making up 67.1%).
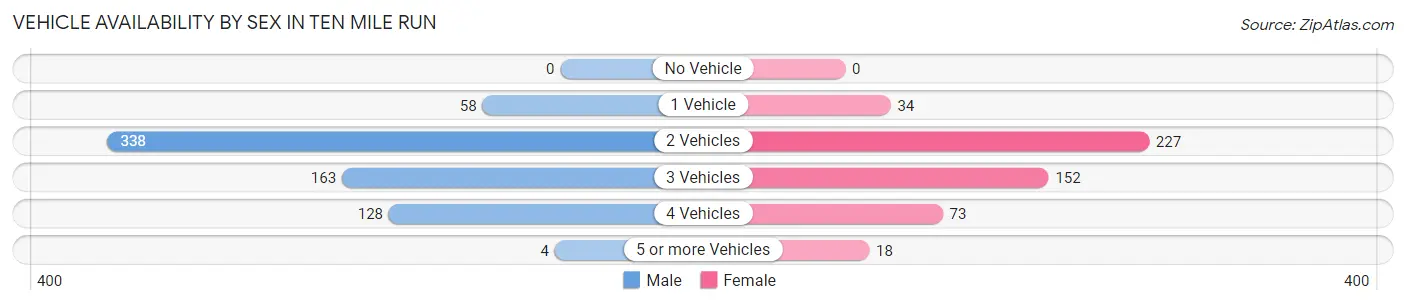
| Vehicles Available | Male | Female |
| No Vehicle | 0 (0.0%) | 0 (0.0%) |
| 1 Vehicle | 58 (8.4%) | 34 (6.8%) |
| 2 Vehicles | 338 (48.9%) | 227 (45.0%) |
| 3 Vehicles | 163 (23.6%) | 152 (30.2%) |
| 4 Vehicles | 128 (18.5%) | 73 (14.5%) |
| 5 or more Vehicles | 4 (0.6%) | 18 (3.6%) |
| Total | 691 (100.0%) | 504 (100.0%) |
Commute Time in Ten Mile Run
The most frequently occuring commute durations in Ten Mile Run are 25 to 29 minutes (170 commuters, 22.8%), 45 to 59 minutes (156 commuters, 20.9%), and 40 to 44 minutes (103 commuters, 13.8%).
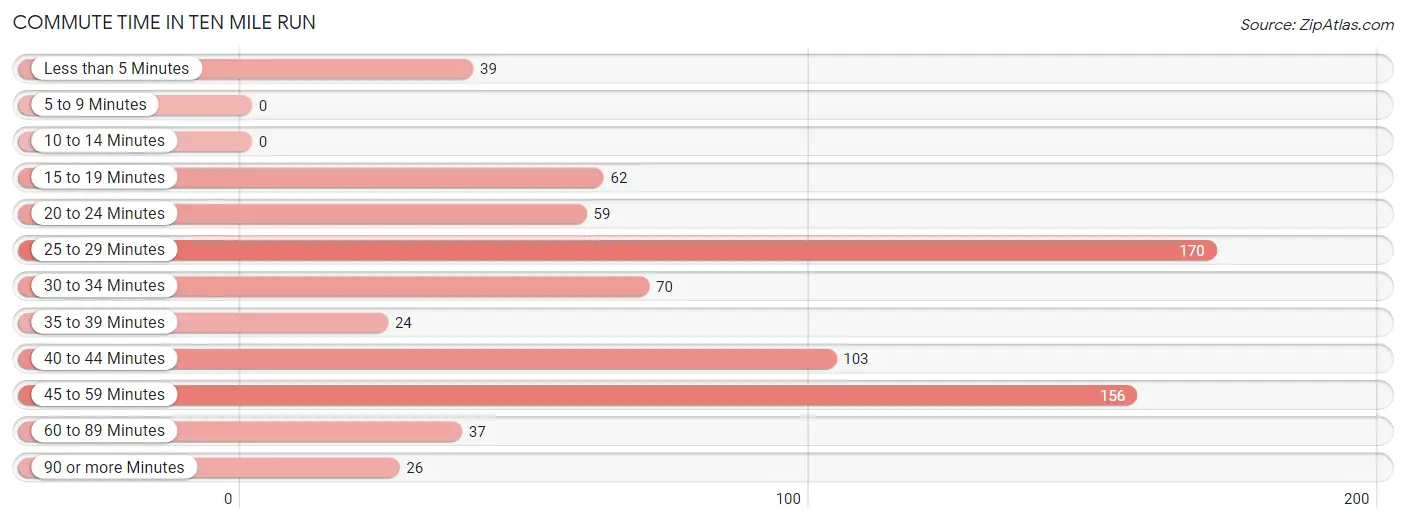
| Commute Time | # Commuters | % Commuters |
| Less than 5 Minutes | 39 | 5.2% |
| 5 to 9 Minutes | 0 | 0.0% |
| 10 to 14 Minutes | 0 | 0.0% |
| 15 to 19 Minutes | 62 | 8.3% |
| 20 to 24 Minutes | 59 | 7.9% |
| 25 to 29 Minutes | 170 | 22.8% |
| 30 to 34 Minutes | 70 | 9.4% |
| 35 to 39 Minutes | 24 | 3.2% |
| 40 to 44 Minutes | 103 | 13.8% |
| 45 to 59 Minutes | 156 | 20.9% |
| 60 to 89 Minutes | 37 | 5.0% |
| 90 or more Minutes | 26 | 3.5% |
Commute Time by Sex in Ten Mile Run
The most common commute times in Ten Mile Run are 45 to 59 minutes (112 commuters, 28.6%) for males and 25 to 29 minutes (89 commuters, 25.1%) for females.
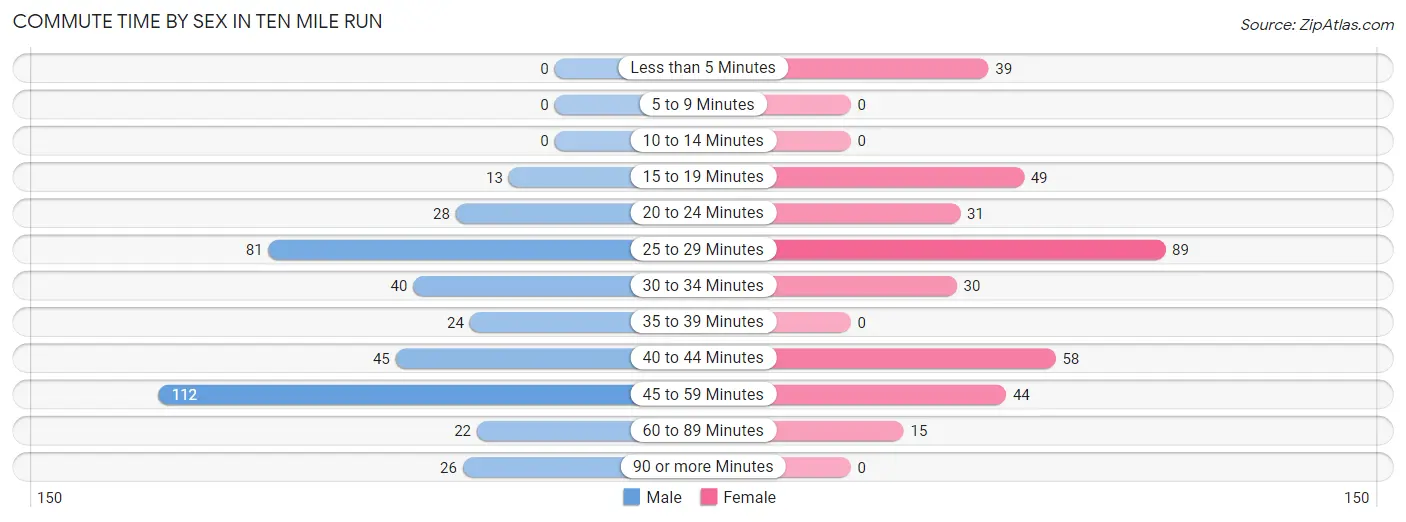
| Commute Time | Male | Female |
| Less than 5 Minutes | 0 (0.0%) | 39 (11.0%) |
| 5 to 9 Minutes | 0 (0.0%) | 0 (0.0%) |
| 10 to 14 Minutes | 0 (0.0%) | 0 (0.0%) |
| 15 to 19 Minutes | 13 (3.3%) | 49 (13.8%) |
| 20 to 24 Minutes | 28 (7.2%) | 31 (8.7%) |
| 25 to 29 Minutes | 81 (20.7%) | 89 (25.1%) |
| 30 to 34 Minutes | 40 (10.2%) | 30 (8.5%) |
| 35 to 39 Minutes | 24 (6.1%) | 0 (0.0%) |
| 40 to 44 Minutes | 45 (11.5%) | 58 (16.3%) |
| 45 to 59 Minutes | 112 (28.6%) | 44 (12.4%) |
| 60 to 89 Minutes | 22 (5.6%) | 15 (4.2%) |
| 90 or more Minutes | 26 (6.7%) | 0 (0.0%) |
Time of Departure to Work by Sex in Ten Mile Run
The most frequent times of departure to work in Ten Mile Run are 9:00 AM to 9:59 AM (67, 17.1%) for males and 12:00 PM to 3:59 PM (122, 34.4%) for females.
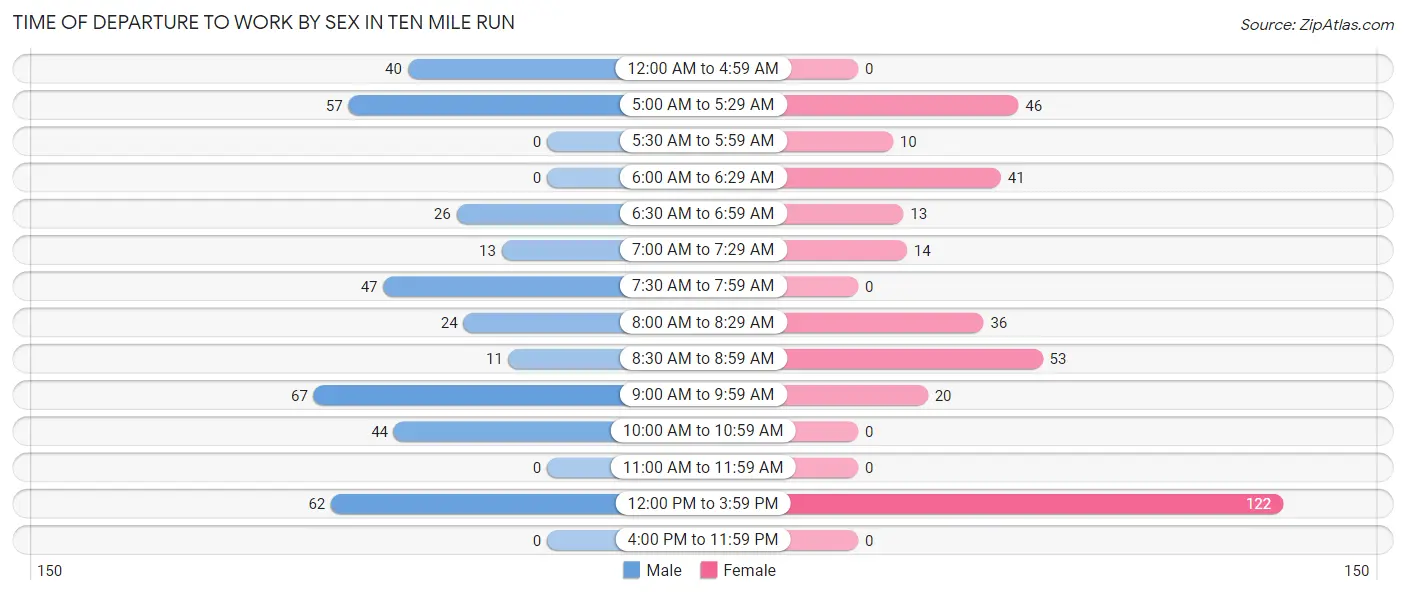
| Time of Departure | Male | Female |
| 12:00 AM to 4:59 AM | 40 (10.2%) | 0 (0.0%) |
| 5:00 AM to 5:29 AM | 57 (14.6%) | 46 (13.0%) |
| 5:30 AM to 5:59 AM | 0 (0.0%) | 10 (2.8%) |
| 6:00 AM to 6:29 AM | 0 (0.0%) | 41 (11.6%) |
| 6:30 AM to 6:59 AM | 26 (6.7%) | 13 (3.7%) |
| 7:00 AM to 7:29 AM | 13 (3.3%) | 14 (3.9%) |
| 7:30 AM to 7:59 AM | 47 (12.0%) | 0 (0.0%) |
| 8:00 AM to 8:29 AM | 24 (6.1%) | 36 (10.1%) |
| 8:30 AM to 8:59 AM | 11 (2.8%) | 53 (14.9%) |
| 9:00 AM to 9:59 AM | 67 (17.1%) | 20 (5.6%) |
| 10:00 AM to 10:59 AM | 44 (11.3%) | 0 (0.0%) |
| 11:00 AM to 11:59 AM | 0 (0.0%) | 0 (0.0%) |
| 12:00 PM to 3:59 PM | 62 (15.9%) | 122 (34.4%) |
| 4:00 PM to 11:59 PM | 0 (0.0%) | 0 (0.0%) |
| Total | 391 (100.0%) | 355 (100.0%) |
Housing Occupancy in Ten Mile Run
Occupancy by Ownership in Ten Mile Run
Of the total 729 dwellings in Ten Mile Run, owner-occupied units account for 596 (81.8%), while renter-occupied units make up 133 (18.2%).
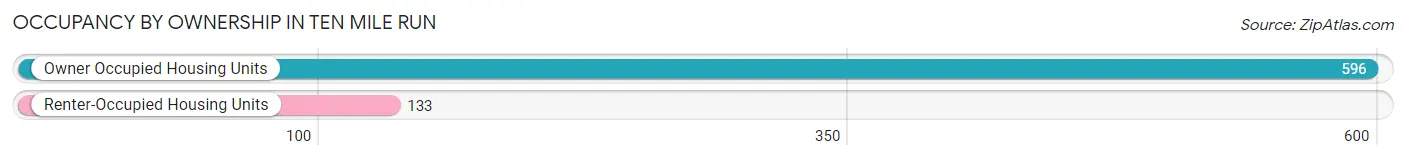
| Occupancy | # Housing Units | % Housing Units |
| Owner Occupied Housing Units | 596 | 81.8% |
| Renter-Occupied Housing Units | 133 | 18.2% |
| Total Occupied Housing Units | 729 | 100.0% |
Occupancy by Household Size in Ten Mile Run
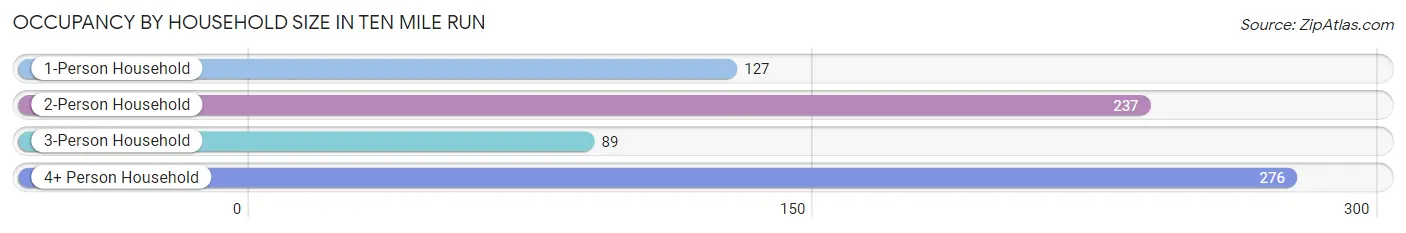
| Household Size | # Housing Units | % Housing Units |
| 1-Person Household | 127 | 17.4% |
| 2-Person Household | 237 | 32.5% |
| 3-Person Household | 89 | 12.2% |
| 4+ Person Household | 276 | 37.9% |
| Total Housing Units | 729 | 100.0% |
Occupancy by Ownership by Household Size in Ten Mile Run
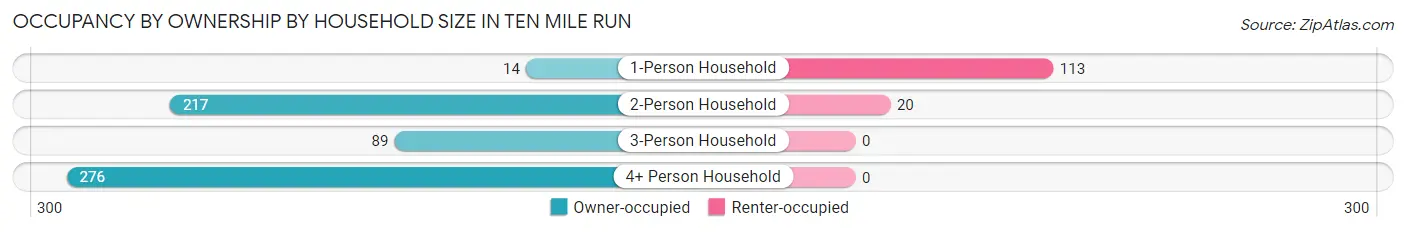
| Household Size | Owner-occupied | Renter-occupied |
| 1-Person Household | 14 (11.0%) | 113 (89.0%) |
| 2-Person Household | 217 (91.6%) | 20 (8.4%) |
| 3-Person Household | 89 (100.0%) | 0 (0.0%) |
| 4+ Person Household | 276 (100.0%) | 0 (0.0%) |
| Total Housing Units | 596 (81.8%) | 133 (18.2%) |
Occupancy by Educational Attainment in Ten Mile Run
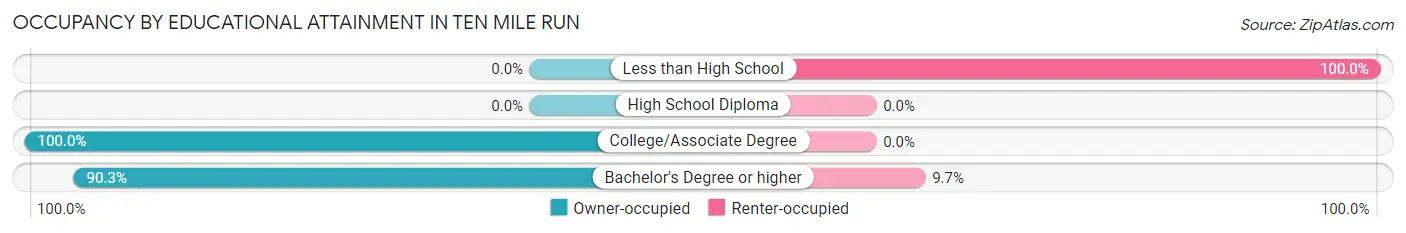
| Household Size | Owner-occupied | Renter-occupied |
| Less than High School | 0 (0.0%) | 74 (100.0%) |
| High School Diploma | 0 (0.0%) | 0 (0.0%) |
| College/Associate Degree | 48 (100.0%) | 0 (0.0%) |
| Bachelor's Degree or higher | 548 (90.3%) | 59 (9.7%) |
Occupancy by Age of Householder in Ten Mile Run
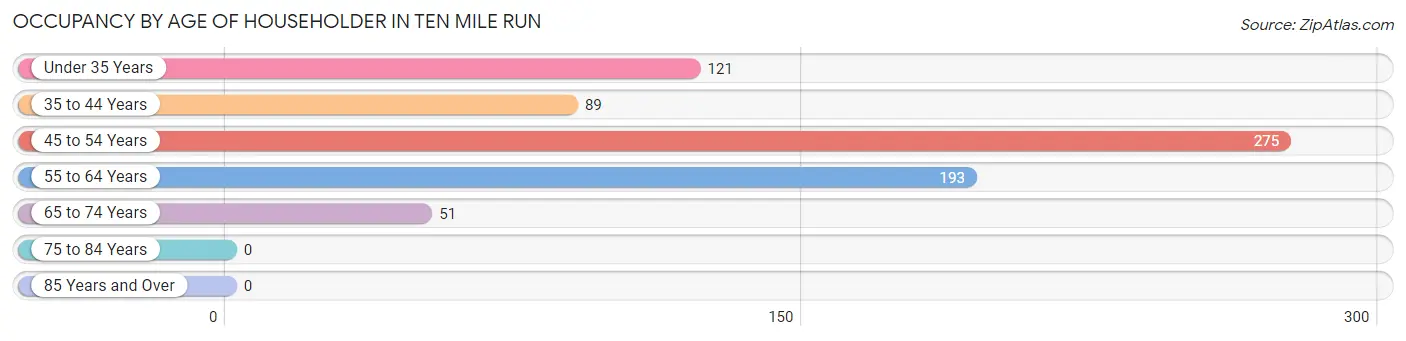
| Age Bracket | # Households | % Households |
| Under 35 Years | 121 | 16.6% |
| 35 to 44 Years | 89 | 12.2% |
| 45 to 54 Years | 275 | 37.7% |
| 55 to 64 Years | 193 | 26.5% |
| 65 to 74 Years | 51 | 7.0% |
| 75 to 84 Years | 0 | 0.0% |
| 85 Years and Over | 0 | 0.0% |
| Total | 729 | 100.0% |
Housing Finances in Ten Mile Run
Median Income by Occupancy in Ten Mile Run
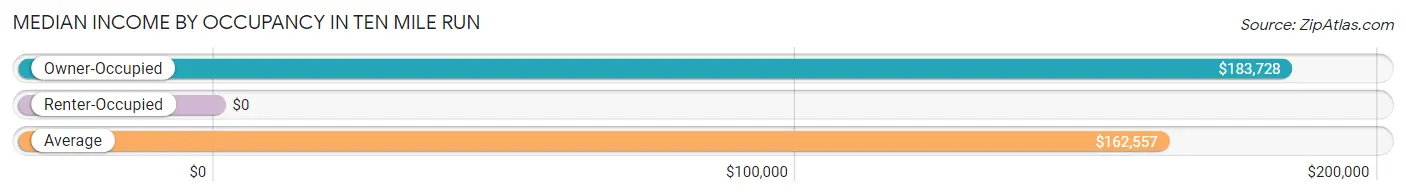
| Occupancy Type | # Households | Median Income |
| Owner-Occupied | 596 (81.8%) | $183,728 |
| Renter-Occupied | 133 (18.2%) | $0 |
| Average | 729 (100.0%) | $162,557 |
Occupancy by Householder Income Bracket in Ten Mile Run
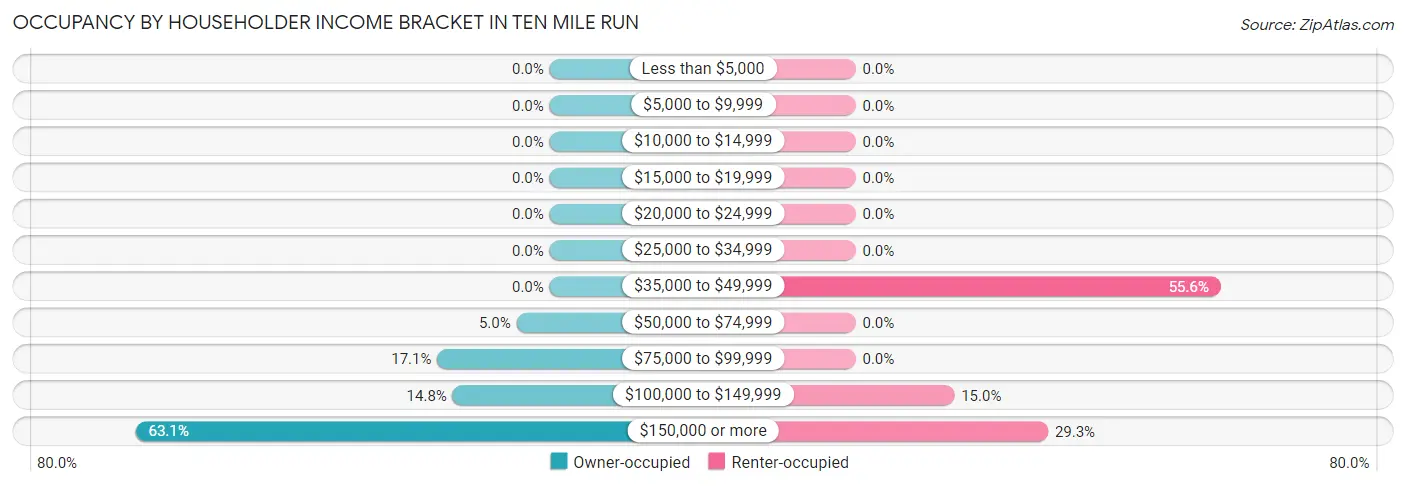
| Income Bracket | Owner-occupied | Renter-occupied |
| Less than $5,000 | 0 (0.0%) | 0 (0.0%) |
| $5,000 to $9,999 | 0 (0.0%) | 0 (0.0%) |
| $10,000 to $14,999 | 0 (0.0%) | 0 (0.0%) |
| $15,000 to $19,999 | 0 (0.0%) | 0 (0.0%) |
| $20,000 to $24,999 | 0 (0.0%) | 0 (0.0%) |
| $25,000 to $34,999 | 0 (0.0%) | 0 (0.0%) |
| $35,000 to $49,999 | 0 (0.0%) | 74 (55.6%) |
| $50,000 to $74,999 | 30 (5.0%) | 0 (0.0%) |
| $75,000 to $99,999 | 102 (17.1%) | 0 (0.0%) |
| $100,000 to $149,999 | 88 (14.8%) | 20 (15.0%) |
| $150,000 or more | 376 (63.1%) | 39 (29.3%) |
| Total | 596 (100.0%) | 133 (100.0%) |
Monthly Housing Cost Tiers in Ten Mile Run
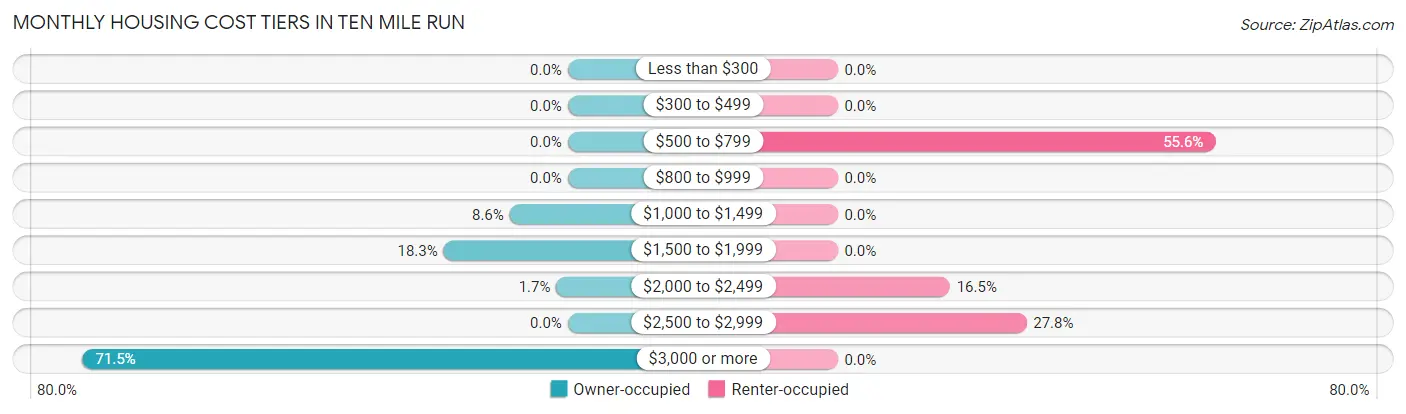
| Monthly Cost | Owner-occupied | Renter-occupied |
| Less than $300 | 0 (0.0%) | 0 (0.0%) |
| $300 to $499 | 0 (0.0%) | 0 (0.0%) |
| $500 to $799 | 0 (0.0%) | 74 (55.6%) |
| $800 to $999 | 0 (0.0%) | 0 (0.0%) |
| $1,000 to $1,499 | 51 (8.6%) | 0 (0.0%) |
| $1,500 to $1,999 | 109 (18.3%) | 0 (0.0%) |
| $2,000 to $2,499 | 10 (1.7%) | 22 (16.5%) |
| $2,500 to $2,999 | 0 (0.0%) | 37 (27.8%) |
| $3,000 or more | 426 (71.5%) | 0 (0.0%) |
| Total | 596 (100.0%) | 133 (100.0%) |
Physical Housing Characteristics in Ten Mile Run
Housing Structures in Ten Mile Run
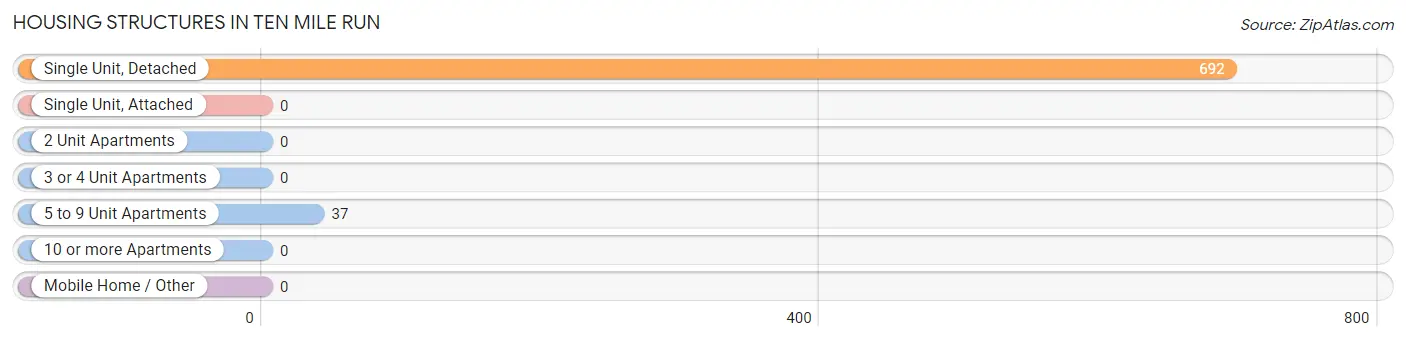
| Structure Type | # Housing Units | % Housing Units |
| Single Unit, Detached | 692 | 94.9% |
| Single Unit, Attached | 0 | 0.0% |
| 2 Unit Apartments | 0 | 0.0% |
| 3 or 4 Unit Apartments | 0 | 0.0% |
| 5 to 9 Unit Apartments | 37 | 5.1% |
| 10 or more Apartments | 0 | 0.0% |
| Mobile Home / Other | 0 | 0.0% |
| Total | 729 | 100.0% |
Housing Structures by Occupancy in Ten Mile Run
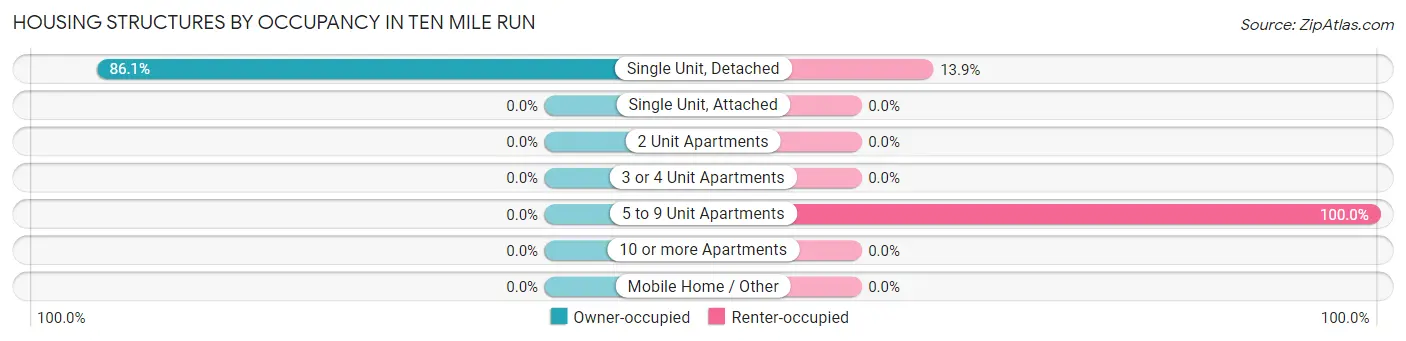
| Structure Type | Owner-occupied | Renter-occupied |
| Single Unit, Detached | 596 (86.1%) | 96 (13.9%) |
| Single Unit, Attached | 0 (0.0%) | 0 (0.0%) |
| 2 Unit Apartments | 0 (0.0%) | 0 (0.0%) |
| 3 or 4 Unit Apartments | 0 (0.0%) | 0 (0.0%) |
| 5 to 9 Unit Apartments | 0 (0.0%) | 37 (100.0%) |
| 10 or more Apartments | 0 (0.0%) | 0 (0.0%) |
| Mobile Home / Other | 0 (0.0%) | 0 (0.0%) |
| Total | 596 (81.8%) | 133 (18.2%) |
Housing Structures by Number of Rooms in Ten Mile Run
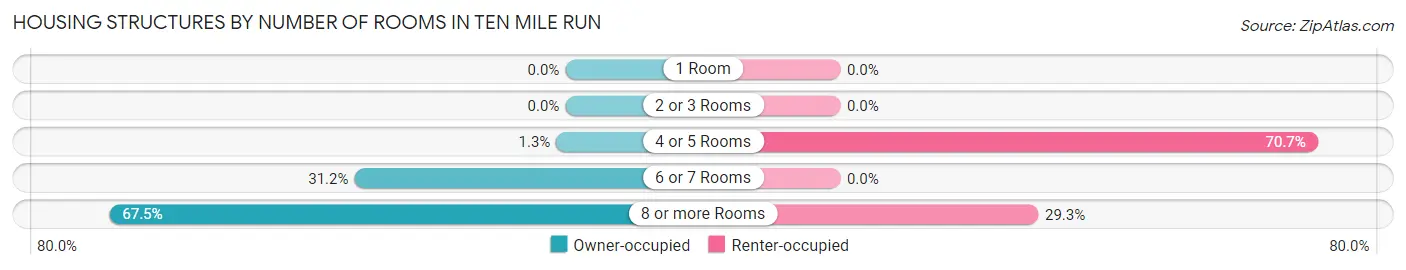
| Number of Rooms | Owner-occupied | Renter-occupied |
| 1 Room | 0 (0.0%) | 0 (0.0%) |
| 2 or 3 Rooms | 0 (0.0%) | 0 (0.0%) |
| 4 or 5 Rooms | 8 (1.3%) | 94 (70.7%) |
| 6 or 7 Rooms | 186 (31.2%) | 0 (0.0%) |
| 8 or more Rooms | 402 (67.4%) | 39 (29.3%) |
| Total | 596 (100.0%) | 133 (100.0%) |
Housing Structure by Heating Type in Ten Mile Run
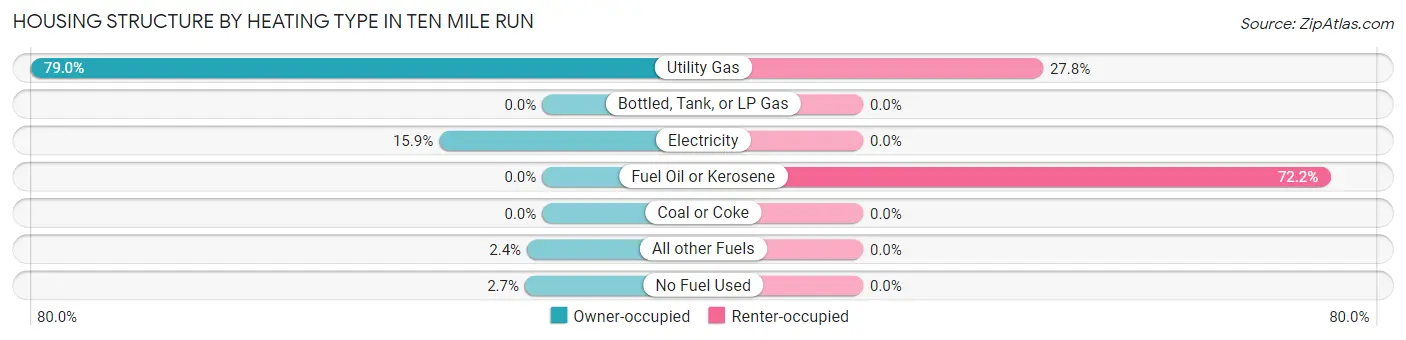
| Heating Type | Owner-occupied | Renter-occupied |
| Utility Gas | 471 (79.0%) | 37 (27.8%) |
| Bottled, Tank, or LP Gas | 0 (0.0%) | 0 (0.0%) |
| Electricity | 95 (15.9%) | 0 (0.0%) |
| Fuel Oil or Kerosene | 0 (0.0%) | 96 (72.2%) |
| Coal or Coke | 0 (0.0%) | 0 (0.0%) |
| All other Fuels | 14 (2.4%) | 0 (0.0%) |
| No Fuel Used | 16 (2.7%) | 0 (0.0%) |
| Total | 596 (100.0%) | 133 (100.0%) |
Household Vehicle Usage in Ten Mile Run
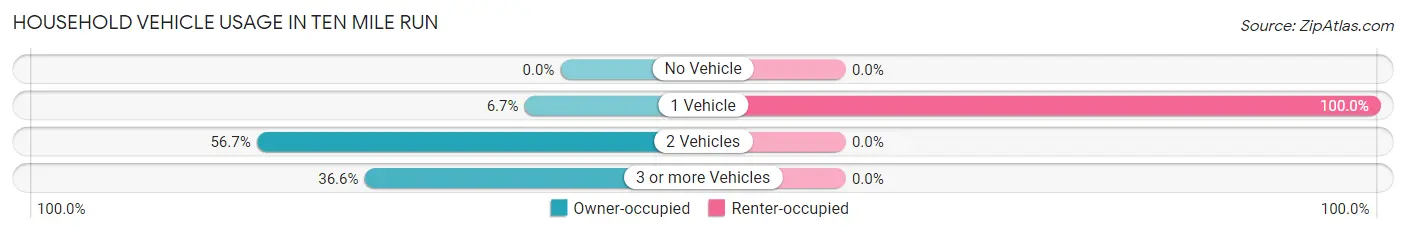
| Vehicles per Household | Owner-occupied | Renter-occupied |
| No Vehicle | 0 (0.0%) | 0 (0.0%) |
| 1 Vehicle | 40 (6.7%) | 133 (100.0%) |
| 2 Vehicles | 338 (56.7%) | 0 (0.0%) |
| 3 or more Vehicles | 218 (36.6%) | 0 (0.0%) |
| Total | 596 (100.0%) | 133 (100.0%) |
Real Estate & Mortgages in Ten Mile Run
Real Estate and Mortgage Overview in Ten Mile Run
| Characteristic | Without Mortgage | With Mortgage |
| Housing Units | 170 | 426 |
| Median Property Value | $646,600 | $659,000 |
| Median Household Income | $153,150 | $278 |
| Monthly Housing Costs | $1,501 | $426 |
| Real Estate Taxes | $10,001 | $0 |
Property Value by Mortgage Status in Ten Mile Run
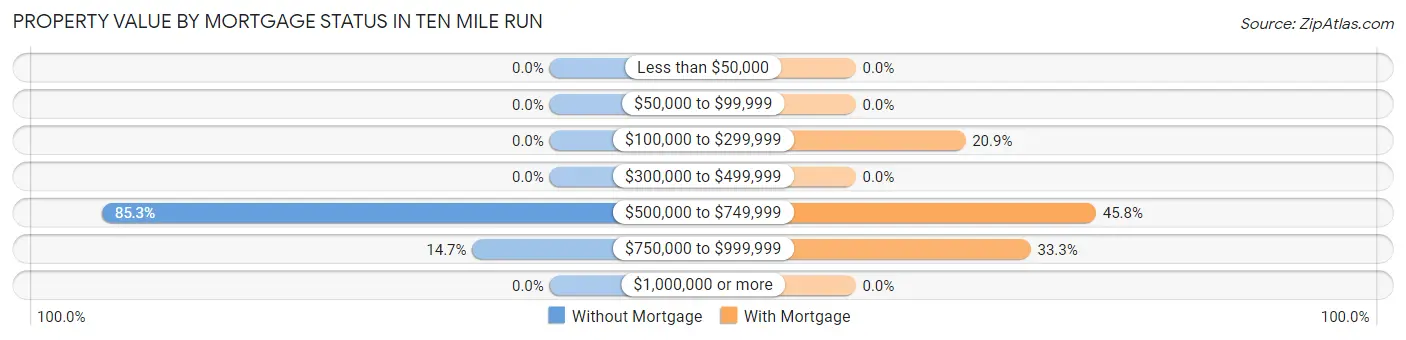
| Property Value | Without Mortgage | With Mortgage |
| Less than $50,000 | 0 (0.0%) | 0 (0.0%) |
| $50,000 to $99,999 | 0 (0.0%) | 0 (0.0%) |
| $100,000 to $299,999 | 0 (0.0%) | 89 (20.9%) |
| $300,000 to $499,999 | 0 (0.0%) | 0 (0.0%) |
| $500,000 to $749,999 | 145 (85.3%) | 195 (45.8%) |
| $750,000 to $999,999 | 25 (14.7%) | 142 (33.3%) |
| $1,000,000 or more | 0 (0.0%) | 0 (0.0%) |
| Total | 170 (100.0%) | 426 (100.0%) |
Household Income by Mortgage Status in Ten Mile Run
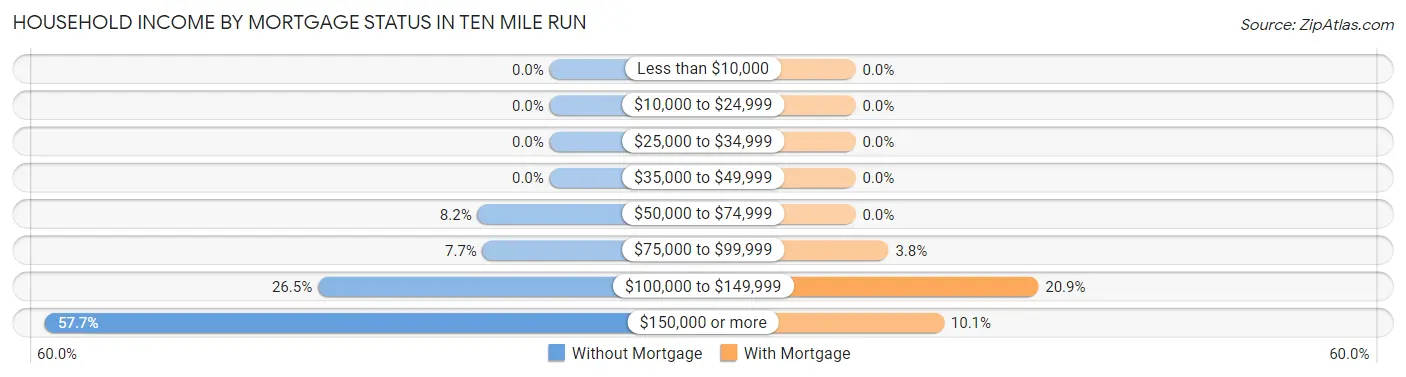
| Household Income | Without Mortgage | With Mortgage |
| Less than $10,000 | 0 (0.0%) | 0 (0.0%) |
| $10,000 to $24,999 | 0 (0.0%) | 0 (0.0%) |
| $25,000 to $34,999 | 0 (0.0%) | 0 (0.0%) |
| $35,000 to $49,999 | 0 (0.0%) | 0 (0.0%) |
| $50,000 to $74,999 | 14 (8.2%) | 0 (0.0%) |
| $75,000 to $99,999 | 13 (7.6%) | 16 (3.8%) |
| $100,000 to $149,999 | 45 (26.5%) | 89 (20.9%) |
| $150,000 or more | 98 (57.7%) | 43 (10.1%) |
| Total | 170 (100.0%) | 426 (100.0%) |
Property Value to Household Income Ratio in Ten Mile Run
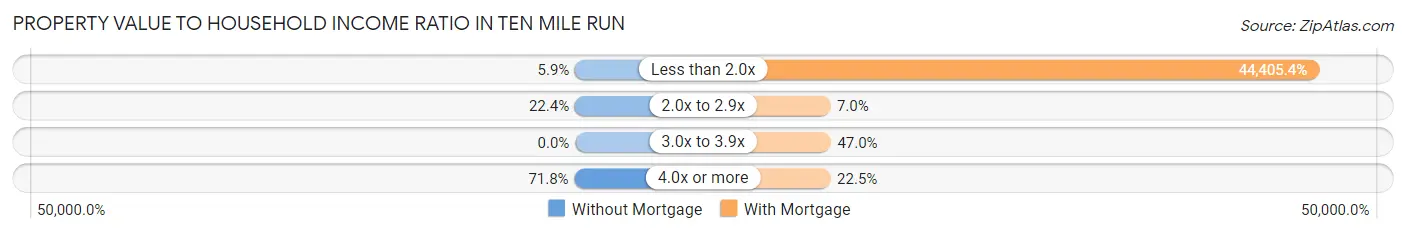
| Value-to-Income Ratio | Without Mortgage | With Mortgage |
| Less than 2.0x | 10 (5.9%) | 189,167 (44,405.4%) |
| 2.0x to 2.9x | 38 (22.4%) | 30 (7.0%) |
| 3.0x to 3.9x | 0 (0.0%) | 200 (46.9%) |
| 4.0x or more | 122 (71.8%) | 96 (22.5%) |
| Total | 170 (100.0%) | 426 (100.0%) |
Real Estate Taxes by Mortgage Status in Ten Mile Run
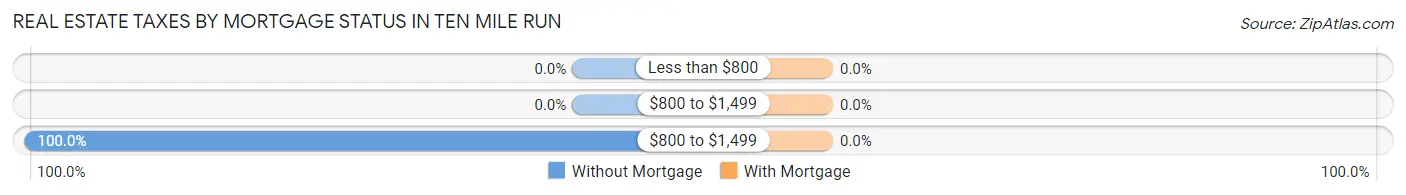
| Property Taxes | Without Mortgage | With Mortgage |
| Less than $800 | 0 (0.0%) | 0 (0.0%) |
| $800 to $1,499 | 0 (0.0%) | 0 (0.0%) |
| $800 to $1,499 | 170 (100.0%) | 0 (0.0%) |
| Total | 170 (100.0%) | 426 (100.0%) |
Health & Disability in Ten Mile Run
Health Insurance Coverage by Age in Ten Mile Run
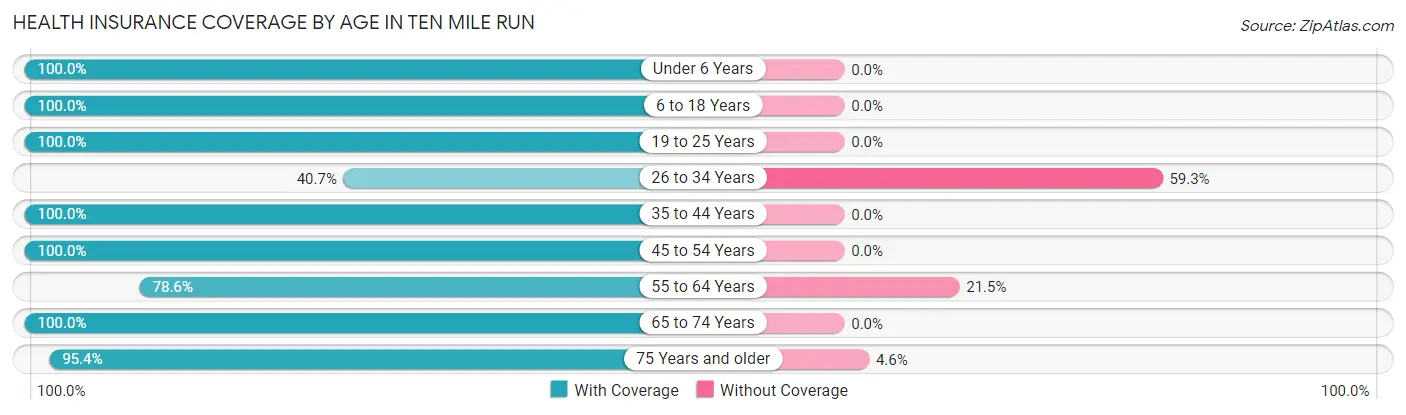
| Age Bracket | With Coverage | Without Coverage |
| Under 6 Years | 116 (100.0%) | 0 (0.0%) |
| 6 to 18 Years | 390 (100.0%) | 0 (0.0%) |
| 19 to 25 Years | 190 (100.0%) | 0 (0.0%) |
| 26 to 34 Years | 61 (40.7%) | 89 (59.3%) |
| 35 to 44 Years | 257 (100.0%) | 0 (0.0%) |
| 45 to 54 Years | 443 (100.0%) | 0 (0.0%) |
| 55 to 64 Years | 271 (78.5%) | 74 (21.4%) |
| 65 to 74 Years | 263 (100.0%) | 0 (0.0%) |
| 75 Years and older | 83 (95.4%) | 4 (4.6%) |
| Total | 2,074 (92.5%) | 167 (7.4%) |
Health Insurance Coverage by Citizenship Status in Ten Mile Run
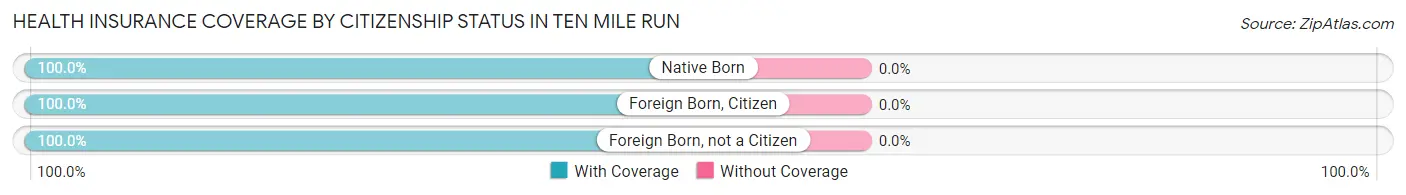
| Citizenship Status | With Coverage | Without Coverage |
| Native Born | 116 (100.0%) | 0 (0.0%) |
| Foreign Born, Citizen | 390 (100.0%) | 0 (0.0%) |
| Foreign Born, not a Citizen | 190 (100.0%) | 0 (0.0%) |
Health Insurance Coverage by Household Income in Ten Mile Run
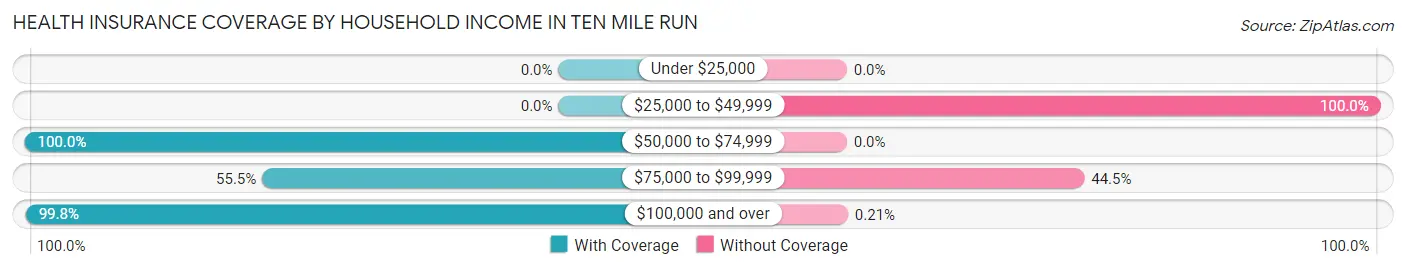
| Household Income | With Coverage | Without Coverage |
| Under $25,000 | 0 (0.0%) | 0 (0.0%) |
| $25,000 to $49,999 | 0 (0.0%) | 74 (100.0%) |
| $50,000 to $74,999 | 67 (100.0%) | 0 (0.0%) |
| $75,000 to $99,999 | 111 (55.5%) | 89 (44.5%) |
| $100,000 and over | 1,896 (99.8%) | 4 (0.2%) |
Public vs Private Health Insurance Coverage by Age in Ten Mile Run
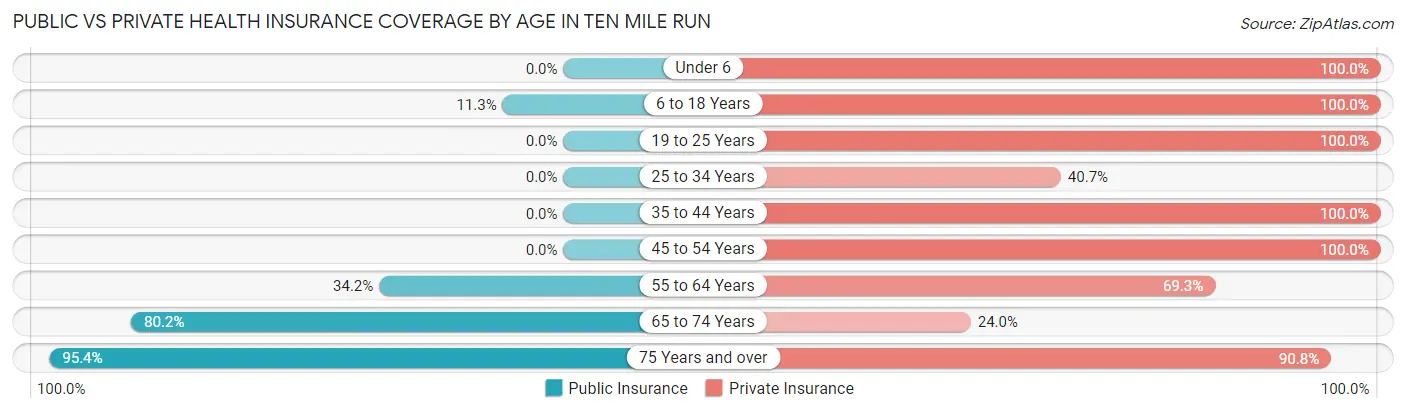
| Age Bracket | Public Insurance | Private Insurance |
| Under 6 | 0 (0.0%) | 116 (100.0%) |
| 6 to 18 Years | 44 (11.3%) | 390 (100.0%) |
| 19 to 25 Years | 0 (0.0%) | 190 (100.0%) |
| 25 to 34 Years | 0 (0.0%) | 61 (40.7%) |
| 35 to 44 Years | 0 (0.0%) | 257 (100.0%) |
| 45 to 54 Years | 0 (0.0%) | 443 (100.0%) |
| 55 to 64 Years | 118 (34.2%) | 239 (69.3%) |
| 65 to 74 Years | 211 (80.2%) | 63 (23.9%) |
| 75 Years and over | 83 (95.4%) | 79 (90.8%) |
| Total | 456 (20.3%) | 1,838 (82.0%) |
Disability Status by Sex by Age in Ten Mile Run
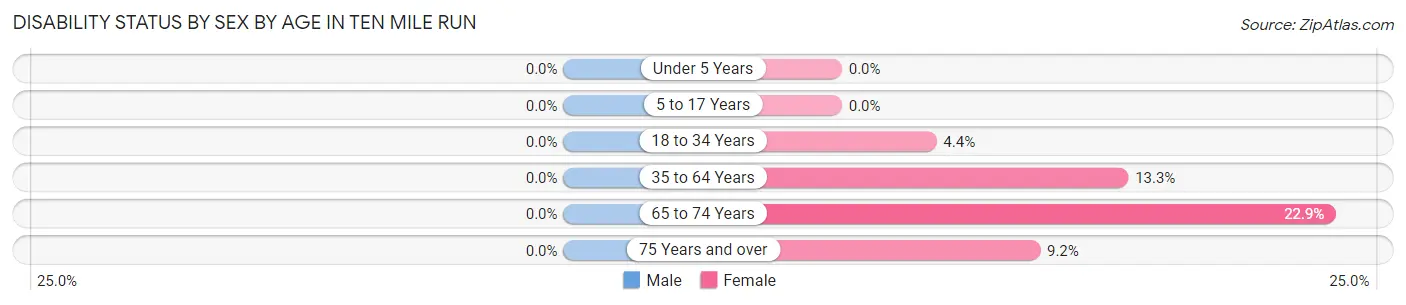
| Age Bracket | Male | Female |
| Under 5 Years | 0 (0.0%) | 0 (0.0%) |
| 5 to 17 Years | 0 (0.0%) | 0 (0.0%) |
| 18 to 34 Years | 0 (0.0%) | 10 (4.4%) |
| 35 to 64 Years | 0 (0.0%) | 57 (13.3%) |
| 65 to 74 Years | 0 (0.0%) | 25 (22.9%) |
| 75 Years and over | 0 (0.0%) | 8 (9.2%) |
Disability Class by Sex by Age in Ten Mile Run
Disability Class: Hearing Difficulty
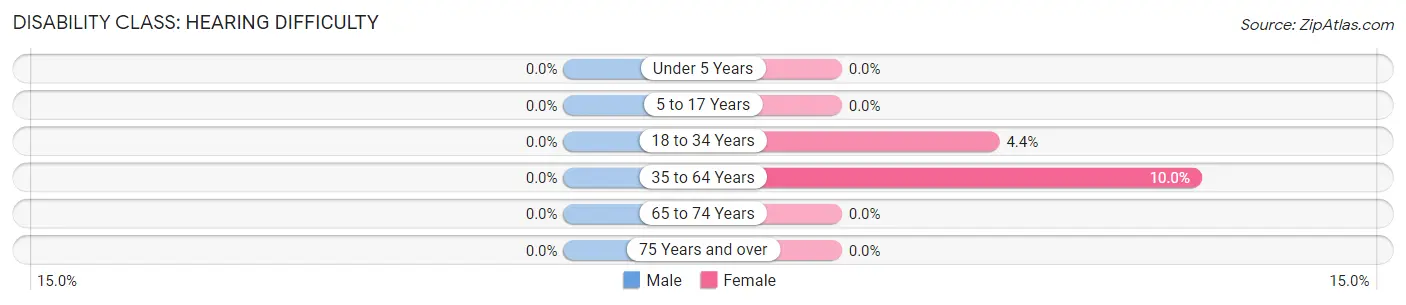
| Age Bracket | Male | Female |
| Under 5 Years | 0 (0.0%) | 0 (0.0%) |
| 5 to 17 Years | 0 (0.0%) | 0 (0.0%) |
| 18 to 34 Years | 0 (0.0%) | 10 (4.4%) |
| 35 to 64 Years | 0 (0.0%) | 43 (10.0%) |
| 65 to 74 Years | 0 (0.0%) | 0 (0.0%) |
| 75 Years and over | 0 (0.0%) | 0 (0.0%) |
Disability Class: Vision Difficulty
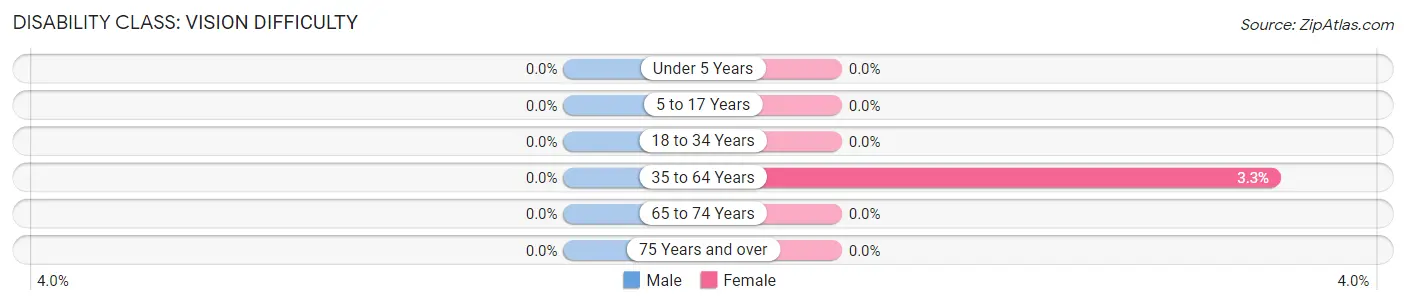
| Age Bracket | Male | Female |
| Under 5 Years | 0 (0.0%) | 0 (0.0%) |
| 5 to 17 Years | 0 (0.0%) | 0 (0.0%) |
| 18 to 34 Years | 0 (0.0%) | 0 (0.0%) |
| 35 to 64 Years | 0 (0.0%) | 14 (3.3%) |
| 65 to 74 Years | 0 (0.0%) | 0 (0.0%) |
| 75 Years and over | 0 (0.0%) | 0 (0.0%) |
Disability Class: Cognitive Difficulty
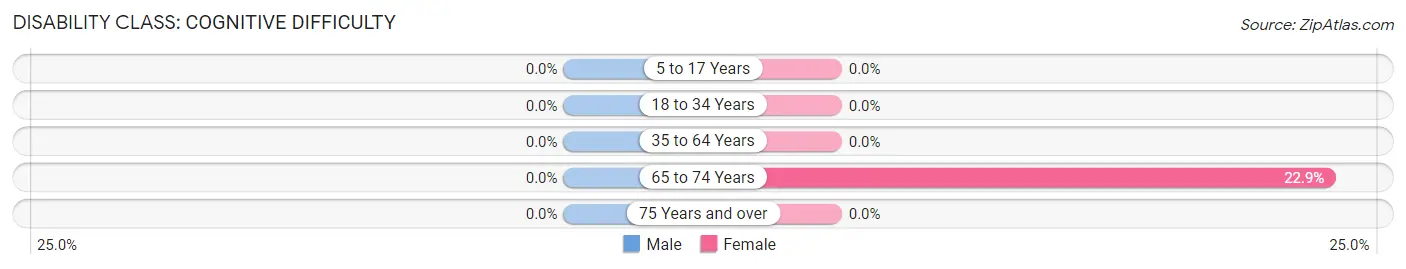
| Age Bracket | Male | Female |
| 5 to 17 Years | 0 (0.0%) | 0 (0.0%) |
| 18 to 34 Years | 0 (0.0%) | 0 (0.0%) |
| 35 to 64 Years | 0 (0.0%) | 0 (0.0%) |
| 65 to 74 Years | 0 (0.0%) | 25 (22.9%) |
| 75 Years and over | 0 (0.0%) | 0 (0.0%) |
Disability Class: Ambulatory Difficulty
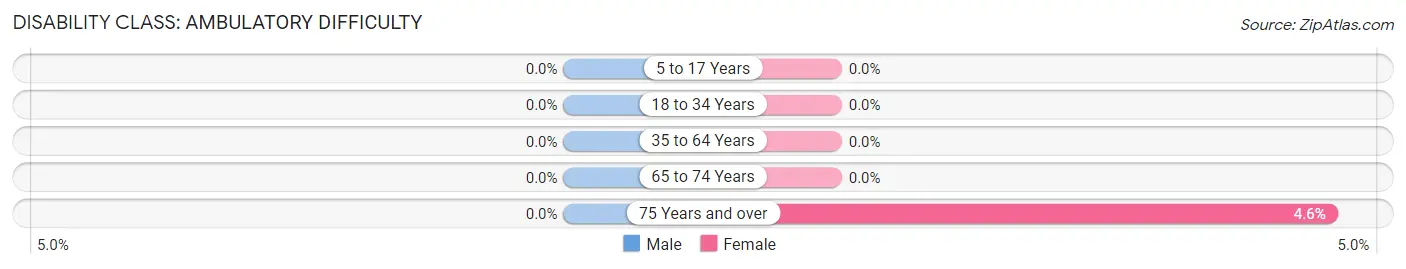
| Age Bracket | Male | Female |
| 5 to 17 Years | 0 (0.0%) | 0 (0.0%) |
| 18 to 34 Years | 0 (0.0%) | 0 (0.0%) |
| 35 to 64 Years | 0 (0.0%) | 0 (0.0%) |
| 65 to 74 Years | 0 (0.0%) | 0 (0.0%) |
| 75 Years and over | 0 (0.0%) | 4 (4.6%) |
Disability Class: Self-Care Difficulty
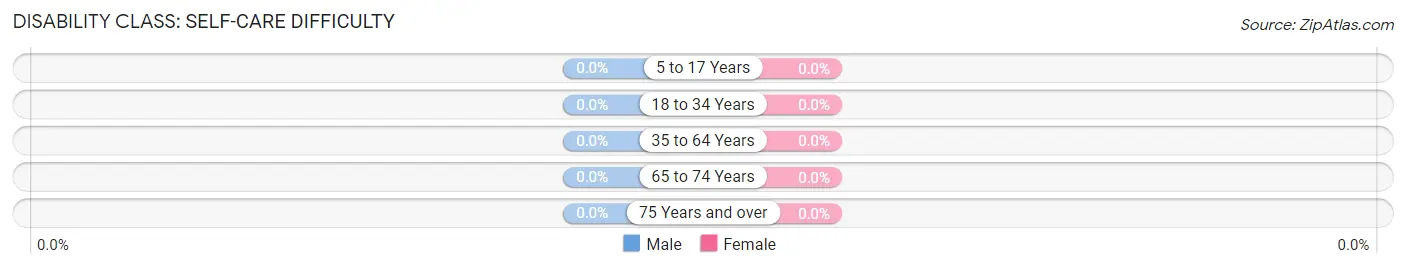
| Age Bracket | Male | Female |
| 5 to 17 Years | 0 (0.0%) | 0 (0.0%) |
| 18 to 34 Years | 0 (0.0%) | 0 (0.0%) |
| 35 to 64 Years | 0 (0.0%) | 0 (0.0%) |
| 65 to 74 Years | 0 (0.0%) | 0 (0.0%) |
| 75 Years and over | 0 (0.0%) | 0 (0.0%) |
Technology Access in Ten Mile Run
Computing Device Access in Ten Mile Run
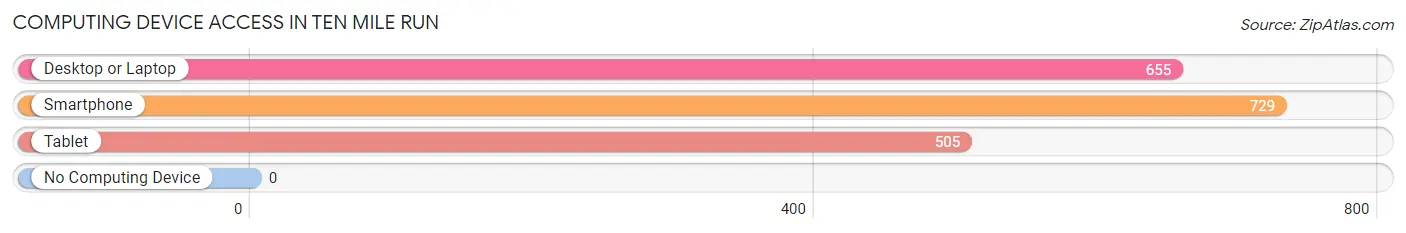
| Device Type | # Households | % Households |
| Desktop or Laptop | 655 | 89.8% |
| Smartphone | 729 | 100.0% |
| Tablet | 505 | 69.3% |
| No Computing Device | 0 | 0.0% |
| Total | 729 | 100.0% |
Internet Access in Ten Mile Run
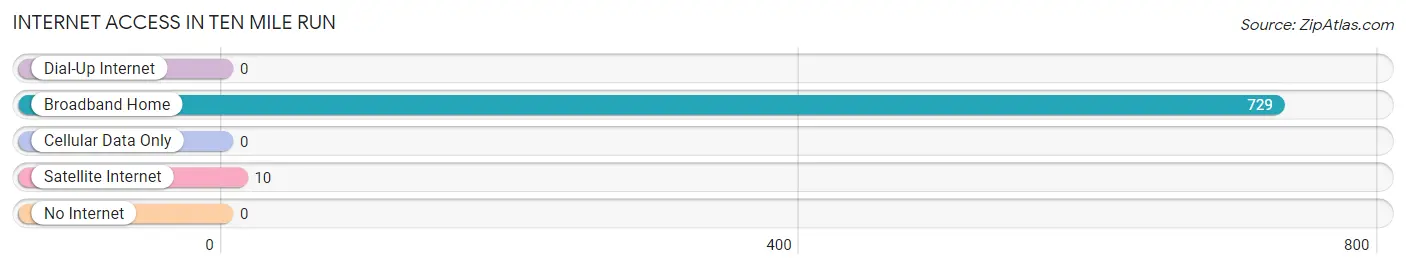
| Internet Type | # Households | % Households |
| Dial-Up Internet | 0 | 0.0% |
| Broadband Home | 729 | 100.0% |
| Cellular Data Only | 0 | 0.0% |
| Satellite Internet | 10 | 1.4% |
| No Internet | 0 | 0.0% |
| Total | 729 | 100.0% |
Ten Mile Run Summary
Ten Mile Run is a small unincorporated community located in Franklin Township, Somerset County, New Jersey. It is situated in the Raritan Valley region of Central New Jersey, approximately 25 miles southwest of New York City. The community is bordered by the towns of Hillsborough, Manville, and South Bound Brook.
History
Ten Mile Run was first settled in the late 1700s by Dutch and German immigrants. The area was originally known as “Ten Mile Run” due to its location at the intersection of two roads that were ten miles apart. The area was primarily used for farming and was home to several small mills. In the late 1800s, the area began to develop into a residential community.
Geography
Ten Mile Run is located in the Raritan Valley region of Central New Jersey. It is situated in Franklin Township, Somerset County, approximately 25 miles southwest of New York City. The community is bordered by the towns of Hillsborough, Manville, and South Bound Brook. The area is mostly flat and is characterized by rolling hills and open fields. The climate is humid and temperate, with hot summers and cold winters.
Economy
Ten Mile Run is primarily a residential community, with most of its residents commuting to nearby cities for work. The area is home to several small businesses, including a few restaurants, convenience stores, and auto repair shops. The community is also home to a few industrial parks, which provide employment opportunities for local residents.
Demographics
As of the 2010 census, the population of Ten Mile Run was 2,845. The racial makeup of the community was 79.3% White, 11.2% African American, 0.3% Native American, 4.2% Asian, and 4.9% from other races. The median household income was $76,944, and the median age was 41.7 years.
Ten Mile Run is a small, close-knit community with a rich history and a diverse population. The area is home to a variety of businesses and provides employment opportunities for local residents. The community is also conveniently located near major cities, making it an ideal place to live and work.
Common Questions
What is Per Capita Income in Ten Mile Run?
Per Capita income in Ten Mile Run is $60,805.
What is the Median Family Income in Ten Mile Run?
Median Family Income in Ten Mile Run is $183,596.
What is the Median Household income in Ten Mile Run?
Median Household Income in Ten Mile Run is $162,557.
What is Inequality or Gini Index in Ten Mile Run?
Inequality or Gini Index in Ten Mile Run is 0.34.
What is the Total Population of Ten Mile Run?
Total Population of Ten Mile Run is 2,241.
What is the Total Male Population of Ten Mile Run?
Total Male Population of Ten Mile Run is 1,225.
What is the Total Female Population of Ten Mile Run?
Total Female Population of Ten Mile Run is 1,016.
What is the Ratio of Males per 100 Females in Ten Mile Run?
There are 120.57 Males per 100 Females in Ten Mile Run.
What is the Ratio of Females per 100 Males in Ten Mile Run?
There are 82.94 Females per 100 Males in Ten Mile Run.
What is the Median Population Age in Ten Mile Run?
Median Population Age in Ten Mile Run is 45.9 Years.
What is the Average Family Size in Ten Mile Run
Average Family Size in Ten Mile Run is 3.5 People.
What is the Average Household Size in Ten Mile Run
Average Household Size in Ten Mile Run is 3.1 People.
How Large is the Labor Force in Ten Mile Run?
There are 1,320 People in the Labor Forcein in Ten Mile Run.
What is the Percentage of People in the Labor Force in Ten Mile Run?
72.5% of People are in the Labor Force in Ten Mile Run.
What is the Unemployment Rate in Ten Mile Run?
Unemployment Rate in Ten Mile Run is 3.6%.