Barrington borough, NJ Map & Demographics
Barrington borough Overview
$49,735
PER CAPITA INCOME
$118,105
AVG FAMILY INCOME
$82,070
AVG HOUSEHOLD INCOME
0.9%
WAGE / INCOME GAP [ % ]
99.1¢/ $1
WAGE / INCOME GAP [ $ ]
0.44
INEQUALITY / GINI INDEX
7,022
TOTAL POPULATION
3,694
MALE POPULATION
3,328
FEMALE POPULATION
111.00
MALES / 100 FEMALES
90.09
FEMALES / 100 MALES
45.5
MEDIAN AGE
2.8
AVG FAMILY SIZE
2.1
AVG HOUSEHOLD SIZE
4,408
LABOR FORCE [ PEOPLE ]
72.5%
PERCENT IN LABOR FORCE
6.8%
UNEMPLOYMENT RATE
Income in Barrington borough
Income Overview in Barrington borough
Per Capita Income in Barrington borough is $49,735, while median incomes of families and households are $118,105 and $82,070 respectively.
| Characteristic | Number | Measure |
| Per Capita Income | 7,022 | $49,735 |
| Median Family Income | 1,855 | $118,105 |
| Mean Family Income | 1,855 | $131,735 |
| Median Household Income | 3,377 | $82,070 |
| Mean Household Income | 3,377 | $102,096 |
| Income Deficit | 1,855 | $0 |
| Wage / Income Gap (%) | 7,022 | 0.89% |
| Wage / Income Gap ($) | 7,022 | 99.11¢ per $1 |
| Gini / Inequality Index | 7,022 | 0.44 |
Earnings by Sex in Barrington borough
Average Earnings in Barrington borough are $52,633, $52,305 for men and $52,773 for women, a difference of 0.9%.
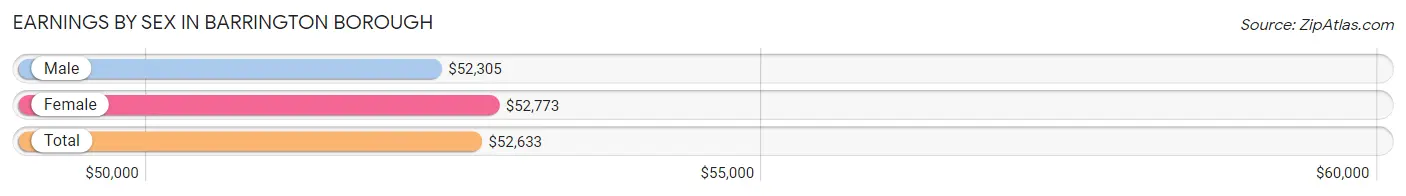
| Sex | Number | Average Earnings |
| Male | 2,299 (51.8%) | $52,305 |
| Female | 2,140 (48.2%) | $52,773 |
| Total | 4,439 (100.0%) | $52,633 |
Earnings by Sex by Income Bracket in Barrington borough
The most common earnings brackets in Barrington borough are $100,000+ for men (472 | 20.5%) and $55,000 to $64,999 for women (352 | 16.5%).
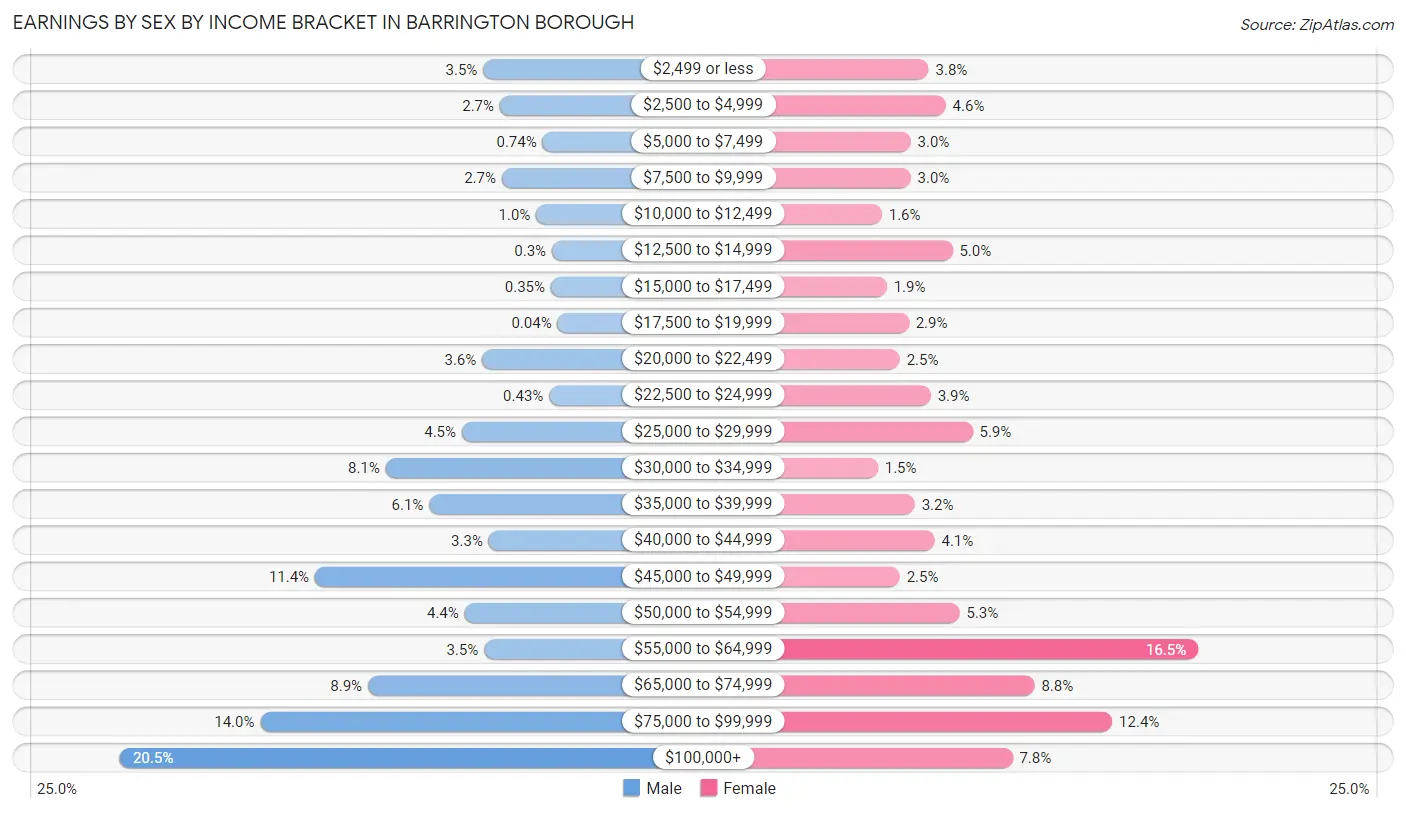
| Income | Male | Female |
| $2,499 or less | 81 (3.5%) | 82 (3.8%) |
| $2,500 to $4,999 | 63 (2.7%) | 99 (4.6%) |
| $5,000 to $7,499 | 17 (0.7%) | 64 (3.0%) |
| $7,500 to $9,999 | 61 (2.6%) | 64 (3.0%) |
| $10,000 to $12,499 | 24 (1.0%) | 35 (1.6%) |
| $12,500 to $14,999 | 7 (0.3%) | 106 (5.0%) |
| $15,000 to $17,499 | 8 (0.4%) | 40 (1.9%) |
| $17,500 to $19,999 | 1 (0.0%) | 62 (2.9%) |
| $20,000 to $22,499 | 82 (3.6%) | 53 (2.5%) |
| $22,500 to $24,999 | 10 (0.4%) | 84 (3.9%) |
| $25,000 to $29,999 | 104 (4.5%) | 126 (5.9%) |
| $30,000 to $34,999 | 186 (8.1%) | 31 (1.5%) |
| $35,000 to $39,999 | 139 (6.0%) | 68 (3.2%) |
| $40,000 to $44,999 | 75 (3.3%) | 88 (4.1%) |
| $45,000 to $49,999 | 262 (11.4%) | 53 (2.5%) |
| $50,000 to $54,999 | 101 (4.4%) | 113 (5.3%) |
| $55,000 to $64,999 | 80 (3.5%) | 352 (16.5%) |
| $65,000 to $74,999 | 205 (8.9%) | 188 (8.8%) |
| $75,000 to $99,999 | 321 (14.0%) | 266 (12.4%) |
| $100,000+ | 472 (20.5%) | 166 (7.8%) |
| Total | 2,299 (100.0%) | 2,140 (100.0%) |
Earnings by Sex by Educational Attainment in Barrington borough
Average earnings in Barrington borough are $56,375 for men and $55,015 for women, a difference of 2.4%. Men with an educational attainment of graduate degree enjoy the highest average annual earnings of $96,680, while those with high school diploma education earn the least with $45,036. Women with an educational attainment of graduate degree earn the most with the average annual earnings of $73,164, while those with college or associate's degree education have the smallest earnings of $27,426.
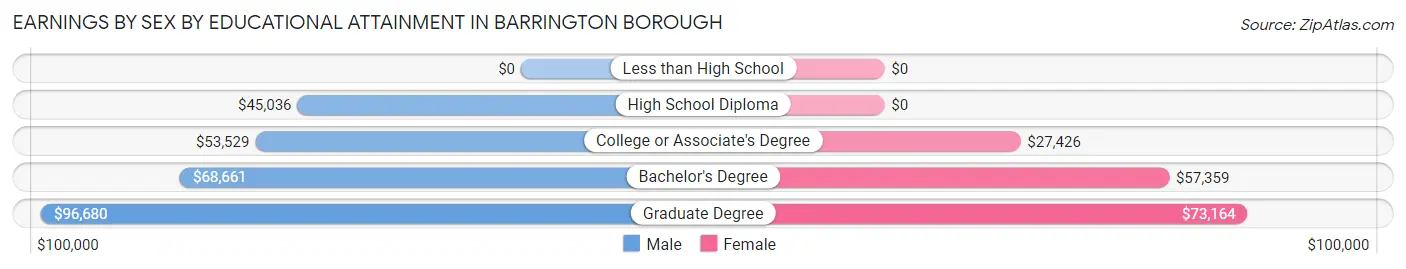
| Educational Attainment | Male Income | Female Income |
| Less than High School | - | - |
| High School Diploma | $45,036 | $0 |
| College or Associate's Degree | $53,529 | $27,426 |
| Bachelor's Degree | $68,661 | $57,359 |
| Graduate Degree | $96,680 | $73,164 |
| Total | $56,375 | $55,015 |
Family Income in Barrington borough
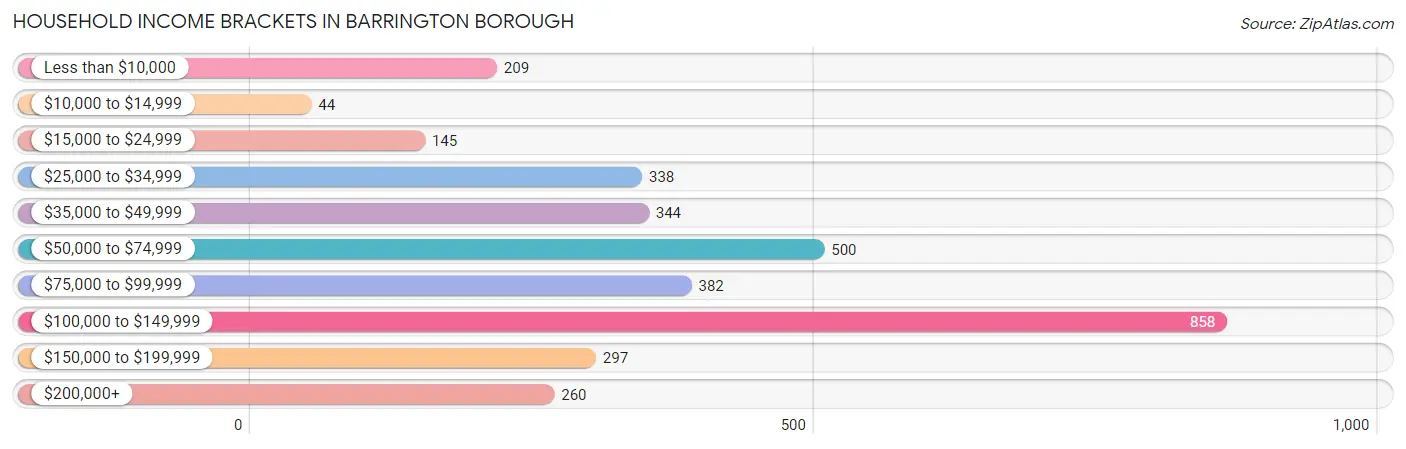
Family Income Brackets in Barrington borough
According to the Barrington borough family income data, there are 749 families falling into the $100,000 to $149,999 income range, which is the most common income bracket and makes up 40.4% of all families.
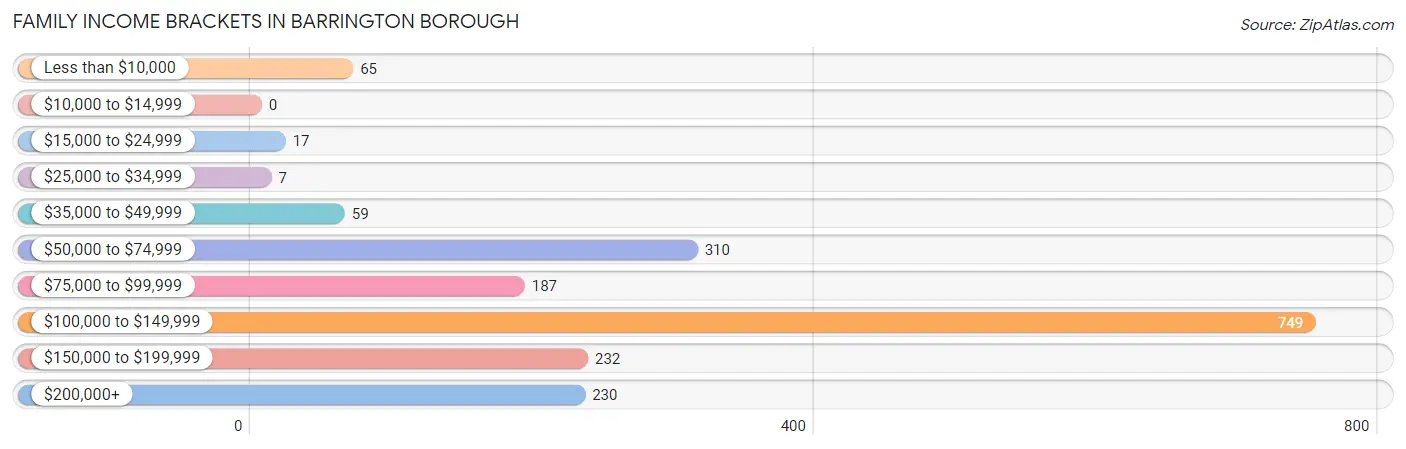
| Income Bracket | # Families | % Families |
| Less than $10,000 | 65 | 3.5% |
| $10,000 to $14,999 | 0 | 0.0% |
| $15,000 to $24,999 | 17 | 0.9% |
| $25,000 to $34,999 | 7 | 0.4% |
| $35,000 to $49,999 | 59 | 3.2% |
| $50,000 to $74,999 | 310 | 16.7% |
| $75,000 to $99,999 | 187 | 10.1% |
| $100,000 to $149,999 | 749 | 40.4% |
| $150,000 to $199,999 | 232 | 12.5% |
| $200,000+ | 230 | 12.4% |
Family Income by Famaliy Size in Barrington borough
5-person families (175 | 9.4%) account for the highest median family income in Barrington borough with $142,625 per family, while 2-person families (1,062 | 57.3%) have the highest median income of $55,107 per family member.
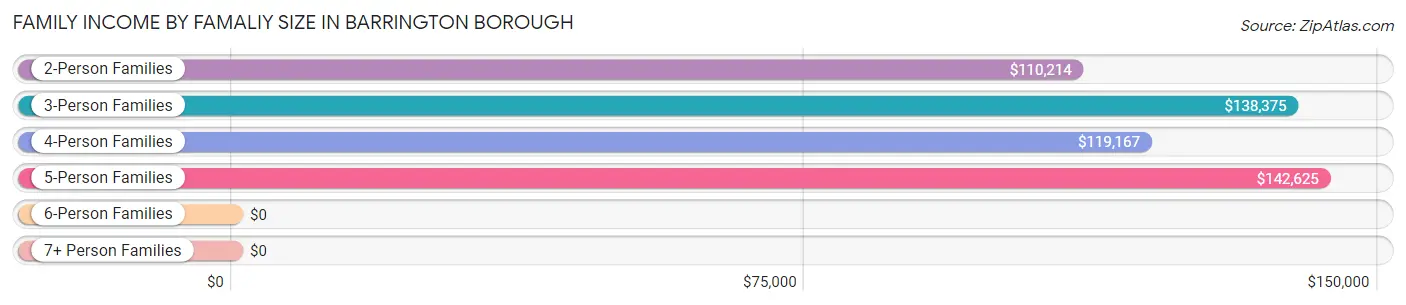
| Income Bracket | # Families | Median Income |
| 2-Person Families | 1,062 (57.3%) | $110,214 |
| 3-Person Families | 363 (19.6%) | $138,375 |
| 4-Person Families | 226 (12.2%) | $119,167 |
| 5-Person Families | 175 (9.4%) | $142,625 |
| 6-Person Families | 29 (1.6%) | $0 |
| 7+ Person Families | 0 (0.0%) | $0 |
| Total | 1,855 (100.0%) | $118,105 |
Family Income by Number of Earners in Barrington borough
The median family income in Barrington borough is $118,105, with families comprising 3+ earners (234) having the highest median family income of $172,407, while families with no earners (172) have the lowest median family income of $69,653, accounting for 12.6% and 9.3% of families, respectively.
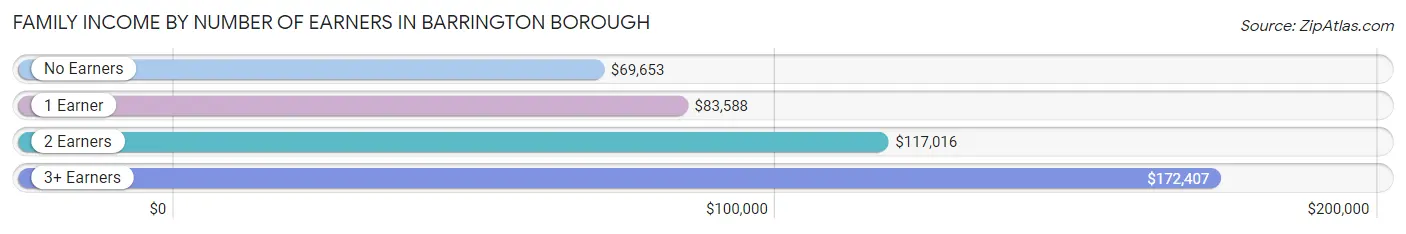
| Number of Earners | # Families | Median Income |
| No Earners | 172 (9.3%) | $69,653 |
| 1 Earner | 409 (22.1%) | $83,588 |
| 2 Earners | 1,040 (56.1%) | $117,016 |
| 3+ Earners | 234 (12.6%) | $172,407 |
| Total | 1,855 (100.0%) | $118,105 |
Household Income in Barrington borough
Household Income Brackets in Barrington borough
With 858 households falling in the category, the $100,000 to $149,999 income range is the most frequent in Barrington borough, accounting for 25.4% of all households. In contrast, only 44 households (1.3%) fall into the $10,000 to $14,999 income bracket, making it the least populous group.
| Income Bracket | # Households | % Households |
| Less than $10,000 | 209 | 6.2% |
| $10,000 to $14,999 | 44 | 1.3% |
| $15,000 to $24,999 | 145 | 4.3% |
| $25,000 to $34,999 | 338 | 10.0% |
| $35,000 to $49,999 | 344 | 10.2% |
| $50,000 to $74,999 | 500 | 14.8% |
| $75,000 to $99,999 | 382 | 11.3% |
| $100,000 to $149,999 | 858 | 25.4% |
| $150,000 to $199,999 | 297 | 8.8% |
| $200,000+ | 260 | 7.7% |
Household Income by Householder Age in Barrington borough
The median household income in Barrington borough is $82,070, with the highest median household income of $111,043 found in the 45 to 64 years age bracket for the primary householder. A total of 1,446 households (42.8%) fall into this category. Meanwhile, the 65+ years age bracket for the primary householder has the lowest median household income of $47,102, with 937 households (27.8%) in this group.
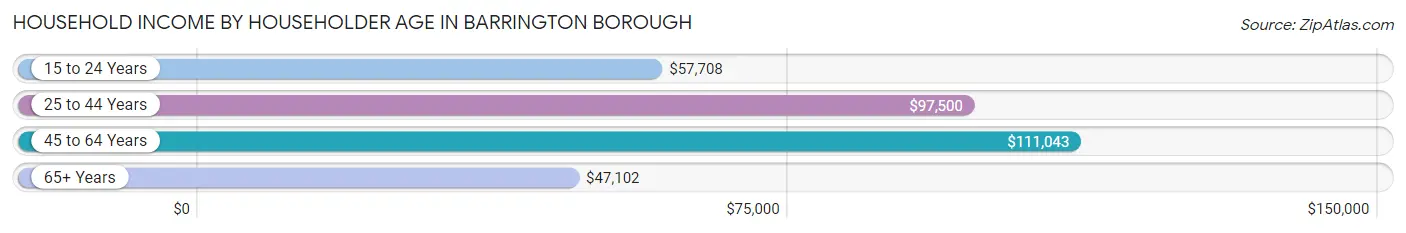
| Income Bracket | # Households | Median Income |
| 15 to 24 Years | 74 (2.2%) | $57,708 |
| 25 to 44 Years | 920 (27.2%) | $97,500 |
| 45 to 64 Years | 1,446 (42.8%) | $111,043 |
| 65+ Years | 937 (27.8%) | $47,102 |
| Total | 3,377 (100.0%) | $82,070 |
Poverty in Barrington borough
Income Below Poverty by Sex and Age in Barrington borough
With 5.0% poverty level for males and 7.4% for females among the residents of Barrington borough, 12 to 14 year old males and 12 to 14 year old females are the most vulnerable to poverty, with 26 males (26.8%) and 36 females (50.7%) in their respective age groups living below the poverty level.
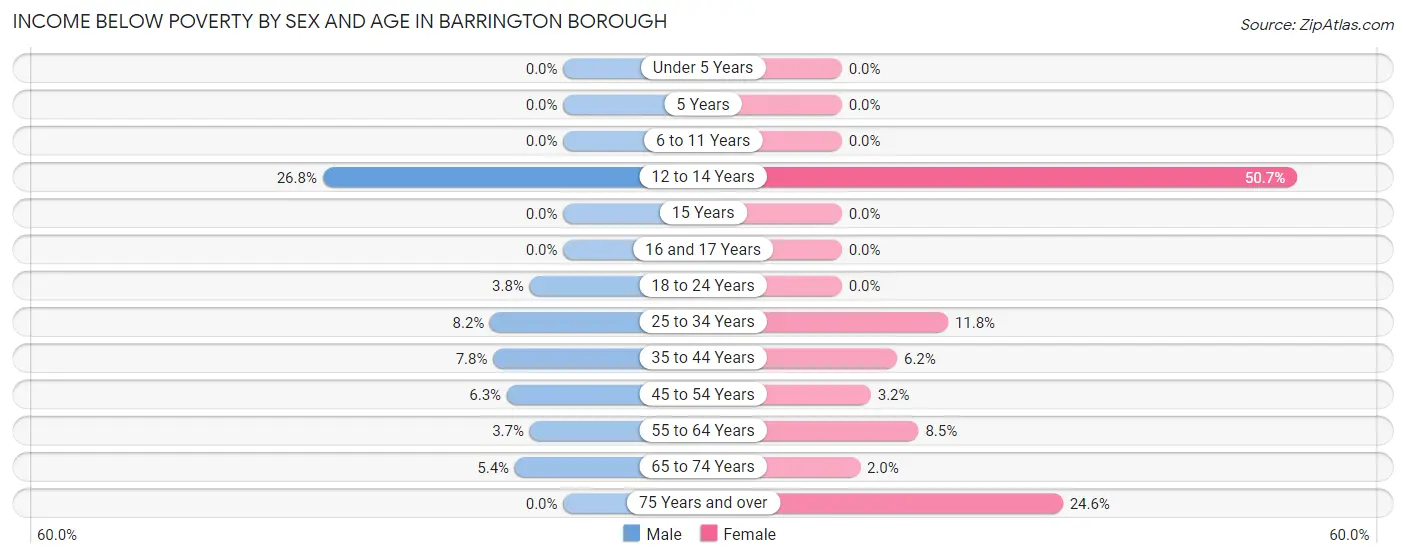
| Age Bracket | Male | Female |
| Under 5 Years | 0 (0.0%) | 0 (0.0%) |
| 5 Years | 0 (0.0%) | 0 (0.0%) |
| 6 to 11 Years | 0 (0.0%) | 0 (0.0%) |
| 12 to 14 Years | 26 (26.8%) | 36 (50.7%) |
| 15 Years | 0 (0.0%) | 0 (0.0%) |
| 16 and 17 Years | 0 (0.0%) | 0 (0.0%) |
| 18 to 24 Years | 9 (3.7%) | 0 (0.0%) |
| 25 to 34 Years | 53 (8.2%) | 70 (11.8%) |
| 35 to 44 Years | 27 (7.8%) | 22 (6.1%) |
| 45 to 54 Years | 27 (6.3%) | 18 (3.2%) |
| 55 to 64 Years | 28 (3.7%) | 45 (8.5%) |
| 65 to 74 Years | 16 (5.4%) | 8 (2.0%) |
| 75 Years and over | 0 (0.0%) | 46 (24.6%) |
| Total | 186 (5.0%) | 245 (7.4%) |
Income Above Poverty by Sex and Age in Barrington borough
According to the poverty statistics in Barrington borough, males aged under 5 years and females aged under 5 years are the age groups that are most secure financially, with 100.0% of males and 100.0% of females in these age groups living above the poverty line.
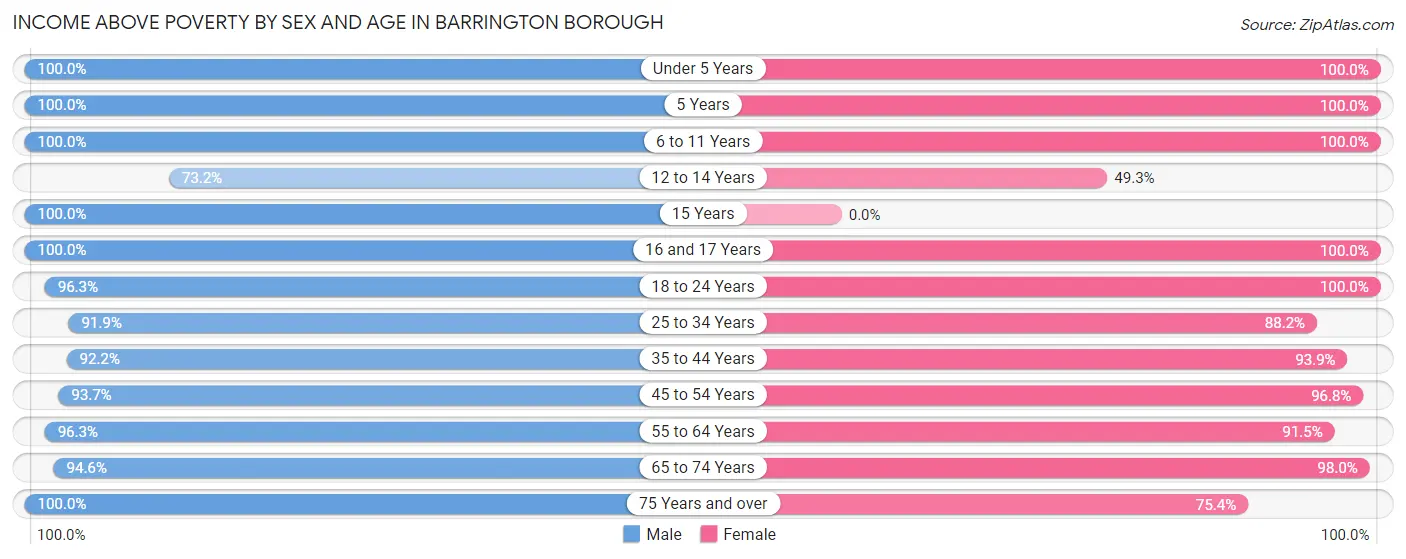
| Age Bracket | Male | Female |
| Under 5 Years | 177 (100.0%) | 235 (100.0%) |
| 5 Years | 40 (100.0%) | 25 (100.0%) |
| 6 to 11 Years | 184 (100.0%) | 92 (100.0%) |
| 12 to 14 Years | 71 (73.2%) | 35 (49.3%) |
| 15 Years | 21 (100.0%) | 0 (0.0%) |
| 16 and 17 Years | 64 (100.0%) | 39 (100.0%) |
| 18 to 24 Years | 231 (96.3%) | 250 (100.0%) |
| 25 to 34 Years | 597 (91.8%) | 522 (88.2%) |
| 35 to 44 Years | 319 (92.2%) | 336 (93.9%) |
| 45 to 54 Years | 403 (93.7%) | 540 (96.8%) |
| 55 to 64 Years | 720 (96.3%) | 482 (91.5%) |
| 65 to 74 Years | 281 (94.6%) | 386 (98.0%) |
| 75 Years and over | 400 (100.0%) | 141 (75.4%) |
| Total | 3,508 (95.0%) | 3,083 (92.6%) |
Income Below Poverty Among Married-Couple Families in Barrington borough
The poverty statistics for married-couple families in Barrington borough show that 3.3% or 46 of the total 1,408 families live below the poverty line. Families with no children have the highest poverty rate of 4.9%, comprising of 46 families. On the other hand, families with 1 or 2 children have the lowest poverty rate of 0.0%, which includes 0 families.
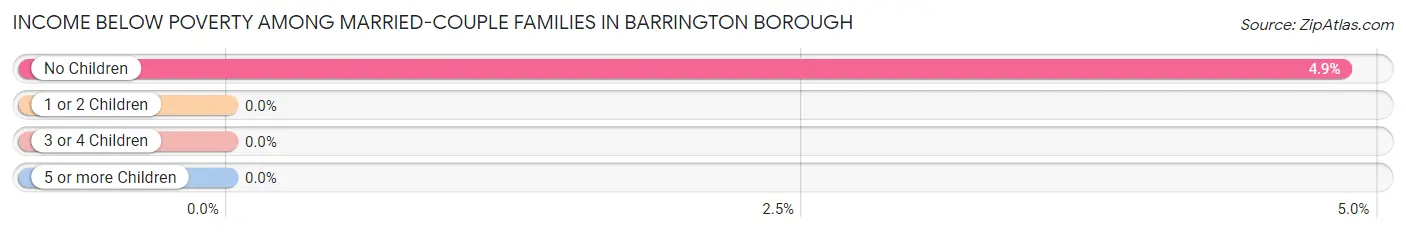
| Children | Above Poverty | Below Poverty |
| No Children | 903 (95.2%) | 46 (4.9%) |
| 1 or 2 Children | 371 (100.0%) | 0 (0.0%) |
| 3 or 4 Children | 88 (100.0%) | 0 (0.0%) |
| 5 or more Children | 0 (0.0%) | 0 (0.0%) |
| Total | 1,362 (96.7%) | 46 (3.3%) |
Income Below Poverty Among Single-Parent Households in Barrington borough
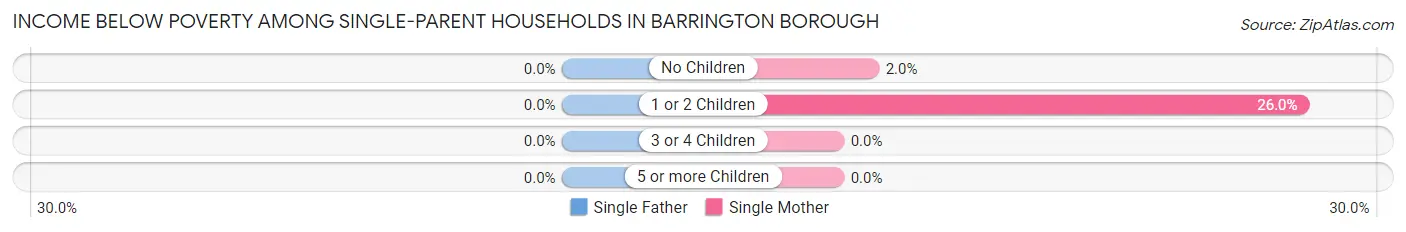
| Children | Single Father | Single Mother |
| No Children | 0 (0.0%) | 3 (2.0%) |
| 1 or 2 Children | 0 (0.0%) | 32 (26.0%) |
| 3 or 4 Children | 0 (0.0%) | 0 (0.0%) |
| 5 or more Children | 0 (0.0%) | 0 (0.0%) |
| Total | 0 (0.0%) | 35 (12.7%) |
Income Below Poverty Among Married-Couple vs Single-Parent Households in Barrington borough
The poverty data for Barrington borough shows that 46 of the married-couple family households (3.3%) and 35 of the single-parent households (7.8%) are living below the poverty level. Within the married-couple family households, those with no children have the highest poverty rate, with 46 households (4.9%) falling below the poverty line. Among the single-parent households, those with 1 or 2 children have the highest poverty rate, with 32 household (20.5%) living below poverty.
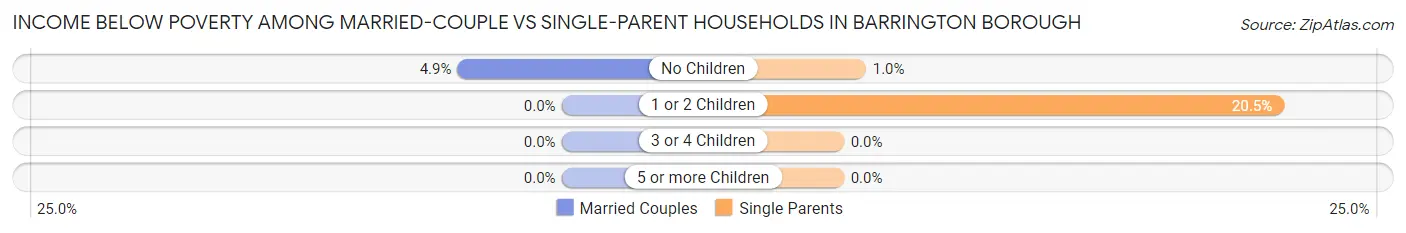
| Children | Married-Couple Families | Single-Parent Households |
| No Children | 46 (4.9%) | 3 (1.0%) |
| 1 or 2 Children | 0 (0.0%) | 32 (20.5%) |
| 3 or 4 Children | 0 (0.0%) | 0 (0.0%) |
| 5 or more Children | 0 (0.0%) | 0 (0.0%) |
| Total | 46 (3.3%) | 35 (7.8%) |
Race in Barrington borough
The most populous races in Barrington borough are White / Caucasian (6,317 | 90.0%), Two or more Races (364 | 5.2%), and Hispanic or Latino (239 | 3.4%).
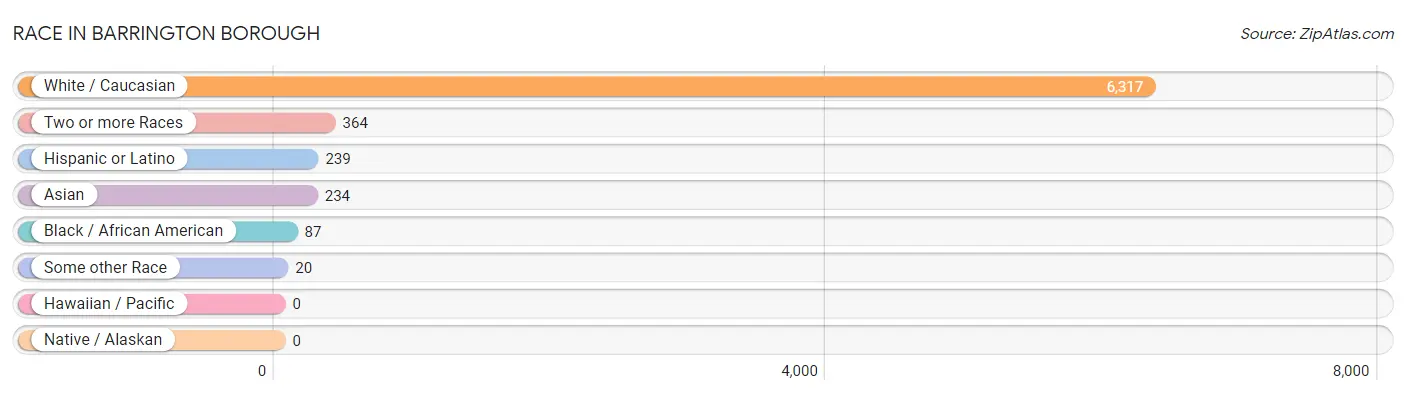
| Race | # Population | % Population |
| Asian | 234 | 3.3% |
| Black / African American | 87 | 1.2% |
| Hawaiian / Pacific | 0 | 0.0% |
| Hispanic or Latino | 239 | 3.4% |
| Native / Alaskan | 0 | 0.0% |
| White / Caucasian | 6,317 | 90.0% |
| Two or more Races | 364 | 5.2% |
| Some other Race | 20 | 0.3% |
| Total | 7,022 | 100.0% |
Ancestry in Barrington borough
The most populous ancestries reported in Barrington borough are Irish (2,396 | 34.1%), German (1,549 | 22.1%), Italian (1,459 | 20.8%), English (923 | 13.1%), and Polish (504 | 7.2%), together accounting for 97.3% of all Barrington borough residents.
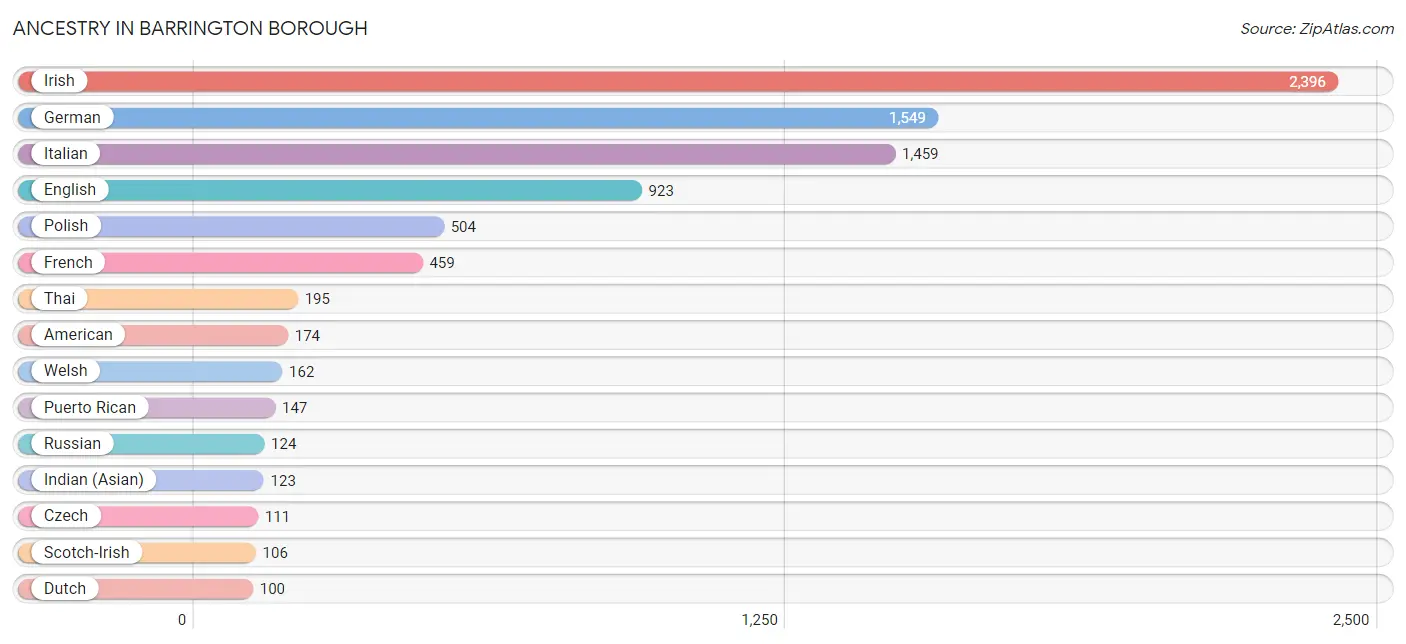
| Ancestry | # Population | % Population |
| African | 26 | 0.4% |
| Albanian | 65 | 0.9% |
| American | 174 | 2.5% |
| Arab | 46 | 0.7% |
| Armenian | 14 | 0.2% |
| Bhutanese | 32 | 0.5% |
| British | 10 | 0.1% |
| Burmese | 11 | 0.2% |
| Central American | 19 | 0.3% |
| Cherokee | 67 | 0.9% |
| Colombian | 65 | 0.9% |
| Costa Rican | 12 | 0.2% |
| Croatian | 1 | 0.0% |
| Czech | 111 | 1.6% |
| Dutch | 100 | 1.4% |
| Eastern European | 63 | 0.9% |
| Ecuadorian | 8 | 0.1% |
| Egyptian | 46 | 0.7% |
| English | 923 | 13.1% |
| European | 47 | 0.7% |
| French | 459 | 6.5% |
| French American Indian | 45 | 0.6% |
| German | 1,549 | 22.1% |
| Indian (Asian) | 123 | 1.8% |
| Irish | 2,396 | 34.1% |
| Italian | 1,459 | 20.8% |
| Jamaican | 34 | 0.5% |
| Japanese | 40 | 0.6% |
| Lithuanian | 14 | 0.2% |
| Nicaraguan | 7 | 0.1% |
| Nigerian | 40 | 0.6% |
| Northern European | 10 | 0.1% |
| Norwegian | 78 | 1.1% |
| Polish | 504 | 7.2% |
| Portuguese | 78 | 1.1% |
| Puerto Rican | 147 | 2.1% |
| Romanian | 27 | 0.4% |
| Russian | 124 | 1.8% |
| Scotch-Irish | 106 | 1.5% |
| Scottish | 67 | 0.9% |
| Slovak | 7 | 0.1% |
| South American | 73 | 1.0% |
| Sri Lankan | 40 | 0.6% |
| Subsaharan African | 66 | 0.9% |
| Swedish | 53 | 0.7% |
| Thai | 195 | 2.8% |
| Turkish | 43 | 0.6% |
| Ukrainian | 36 | 0.5% |
| Welsh | 162 | 2.3% | View All 49 Rows |
Immigrants in Barrington borough
The most numerous immigrant groups reported in Barrington borough came from Asia (180 | 2.6%), South Central Asia (98 | 1.4%), Pakistan (79 | 1.1%), Europe (78 | 1.1%), and Latin America (69 | 1.0%), together accounting for 7.2% of all Barrington borough residents.
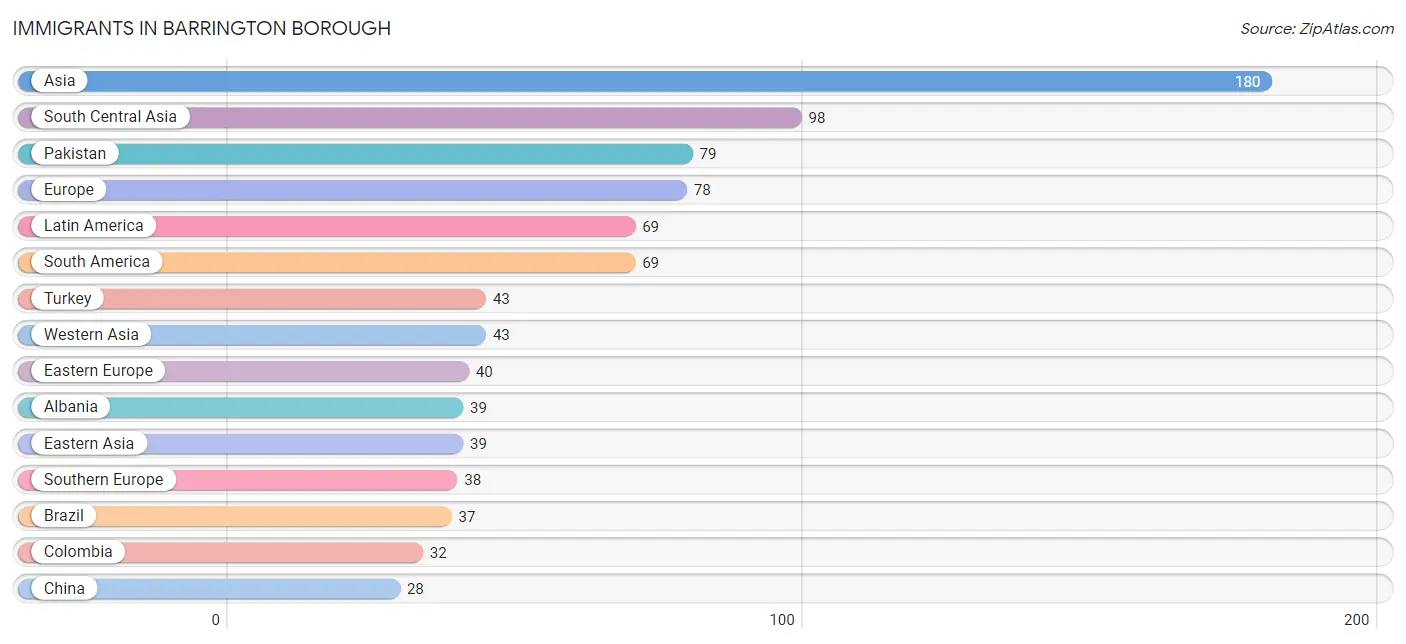
| Immigration Origin | # Population | % Population |
| Albania | 39 | 0.6% |
| Asia | 180 | 2.6% |
| Brazil | 37 | 0.5% |
| Canada | 10 | 0.1% |
| China | 28 | 0.4% |
| Colombia | 32 | 0.5% |
| Croatia | 1 | 0.0% |
| Eastern Asia | 39 | 0.6% |
| Eastern Europe | 40 | 0.6% |
| Europe | 78 | 1.1% |
| India | 19 | 0.3% |
| Italy | 13 | 0.2% |
| Korea | 11 | 0.2% |
| Latin America | 69 | 1.0% |
| Pakistan | 79 | 1.1% |
| Portugal | 25 | 0.4% |
| South America | 69 | 1.0% |
| South Central Asia | 98 | 1.4% |
| Southern Europe | 38 | 0.5% |
| Turkey | 43 | 0.6% |
| Western Asia | 43 | 0.6% | View All 21 Rows |
Sex and Age in Barrington borough
Sex and Age in Barrington borough
The most populous age groups in Barrington borough are 60 to 64 Years (555 | 15.0%) for men and 25 to 29 Years (393 | 11.8%) for women.
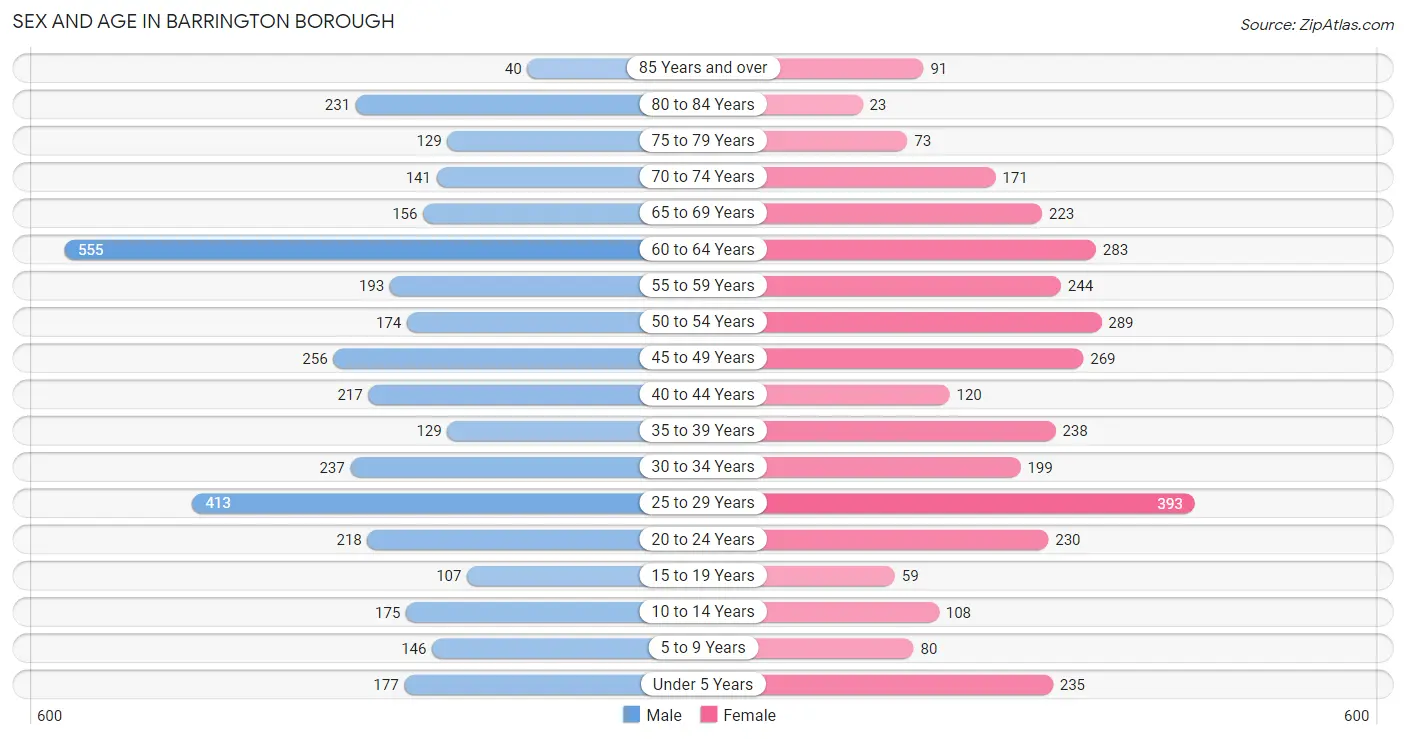
| Age Bracket | Male | Female |
| Under 5 Years | 177 (4.8%) | 235 (7.1%) |
| 5 to 9 Years | 146 (4.0%) | 80 (2.4%) |
| 10 to 14 Years | 175 (4.7%) | 108 (3.3%) |
| 15 to 19 Years | 107 (2.9%) | 59 (1.8%) |
| 20 to 24 Years | 218 (5.9%) | 230 (6.9%) |
| 25 to 29 Years | 413 (11.2%) | 393 (11.8%) |
| 30 to 34 Years | 237 (6.4%) | 199 (6.0%) |
| 35 to 39 Years | 129 (3.5%) | 238 (7.1%) |
| 40 to 44 Years | 217 (5.9%) | 120 (3.6%) |
| 45 to 49 Years | 256 (6.9%) | 269 (8.1%) |
| 50 to 54 Years | 174 (4.7%) | 289 (8.7%) |
| 55 to 59 Years | 193 (5.2%) | 244 (7.3%) |
| 60 to 64 Years | 555 (15.0%) | 283 (8.5%) |
| 65 to 69 Years | 156 (4.2%) | 223 (6.7%) |
| 70 to 74 Years | 141 (3.8%) | 171 (5.1%) |
| 75 to 79 Years | 129 (3.5%) | 73 (2.2%) |
| 80 to 84 Years | 231 (6.2%) | 23 (0.7%) |
| 85 Years and over | 40 (1.1%) | 91 (2.7%) |
| Total | 3,694 (100.0%) | 3,328 (100.0%) |
Families and Households in Barrington borough
Median Family Size in Barrington borough
The median family size in Barrington borough is 2.82 persons per family, with married-couple families (1,408 | 75.9%) accounting for the largest median family size of 2.85 persons per family. On the other hand, single male/father families (171 | 9.2%) represent the smallest median family size with 2.53 persons per family.
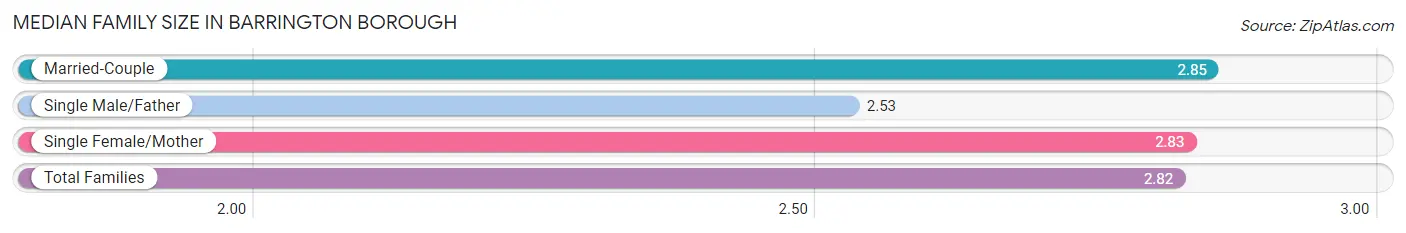
| Family Type | # Families | Family Size |
| Married-Couple | 1,408 (75.9%) | 2.85 |
| Single Male/Father | 171 (9.2%) | 2.53 |
| Single Female/Mother | 276 (14.9%) | 2.83 |
| Total Families | 1,855 (100.0%) | 2.82 |
Median Household Size in Barrington borough
The median household size in Barrington borough is 2.08 persons per household, with single female/mother households (276 | 8.2%) accounting for the largest median household size of 2.91 persons per household. non-family households (1,522 | 45.1%) represent the smallest median household size with 1.15 persons per household.
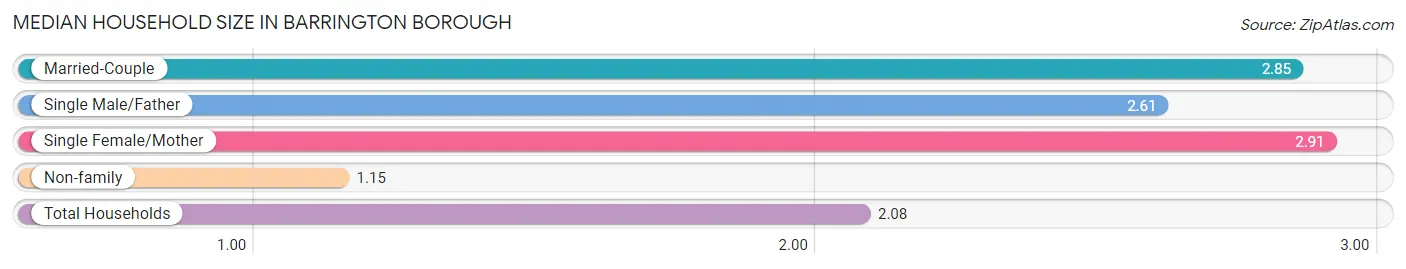
| Household Type | # Households | Household Size |
| Married-Couple | 1,408 (41.7%) | 2.85 |
| Single Male/Father | 171 (5.1%) | 2.61 |
| Single Female/Mother | 276 (8.2%) | 2.91 |
| Non-family | 1,522 (45.1%) | 1.15 |
| Total Households | 3,377 (100.0%) | 2.08 |
Household Size by Marriage Status in Barrington borough
Out of a total of 3,377 households in Barrington borough, 1,855 (54.9%) are family households, while 1,522 (45.1%) are nonfamily households. The most numerous type of family households are 2-person households, comprising 1,029, and the most common type of nonfamily households are 1-person households, comprising 1,304.
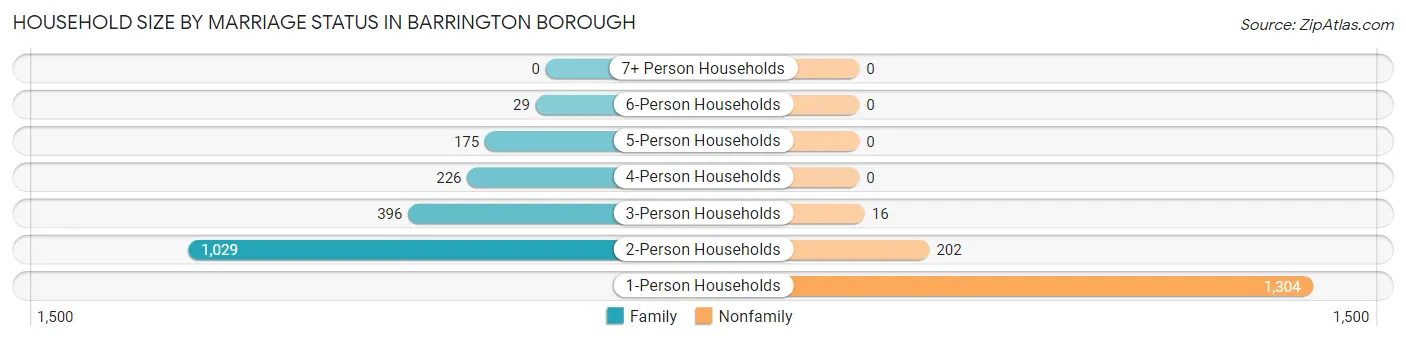
| Household Size | Family Households | Nonfamily Households |
| 1-Person Households | - | 1,304 (38.6%) |
| 2-Person Households | 1,029 (30.5%) | 202 (6.0%) |
| 3-Person Households | 396 (11.7%) | 16 (0.5%) |
| 4-Person Households | 226 (6.7%) | 0 (0.0%) |
| 5-Person Households | 175 (5.2%) | 0 (0.0%) |
| 6-Person Households | 29 (0.9%) | 0 (0.0%) |
| 7+ Person Households | 0 (0.0%) | 0 (0.0%) |
| Total | 1,855 (54.9%) | 1,522 (45.1%) |
Female Fertility in Barrington borough
Fertility by Age in Barrington borough
Average fertility rate in Barrington borough is 35.0 births per 1,000 women. Women in the age bracket of 20 to 34 years have the highest fertility rate with 72.0 births per 1,000 women. Women in the age bracket of 20 to 34 years acount for 100.0% of all women with births.
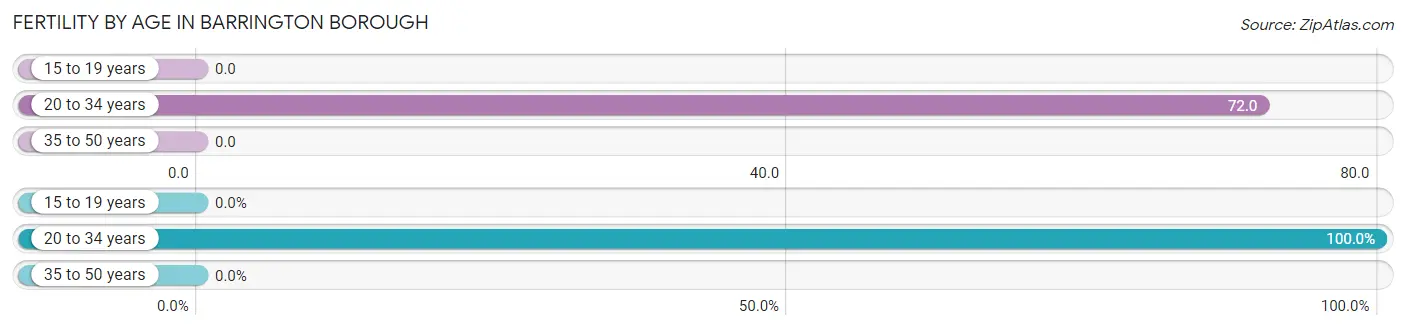
| Age Bracket | Women with Births | Births / 1,000 Women |
| 15 to 19 years | 0 (0.0%) | 0.0 |
| 20 to 34 years | 59 (100.0%) | 72.0 |
| 35 to 50 years | 0 (0.0%) | 0.0 |
| Total | 59 (100.0%) | 35.0 |
Fertility by Age by Marriage Status in Barrington borough
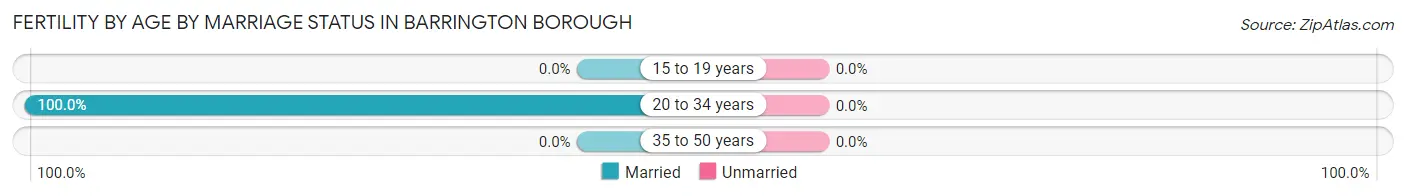
| Age Bracket | Married | Unmarried |
| 15 to 19 years | 0 (0.0%) | 0 (0.0%) |
| 20 to 34 years | 59 (100.0%) | 0 (0.0%) |
| 35 to 50 years | 0 (0.0%) | 0 (0.0%) |
| Total | 59 (100.0%) | 0 (0.0%) |
Fertility by Education in Barrington borough
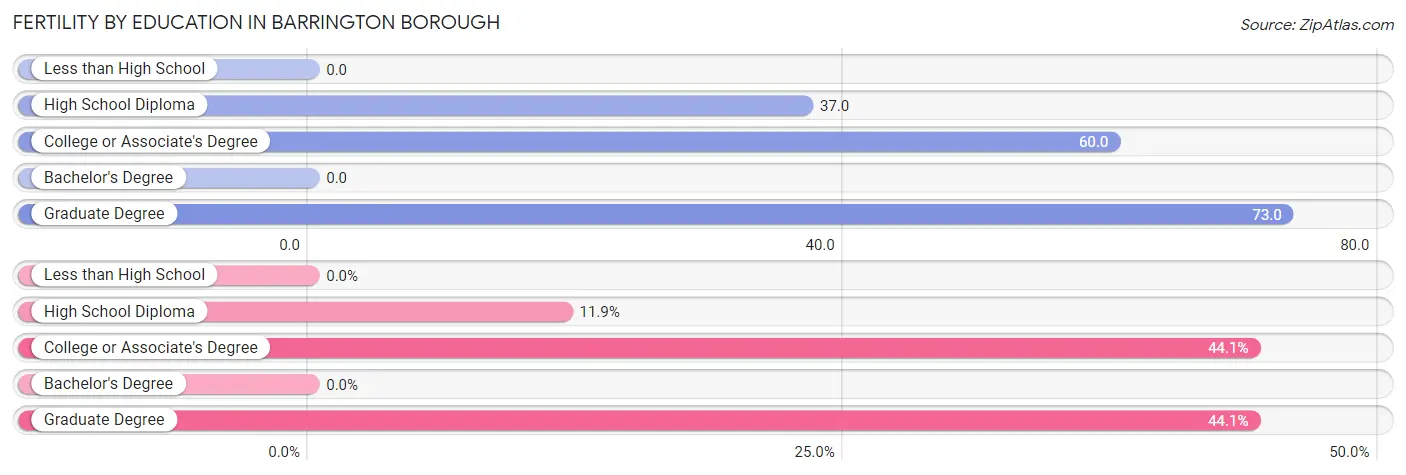
| Educational Attainment | Women with Births | Births / 1,000 Women |
| Less than High School | 0 (0.0%) | 0.0 |
| High School Diploma | 7 (11.9%) | 37.0 |
| College or Associate's Degree | 26 (44.1%) | 60.0 |
| Bachelor's Degree | 0 (0.0%) | 0.0 |
| Graduate Degree | 26 (44.1%) | 73.0 |
| Total | 59 (100.0%) | 35.0 |
Fertility by Education by Marriage Status in Barrington borough
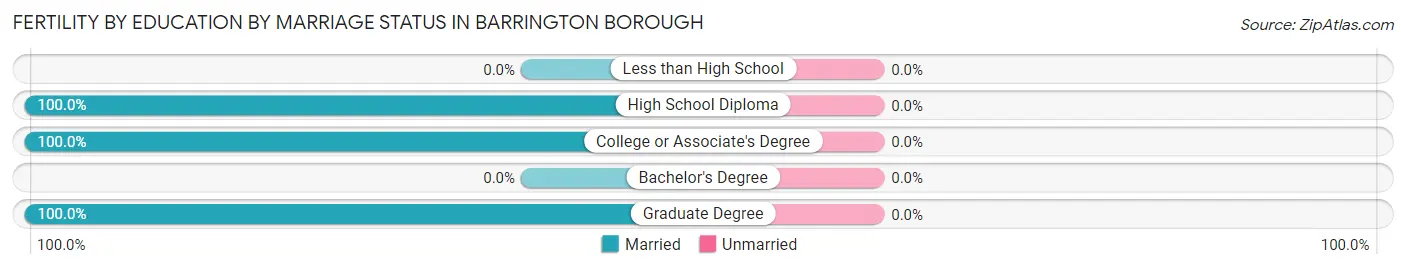
| Educational Attainment | Married | Unmarried |
| Less than High School | 0 (0.0%) | 0 (0.0%) |
| High School Diploma | 7 (100.0%) | 0 (0.0%) |
| College or Associate's Degree | 26 (100.0%) | 0 (0.0%) |
| Bachelor's Degree | 0 (0.0%) | 0 (0.0%) |
| Graduate Degree | 26 (100.0%) | 0 (0.0%) |
| Total | 59 (100.0%) | 0 (0.0%) |
Employment Characteristics in Barrington borough
Employment by Class of Employer in Barrington borough
Among the 4,027 employed individuals in Barrington borough, private company employees (2,615 | 64.9%), not-for-profit organizations (567 | 14.1%), and local government employees (293 | 7.3%) make up the most common classes of employment.
| Employer Class | # Employees | % Employees |
| Private Company Employees | 2,615 | 64.9% |
| Self-Employed (Incorporated) | 18 | 0.4% |
| Self-Employed (Not Incorporated) | 216 | 5.4% |
| Not-for-profit Organizations | 567 | 14.1% |
| Local Government Employees | 293 | 7.3% |
| State Government Employees | 257 | 6.4% |
| Federal Government Employees | 61 | 1.5% |
| Unpaid Family Workers | 0 | 0.0% |
| Total | 4,027 | 100.0% |
Employment Status by Age in Barrington borough
According to the labor force statistics for Barrington borough, out of the total population over 16 years of age (6,080), 72.5% or 4,408 individuals are in the labor force, with 6.8% or 300 of them unemployed. The age group with the highest labor force participation rate is 25 to 29 years, with 100.0% or 806 individuals in the labor force. Within the labor force, the 30 to 34 years age range has the highest percentage of unemployed individuals, with 17.0% or 67 of them being unemployed.
| Age Bracket | In Labor Force | Unemployed |
| 16 to 19 Years | 21 (14.5%) | 0 (0.0%) |
| 20 to 24 Years | 362 (80.8%) | 36 (9.9%) |
| 25 to 29 Years | 806 (100.0%) | 24 (3.0%) |
| 30 to 34 Years | 394 (90.4%) | 67 (17.0%) |
| 35 to 44 Years | 637 (90.5%) | 0 (0.0%) |
| 45 to 54 Years | 883 (89.4%) | 73 (8.3%) |
| 55 to 59 Years | 338 (77.3%) | 0 (0.0%) |
| 60 to 64 Years | 643 (76.7%) | 102 (15.9%) |
| 65 to 74 Years | 256 (37.0%) | 0 (0.0%) |
| 75 Years and over | 70 (11.9%) | 0 (0.0%) |
| Total | 4,408 (72.5%) | 300 (6.8%) |
Employment Status by Educational Attainment in Barrington borough
According to labor force statistics for Barrington borough, 87.9% of individuals (3,700) out of the total population between 25 and 64 years of age (4,209) are in the labor force, with 7.2% or 266 of them being unemployed. The group with the highest labor force participation rate are those with the educational attainment of bachelor's degree or higher, with 96.2% or 1,965 individuals in the labor force. Within the labor force, individuals with high school diploma education have the highest percentage of unemployment, with 14.4% or 119 of them being unemployed.
| Educational Attainment | In Labor Force | Unemployed |
| Less than High School | 57 (62.6%) | 0 (0.0%) |
| High School Diploma | 826 (78.3%) | 152 (14.4%) |
| College / Associate Degree | 852 (83.5%) | 49 (4.8%) |
| Bachelor's Degree or higher | 1,965 (96.2%) | 110 (5.4%) |
| Total | 3,700 (87.9%) | 303 (7.2%) |
Employment Occupations by Sex in Barrington borough
Management, Business, Science and Arts Occupations
The most common Management, Business, Science and Arts occupations in Barrington borough are Community & Social Service (690 | 16.8%), Computers, Engineering & Science (495 | 12.0%), Education Instruction & Library (440 | 10.7%), Health Diagnosing & Treating (435 | 10.6%), and Health Technologists (336 | 8.2%).
Management, Business, Science and Arts Occupations by Sex
Within the Management, Business, Science and Arts occupations in Barrington borough, the most male-oriented occupations are Architecture & Engineering (100.0%), Computers & Mathematics (90.2%), and Computers, Engineering & Science (87.9%), while the most female-oriented occupations are Legal Services & Support (90.8%), Community & Social Service (75.9%), and Education Instruction & Library (75.0%).
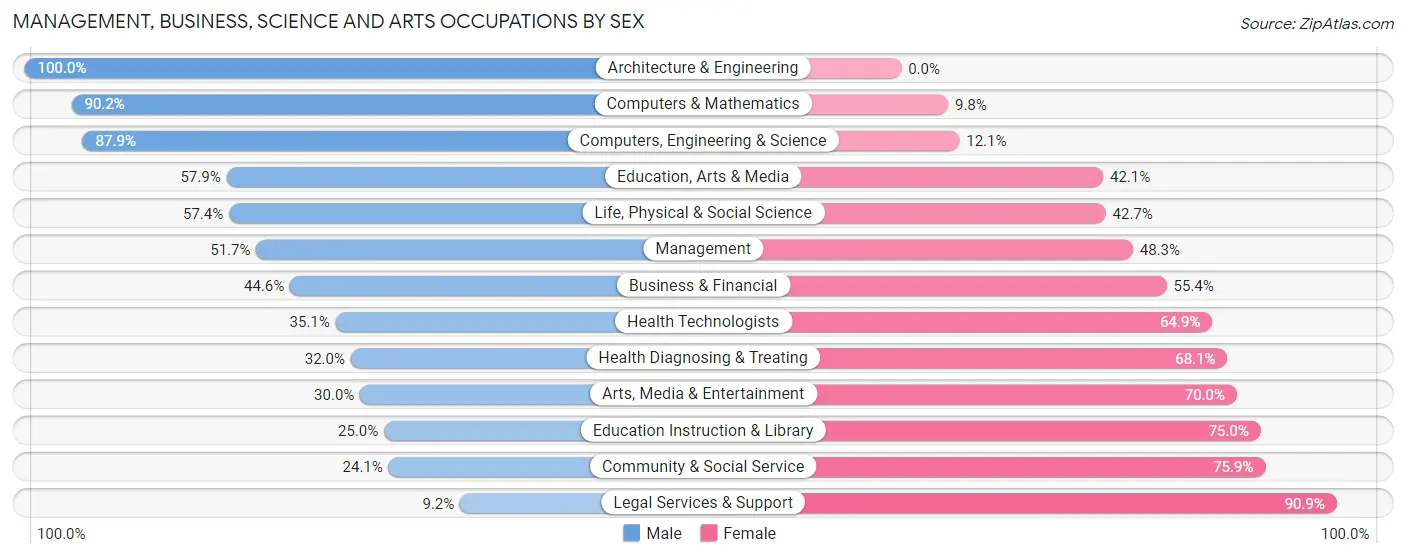
| Occupation | Male | Female |
| Management | 170 (51.7%) | 159 (48.3%) |
| Business & Financial | 108 (44.6%) | 134 (55.4%) |
| Computers, Engineering & Science | 435 (87.9%) | 60 (12.1%) |
| Computers & Mathematics | 286 (90.2%) | 31 (9.8%) |
| Architecture & Engineering | 110 (100.0%) | 0 (0.0%) |
| Life, Physical & Social Science | 39 (57.4%) | 29 (42.6%) |
| Community & Social Service | 166 (24.1%) | 524 (75.9%) |
| Education, Arts & Media | 22 (57.9%) | 16 (42.1%) |
| Legal Services & Support | 13 (9.1%) | 129 (90.8%) |
| Education Instruction & Library | 110 (25.0%) | 330 (75.0%) |
| Arts, Media & Entertainment | 21 (30.0%) | 49 (70.0%) |
| Health Diagnosing & Treating | 139 (32.0%) | 296 (68.0%) |
| Health Technologists | 118 (35.1%) | 218 (64.9%) |
| Total (Category) | 1,018 (46.5%) | 1,173 (53.5%) |
| Total (Overall) | 2,058 (50.1%) | 2,050 (49.9%) |
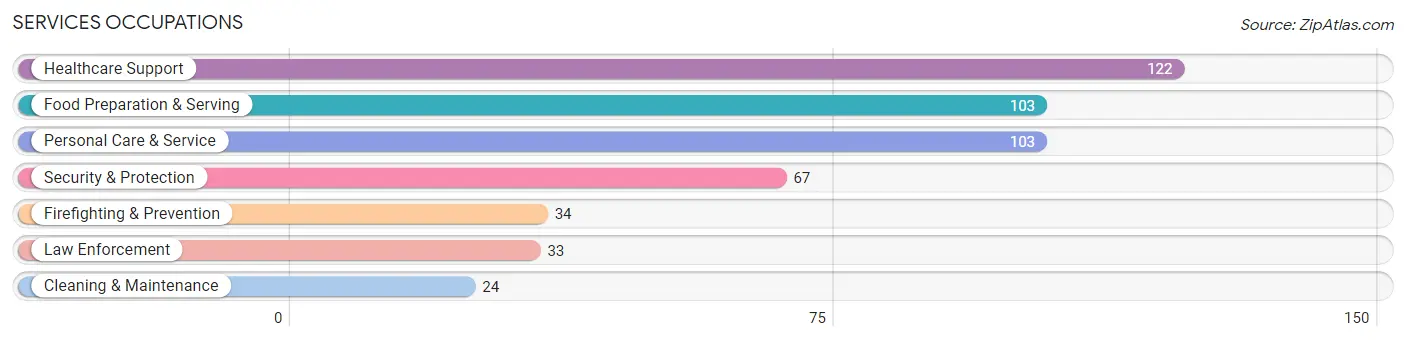
Services Occupations
The most common Services occupations in Barrington borough are Healthcare Support (122 | 3.0%), Food Preparation & Serving (103 | 2.5%), Personal Care & Service (103 | 2.5%), Security & Protection (67 | 1.6%), and Firefighting & Prevention (34 | 0.8%).
Services Occupations by Sex
Within the Services occupations in Barrington borough, the most male-oriented occupations are Firefighting & Prevention (100.0%), Cleaning & Maintenance (100.0%), and Security & Protection (73.1%), while the most female-oriented occupations are Personal Care & Service (100.0%), Food Preparation & Serving (71.8%), and Law Enforcement (54.5%).
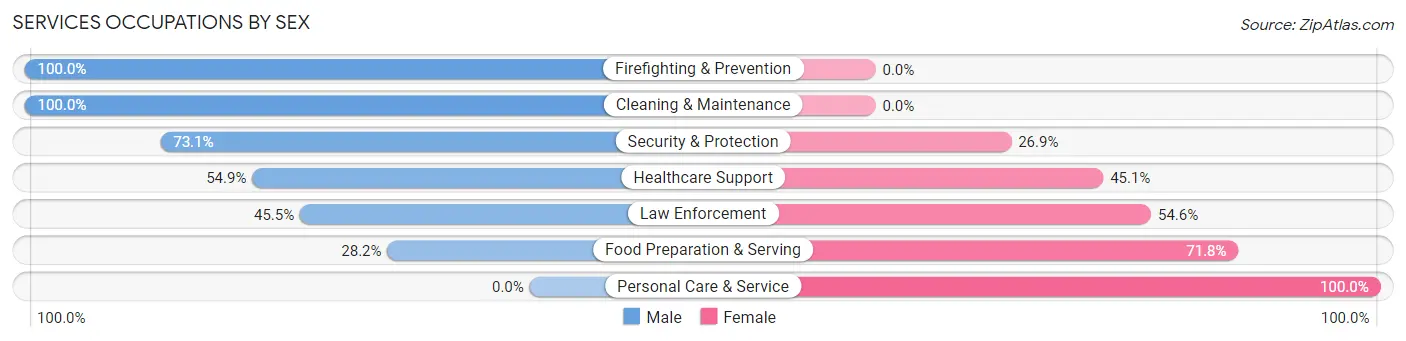
| Occupation | Male | Female |
| Healthcare Support | 67 (54.9%) | 55 (45.1%) |
| Security & Protection | 49 (73.1%) | 18 (26.9%) |
| Firefighting & Prevention | 34 (100.0%) | 0 (0.0%) |
| Law Enforcement | 15 (45.5%) | 18 (54.5%) |
| Food Preparation & Serving | 29 (28.2%) | 74 (71.8%) |
| Cleaning & Maintenance | 24 (100.0%) | 0 (0.0%) |
| Personal Care & Service | 0 (0.0%) | 103 (100.0%) |
| Total (Category) | 169 (40.3%) | 250 (59.7%) |
| Total (Overall) | 2,058 (50.1%) | 2,050 (49.9%) |
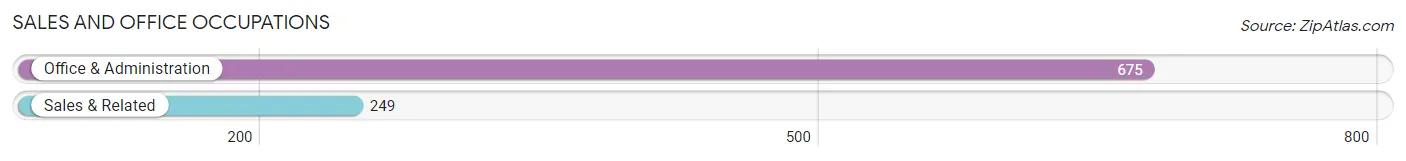
Sales and Office Occupations
The most common Sales and Office occupations in Barrington borough are Office & Administration (675 | 16.4%), and Sales & Related (249 | 6.1%).
Sales and Office Occupations by Sex
| Occupation | Male | Female |
| Sales & Related | 99 (39.8%) | 150 (60.2%) |
| Office & Administration | 310 (45.9%) | 365 (54.1%) |
| Total (Category) | 409 (44.3%) | 515 (55.7%) |
| Total (Overall) | 2,058 (50.1%) | 2,050 (49.9%) |
Natural Resources, Construction and Maintenance Occupations
The most common Natural Resources, Construction and Maintenance occupations in Barrington borough are Construction & Extraction (143 | 3.5%), and Installation, Maintenance & Repair (134 | 3.3%).
Natural Resources, Construction and Maintenance Occupations by Sex
| Occupation | Male | Female |
| Farming, Fishing & Forestry | 0 (0.0%) | 0 (0.0%) |
| Construction & Extraction | 143 (100.0%) | 0 (0.0%) |
| Installation, Maintenance & Repair | 112 (83.6%) | 22 (16.4%) |
| Total (Category) | 255 (92.1%) | 22 (7.9%) |
| Total (Overall) | 2,058 (50.1%) | 2,050 (49.9%) |
Production, Transportation and Moving Occupations
The most common Production, Transportation and Moving occupations in Barrington borough are Production (139 | 3.4%), Material Moving (88 | 2.1%), and Transportation (70 | 1.7%).
Production, Transportation and Moving Occupations by Sex
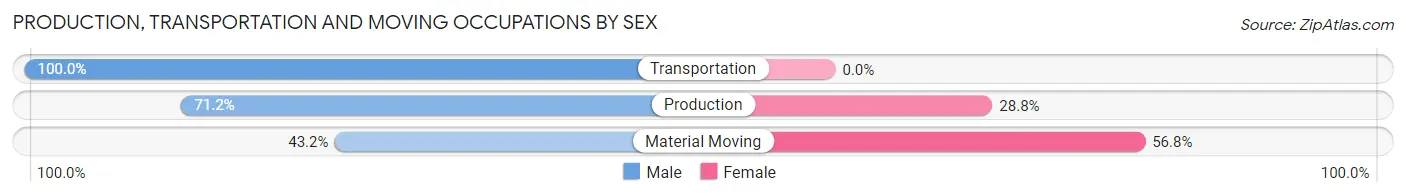
| Occupation | Male | Female |
| Production | 99 (71.2%) | 40 (28.8%) |
| Transportation | 70 (100.0%) | 0 (0.0%) |
| Material Moving | 38 (43.2%) | 50 (56.8%) |
| Total (Category) | 207 (69.7%) | 90 (30.3%) |
| Total (Overall) | 2,058 (50.1%) | 2,050 (49.9%) |
Employment Industries by Sex in Barrington borough
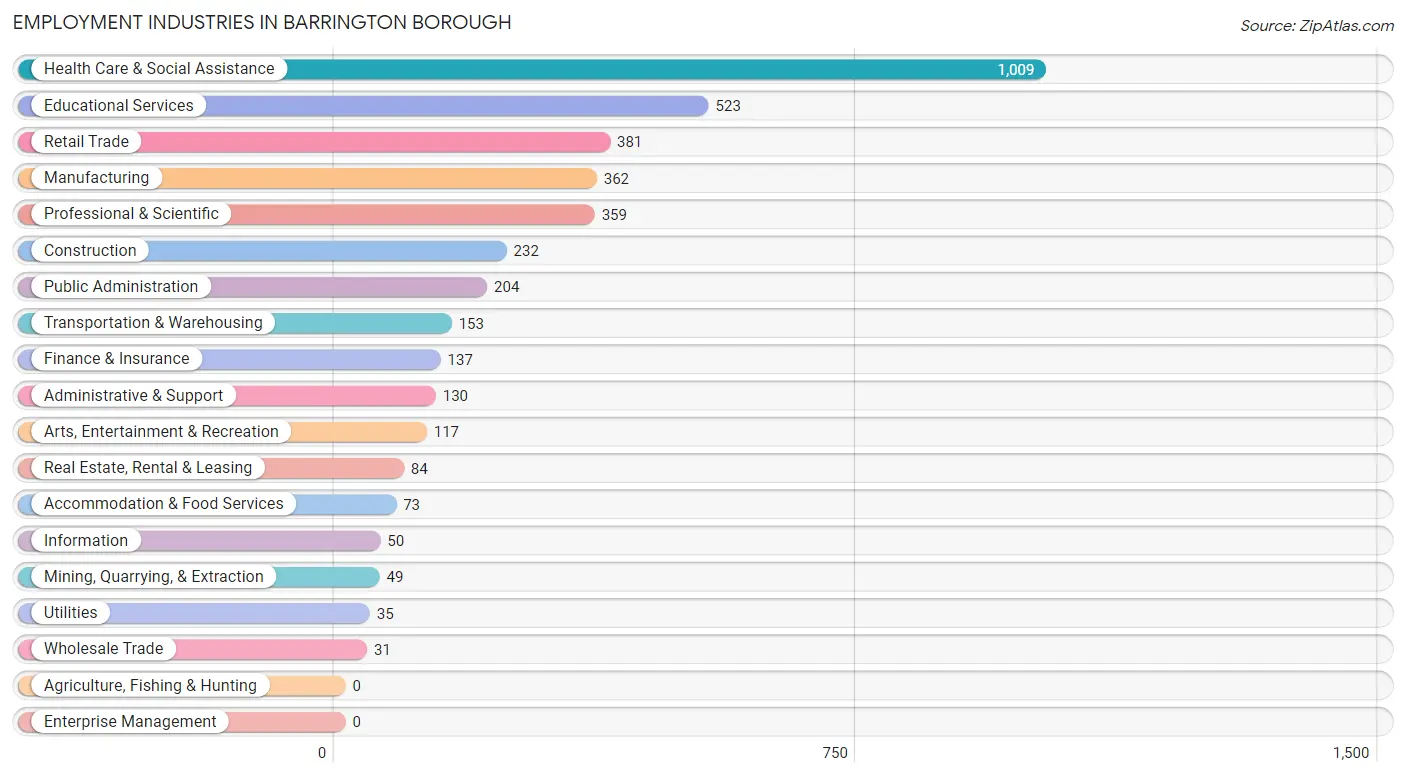
Employment Industries in Barrington borough
The major employment industries in Barrington borough include Health Care & Social Assistance (1,009 | 24.6%), Educational Services (523 | 12.7%), Retail Trade (381 | 9.3%), Manufacturing (362 | 8.8%), and Professional & Scientific (359 | 8.7%).
Employment Industries by Sex in Barrington borough
The Barrington borough industries that see more men than women are Utilities (100.0%), Administrative & Support (89.2%), and Construction (82.3%), whereas the industries that tend to have a higher number of women are Wholesale Trade (100.0%), Accommodation & Food Services (76.7%), and Educational Services (74.2%).
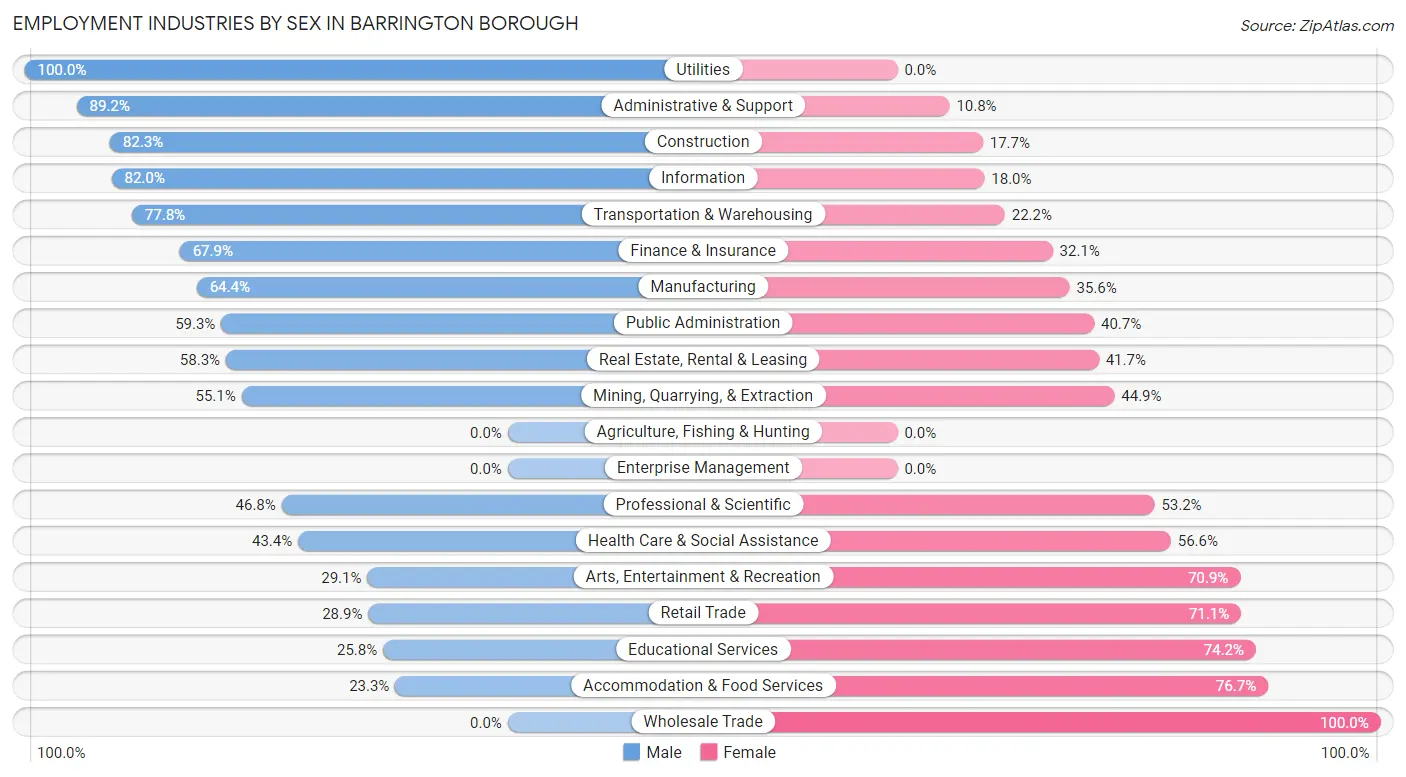
| Industry | Male | Female |
| Agriculture, Fishing & Hunting | 0 (0.0%) | 0 (0.0%) |
| Mining, Quarrying, & Extraction | 27 (55.1%) | 22 (44.9%) |
| Construction | 191 (82.3%) | 41 (17.7%) |
| Manufacturing | 233 (64.4%) | 129 (35.6%) |
| Wholesale Trade | 0 (0.0%) | 31 (100.0%) |
| Retail Trade | 110 (28.9%) | 271 (71.1%) |
| Transportation & Warehousing | 119 (77.8%) | 34 (22.2%) |
| Utilities | 35 (100.0%) | 0 (0.0%) |
| Information | 41 (82.0%) | 9 (18.0%) |
| Finance & Insurance | 93 (67.9%) | 44 (32.1%) |
| Real Estate, Rental & Leasing | 49 (58.3%) | 35 (41.7%) |
| Professional & Scientific | 168 (46.8%) | 191 (53.2%) |
| Enterprise Management | 0 (0.0%) | 0 (0.0%) |
| Administrative & Support | 116 (89.2%) | 14 (10.8%) |
| Educational Services | 135 (25.8%) | 388 (74.2%) |
| Health Care & Social Assistance | 438 (43.4%) | 571 (56.6%) |
| Arts, Entertainment & Recreation | 34 (29.1%) | 83 (70.9%) |
| Accommodation & Food Services | 17 (23.3%) | 56 (76.7%) |
| Public Administration | 121 (59.3%) | 83 (40.7%) |
| Total | 2,058 (50.1%) | 2,050 (49.9%) |
Education in Barrington borough
School Enrollment in Barrington borough
The most common levels of schooling among the 1,311 students in Barrington borough are college / undergraduate (299 | 22.8%), graduate / professional (296 | 22.6%), and middle school (228 | 17.4%).
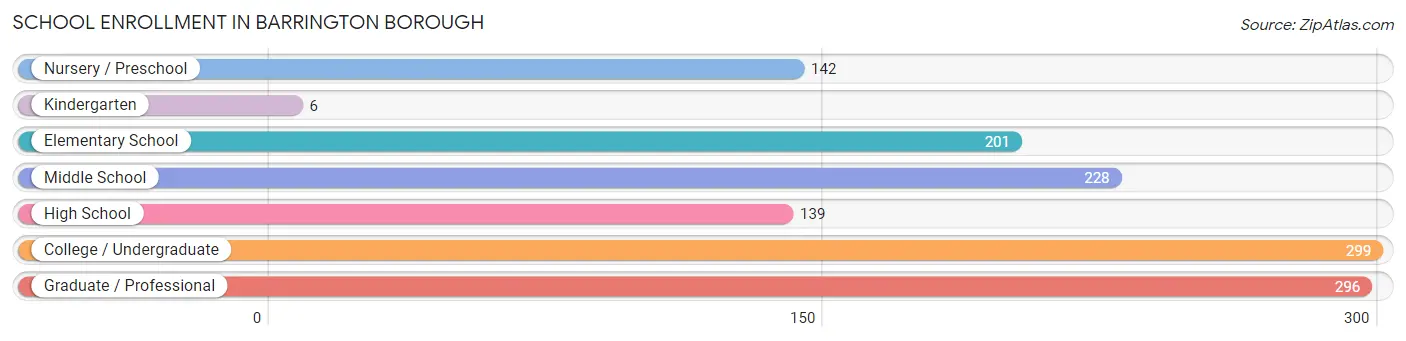
| School Level | # Students | % Students |
| Nursery / Preschool | 142 | 10.8% |
| Kindergarten | 6 | 0.5% |
| Elementary School | 201 | 15.3% |
| Middle School | 228 | 17.4% |
| High School | 139 | 10.6% |
| College / Undergraduate | 299 | 22.8% |
| Graduate / Professional | 296 | 22.6% |
| Total | 1,311 | 100.0% |
School Enrollment by Age by Funding Source in Barrington borough
Out of a total of 1,311 students who are enrolled in schools in Barrington borough, 284 (21.7%) attend a private institution, while the remaining 1,027 (78.3%) are enrolled in public schools. The age group of 3 to 4 year olds has the highest likelihood of being enrolled in private schools, with 48 (57.8% in the age bracket) enrolled. Conversely, the age group of 15 to 17 year olds has the lowest likelihood of being enrolled in a private school, with 124 (100.0% in the age bracket) attending a public institution.
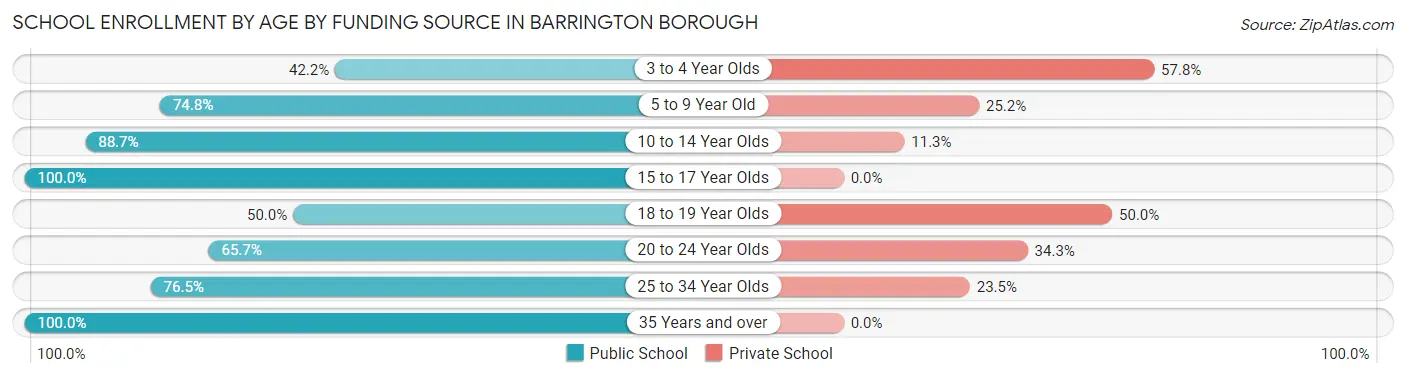
| Age Bracket | Public School | Private School |
| 3 to 4 Year Olds | 35 (42.2%) | 48 (57.8%) |
| 5 to 9 Year Old | 169 (74.8%) | 57 (25.2%) |
| 10 to 14 Year Olds | 251 (88.7%) | 32 (11.3%) |
| 15 to 17 Year Olds | 124 (100.0%) | 0 (0.0%) |
| 18 to 19 Year Olds | 21 (50.0%) | 21 (50.0%) |
| 20 to 24 Year Olds | 94 (65.7%) | 49 (34.3%) |
| 25 to 34 Year Olds | 254 (76.5%) | 78 (23.5%) |
| 35 Years and over | 78 (100.0%) | 0 (0.0%) |
| Total | 1,027 (78.3%) | 284 (21.7%) |
Educational Attainment by Field of Study in Barrington borough
Education (511 | 19.8%), business (411 | 16.0%), bio, nature & agricultural (258 | 10.0%), science & technology (212 | 8.2%), and engineering (202 | 7.8%) are the most common fields of study among 2,575 individuals in Barrington borough who have obtained a bachelor's degree or higher.
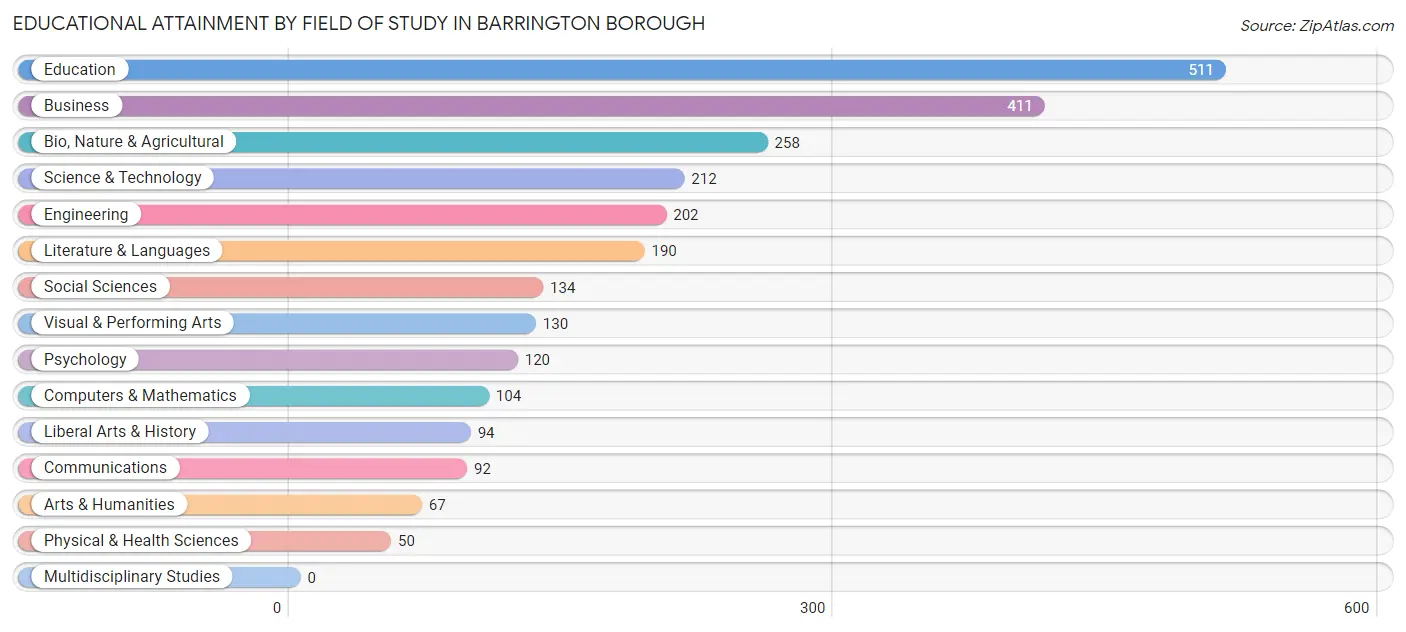
| Field of Study | # Graduates | % Graduates |
| Computers & Mathematics | 104 | 4.0% |
| Bio, Nature & Agricultural | 258 | 10.0% |
| Physical & Health Sciences | 50 | 1.9% |
| Psychology | 120 | 4.7% |
| Social Sciences | 134 | 5.2% |
| Engineering | 202 | 7.8% |
| Multidisciplinary Studies | 0 | 0.0% |
| Science & Technology | 212 | 8.2% |
| Business | 411 | 16.0% |
| Education | 511 | 19.8% |
| Literature & Languages | 190 | 7.4% |
| Liberal Arts & History | 94 | 3.6% |
| Visual & Performing Arts | 130 | 5.1% |
| Communications | 92 | 3.6% |
| Arts & Humanities | 67 | 2.6% |
| Total | 2,575 | 100.0% |
Transportation & Commute in Barrington borough
Vehicle Availability by Sex in Barrington borough
The most prevalent vehicle ownership categories in Barrington borough are males with 2 vehicles (1,140, accounting for 55.8%) and females with 2 vehicles (1,062, making up 57.6%).
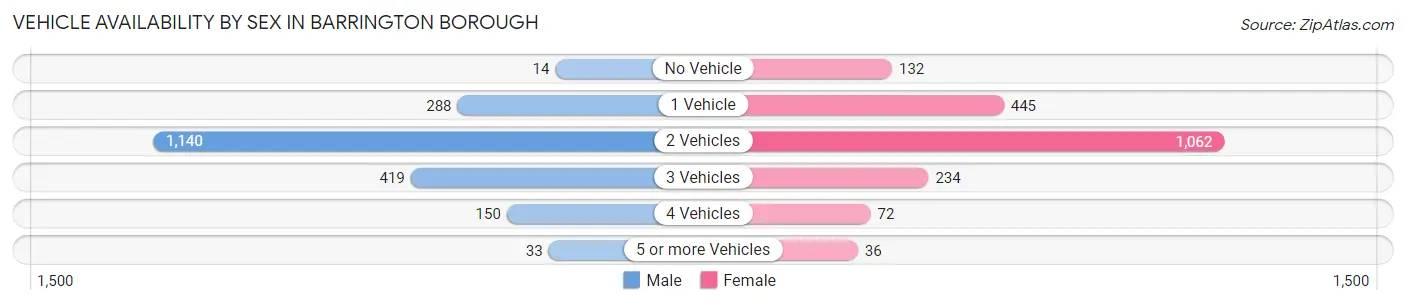
| Vehicles Available | Male | Female |
| No Vehicle | 14 (0.7%) | 132 (6.7%) |
| 1 Vehicle | 288 (14.1%) | 445 (22.5%) |
| 2 Vehicles | 1,140 (55.8%) | 1,062 (53.6%) |
| 3 Vehicles | 419 (20.5%) | 234 (11.8%) |
| 4 Vehicles | 150 (7.3%) | 72 (3.6%) |
| 5 or more Vehicles | 33 (1.6%) | 36 (1.8%) |
| Total | 2,044 (100.0%) | 1,981 (100.0%) |
Commute Time in Barrington borough
The most frequently occuring commute durations in Barrington borough are 15 to 19 minutes (726 commuters, 20.8%), 20 to 24 minutes (568 commuters, 16.3%), and 45 to 59 minutes (531 commuters, 15.2%).
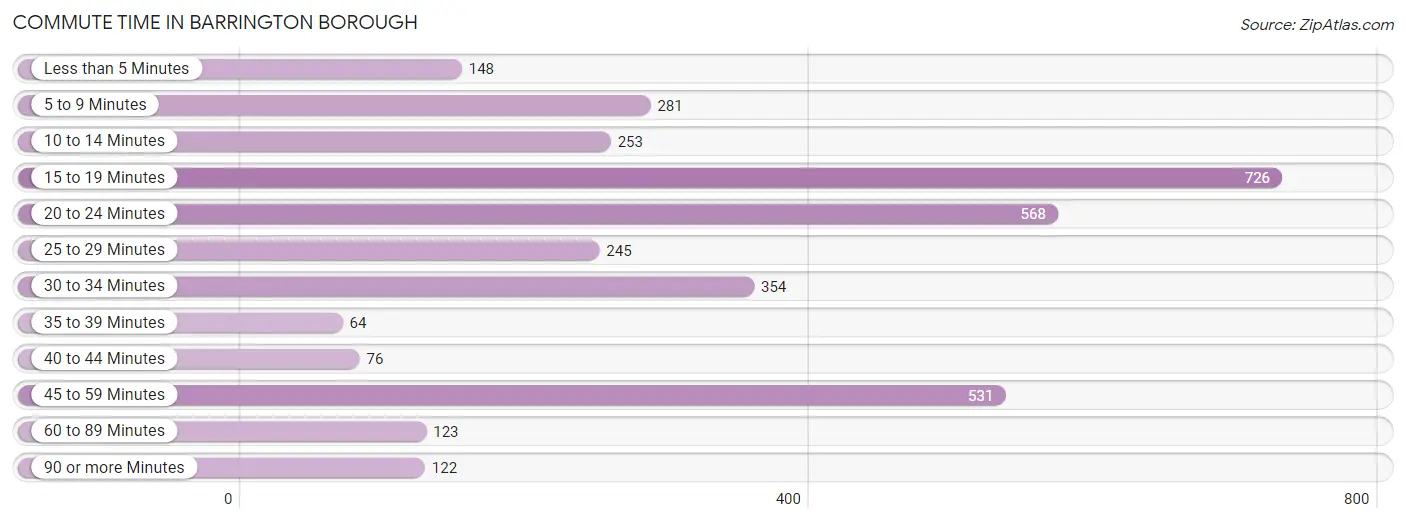
| Commute Time | # Commuters | % Commuters |
| Less than 5 Minutes | 148 | 4.2% |
| 5 to 9 Minutes | 281 | 8.1% |
| 10 to 14 Minutes | 253 | 7.2% |
| 15 to 19 Minutes | 726 | 20.8% |
| 20 to 24 Minutes | 568 | 16.3% |
| 25 to 29 Minutes | 245 | 7.0% |
| 30 to 34 Minutes | 354 | 10.1% |
| 35 to 39 Minutes | 64 | 1.8% |
| 40 to 44 Minutes | 76 | 2.2% |
| 45 to 59 Minutes | 531 | 15.2% |
| 60 to 89 Minutes | 123 | 3.5% |
| 90 or more Minutes | 122 | 3.5% |
Commute Time by Sex in Barrington borough
The most common commute times in Barrington borough are 15 to 19 minutes (447 commuters, 24.6%) for males and 45 to 59 minutes (280 commuters, 16.7%) for females.
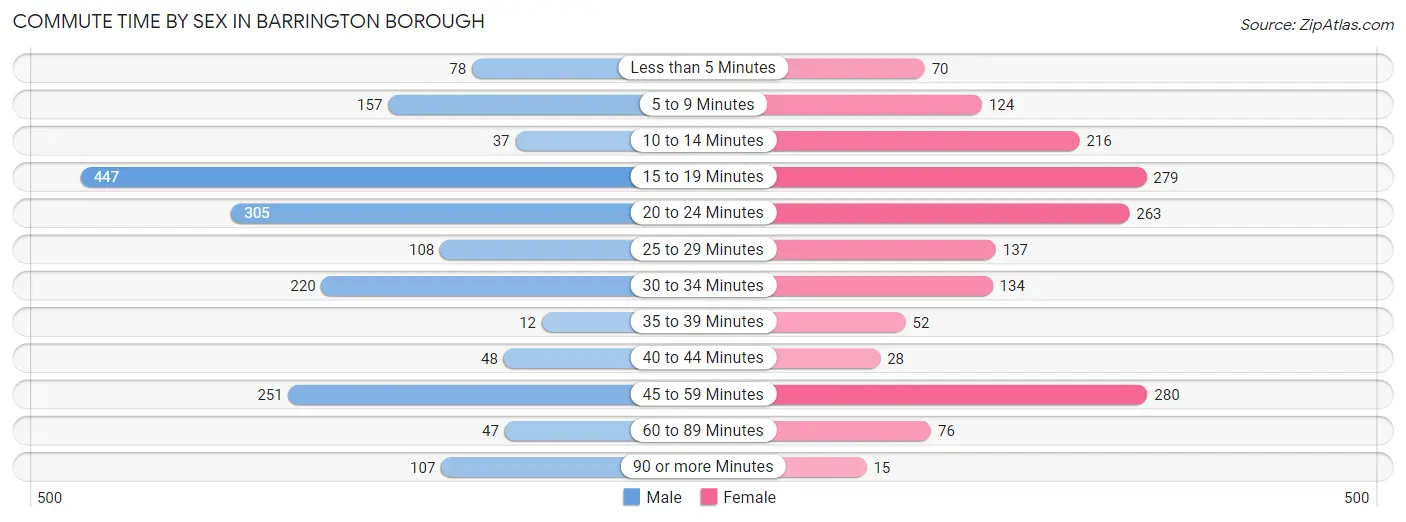
| Commute Time | Male | Female |
| Less than 5 Minutes | 78 (4.3%) | 70 (4.2%) |
| 5 to 9 Minutes | 157 (8.6%) | 124 (7.4%) |
| 10 to 14 Minutes | 37 (2.0%) | 216 (12.9%) |
| 15 to 19 Minutes | 447 (24.6%) | 279 (16.7%) |
| 20 to 24 Minutes | 305 (16.8%) | 263 (15.7%) |
| 25 to 29 Minutes | 108 (5.9%) | 137 (8.2%) |
| 30 to 34 Minutes | 220 (12.1%) | 134 (8.0%) |
| 35 to 39 Minutes | 12 (0.7%) | 52 (3.1%) |
| 40 to 44 Minutes | 48 (2.6%) | 28 (1.7%) |
| 45 to 59 Minutes | 251 (13.8%) | 280 (16.7%) |
| 60 to 89 Minutes | 47 (2.6%) | 76 (4.5%) |
| 90 or more Minutes | 107 (5.9%) | 15 (0.9%) |
Time of Departure to Work by Sex in Barrington borough
The most frequent times of departure to work in Barrington borough are 7:30 AM to 7:59 AM (418, 23.0%) for males and 8:30 AM to 8:59 AM (263, 15.7%) for females.
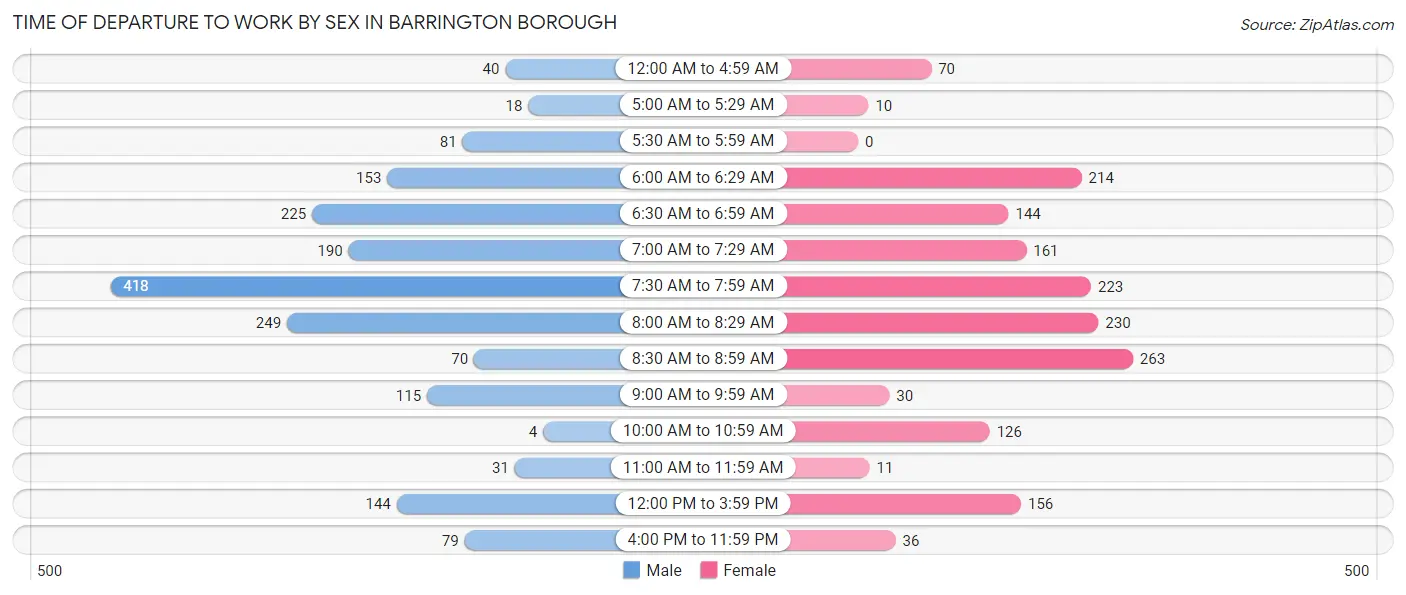
| Time of Departure | Male | Female |
| 12:00 AM to 4:59 AM | 40 (2.2%) | 70 (4.2%) |
| 5:00 AM to 5:29 AM | 18 (1.0%) | 10 (0.6%) |
| 5:30 AM to 5:59 AM | 81 (4.5%) | 0 (0.0%) |
| 6:00 AM to 6:29 AM | 153 (8.4%) | 214 (12.8%) |
| 6:30 AM to 6:59 AM | 225 (12.4%) | 144 (8.6%) |
| 7:00 AM to 7:29 AM | 190 (10.5%) | 161 (9.6%) |
| 7:30 AM to 7:59 AM | 418 (23.0%) | 223 (13.3%) |
| 8:00 AM to 8:29 AM | 249 (13.7%) | 230 (13.7%) |
| 8:30 AM to 8:59 AM | 70 (3.8%) | 263 (15.7%) |
| 9:00 AM to 9:59 AM | 115 (6.3%) | 30 (1.8%) |
| 10:00 AM to 10:59 AM | 4 (0.2%) | 126 (7.5%) |
| 11:00 AM to 11:59 AM | 31 (1.7%) | 11 (0.7%) |
| 12:00 PM to 3:59 PM | 144 (7.9%) | 156 (9.3%) |
| 4:00 PM to 11:59 PM | 79 (4.3%) | 36 (2.1%) |
| Total | 1,817 (100.0%) | 1,674 (100.0%) |
Housing Occupancy in Barrington borough
Occupancy by Ownership in Barrington borough
Of the total 3,377 dwellings in Barrington borough, owner-occupied units account for 1,822 (53.9%), while renter-occupied units make up 1,555 (46.1%).
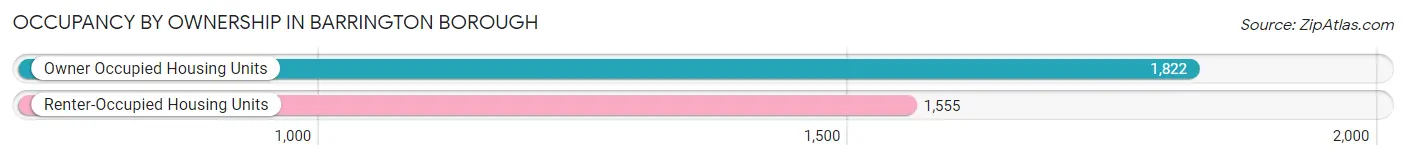
| Occupancy | # Housing Units | % Housing Units |
| Owner Occupied Housing Units | 1,822 | 53.9% |
| Renter-Occupied Housing Units | 1,555 | 46.1% |
| Total Occupied Housing Units | 3,377 | 100.0% |
Occupancy by Household Size in Barrington borough
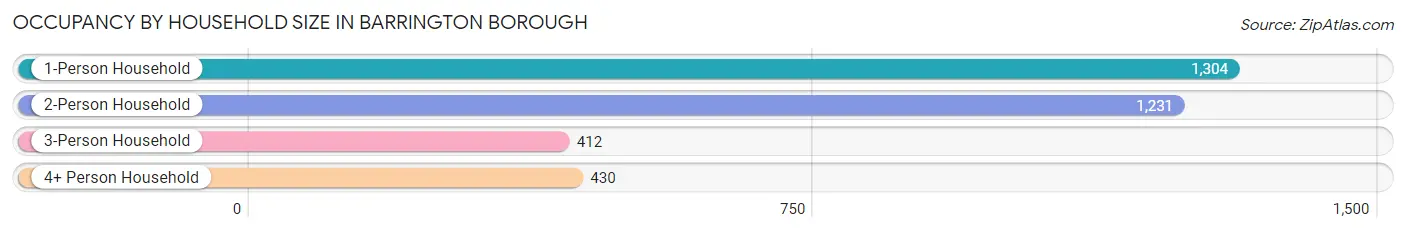
| Household Size | # Housing Units | % Housing Units |
| 1-Person Household | 1,304 | 38.6% |
| 2-Person Household | 1,231 | 36.4% |
| 3-Person Household | 412 | 12.2% |
| 4+ Person Household | 430 | 12.7% |
| Total Housing Units | 3,377 | 100.0% |
Occupancy by Ownership by Household Size in Barrington borough
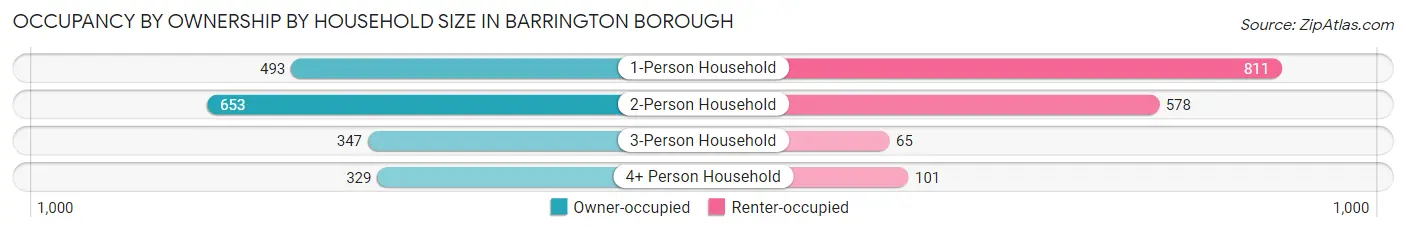
| Household Size | Owner-occupied | Renter-occupied |
| 1-Person Household | 493 (37.8%) | 811 (62.2%) |
| 2-Person Household | 653 (53.0%) | 578 (46.9%) |
| 3-Person Household | 347 (84.2%) | 65 (15.8%) |
| 4+ Person Household | 329 (76.5%) | 101 (23.5%) |
| Total Housing Units | 1,822 (53.9%) | 1,555 (46.1%) |
Occupancy by Educational Attainment in Barrington borough
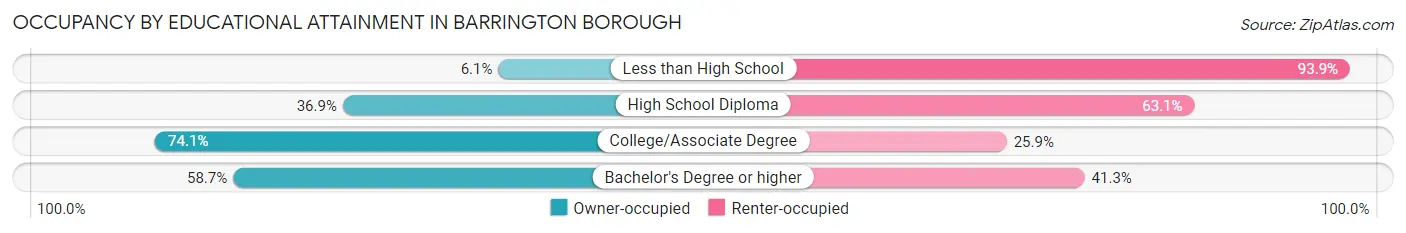
| Household Size | Owner-occupied | Renter-occupied |
| Less than High School | 9 (6.1%) | 139 (93.9%) |
| High School Diploma | 353 (36.9%) | 603 (63.1%) |
| College/Associate Degree | 607 (74.1%) | 212 (25.9%) |
| Bachelor's Degree or higher | 853 (58.7%) | 601 (41.3%) |
Occupancy by Age of Householder in Barrington borough
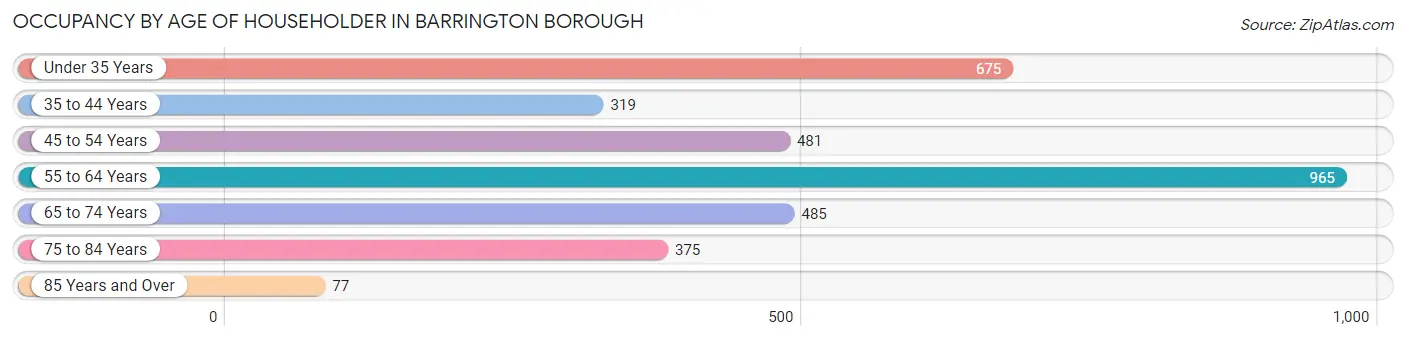
| Age Bracket | # Households | % Households |
| Under 35 Years | 675 | 20.0% |
| 35 to 44 Years | 319 | 9.5% |
| 45 to 54 Years | 481 | 14.2% |
| 55 to 64 Years | 965 | 28.6% |
| 65 to 74 Years | 485 | 14.4% |
| 75 to 84 Years | 375 | 11.1% |
| 85 Years and Over | 77 | 2.3% |
| Total | 3,377 | 100.0% |
Housing Finances in Barrington borough
Median Income by Occupancy in Barrington borough
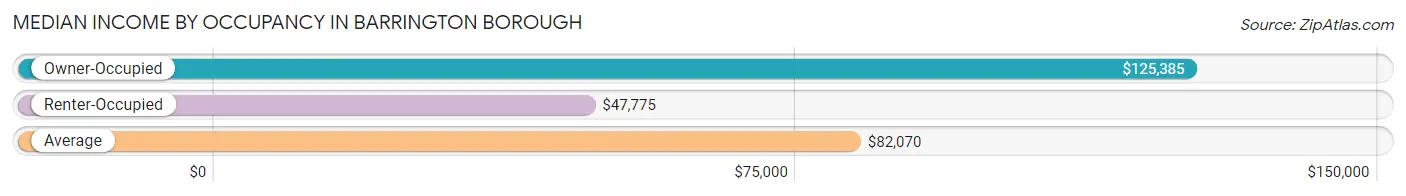
| Occupancy Type | # Households | Median Income |
| Owner-Occupied | 1,822 (53.9%) | $125,385 |
| Renter-Occupied | 1,555 (46.1%) | $47,775 |
| Average | 3,377 (100.0%) | $82,070 |
Occupancy by Householder Income Bracket in Barrington borough
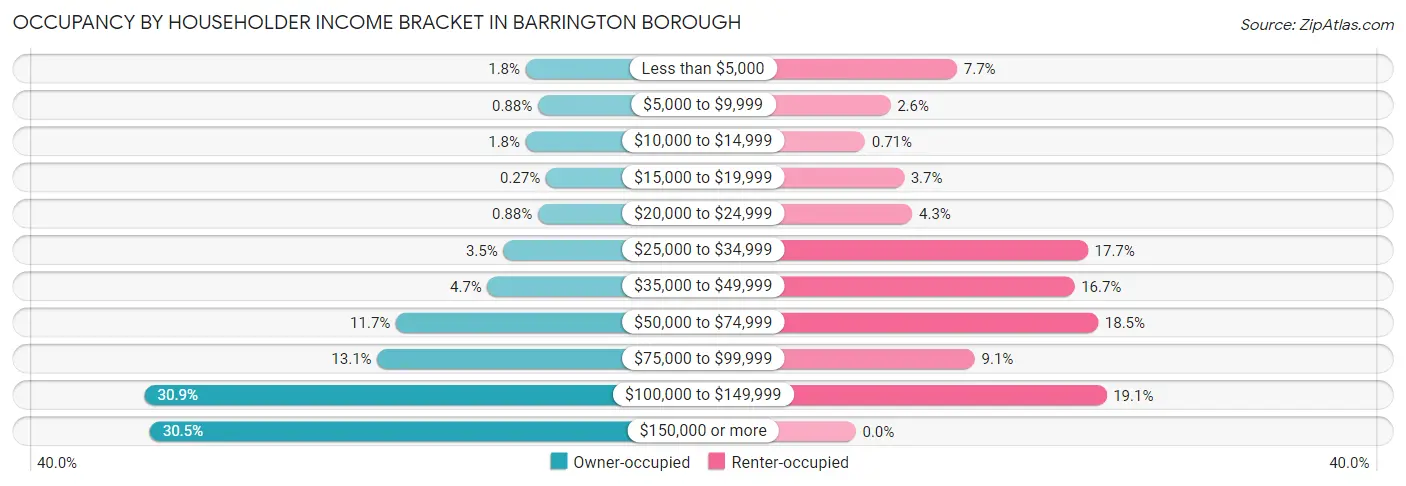
| Income Bracket | Owner-occupied | Renter-occupied |
| Less than $5,000 | 33 (1.8%) | 120 (7.7%) |
| $5,000 to $9,999 | 16 (0.9%) | 41 (2.6%) |
| $10,000 to $14,999 | 33 (1.8%) | 11 (0.7%) |
| $15,000 to $19,999 | 5 (0.3%) | 57 (3.7%) |
| $20,000 to $24,999 | 16 (0.9%) | 67 (4.3%) |
| $25,000 to $34,999 | 64 (3.5%) | 275 (17.7%) |
| $35,000 to $49,999 | 86 (4.7%) | 259 (16.7%) |
| $50,000 to $74,999 | 213 (11.7%) | 287 (18.5%) |
| $75,000 to $99,999 | 239 (13.1%) | 141 (9.1%) |
| $100,000 to $149,999 | 562 (30.8%) | 297 (19.1%) |
| $150,000 or more | 555 (30.5%) | 0 (0.0%) |
| Total | 1,822 (100.0%) | 1,555 (100.0%) |
Monthly Housing Cost Tiers in Barrington borough
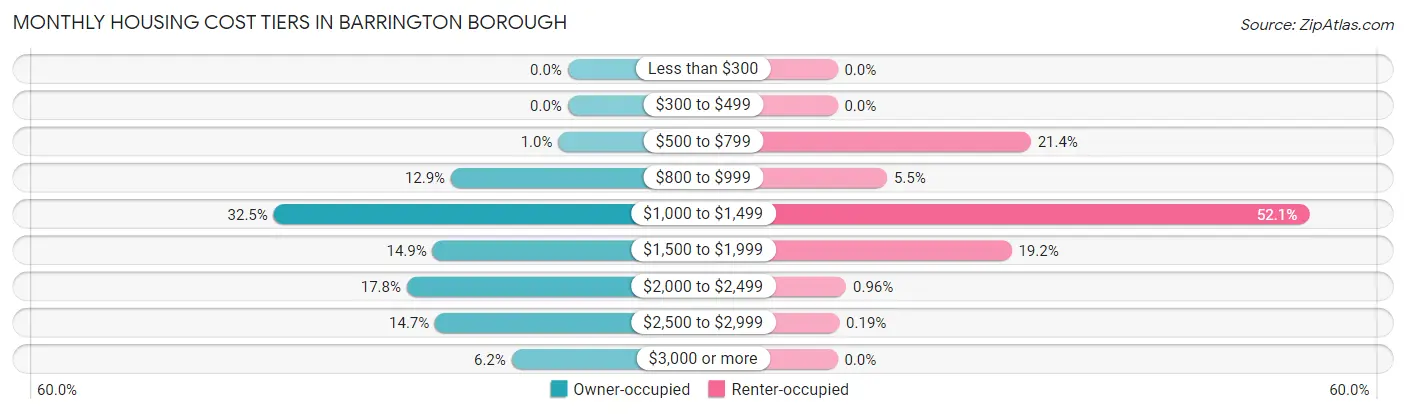
| Monthly Cost | Owner-occupied | Renter-occupied |
| Less than $300 | 0 (0.0%) | 0 (0.0%) |
| $300 to $499 | 0 (0.0%) | 0 (0.0%) |
| $500 to $799 | 19 (1.0%) | 332 (21.3%) |
| $800 to $999 | 235 (12.9%) | 85 (5.5%) |
| $1,000 to $1,499 | 592 (32.5%) | 810 (52.1%) |
| $1,500 to $1,999 | 272 (14.9%) | 299 (19.2%) |
| $2,000 to $2,499 | 324 (17.8%) | 15 (1.0%) |
| $2,500 to $2,999 | 267 (14.6%) | 3 (0.2%) |
| $3,000 or more | 113 (6.2%) | 0 (0.0%) |
| Total | 1,822 (100.0%) | 1,555 (100.0%) |
Physical Housing Characteristics in Barrington borough
Housing Structures in Barrington borough
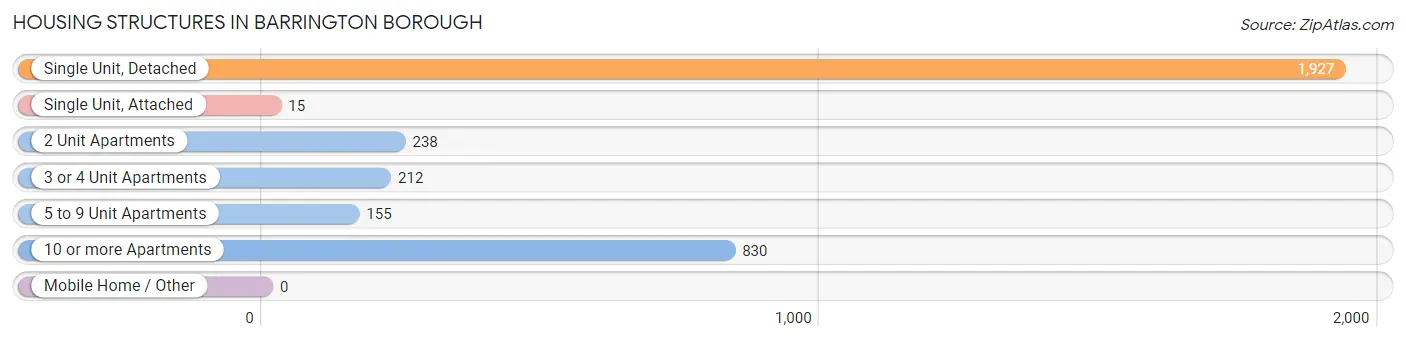
| Structure Type | # Housing Units | % Housing Units |
| Single Unit, Detached | 1,927 | 57.1% |
| Single Unit, Attached | 15 | 0.4% |
| 2 Unit Apartments | 238 | 7.0% |
| 3 or 4 Unit Apartments | 212 | 6.3% |
| 5 to 9 Unit Apartments | 155 | 4.6% |
| 10 or more Apartments | 830 | 24.6% |
| Mobile Home / Other | 0 | 0.0% |
| Total | 3,377 | 100.0% |
Housing Structures by Occupancy in Barrington borough
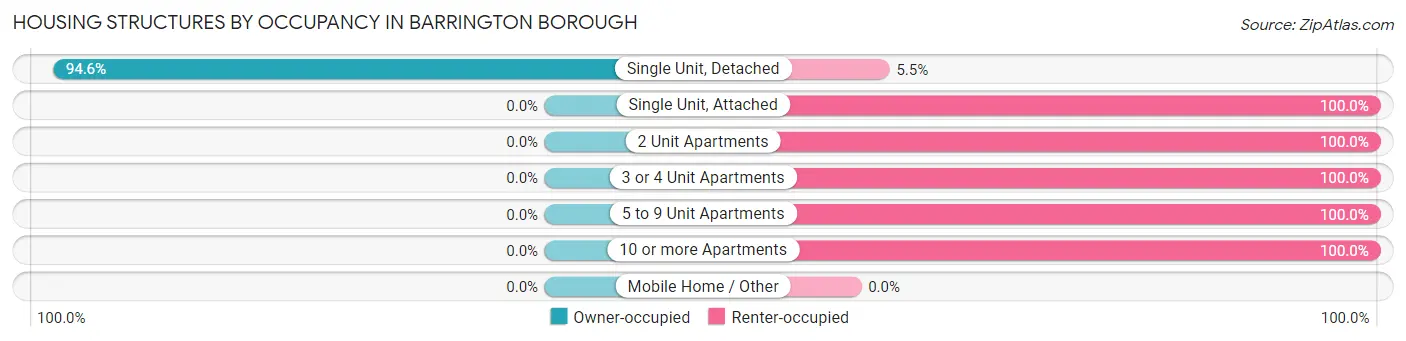
| Structure Type | Owner-occupied | Renter-occupied |
| Single Unit, Detached | 1,822 (94.6%) | 105 (5.4%) |
| Single Unit, Attached | 0 (0.0%) | 15 (100.0%) |
| 2 Unit Apartments | 0 (0.0%) | 238 (100.0%) |
| 3 or 4 Unit Apartments | 0 (0.0%) | 212 (100.0%) |
| 5 to 9 Unit Apartments | 0 (0.0%) | 155 (100.0%) |
| 10 or more Apartments | 0 (0.0%) | 830 (100.0%) |
| Mobile Home / Other | 0 (0.0%) | 0 (0.0%) |
| Total | 1,822 (53.9%) | 1,555 (46.1%) |
Housing Structures by Number of Rooms in Barrington borough
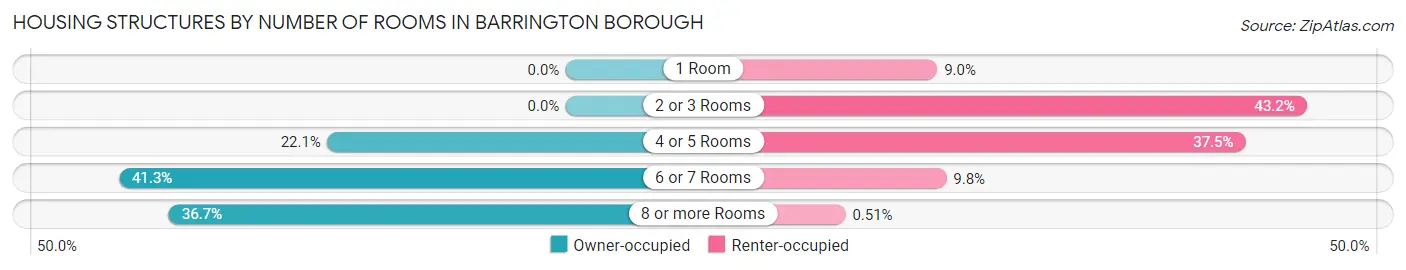
| Number of Rooms | Owner-occupied | Renter-occupied |
| 1 Room | 0 (0.0%) | 140 (9.0%) |
| 2 or 3 Rooms | 0 (0.0%) | 671 (43.1%) |
| 4 or 5 Rooms | 402 (22.1%) | 583 (37.5%) |
| 6 or 7 Rooms | 752 (41.3%) | 153 (9.8%) |
| 8 or more Rooms | 668 (36.7%) | 8 (0.5%) |
| Total | 1,822 (100.0%) | 1,555 (100.0%) |
Housing Structure by Heating Type in Barrington borough
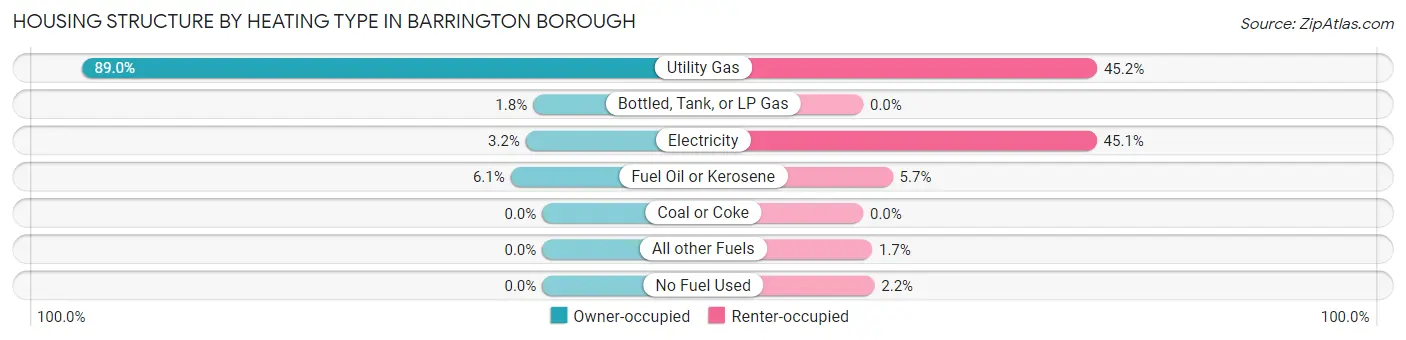
| Heating Type | Owner-occupied | Renter-occupied |
| Utility Gas | 1,621 (89.0%) | 703 (45.2%) |
| Bottled, Tank, or LP Gas | 32 (1.8%) | 0 (0.0%) |
| Electricity | 58 (3.2%) | 702 (45.1%) |
| Fuel Oil or Kerosene | 111 (6.1%) | 89 (5.7%) |
| Coal or Coke | 0 (0.0%) | 0 (0.0%) |
| All other Fuels | 0 (0.0%) | 27 (1.7%) |
| No Fuel Used | 0 (0.0%) | 34 (2.2%) |
| Total | 1,822 (100.0%) | 1,555 (100.0%) |
Household Vehicle Usage in Barrington borough
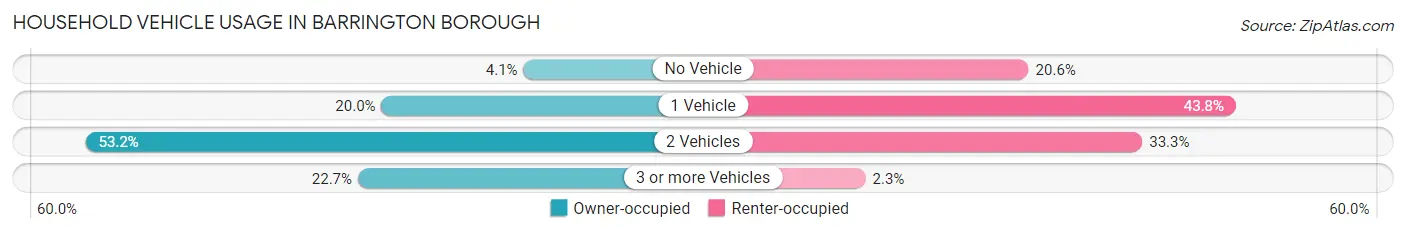
| Vehicles per Household | Owner-occupied | Renter-occupied |
| No Vehicle | 75 (4.1%) | 320 (20.6%) |
| 1 Vehicle | 365 (20.0%) | 681 (43.8%) |
| 2 Vehicles | 969 (53.2%) | 518 (33.3%) |
| 3 or more Vehicles | 413 (22.7%) | 36 (2.3%) |
| Total | 1,822 (100.0%) | 1,555 (100.0%) |
Real Estate & Mortgages in Barrington borough
Real Estate and Mortgage Overview in Barrington borough
| Characteristic | Without Mortgage | With Mortgage |
| Housing Units | 844 | 978 |
| Median Property Value | $217,700 | $240,100 |
| Median Household Income | $89,100 | $349 |
| Monthly Housing Costs | $1,105 | $113 |
| Real Estate Taxes | $8,490 | $11 |
Property Value by Mortgage Status in Barrington borough
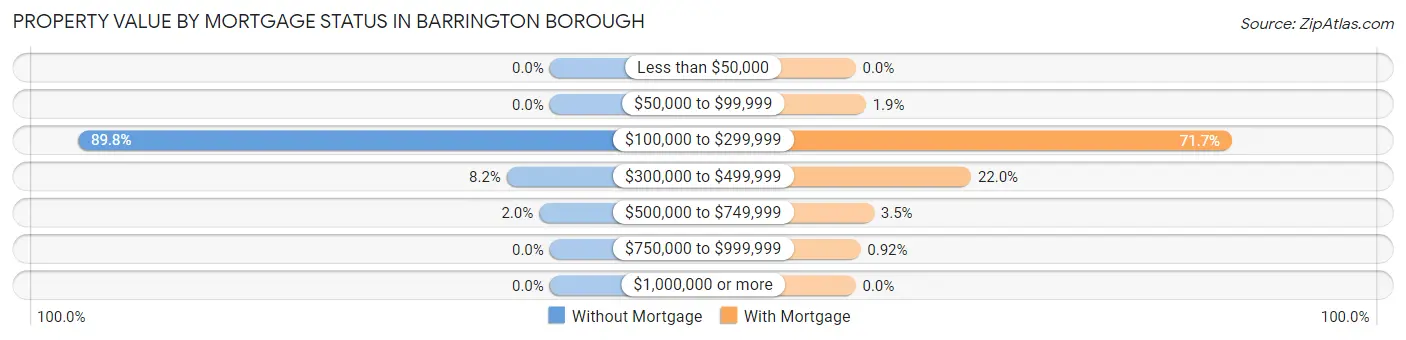
| Property Value | Without Mortgage | With Mortgage |
| Less than $50,000 | 0 (0.0%) | 0 (0.0%) |
| $50,000 to $99,999 | 0 (0.0%) | 19 (1.9%) |
| $100,000 to $299,999 | 758 (89.8%) | 701 (71.7%) |
| $300,000 to $499,999 | 69 (8.2%) | 215 (22.0%) |
| $500,000 to $749,999 | 17 (2.0%) | 34 (3.5%) |
| $750,000 to $999,999 | 0 (0.0%) | 9 (0.9%) |
| $1,000,000 or more | 0 (0.0%) | 0 (0.0%) |
| Total | 844 (100.0%) | 978 (100.0%) |
Household Income by Mortgage Status in Barrington borough
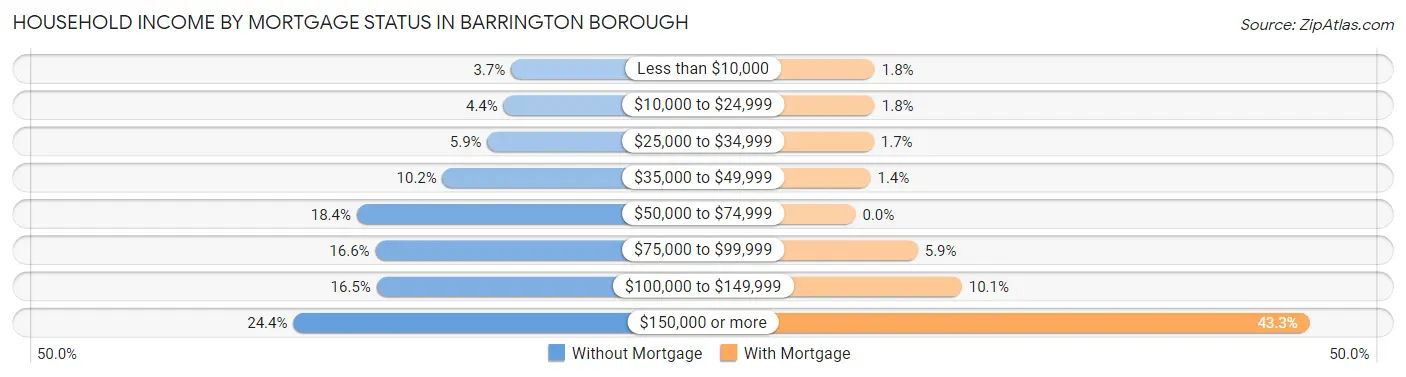
| Household Income | Without Mortgage | With Mortgage |
| Less than $10,000 | 31 (3.7%) | 18 (1.8%) |
| $10,000 to $24,999 | 37 (4.4%) | 18 (1.8%) |
| $25,000 to $34,999 | 50 (5.9%) | 17 (1.7%) |
| $35,000 to $49,999 | 86 (10.2%) | 14 (1.4%) |
| $50,000 to $74,999 | 155 (18.4%) | 0 (0.0%) |
| $75,000 to $99,999 | 140 (16.6%) | 58 (5.9%) |
| $100,000 to $149,999 | 139 (16.5%) | 99 (10.1%) |
| $150,000 or more | 206 (24.4%) | 423 (43.2%) |
| Total | 844 (100.0%) | 978 (100.0%) |
Property Value to Household Income Ratio in Barrington borough
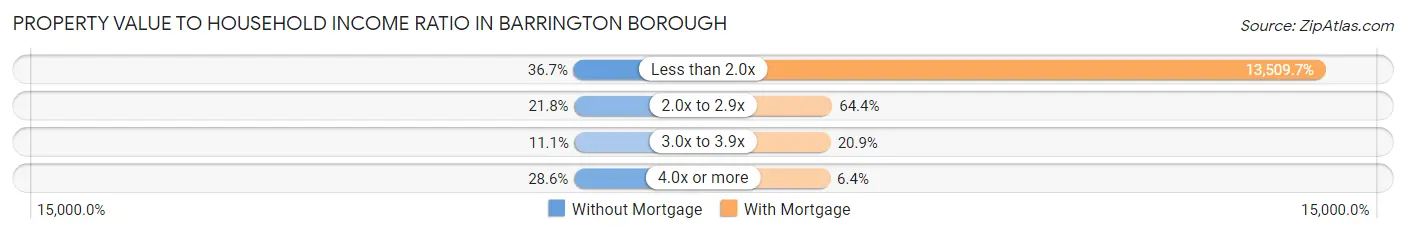
| Value-to-Income Ratio | Without Mortgage | With Mortgage |
| Less than 2.0x | 310 (36.7%) | 132,125 (13,509.7%) |
| 2.0x to 2.9x | 184 (21.8%) | 630 (64.4%) |
| 3.0x to 3.9x | 94 (11.1%) | 204 (20.9%) |
| 4.0x or more | 241 (28.5%) | 63 (6.4%) |
| Total | 844 (100.0%) | 978 (100.0%) |
Real Estate Taxes by Mortgage Status in Barrington borough
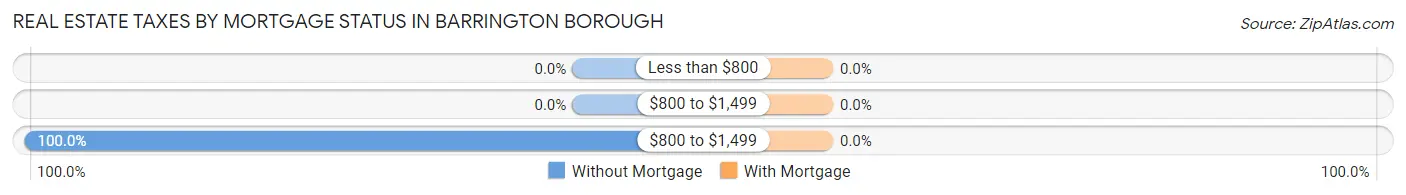
| Property Taxes | Without Mortgage | With Mortgage |
| Less than $800 | 0 (0.0%) | 0 (0.0%) |
| $800 to $1,499 | 0 (0.0%) | 0 (0.0%) |
| $800 to $1,499 | 844 (100.0%) | 0 (0.0%) |
| Total | 844 (100.0%) | 978 (100.0%) |
Health & Disability in Barrington borough
Health Insurance Coverage by Age in Barrington borough
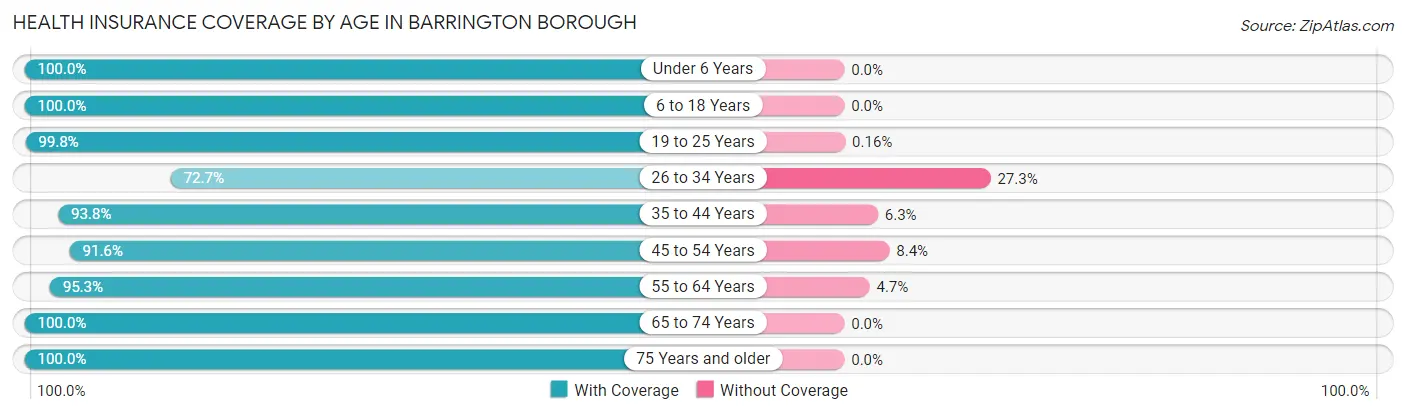
| Age Bracket | With Coverage | Without Coverage |
| Under 6 Years | 477 (100.0%) | 0 (0.0%) |
| 6 to 18 Years | 589 (100.0%) | 0 (0.0%) |
| 19 to 25 Years | 613 (99.8%) | 1 (0.2%) |
| 26 to 34 Years | 798 (72.7%) | 299 (27.3%) |
| 35 to 44 Years | 660 (93.8%) | 44 (6.2%) |
| 45 to 54 Years | 905 (91.6%) | 83 (8.4%) |
| 55 to 64 Years | 1,215 (95.3%) | 60 (4.7%) |
| 65 to 74 Years | 691 (100.0%) | 0 (0.0%) |
| 75 Years and older | 587 (100.0%) | 0 (0.0%) |
| Total | 6,535 (93.1%) | 487 (6.9%) |
Health Insurance Coverage by Citizenship Status in Barrington borough
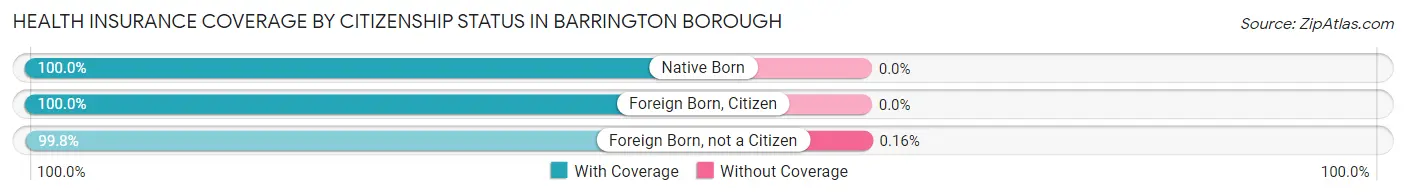
| Citizenship Status | With Coverage | Without Coverage |
| Native Born | 477 (100.0%) | 0 (0.0%) |
| Foreign Born, Citizen | 589 (100.0%) | 0 (0.0%) |
| Foreign Born, not a Citizen | 613 (99.8%) | 1 (0.2%) |
Health Insurance Coverage by Household Income in Barrington borough
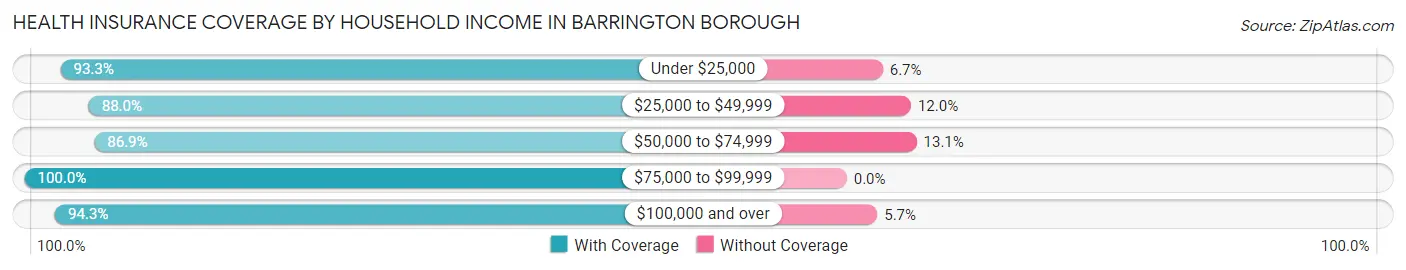
| Household Income | With Coverage | Without Coverage |
| Under $25,000 | 484 (93.3%) | 35 (6.7%) |
| $25,000 to $49,999 | 709 (88.0%) | 97 (12.0%) |
| $50,000 to $74,999 | 844 (86.9%) | 127 (13.1%) |
| $75,000 to $99,999 | 747 (100.0%) | 0 (0.0%) |
| $100,000 and over | 3,748 (94.3%) | 227 (5.7%) |
Public vs Private Health Insurance Coverage by Age in Barrington borough
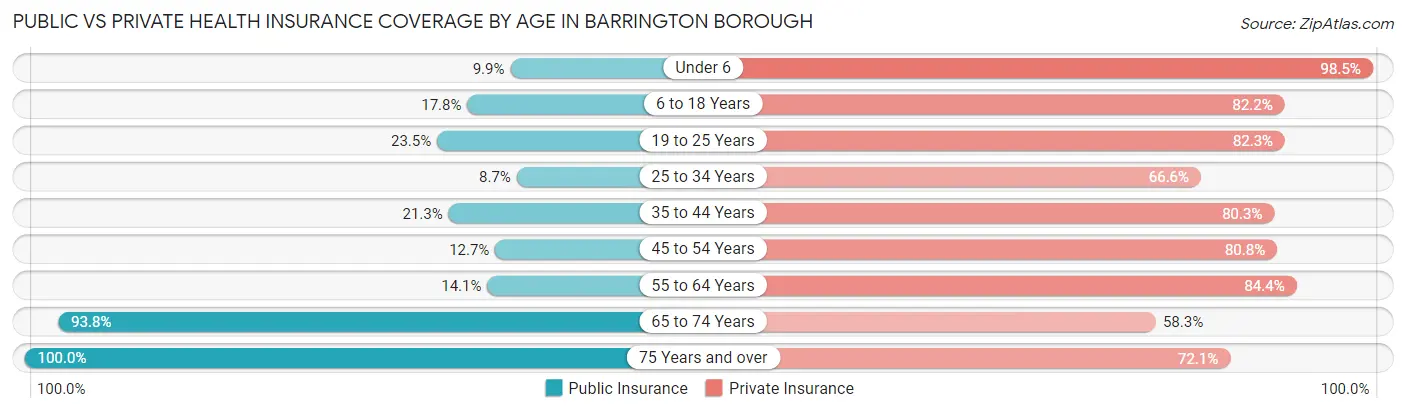
| Age Bracket | Public Insurance | Private Insurance |
| Under 6 | 47 (9.9%) | 470 (98.5%) |
| 6 to 18 Years | 105 (17.8%) | 484 (82.2%) |
| 19 to 25 Years | 144 (23.4%) | 505 (82.3%) |
| 25 to 34 Years | 95 (8.7%) | 731 (66.6%) |
| 35 to 44 Years | 150 (21.3%) | 565 (80.3%) |
| 45 to 54 Years | 125 (12.7%) | 798 (80.8%) |
| 55 to 64 Years | 180 (14.1%) | 1,076 (84.4%) |
| 65 to 74 Years | 648 (93.8%) | 403 (58.3%) |
| 75 Years and over | 587 (100.0%) | 423 (72.1%) |
| Total | 2,081 (29.6%) | 5,455 (77.7%) |
Disability Status by Sex by Age in Barrington borough
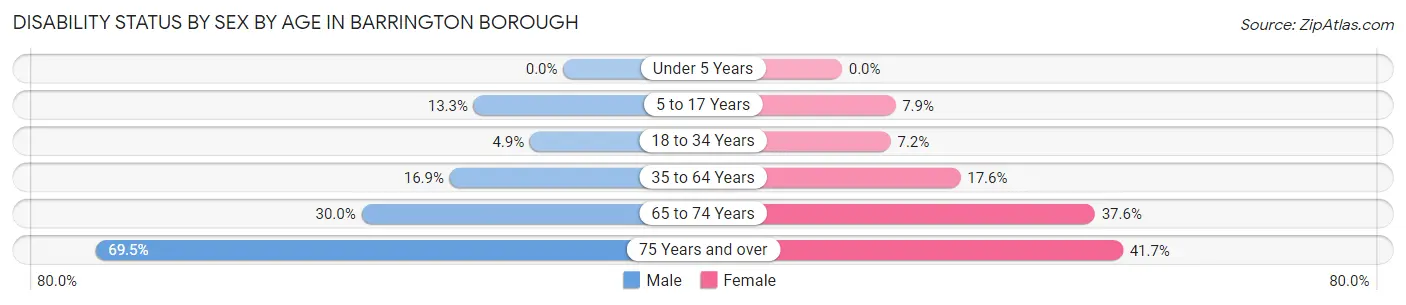
| Age Bracket | Male | Female |
| Under 5 Years | 0 (0.0%) | 0 (0.0%) |
| 5 to 17 Years | 54 (13.3%) | 18 (7.9%) |
| 18 to 34 Years | 44 (4.9%) | 61 (7.2%) |
| 35 to 64 Years | 257 (16.9%) | 254 (17.6%) |
| 65 to 74 Years | 89 (30.0%) | 148 (37.6%) |
| 75 Years and over | 278 (69.5%) | 78 (41.7%) |
Disability Class by Sex by Age in Barrington borough
Disability Class: Hearing Difficulty
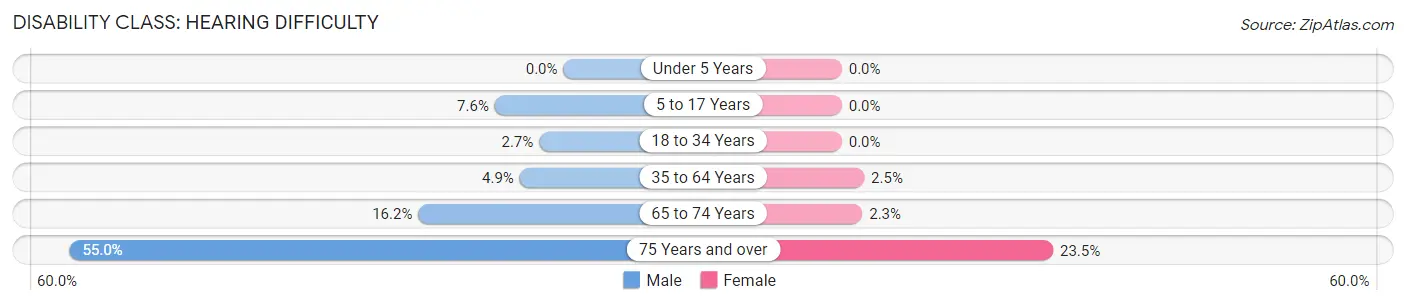
| Age Bracket | Male | Female |
| Under 5 Years | 0 (0.0%) | 0 (0.0%) |
| 5 to 17 Years | 31 (7.6%) | 0 (0.0%) |
| 18 to 34 Years | 24 (2.7%) | 0 (0.0%) |
| 35 to 64 Years | 74 (4.9%) | 36 (2.5%) |
| 65 to 74 Years | 48 (16.2%) | 9 (2.3%) |
| 75 Years and over | 220 (55.0%) | 44 (23.5%) |
Disability Class: Vision Difficulty
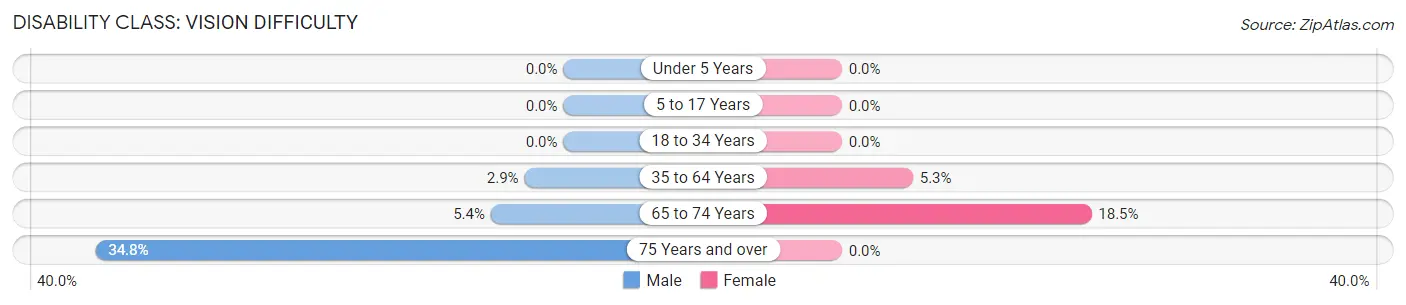
| Age Bracket | Male | Female |
| Under 5 Years | 0 (0.0%) | 0 (0.0%) |
| 5 to 17 Years | 0 (0.0%) | 0 (0.0%) |
| 18 to 34 Years | 0 (0.0%) | 0 (0.0%) |
| 35 to 64 Years | 44 (2.9%) | 76 (5.3%) |
| 65 to 74 Years | 16 (5.4%) | 73 (18.5%) |
| 75 Years and over | 139 (34.7%) | 0 (0.0%) |
Disability Class: Cognitive Difficulty
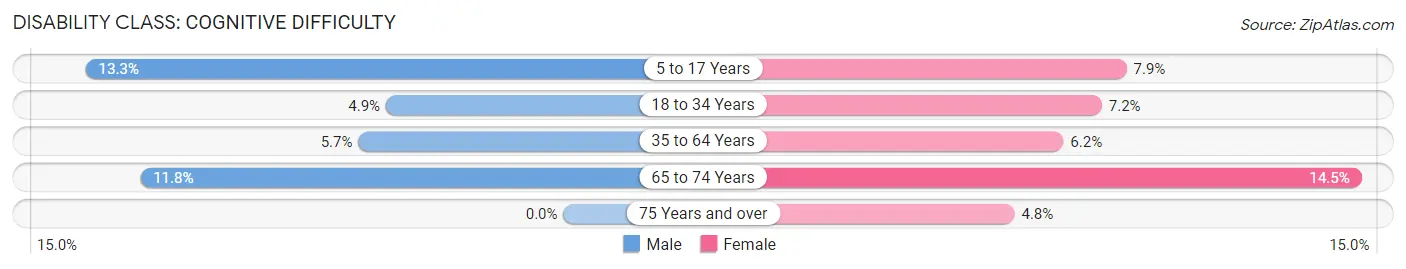
| Age Bracket | Male | Female |
| 5 to 17 Years | 54 (13.3%) | 18 (7.9%) |
| 18 to 34 Years | 44 (4.9%) | 61 (7.2%) |
| 35 to 64 Years | 87 (5.7%) | 89 (6.2%) |
| 65 to 74 Years | 35 (11.8%) | 57 (14.5%) |
| 75 Years and over | 0 (0.0%) | 9 (4.8%) |
Disability Class: Ambulatory Difficulty
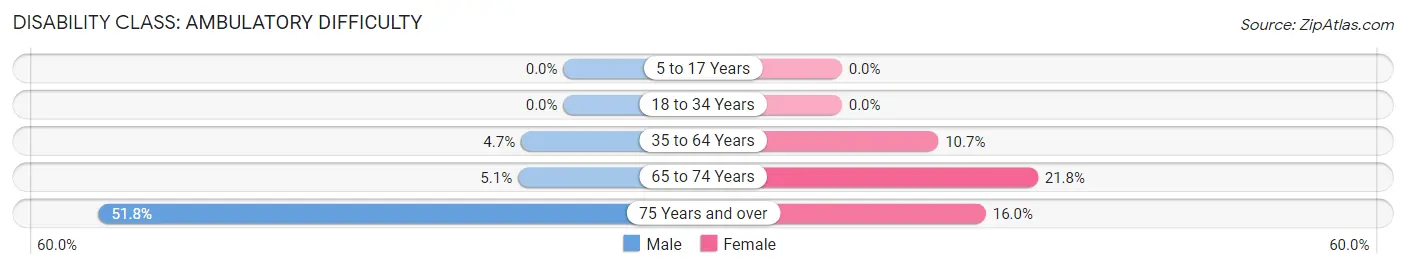
| Age Bracket | Male | Female |
| 5 to 17 Years | 0 (0.0%) | 0 (0.0%) |
| 18 to 34 Years | 0 (0.0%) | 0 (0.0%) |
| 35 to 64 Years | 72 (4.7%) | 155 (10.7%) |
| 65 to 74 Years | 15 (5.1%) | 86 (21.8%) |
| 75 Years and over | 207 (51.7%) | 30 (16.0%) |
Disability Class: Self-Care Difficulty
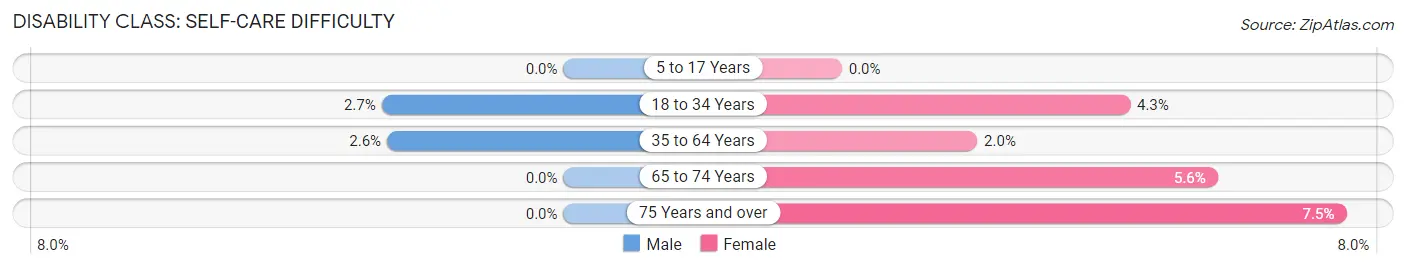
| Age Bracket | Male | Female |
| 5 to 17 Years | 0 (0.0%) | 0 (0.0%) |
| 18 to 34 Years | 24 (2.7%) | 36 (4.3%) |
| 35 to 64 Years | 40 (2.6%) | 29 (2.0%) |
| 65 to 74 Years | 0 (0.0%) | 22 (5.6%) |
| 75 Years and over | 0 (0.0%) | 14 (7.5%) |
Technology Access in Barrington borough
Computing Device Access in Barrington borough
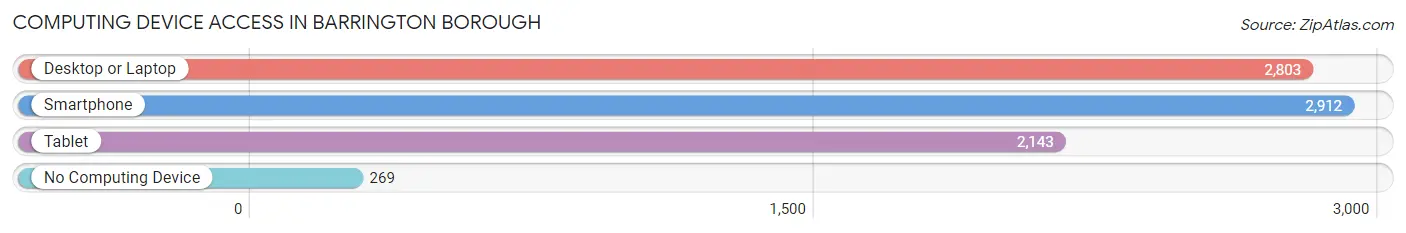
| Device Type | # Households | % Households |
| Desktop or Laptop | 2,803 | 83.0% |
| Smartphone | 2,912 | 86.2% |
| Tablet | 2,143 | 63.5% |
| No Computing Device | 269 | 8.0% |
| Total | 3,377 | 100.0% |
Internet Access in Barrington borough
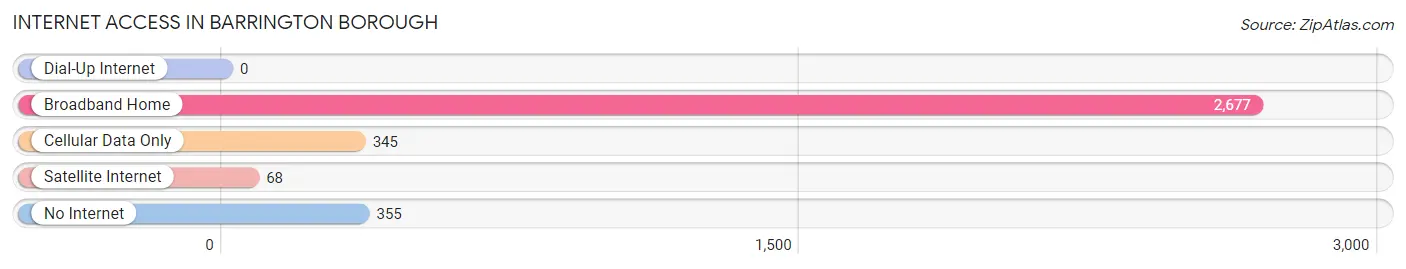
| Internet Type | # Households | % Households |
| Dial-Up Internet | 0 | 0.0% |
| Broadband Home | 2,677 | 79.3% |
| Cellular Data Only | 345 | 10.2% |
| Satellite Internet | 68 | 2.0% |
| No Internet | 355 | 10.5% |
| Total | 3,377 | 100.0% |
Barrington borough Summary
Barrington Borough is a small borough located in Camden County, New Jersey. It is situated on the banks of the Cooper River and is bordered by Haddon Township, Haddon Heights, and Lawnside. The borough was incorporated in 1917 and has a population of approximately 4,000 people.
History
Barrington Borough was originally part of Gloucester Township, which was established in 1695. The area was first settled in the late 1600s by English and Dutch settlers. The area was known as “Barrington” after the Barrington family, who owned a large tract of land in the area. The Barrington family was prominent in the area and owned a large amount of land in the area.
In the late 1700s, the area was divided into two townships, Gloucester and Stockton. In 1844, the two townships were merged to form the Borough of Barrington. The borough was named after the Barrington family and was incorporated in 1917.
Geography
Barrington Borough is located in Camden County, New Jersey. It is situated on the banks of the Cooper River and is bordered by Haddon Township, Haddon Heights, and Lawnside. The borough has a total area of 1.2 square miles, all of which is land.
The borough is located in the Atlantic Coastal Plain and is characterized by flat terrain. The Cooper River runs through the borough and is a popular spot for fishing and boating. The borough is also home to several parks, including Barrington Park, which features a playground, basketball court, and picnic area.
Economy
Barrington Borough has a diverse economy that is largely based on retail, manufacturing, and services. The borough is home to several small businesses, including restaurants, retail stores, and professional services. The borough is also home to several large employers, including the Barrington School District, Barrington Medical Center, and Barrington Bank.
The borough is also home to several industrial parks, which are home to a variety of businesses, including manufacturing, warehousing, and distribution. The borough is also home to several corporate headquarters, including the headquarters of the Barrington Group, a real estate development company.
Demographics
As of the 2010 census, Barrington Borough had a population of 4,000 people. The racial makeup of the borough was 79.3% White, 11.2% African American, 0.3% Native American, 2.2% Asian, and 6.9% from other races. The median household income was $60,000 and the median family income was $68,000.
The borough is home to a diverse population, with a variety of ethnic backgrounds. The borough is also home to a large number of immigrants, with the largest groups being from Mexico, India, and the Philippines.
Conclusion
Barrington Borough is a small borough located in Camden County, New Jersey. It is situated on the banks of the Cooper River and is bordered by Haddon Township, Haddon Heights, and Lawnside. The borough was incorporated in 1917 and has a population of approximately 4,000 people. The borough has a diverse economy that is largely based on retail, manufacturing, and services. The borough is also home to a diverse population, with a variety of ethnic backgrounds.
Common Questions
What is Per Capita Income in Barrington borough?
Per Capita income in Barrington borough is $49,735.
What is the Median Family Income in Barrington borough?
Median Family Income in Barrington borough is $118,105.
What is the Median Household income in Barrington borough?
Median Household Income in Barrington borough is $82,070.
What is Income or Wage Gap in Barrington borough?
Income or Wage Gap in Barrington borough is 0.9%.
Women in Barrington borough earn 99.1 cents for every dollar earned by a man.
What is Inequality or Gini Index in Barrington borough?
Inequality or Gini Index in Barrington borough is 0.44.
What is the Total Population of Barrington borough?
Total Population of Barrington borough is 7,022.
What is the Total Male Population of Barrington borough?
Total Male Population of Barrington borough is 3,694.
What is the Total Female Population of Barrington borough?
Total Female Population of Barrington borough is 3,328.
What is the Ratio of Males per 100 Females in Barrington borough?
There are 111.00 Males per 100 Females in Barrington borough.
What is the Ratio of Females per 100 Males in Barrington borough?
There are 90.09 Females per 100 Males in Barrington borough.
What is the Median Population Age in Barrington borough?
Median Population Age in Barrington borough is 45.5 Years.
What is the Average Family Size in Barrington borough
Average Family Size in Barrington borough is 2.8 People.
What is the Average Household Size in Barrington borough
Average Household Size in Barrington borough is 2.1 People.
How Large is the Labor Force in Barrington borough?
There are 4,408 People in the Labor Forcein in Barrington borough.
What is the Percentage of People in the Labor Force in Barrington borough?
72.5% of People are in the Labor Force in Barrington borough.
What is the Unemployment Rate in Barrington borough?
Unemployment Rate in Barrington borough is 6.8%.