Demarest borough, NJ Map & Demographics
Demarest borough Overview
$91,523
PER CAPITA INCOME
$200,104
AVG FAMILY INCOME
$165,119
AVG HOUSEHOLD INCOME
60.4%
WAGE / INCOME GAP [ % ]
39.6¢/ $1
WAGE / INCOME GAP [ $ ]
0.47
INEQUALITY / GINI INDEX
4,930
TOTAL POPULATION
2,457
MALE POPULATION
2,473
FEMALE POPULATION
99.35
MALES / 100 FEMALES
100.65
FEMALES / 100 MALES
45.6
MEDIAN AGE
3.1
AVG FAMILY SIZE
2.9
AVG HOUSEHOLD SIZE
2,329
LABOR FORCE [ PEOPLE ]
64.0%
PERCENT IN LABOR FORCE
4.8%
UNEMPLOYMENT RATE
Income in Demarest borough
Income Overview in Demarest borough
Per Capita Income in Demarest borough is $91,523, while median incomes of families and households are $200,104 and $165,119 respectively.
| Characteristic | Number | Measure |
| Per Capita Income | 4,930 | $91,523 |
| Median Family Income | 1,483 | $200,104 |
| Mean Family Income | 1,483 | $284,007 |
| Median Household Income | 1,690 | $165,119 |
| Mean Household Income | 1,690 | $264,603 |
| Income Deficit | 1,483 | $0 |
| Wage / Income Gap (%) | 4,930 | 60.38% |
| Wage / Income Gap ($) | 4,930 | 39.62¢ per $1 |
| Gini / Inequality Index | 4,930 | 0.47 |
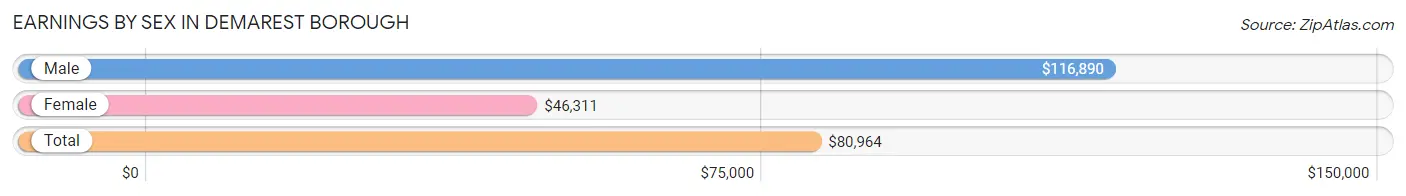
Earnings by Sex in Demarest borough
Average Earnings in Demarest borough are $80,964, $116,890 for men and $46,311 for women, a difference of 60.4%.
| Sex | Number | Average Earnings |
| Male | 1,404 (57.3%) | $116,890 |
| Female | 1,047 (42.7%) | $46,311 |
| Total | 2,451 (100.0%) | $80,964 |
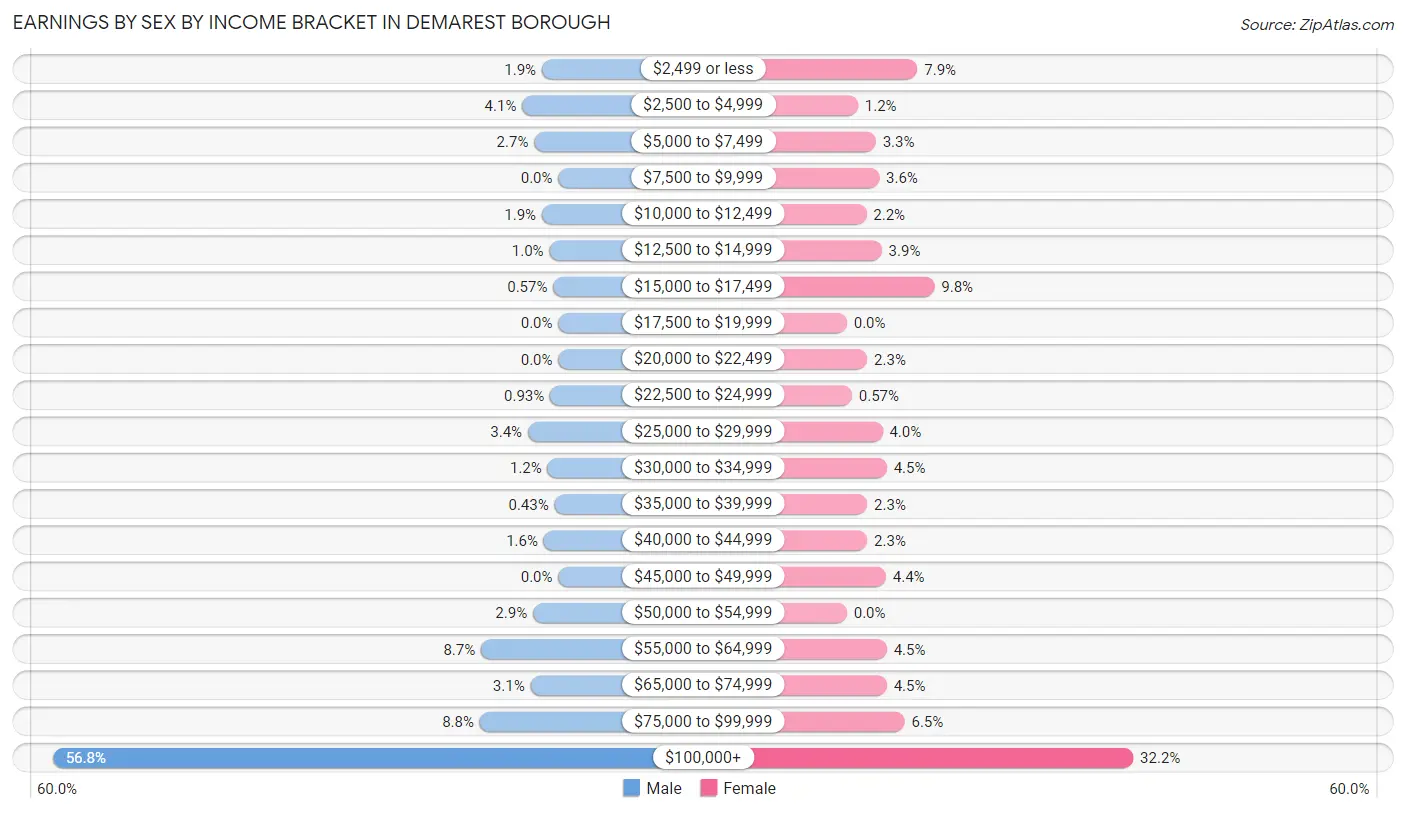
Earnings by Sex by Income Bracket in Demarest borough
The most common earnings brackets in Demarest borough are $100,000+ for men (798 | 56.8%) and $100,000+ for women (337 | 32.2%).
| Income | Male | Female |
| $2,499 or less | 26 (1.8%) | 83 (7.9%) |
| $2,500 to $4,999 | 57 (4.1%) | 13 (1.2%) |
| $5,000 to $7,499 | 38 (2.7%) | 34 (3.3%) |
| $7,500 to $9,999 | 0 (0.0%) | 38 (3.6%) |
| $10,000 to $12,499 | 26 (1.8%) | 23 (2.2%) |
| $12,500 to $14,999 | 14 (1.0%) | 41 (3.9%) |
| $15,000 to $17,499 | 8 (0.6%) | 103 (9.8%) |
| $17,500 to $19,999 | 0 (0.0%) | 0 (0.0%) |
| $20,000 to $22,499 | 0 (0.0%) | 24 (2.3%) |
| $22,500 to $24,999 | 13 (0.9%) | 6 (0.6%) |
| $25,000 to $29,999 | 48 (3.4%) | 42 (4.0%) |
| $30,000 to $34,999 | 17 (1.2%) | 47 (4.5%) |
| $35,000 to $39,999 | 6 (0.4%) | 24 (2.3%) |
| $40,000 to $44,999 | 23 (1.6%) | 24 (2.3%) |
| $45,000 to $49,999 | 0 (0.0%) | 46 (4.4%) |
| $50,000 to $54,999 | 40 (2.9%) | 0 (0.0%) |
| $55,000 to $64,999 | 122 (8.7%) | 47 (4.5%) |
| $65,000 to $74,999 | 44 (3.1%) | 47 (4.5%) |
| $75,000 to $99,999 | 124 (8.8%) | 68 (6.5%) |
| $100,000+ | 798 (56.8%) | 337 (32.2%) |
| Total | 1,404 (100.0%) | 1,047 (100.0%) |
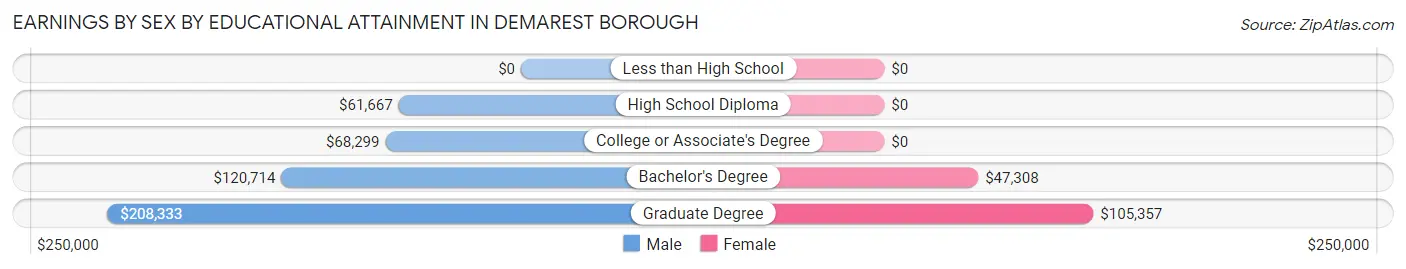
Earnings by Sex by Educational Attainment in Demarest borough
Average earnings in Demarest borough are $118,571 for men and $63,077 for women, a difference of 46.8%. Men with an educational attainment of graduate degree enjoy the highest average annual earnings of $208,333, while those with high school diploma education earn the least with $61,667. Women with an educational attainment of graduate degree earn the most with the average annual earnings of $105,357, while those with bachelor's degree education have the smallest earnings of $47,308.
| Educational Attainment | Male Income | Female Income |
| Less than High School | - | - |
| High School Diploma | $61,667 | $0 |
| College or Associate's Degree | $68,299 | $0 |
| Bachelor's Degree | $120,714 | $47,308 |
| Graduate Degree | $208,333 | $105,357 |
| Total | $118,571 | $63,077 |
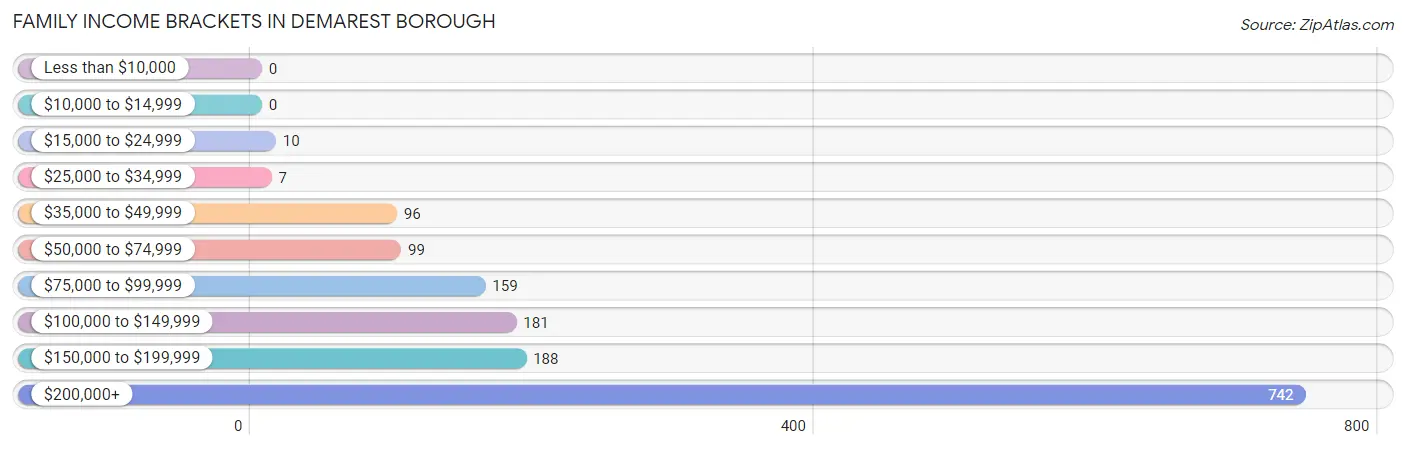
Family Income in Demarest borough
Family Income Brackets in Demarest borough
According to the Demarest borough family income data, there are 742 families falling into the $200,000+ income range, which is the most common income bracket and makes up 50.0% of all families.
| Income Bracket | # Families | % Families |
| Less than $10,000 | 0 | 0.0% |
| $10,000 to $14,999 | 0 | 0.0% |
| $15,000 to $24,999 | 10 | 0.7% |
| $25,000 to $34,999 | 7 | 0.5% |
| $35,000 to $49,999 | 96 | 6.5% |
| $50,000 to $74,999 | 99 | 6.7% |
| $75,000 to $99,999 | 159 | 10.7% |
| $100,000 to $149,999 | 181 | 12.2% |
| $150,000 to $199,999 | 188 | 12.7% |
| $200,000+ | 742 | 50.0% |
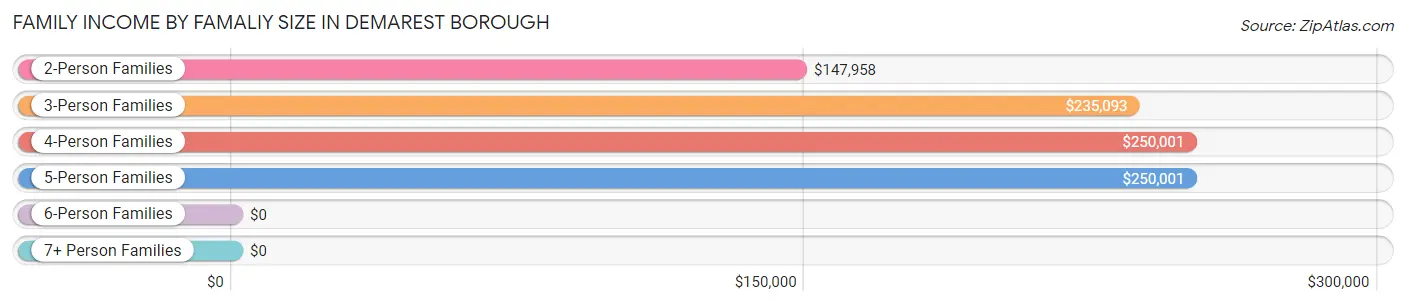
Family Income by Famaliy Size in Demarest borough
4-person families (451 | 30.4%) account for the highest median family income in Demarest borough with $250,001 per family, while 3-person families (232 | 15.6%) have the highest median income of $78,364 per family member.
| Income Bracket | # Families | Median Income |
| 2-Person Families | 629 (42.4%) | $147,958 |
| 3-Person Families | 232 (15.6%) | $235,093 |
| 4-Person Families | 451 (30.4%) | $250,001 |
| 5-Person Families | 158 (10.6%) | $250,001 |
| 6-Person Families | 13 (0.9%) | $0 |
| 7+ Person Families | 0 (0.0%) | $0 |
| Total | 1,483 (100.0%) | $200,104 |
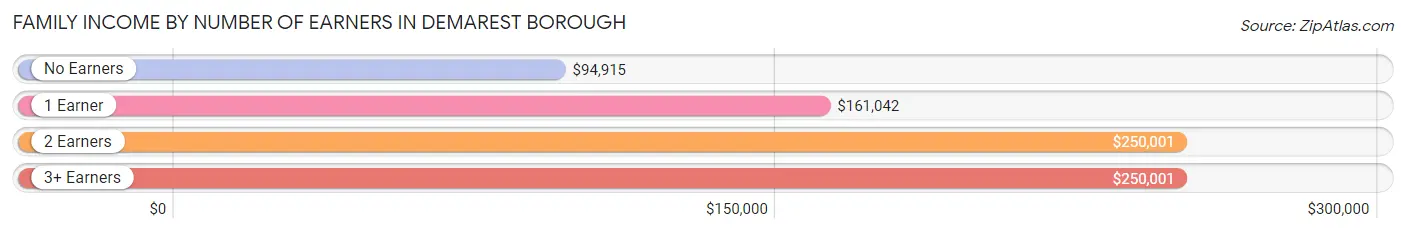
Family Income by Number of Earners in Demarest borough
The median family income in Demarest borough is $200,104, with families comprising 2 earners (697) having the highest median family income of $250,001, while families with no earners (199) have the lowest median family income of $94,915, accounting for 47.0% and 13.4% of families, respectively.
| Number of Earners | # Families | Median Income |
| No Earners | 199 (13.4%) | $94,915 |
| 1 Earner | 451 (30.4%) | $161,042 |
| 2 Earners | 697 (47.0%) | $250,001 |
| 3+ Earners | 136 (9.2%) | $250,001 |
| Total | 1,483 (100.0%) | $200,104 |
Household Income in Demarest borough
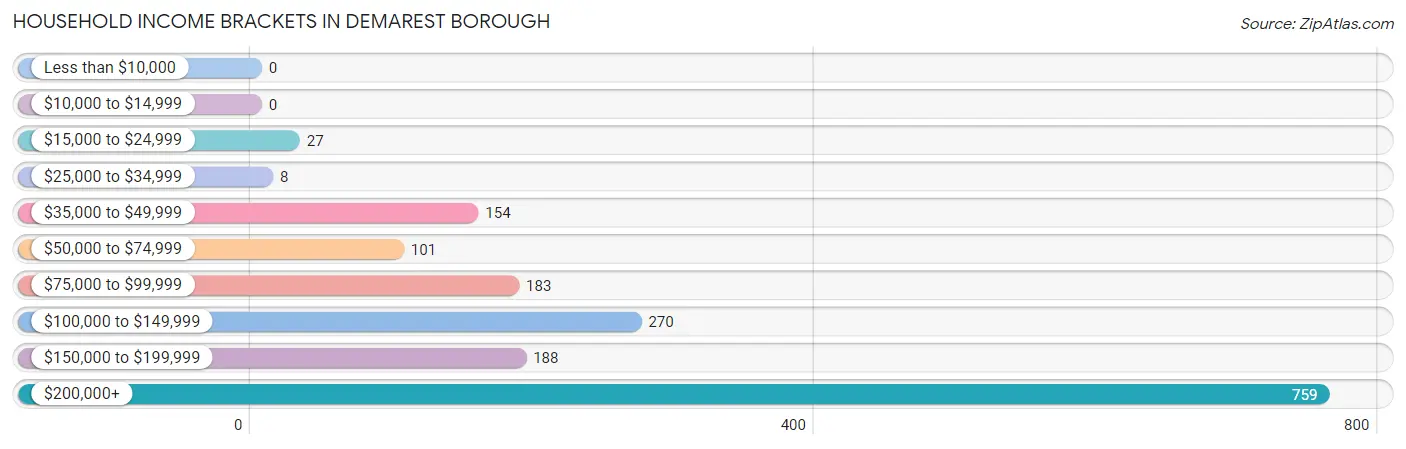
Household Income Brackets in Demarest borough
With 759 households falling in the category, the $200,000+ income range is the most frequent in Demarest borough, accounting for 44.9% of all households.
| Income Bracket | # Households | % Households |
| Less than $10,000 | 0 | 0.0% |
| $10,000 to $14,999 | 0 | 0.0% |
| $15,000 to $24,999 | 27 | 1.6% |
| $25,000 to $34,999 | 8 | 0.5% |
| $35,000 to $49,999 | 154 | 9.1% |
| $50,000 to $74,999 | 101 | 6.0% |
| $75,000 to $99,999 | 183 | 10.8% |
| $100,000 to $149,999 | 270 | 16.0% |
| $150,000 to $199,999 | 188 | 11.1% |
| $200,000+ | 759 | 44.9% |
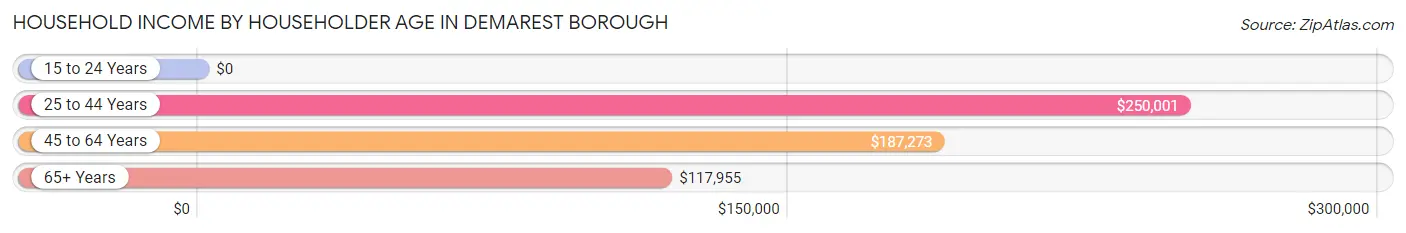
Household Income by Householder Age in Demarest borough
The median household income in Demarest borough is $165,119, with the highest median household income of $250,001 found in the 25 to 44 years age bracket for the primary householder. A total of 272 households (16.1%) fall into this category. Meanwhile, the 15 to 24 years age bracket for the primary householder has the lowest median household income of $0, with 34 households (2.0%) in this group.
| Income Bracket | # Households | Median Income |
| 15 to 24 Years | 34 (2.0%) | $0 |
| 25 to 44 Years | 272 (16.1%) | $250,001 |
| 45 to 64 Years | 844 (49.9%) | $187,273 |
| 65+ Years | 540 (32.0%) | $117,955 |
| Total | 1,690 (100.0%) | $165,119 |
Poverty in Demarest borough
Income Below Poverty by Sex and Age in Demarest borough
With 0.5% poverty level for males and 0.4% for females among the residents of Demarest borough, 65 to 74 year old males and 55 to 64 year old females are the most vulnerable to poverty, with 10 males (2.6%) and 10 females (1.9%) in their respective age groups living below the poverty level.
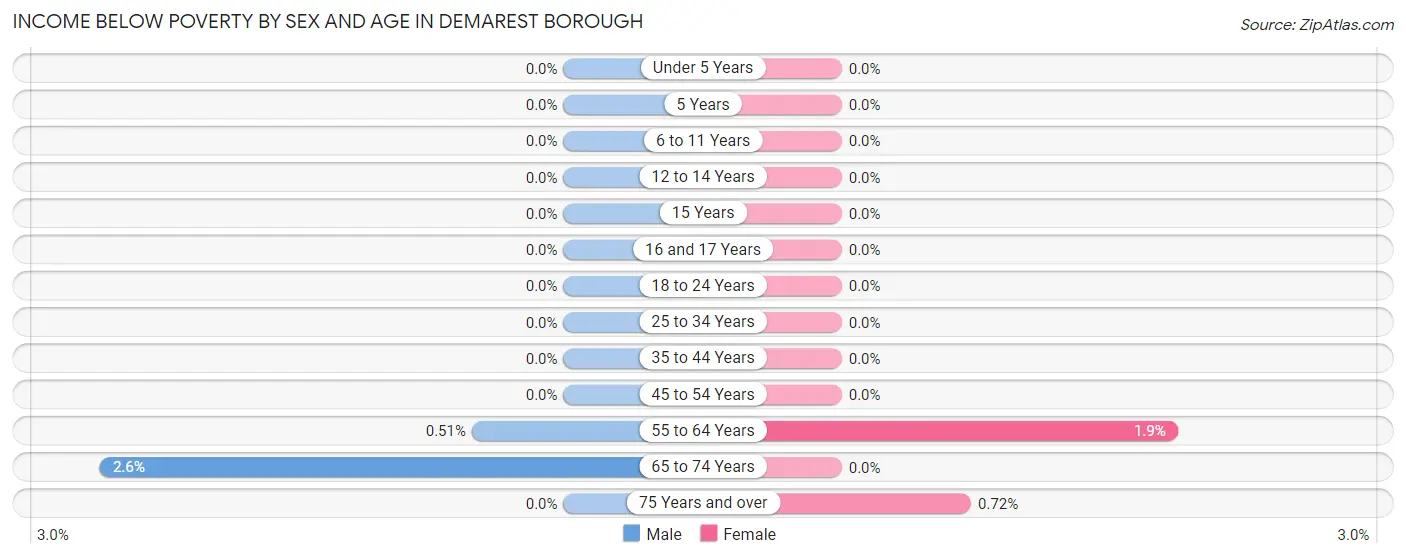
| Age Bracket | Male | Female |
| Under 5 Years | 0 (0.0%) | 0 (0.0%) |
| 5 Years | 0 (0.0%) | 0 (0.0%) |
| 6 to 11 Years | 0 (0.0%) | 0 (0.0%) |
| 12 to 14 Years | 0 (0.0%) | 0 (0.0%) |
| 15 Years | 0 (0.0%) | 0 (0.0%) |
| 16 and 17 Years | 0 (0.0%) | 0 (0.0%) |
| 18 to 24 Years | 0 (0.0%) | 0 (0.0%) |
| 25 to 34 Years | 0 (0.0%) | 0 (0.0%) |
| 35 to 44 Years | 0 (0.0%) | 0 (0.0%) |
| 45 to 54 Years | 0 (0.0%) | 0 (0.0%) |
| 55 to 64 Years | 2 (0.5%) | 10 (1.9%) |
| 65 to 74 Years | 10 (2.6%) | 0 (0.0%) |
| 75 Years and over | 0 (0.0%) | 1 (0.7%) |
| Total | 12 (0.5%) | 11 (0.4%) |
Income Above Poverty by Sex and Age in Demarest borough
According to the poverty statistics in Demarest borough, males aged under 5 years and females aged under 5 years are the age groups that are most secure financially, with 100.0% of males and 100.0% of females in these age groups living above the poverty line.
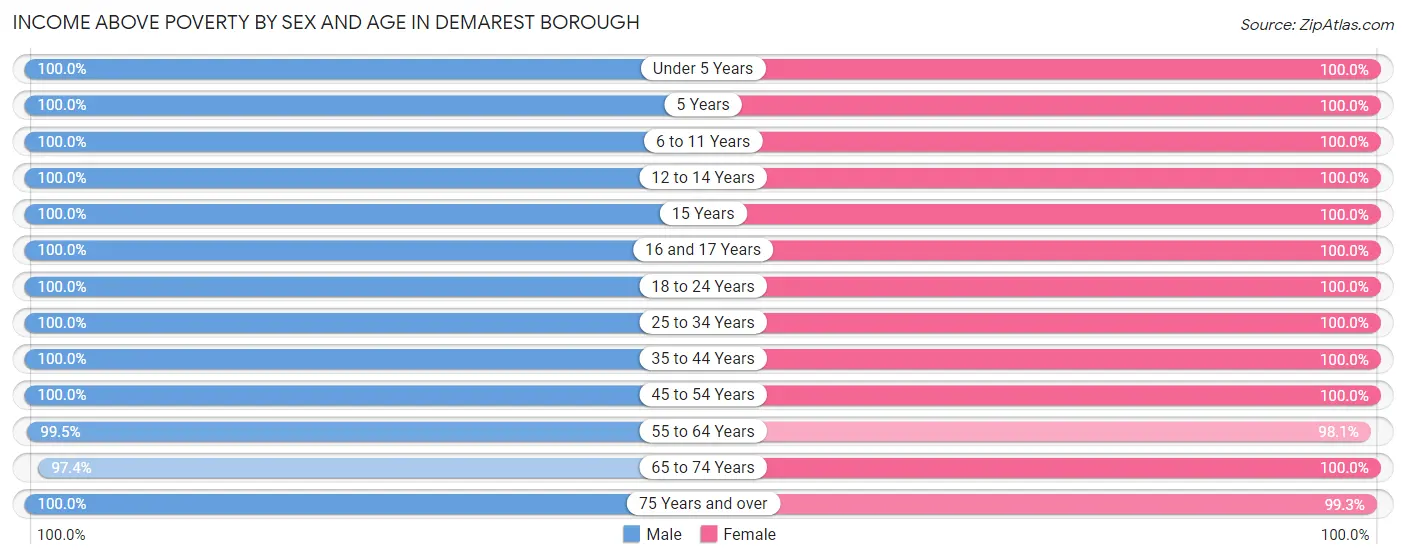
| Age Bracket | Male | Female |
| Under 5 Years | 164 (100.0%) | 110 (100.0%) |
| 5 Years | 51 (100.0%) | 59 (100.0%) |
| 6 to 11 Years | 258 (100.0%) | 358 (100.0%) |
| 12 to 14 Years | 154 (100.0%) | 80 (100.0%) |
| 15 Years | 29 (100.0%) | 28 (100.0%) |
| 16 and 17 Years | 46 (100.0%) | 17 (100.0%) |
| 18 to 24 Years | 135 (100.0%) | 157 (100.0%) |
| 25 to 34 Years | 116 (100.0%) | 32 (100.0%) |
| 35 to 44 Years | 245 (100.0%) | 381 (100.0%) |
| 45 to 54 Years | 387 (100.0%) | 333 (100.0%) |
| 55 to 64 Years | 392 (99.5%) | 525 (98.1%) |
| 65 to 74 Years | 377 (97.4%) | 245 (100.0%) |
| 75 Years and over | 91 (100.0%) | 137 (99.3%) |
| Total | 2,445 (99.5%) | 2,462 (99.6%) |
Income Below Poverty Among Married-Couple Families in Demarest borough
The poverty statistics for married-couple families in Demarest borough show that 0.7% or 10 of the total 1,344 families live below the poverty line. Families with no children have the highest poverty rate of 1.4%, comprising of 10 families. On the other hand, families with 1 or 2 children have the lowest poverty rate of 0.0%, which includes 0 families.
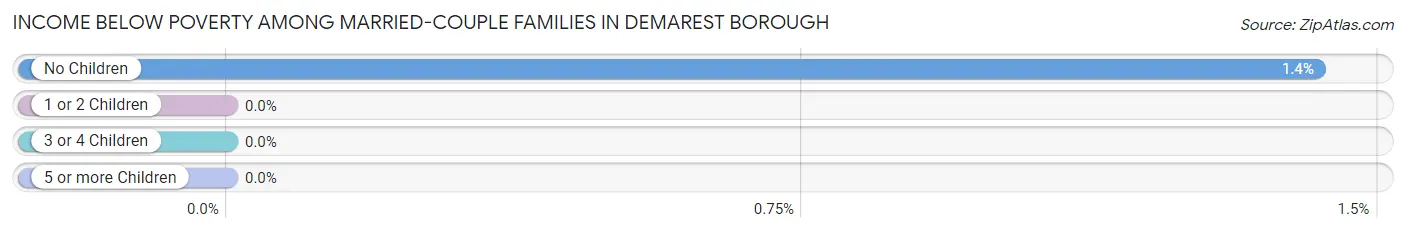
| Children | Above Poverty | Below Poverty |
| No Children | 695 (98.6%) | 10 (1.4%) |
| 1 or 2 Children | 515 (100.0%) | 0 (0.0%) |
| 3 or 4 Children | 124 (100.0%) | 0 (0.0%) |
| 5 or more Children | 0 (0.0%) | 0 (0.0%) |
| Total | 1,334 (99.3%) | 10 (0.7%) |
Income Below Poverty Among Single-Parent Households in Demarest borough
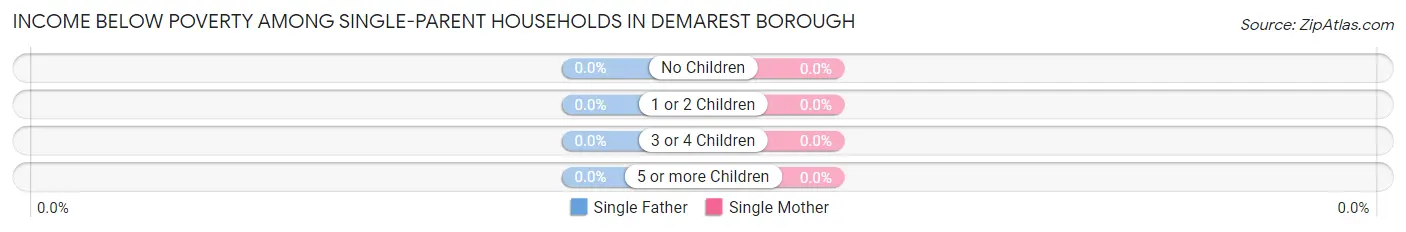
| Children | Single Father | Single Mother |
| No Children | 0 (0.0%) | 0 (0.0%) |
| 1 or 2 Children | 0 (0.0%) | 0 (0.0%) |
| 3 or 4 Children | 0 (0.0%) | 0 (0.0%) |
| 5 or more Children | 0 (0.0%) | 0 (0.0%) |
| Total | 0 (0.0%) | 0 (0.0%) |
Income Below Poverty Among Married-Couple vs Single-Parent Households in Demarest borough
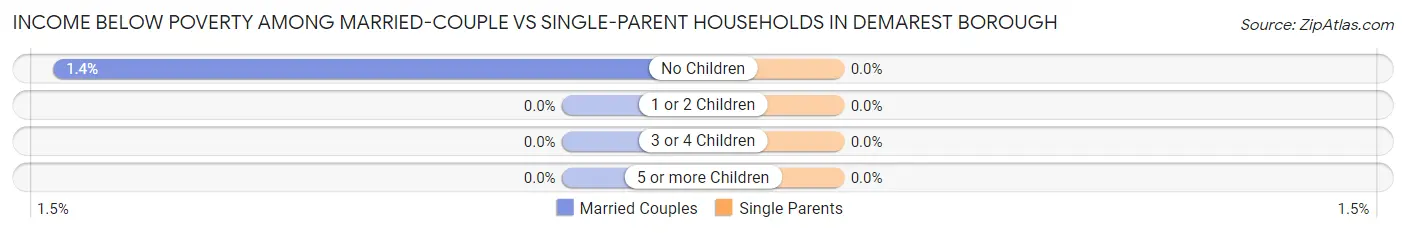
| Children | Married-Couple Families | Single-Parent Households |
| No Children | 10 (1.4%) | 0 (0.0%) |
| 1 or 2 Children | 0 (0.0%) | 0 (0.0%) |
| 3 or 4 Children | 0 (0.0%) | 0 (0.0%) |
| 5 or more Children | 0 (0.0%) | 0 (0.0%) |
| Total | 10 (0.7%) | 0 (0.0%) |
Race in Demarest borough
The most populous races in Demarest borough are White / Caucasian (3,511 | 71.2%), Asian (1,319 | 26.8%), and Hispanic or Latino (208 | 4.2%).
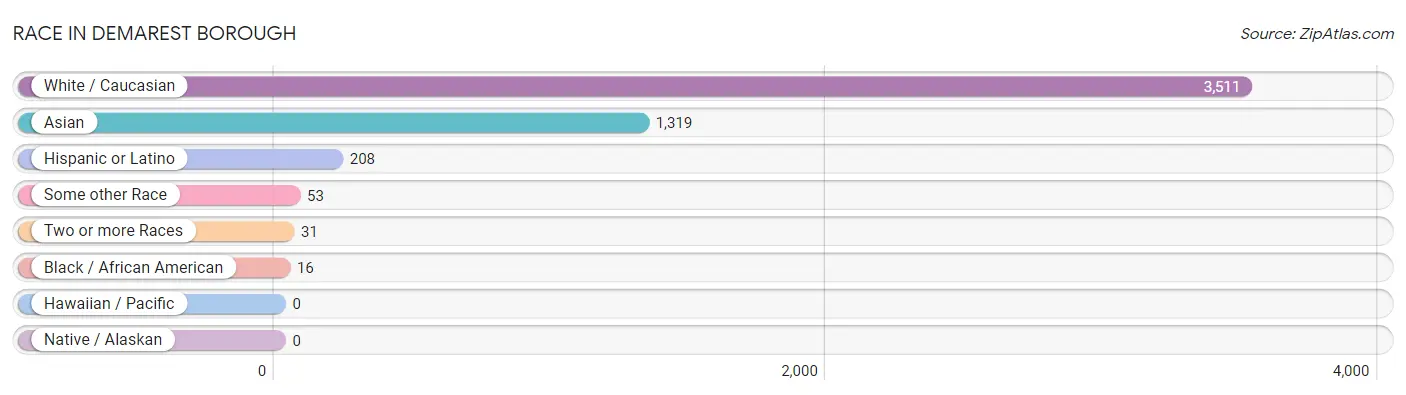
| Race | # Population | % Population |
| Asian | 1,319 | 26.8% |
| Black / African American | 16 | 0.3% |
| Hawaiian / Pacific | 0 | 0.0% |
| Hispanic or Latino | 208 | 4.2% |
| Native / Alaskan | 0 | 0.0% |
| White / Caucasian | 3,511 | 71.2% |
| Two or more Races | 31 | 0.6% |
| Some other Race | 53 | 1.1% |
| Total | 4,930 | 100.0% |
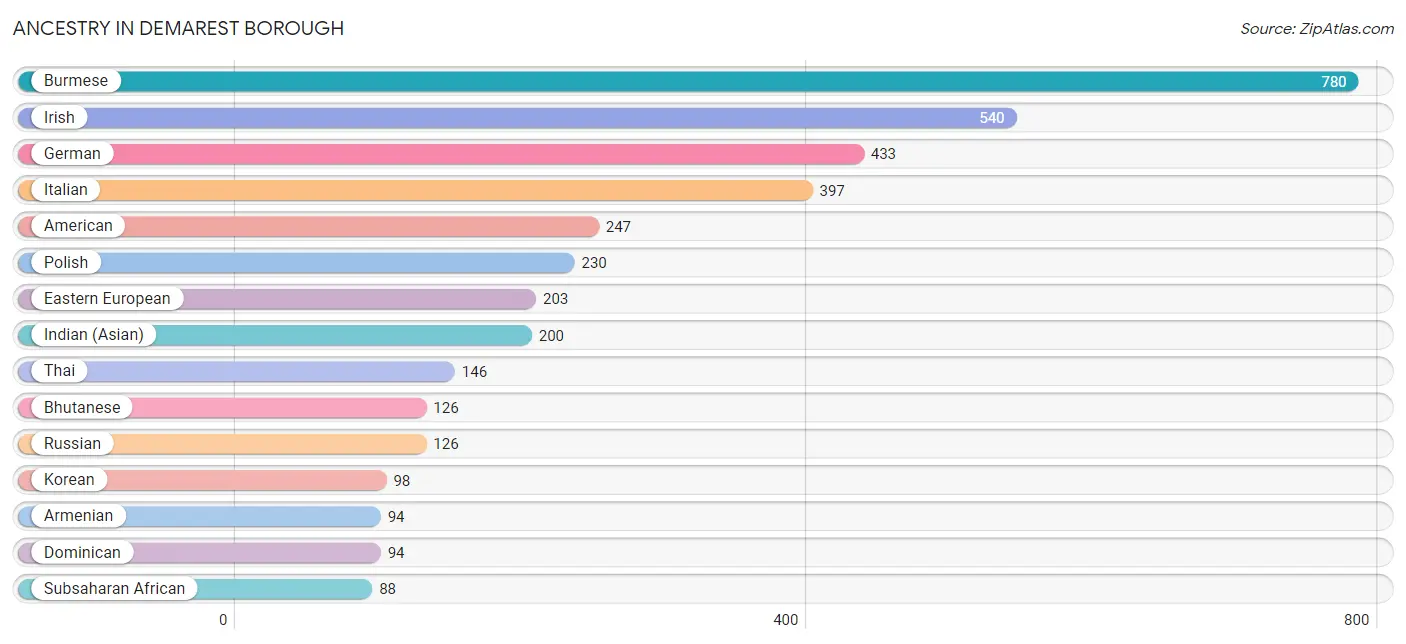
Ancestry in Demarest borough
The most populous ancestries reported in Demarest borough are Burmese (780 | 15.8%), Irish (540 | 11.0%), German (433 | 8.8%), Italian (397 | 8.1%), and American (247 | 5.0%), together accounting for 48.6% of all Demarest borough residents.
| Ancestry | # Population | % Population |
| Albanian | 9 | 0.2% |
| American | 247 | 5.0% |
| Arab | 22 | 0.4% |
| Argentinean | 26 | 0.5% |
| Armenian | 94 | 1.9% |
| Australian | 85 | 1.7% |
| Austrian | 85 | 1.7% |
| Bhutanese | 126 | 2.6% |
| Burmese | 780 | 15.8% |
| Croatian | 9 | 0.2% |
| Cuban | 43 | 0.9% |
| Czechoslovakian | 4 | 0.1% |
| Dominican | 94 | 1.9% |
| Dutch | 46 | 0.9% |
| Eastern European | 203 | 4.1% |
| Ecuadorian | 8 | 0.2% |
| English | 70 | 1.4% |
| European | 18 | 0.4% |
| French | 37 | 0.7% |
| German | 433 | 8.8% |
| Greek | 28 | 0.6% |
| Hungarian | 34 | 0.7% |
| Indian (Asian) | 200 | 4.1% |
| Iranian | 54 | 1.1% |
| Irish | 540 | 11.0% |
| Israeli | 58 | 1.2% |
| Italian | 397 | 8.1% |
| Korean | 98 | 2.0% |
| Lebanese | 8 | 0.2% |
| Lithuanian | 25 | 0.5% |
| Nigerian | 1 | 0.0% |
| Norwegian | 10 | 0.2% |
| Polish | 230 | 4.7% |
| Puerto Rican | 23 | 0.5% |
| Russian | 126 | 2.6% |
| Serbian | 46 | 0.9% |
| South African | 87 | 1.8% |
| South American | 34 | 0.7% |
| Spaniard | 14 | 0.3% |
| Subsaharan African | 88 | 1.8% |
| Swedish | 47 | 0.9% |
| Thai | 146 | 3.0% |
| Turkish | 55 | 1.1% |
| Ukrainian | 18 | 0.4% |
| Welsh | 15 | 0.3% | View All 45 Rows |
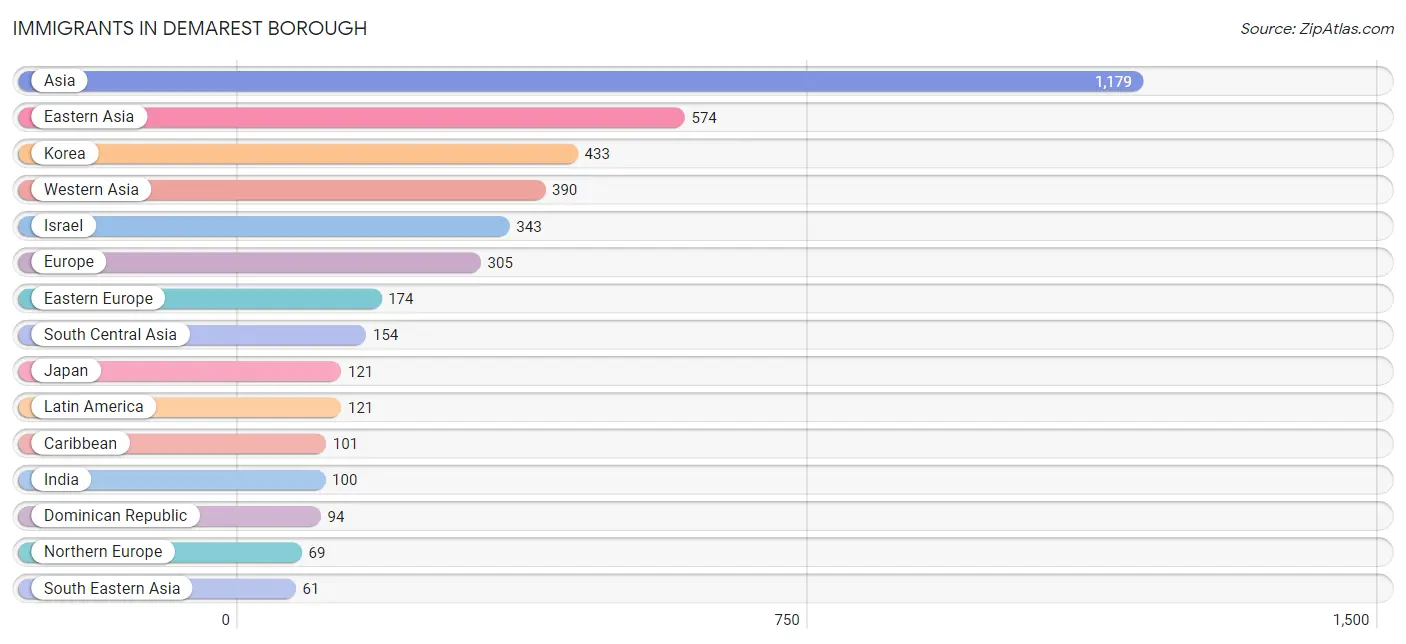
Immigrants in Demarest borough
The most numerous immigrant groups reported in Demarest borough came from Asia (1,179 | 23.9%), Eastern Asia (574 | 11.6%), Korea (433 | 8.8%), Western Asia (390 | 7.9%), and Israel (343 | 7.0%), together accounting for 59.2% of all Demarest borough residents.
| Immigration Origin | # Population | % Population |
| Africa | 1 | 0.0% |
| Argentina | 12 | 0.2% |
| Asia | 1,179 | 23.9% |
| Australia | 18 | 0.4% |
| Belarus | 7 | 0.1% |
| Caribbean | 101 | 2.1% |
| China | 20 | 0.4% |
| Croatia | 9 | 0.2% |
| Cuba | 7 | 0.1% |
| Czechoslovakia | 23 | 0.5% |
| Dominican Republic | 94 | 1.9% |
| Eastern Asia | 574 | 11.6% |
| Eastern Europe | 174 | 3.5% |
| Ecuador | 8 | 0.2% |
| Europe | 305 | 6.2% |
| Germany | 29 | 0.6% |
| Hong Kong | 16 | 0.3% |
| India | 100 | 2.0% |
| Indonesia | 8 | 0.2% |
| Iran | 54 | 1.1% |
| Ireland | 28 | 0.6% |
| Israel | 343 | 7.0% |
| Italy | 19 | 0.4% |
| Japan | 121 | 2.5% |
| Jordan | 8 | 0.2% |
| Korea | 433 | 8.8% |
| Latin America | 121 | 2.5% |
| Lebanon | 8 | 0.2% |
| Nigeria | 1 | 0.0% |
| Northern Europe | 69 | 1.4% |
| Oceania | 18 | 0.4% |
| Philippines | 53 | 1.1% |
| Poland | 23 | 0.5% |
| Russia | 13 | 0.3% |
| South America | 20 | 0.4% |
| South Central Asia | 154 | 3.1% |
| South Eastern Asia | 61 | 1.2% |
| Southern Europe | 33 | 0.7% |
| Spain | 14 | 0.3% |
| Turkey | 31 | 0.6% |
| Ukraine | 51 | 1.0% |
| Western Africa | 1 | 0.0% |
| Western Asia | 390 | 7.9% |
| Western Europe | 29 | 0.6% | View All 44 Rows |
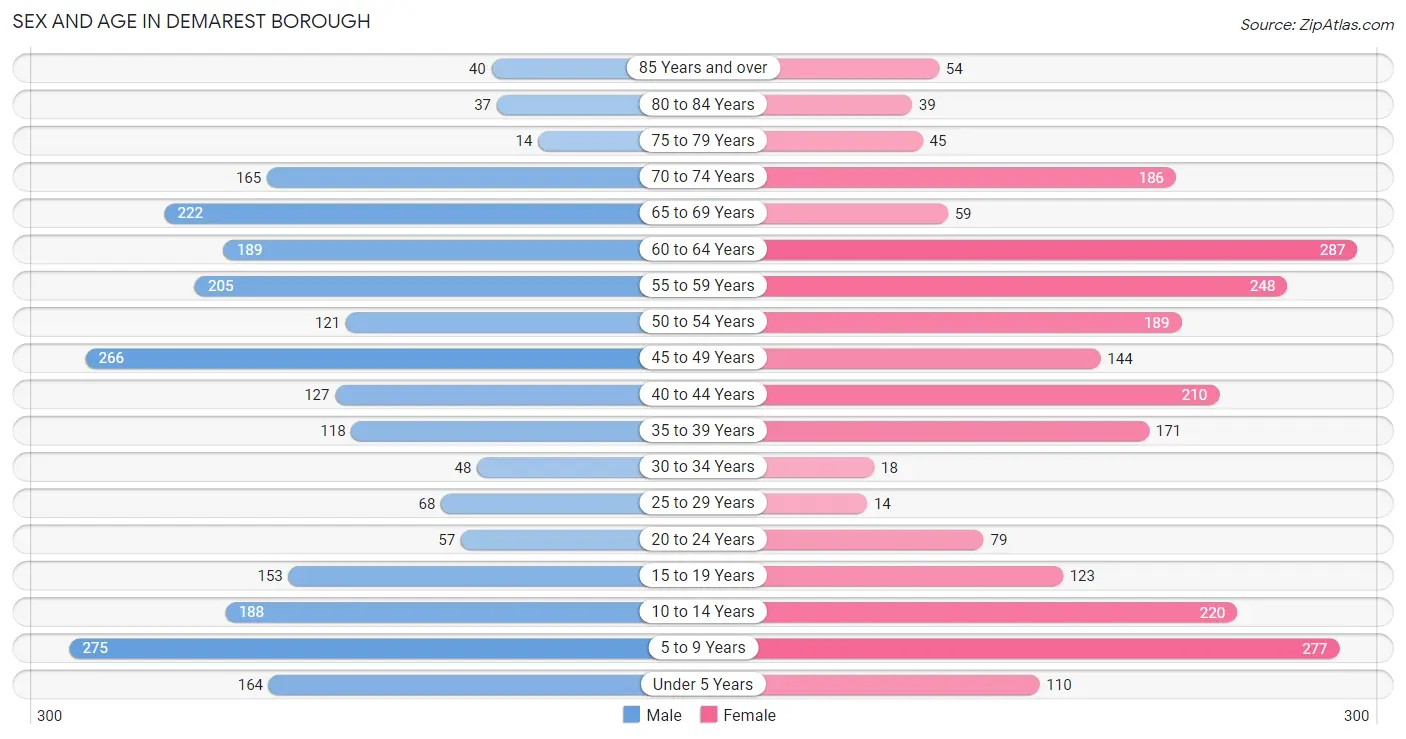
Sex and Age in Demarest borough
Sex and Age in Demarest borough
The most populous age groups in Demarest borough are 5 to 9 Years (275 | 11.2%) for men and 60 to 64 Years (287 | 11.6%) for women.
| Age Bracket | Male | Female |
| Under 5 Years | 164 (6.7%) | 110 (4.4%) |
| 5 to 9 Years | 275 (11.2%) | 277 (11.2%) |
| 10 to 14 Years | 188 (7.6%) | 220 (8.9%) |
| 15 to 19 Years | 153 (6.2%) | 123 (5.0%) |
| 20 to 24 Years | 57 (2.3%) | 79 (3.2%) |
| 25 to 29 Years | 68 (2.8%) | 14 (0.6%) |
| 30 to 34 Years | 48 (1.9%) | 18 (0.7%) |
| 35 to 39 Years | 118 (4.8%) | 171 (6.9%) |
| 40 to 44 Years | 127 (5.2%) | 210 (8.5%) |
| 45 to 49 Years | 266 (10.8%) | 144 (5.8%) |
| 50 to 54 Years | 121 (4.9%) | 189 (7.6%) |
| 55 to 59 Years | 205 (8.3%) | 248 (10.0%) |
| 60 to 64 Years | 189 (7.7%) | 287 (11.6%) |
| 65 to 69 Years | 222 (9.0%) | 59 (2.4%) |
| 70 to 74 Years | 165 (6.7%) | 186 (7.5%) |
| 75 to 79 Years | 14 (0.6%) | 45 (1.8%) |
| 80 to 84 Years | 37 (1.5%) | 39 (1.6%) |
| 85 Years and over | 40 (1.6%) | 54 (2.2%) |
| Total | 2,457 (100.0%) | 2,473 (100.0%) |
Families and Households in Demarest borough
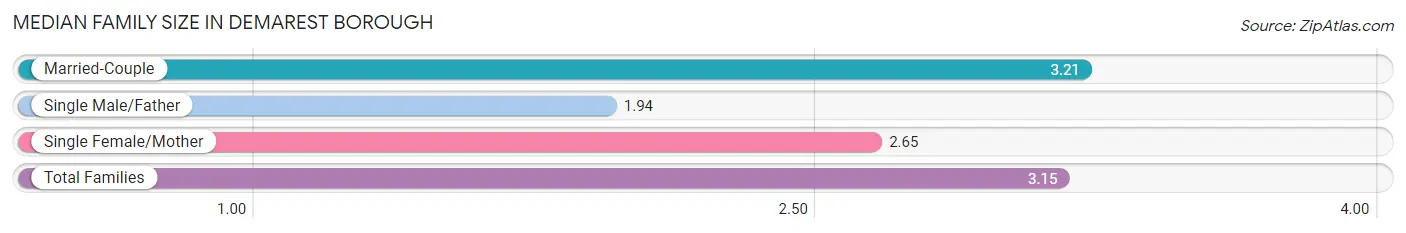
Median Family Size in Demarest borough
The median family size in Demarest borough is 3.15 persons per family, with married-couple families (1,344 | 90.6%) accounting for the largest median family size of 3.21 persons per family. On the other hand, single male/father families (18 | 1.2%) represent the smallest median family size with 1.94 persons per family.
| Family Type | # Families | Family Size |
| Married-Couple | 1,344 (90.6%) | 3.21 |
| Single Male/Father | 18 (1.2%) | 1.94 |
| Single Female/Mother | 121 (8.2%) | 2.65 |
| Total Families | 1,483 (100.0%) | 3.15 |
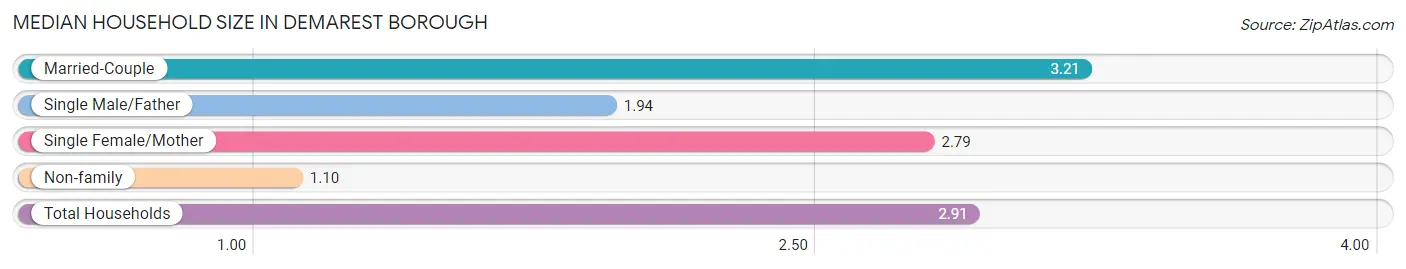
Median Household Size in Demarest borough
The median household size in Demarest borough is 2.91 persons per household, with married-couple households (1,344 | 79.5%) accounting for the largest median household size of 3.21 persons per household. non-family households (207 | 12.2%) represent the smallest median household size with 1.10 persons per household.
| Household Type | # Households | Household Size |
| Married-Couple | 1,344 (79.5%) | 3.21 |
| Single Male/Father | 18 (1.1%) | 1.94 |
| Single Female/Mother | 121 (7.2%) | 2.79 |
| Non-family | 207 (12.2%) | 1.10 |
| Total Households | 1,690 (100.0%) | 2.91 |
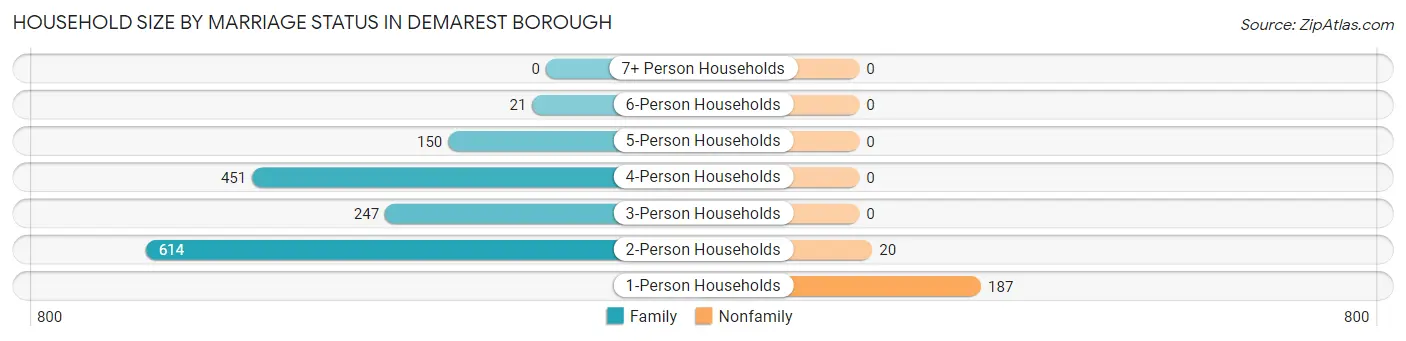
Household Size by Marriage Status in Demarest borough
Out of a total of 1,690 households in Demarest borough, 1,483 (87.7%) are family households, while 207 (12.2%) are nonfamily households. The most numerous type of family households are 2-person households, comprising 614, and the most common type of nonfamily households are 1-person households, comprising 187.
| Household Size | Family Households | Nonfamily Households |
| 1-Person Households | - | 187 (11.1%) |
| 2-Person Households | 614 (36.3%) | 20 (1.2%) |
| 3-Person Households | 247 (14.6%) | 0 (0.0%) |
| 4-Person Households | 451 (26.7%) | 0 (0.0%) |
| 5-Person Households | 150 (8.9%) | 0 (0.0%) |
| 6-Person Households | 21 (1.2%) | 0 (0.0%) |
| 7+ Person Households | 0 (0.0%) | 0 (0.0%) |
| Total | 1,483 (87.7%) | 207 (12.2%) |
Female Fertility in Demarest borough
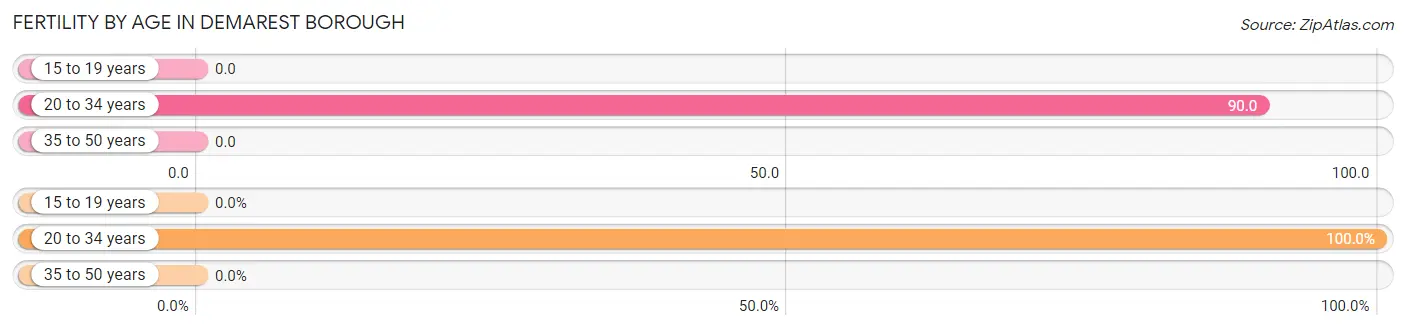
Fertility by Age in Demarest borough
Average fertility rate in Demarest borough is 12.0 births per 1,000 women. Women in the age bracket of 20 to 34 years have the highest fertility rate with 90.0 births per 1,000 women. Women in the age bracket of 20 to 34 years acount for 100.0% of all women with births.
| Age Bracket | Women with Births | Births / 1,000 Women |
| 15 to 19 years | 0 (0.0%) | 0.0 |
| 20 to 34 years | 10 (100.0%) | 90.0 |
| 35 to 50 years | 0 (0.0%) | 0.0 |
| Total | 10 (100.0%) | 12.0 |
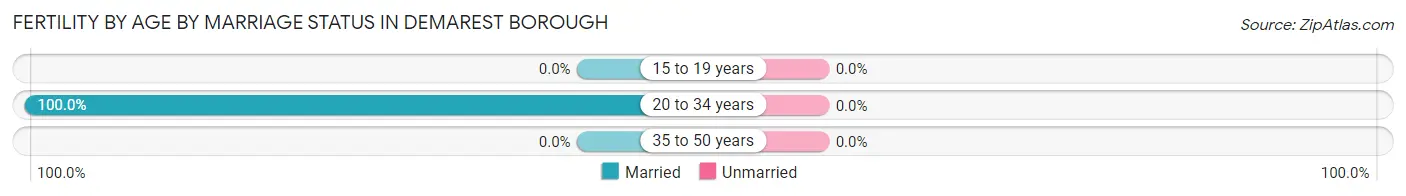
Fertility by Age by Marriage Status in Demarest borough
| Age Bracket | Married | Unmarried |
| 15 to 19 years | 0 (0.0%) | 0 (0.0%) |
| 20 to 34 years | 10 (100.0%) | 0 (0.0%) |
| 35 to 50 years | 0 (0.0%) | 0 (0.0%) |
| Total | 10 (100.0%) | 0 (0.0%) |
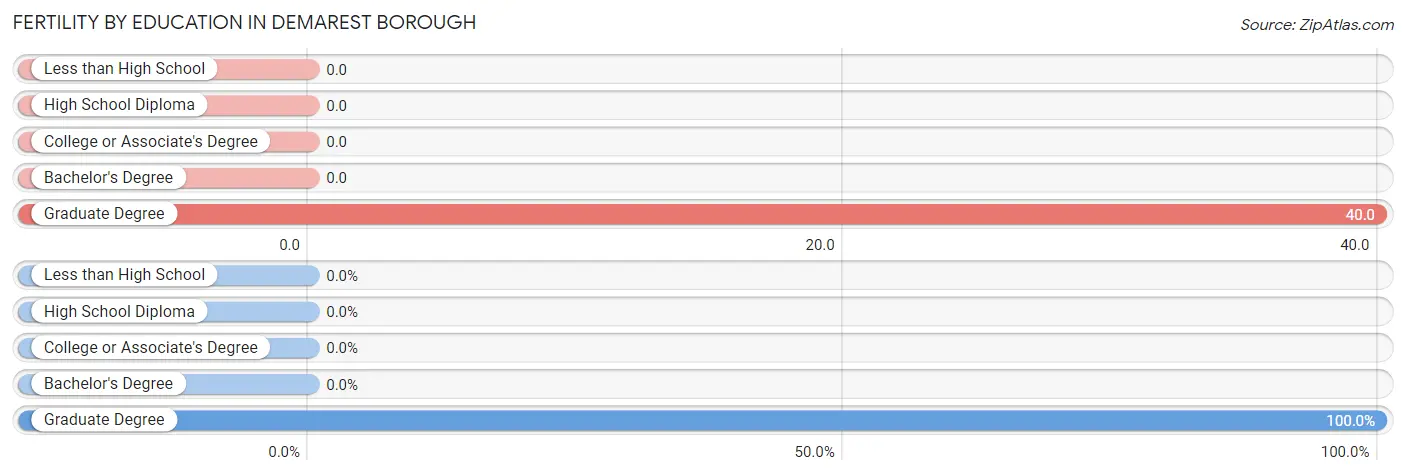
Fertility by Education in Demarest borough
| Educational Attainment | Women with Births | Births / 1,000 Women |
| Less than High School | 0 (0.0%) | 0.0 |
| High School Diploma | 0 (0.0%) | 0.0 |
| College or Associate's Degree | 0 (0.0%) | 0.0 |
| Bachelor's Degree | 0 (0.0%) | 0.0 |
| Graduate Degree | 10 (100.0%) | 40.0 |
| Total | 10 (100.0%) | 12.0 |
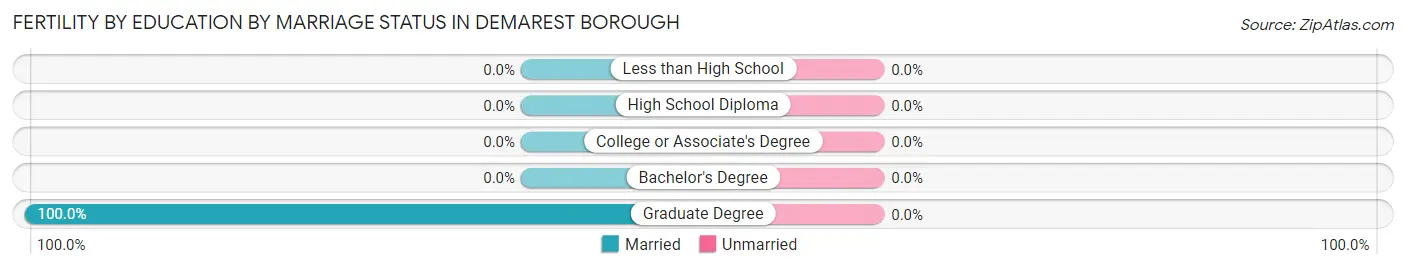
Fertility by Education by Marriage Status in Demarest borough
| Educational Attainment | Married | Unmarried |
| Less than High School | 0 (0.0%) | 0 (0.0%) |
| High School Diploma | 0 (0.0%) | 0 (0.0%) |
| College or Associate's Degree | 0 (0.0%) | 0 (0.0%) |
| Bachelor's Degree | 0 (0.0%) | 0 (0.0%) |
| Graduate Degree | 10 (100.0%) | 0 (0.0%) |
| Total | 10 (100.0%) | 0 (0.0%) |
Employment Characteristics in Demarest borough
Employment by Class of Employer in Demarest borough
Among the 2,184 employed individuals in Demarest borough, private company employees (1,293 | 59.2%), self-employed (incorporated) (375 | 17.2%), and not-for-profit organizations (205 | 9.4%) make up the most common classes of employment.
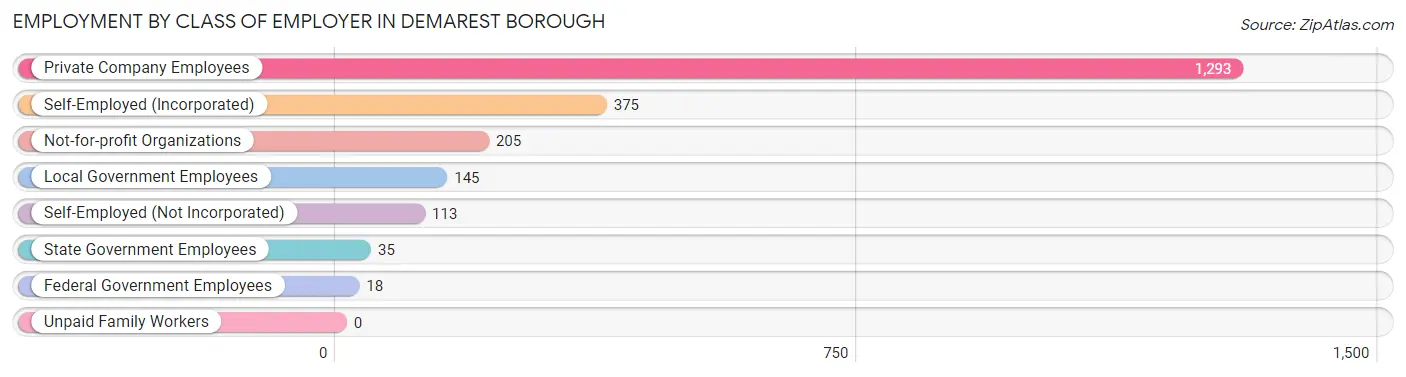
| Employer Class | # Employees | % Employees |
| Private Company Employees | 1,293 | 59.2% |
| Self-Employed (Incorporated) | 375 | 17.2% |
| Self-Employed (Not Incorporated) | 113 | 5.2% |
| Not-for-profit Organizations | 205 | 9.4% |
| Local Government Employees | 145 | 6.6% |
| State Government Employees | 35 | 1.6% |
| Federal Government Employees | 18 | 0.8% |
| Unpaid Family Workers | 0 | 0.0% |
| Total | 2,184 | 100.0% |
Employment Status by Age in Demarest borough
According to the labor force statistics for Demarest borough, out of the total population over 16 years of age (3,639), 64.0% or 2,329 individuals are in the labor force, with 4.8% or 112 of them unemployed. The age group with the highest labor force participation rate is 25 to 29 years, with 100.0% or 82 individuals in the labor force. Within the labor force, the 65 to 74 years age range has the highest percentage of unemployed individuals, with 33.5% or 69 of them being unemployed.
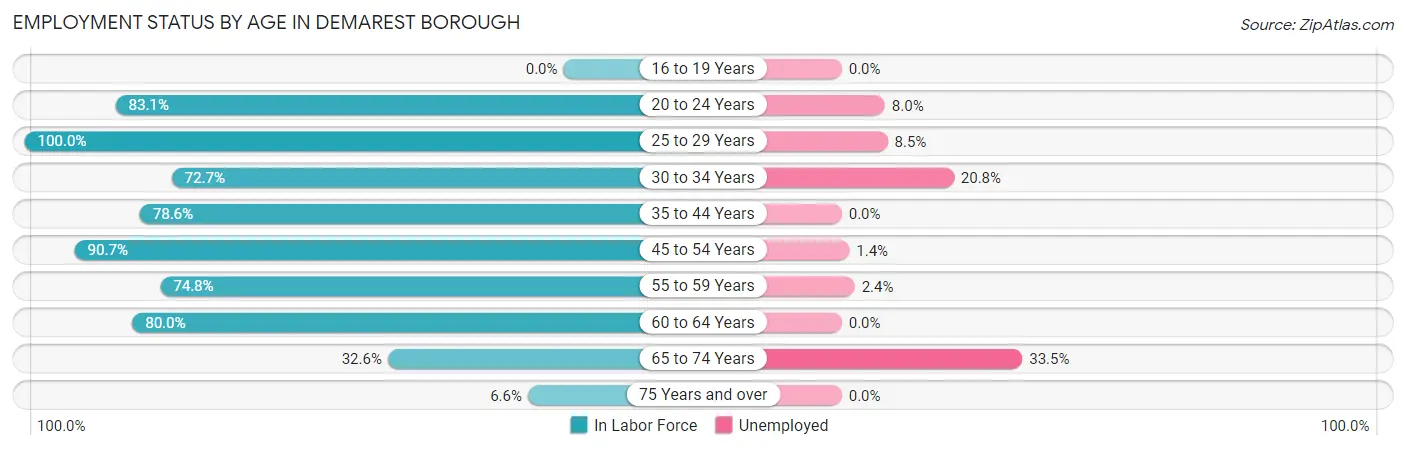
| Age Bracket | In Labor Force | Unemployed |
| 16 to 19 Years | 0 (0.0%) | 0 (0.0%) |
| 20 to 24 Years | 113 (83.1%) | 9 (8.0%) |
| 25 to 29 Years | 82 (100.0%) | 7 (8.5%) |
| 30 to 34 Years | 48 (72.7%) | 10 (20.8%) |
| 35 to 44 Years | 492 (78.6%) | 0 (0.0%) |
| 45 to 54 Years | 653 (90.7%) | 9 (1.4%) |
| 55 to 59 Years | 339 (74.8%) | 8 (2.4%) |
| 60 to 64 Years | 381 (80.0%) | 0 (0.0%) |
| 65 to 74 Years | 206 (32.6%) | 69 (33.5%) |
| 75 Years and over | 15 (6.6%) | 0 (0.0%) |
| Total | 2,329 (64.0%) | 112 (4.8%) |
Employment Status by Educational Attainment in Demarest borough
According to labor force statistics for Demarest borough, 82.3% of individuals (1,994) out of the total population between 25 and 64 years of age (2,423) are in the labor force, with 1.7% or 34 of them being unemployed. The group with the highest labor force participation rate are those with the educational attainment of less than high school, with 100.0% or 17 individuals in the labor force. Within the labor force, individuals with college / associate degree education have the highest percentage of unemployment, with 3.3% or 10 of them being unemployed.
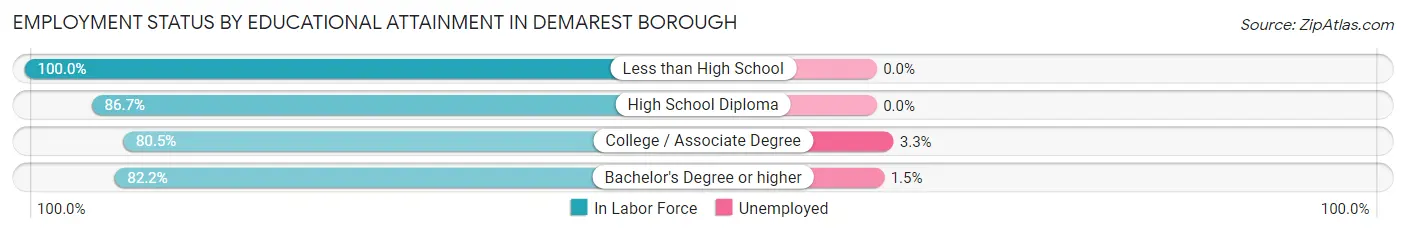
| Educational Attainment | In Labor Force | Unemployed |
| Less than High School | 17 (100.0%) | 0 (0.0%) |
| High School Diploma | 117 (86.7%) | 0 (0.0%) |
| College / Associate Degree | 305 (80.5%) | 13 (3.3%) |
| Bachelor's Degree or higher | 1,555 (82.2%) | 28 (1.5%) |
| Total | 1,994 (82.3%) | 41 (1.7%) |
Employment Occupations by Sex in Demarest borough
Management, Business, Science and Arts Occupations
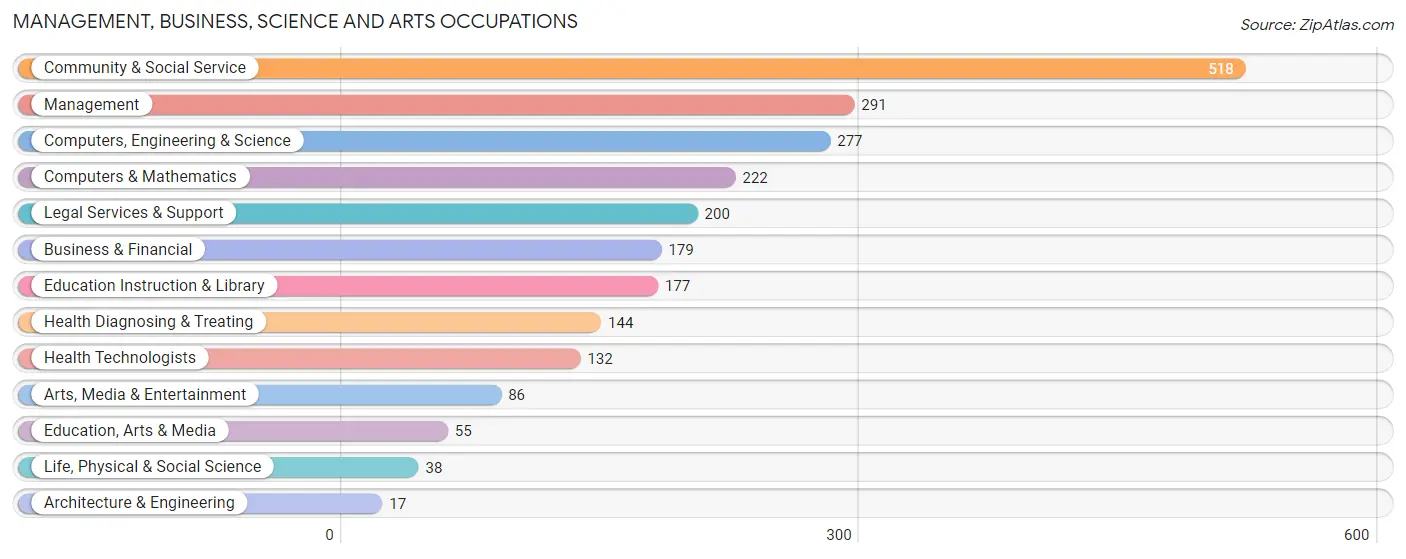
The most common Management, Business, Science and Arts occupations in Demarest borough are Community & Social Service (518 | 23.4%), Management (291 | 13.1%), Computers, Engineering & Science (277 | 12.5%), Computers & Mathematics (222 | 10.0%), and Legal Services & Support (200 | 9.0%).
Management, Business, Science and Arts Occupations by Sex
Within the Management, Business, Science and Arts occupations in Demarest borough, the most male-oriented occupations are Architecture & Engineering (100.0%), Computers & Mathematics (85.1%), and Computers, Engineering & Science (81.6%), while the most female-oriented occupations are Health Diagnosing & Treating (78.5%), Health Technologists (76.5%), and Education Instruction & Library (68.4%).
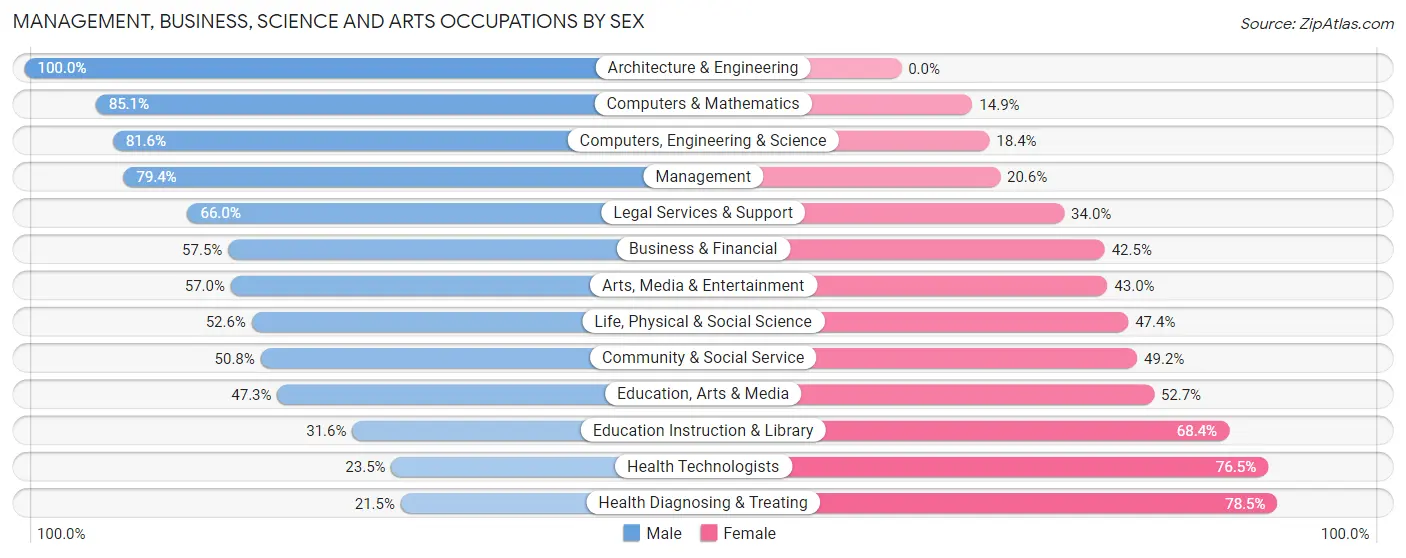
| Occupation | Male | Female |
| Management | 231 (79.4%) | 60 (20.6%) |
| Business & Financial | 103 (57.5%) | 76 (42.5%) |
| Computers, Engineering & Science | 226 (81.6%) | 51 (18.4%) |
| Computers & Mathematics | 189 (85.1%) | 33 (14.9%) |
| Architecture & Engineering | 17 (100.0%) | 0 (0.0%) |
| Life, Physical & Social Science | 20 (52.6%) | 18 (47.4%) |
| Community & Social Service | 263 (50.8%) | 255 (49.2%) |
| Education, Arts & Media | 26 (47.3%) | 29 (52.7%) |
| Legal Services & Support | 132 (66.0%) | 68 (34.0%) |
| Education Instruction & Library | 56 (31.6%) | 121 (68.4%) |
| Arts, Media & Entertainment | 49 (57.0%) | 37 (43.0%) |
| Health Diagnosing & Treating | 31 (21.5%) | 113 (78.5%) |
| Health Technologists | 31 (23.5%) | 101 (76.5%) |
| Total (Category) | 854 (60.6%) | 555 (39.4%) |
| Total (Overall) | 1,253 (56.5%) | 964 (43.5%) |
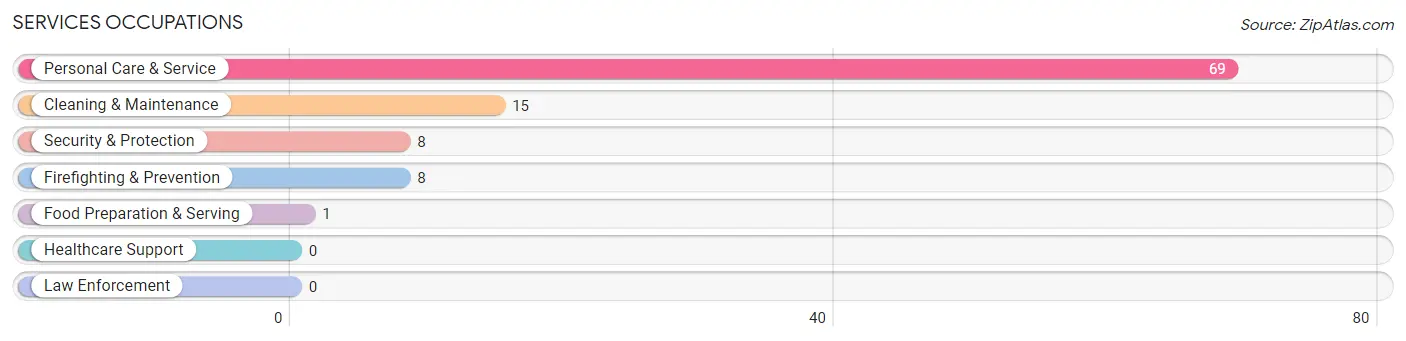
Services Occupations
The most common Services occupations in Demarest borough are Personal Care & Service (69 | 3.1%), Cleaning & Maintenance (15 | 0.7%), Security & Protection (8 | 0.4%), Firefighting & Prevention (8 | 0.4%), and Food Preparation & Serving (1 | 0.1%).
Services Occupations by Sex
Within the Services occupations in Demarest borough, the most male-oriented occupations are Food Preparation & Serving (100.0%), Cleaning & Maintenance (53.3%), and Personal Care & Service (23.2%), while the most female-oriented occupations are Security & Protection (100.0%), Firefighting & Prevention (100.0%), and Personal Care & Service (76.8%).
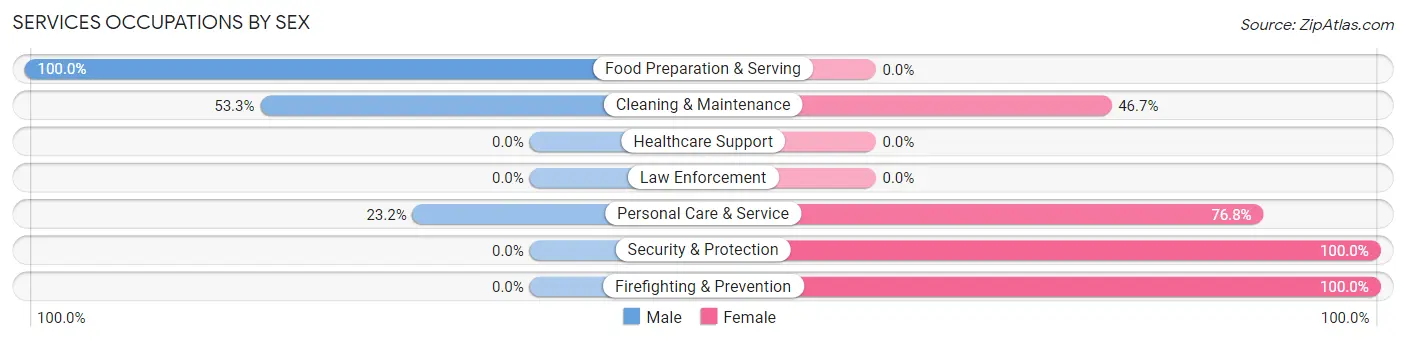
| Occupation | Male | Female |
| Healthcare Support | 0 (0.0%) | 0 (0.0%) |
| Security & Protection | 0 (0.0%) | 8 (100.0%) |
| Firefighting & Prevention | 0 (0.0%) | 8 (100.0%) |
| Law Enforcement | 0 (0.0%) | 0 (0.0%) |
| Food Preparation & Serving | 1 (100.0%) | 0 (0.0%) |
| Cleaning & Maintenance | 8 (53.3%) | 7 (46.7%) |
| Personal Care & Service | 16 (23.2%) | 53 (76.8%) |
| Total (Category) | 25 (26.9%) | 68 (73.1%) |
| Total (Overall) | 1,253 (56.5%) | 964 (43.5%) |
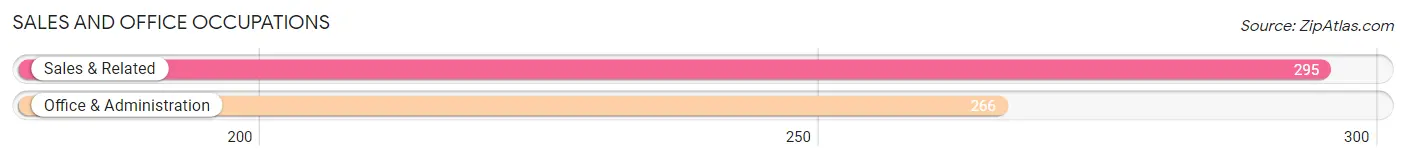
Sales and Office Occupations
The most common Sales and Office occupations in Demarest borough are Sales & Related (295 | 13.3%), and Office & Administration (266 | 12.0%).
Sales and Office Occupations by Sex

| Occupation | Male | Female |
| Sales & Related | 193 (65.4%) | 102 (34.6%) |
| Office & Administration | 27 (10.2%) | 239 (89.8%) |
| Total (Category) | 220 (39.2%) | 341 (60.8%) |
| Total (Overall) | 1,253 (56.5%) | 964 (43.5%) |
Natural Resources, Construction and Maintenance Occupations
The most common Natural Resources, Construction and Maintenance occupations in Demarest borough are Construction & Extraction (60 | 2.7%), Installation, Maintenance & Repair (18 | 0.8%), and Farming, Fishing & Forestry (8 | 0.4%).
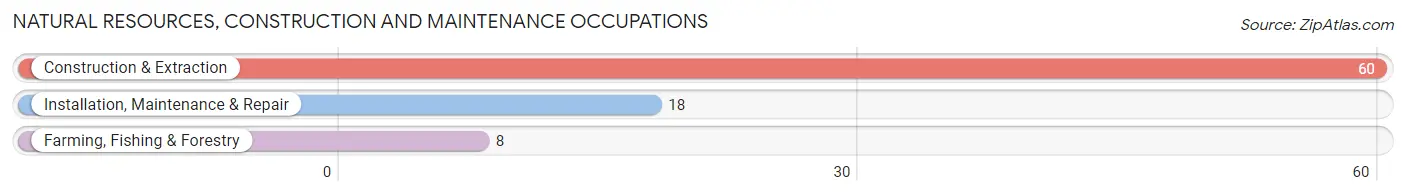
Natural Resources, Construction and Maintenance Occupations by Sex
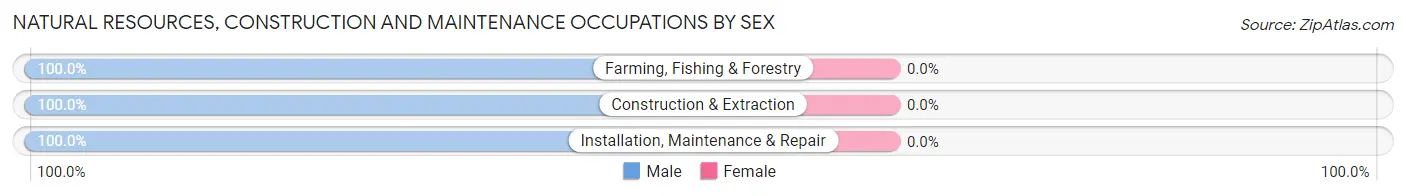
| Occupation | Male | Female |
| Farming, Fishing & Forestry | 8 (100.0%) | 0 (0.0%) |
| Construction & Extraction | 60 (100.0%) | 0 (0.0%) |
| Installation, Maintenance & Repair | 18 (100.0%) | 0 (0.0%) |
| Total (Category) | 86 (100.0%) | 0 (0.0%) |
| Total (Overall) | 1,253 (56.5%) | 964 (43.5%) |
Production, Transportation and Moving Occupations
The most common Production, Transportation and Moving occupations in Demarest borough are Transportation (42 | 1.9%), Production (13 | 0.6%), and Material Moving (13 | 0.6%).
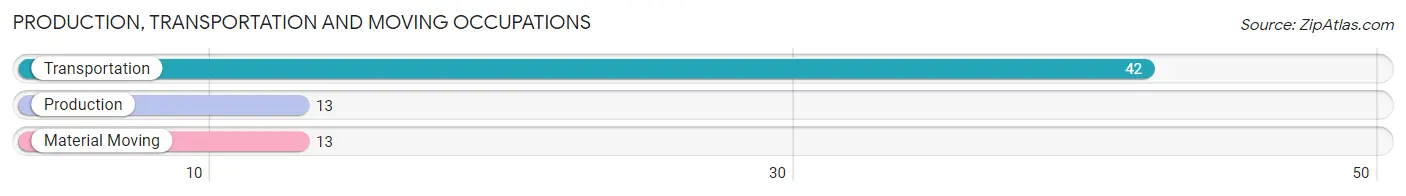
Production, Transportation and Moving Occupations by Sex
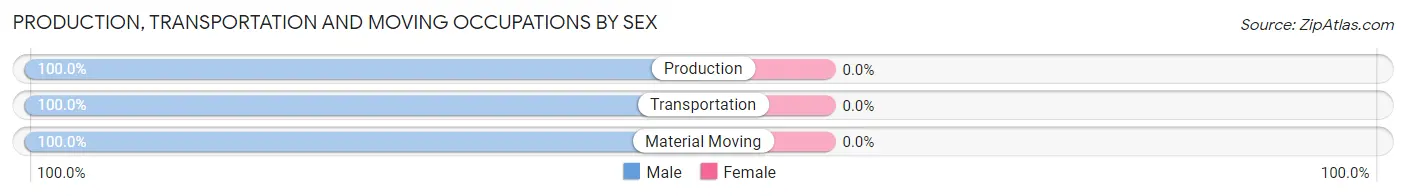
| Occupation | Male | Female |
| Production | 13 (100.0%) | 0 (0.0%) |
| Transportation | 42 (100.0%) | 0 (0.0%) |
| Material Moving | 13 (100.0%) | 0 (0.0%) |
| Total (Category) | 68 (100.0%) | 0 (0.0%) |
| Total (Overall) | 1,253 (56.5%) | 964 (43.5%) |
Employment Industries by Sex in Demarest borough
Employment Industries in Demarest borough
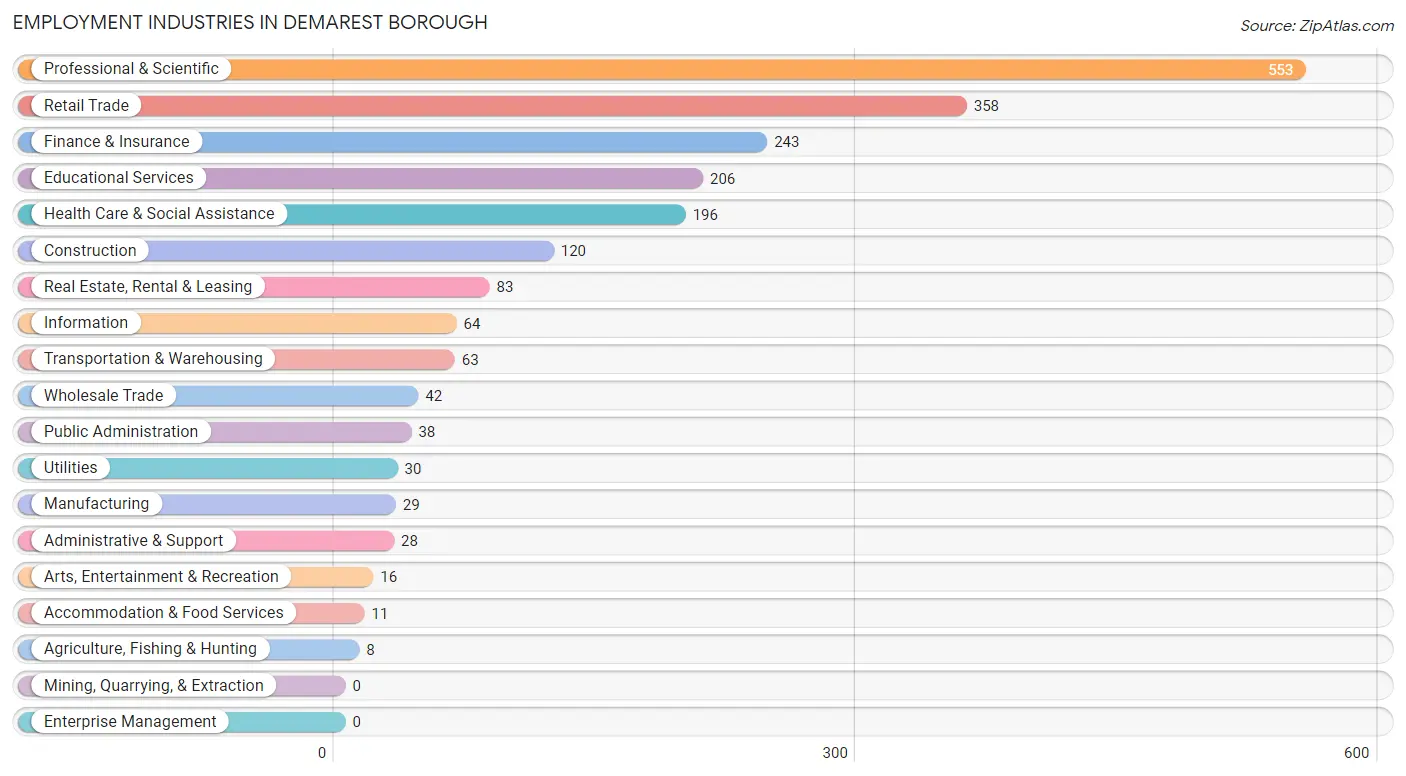
The major employment industries in Demarest borough include Professional & Scientific (553 | 24.9%), Retail Trade (358 | 16.2%), Finance & Insurance (243 | 11.0%), Educational Services (206 | 9.3%), and Health Care & Social Assistance (196 | 8.8%).
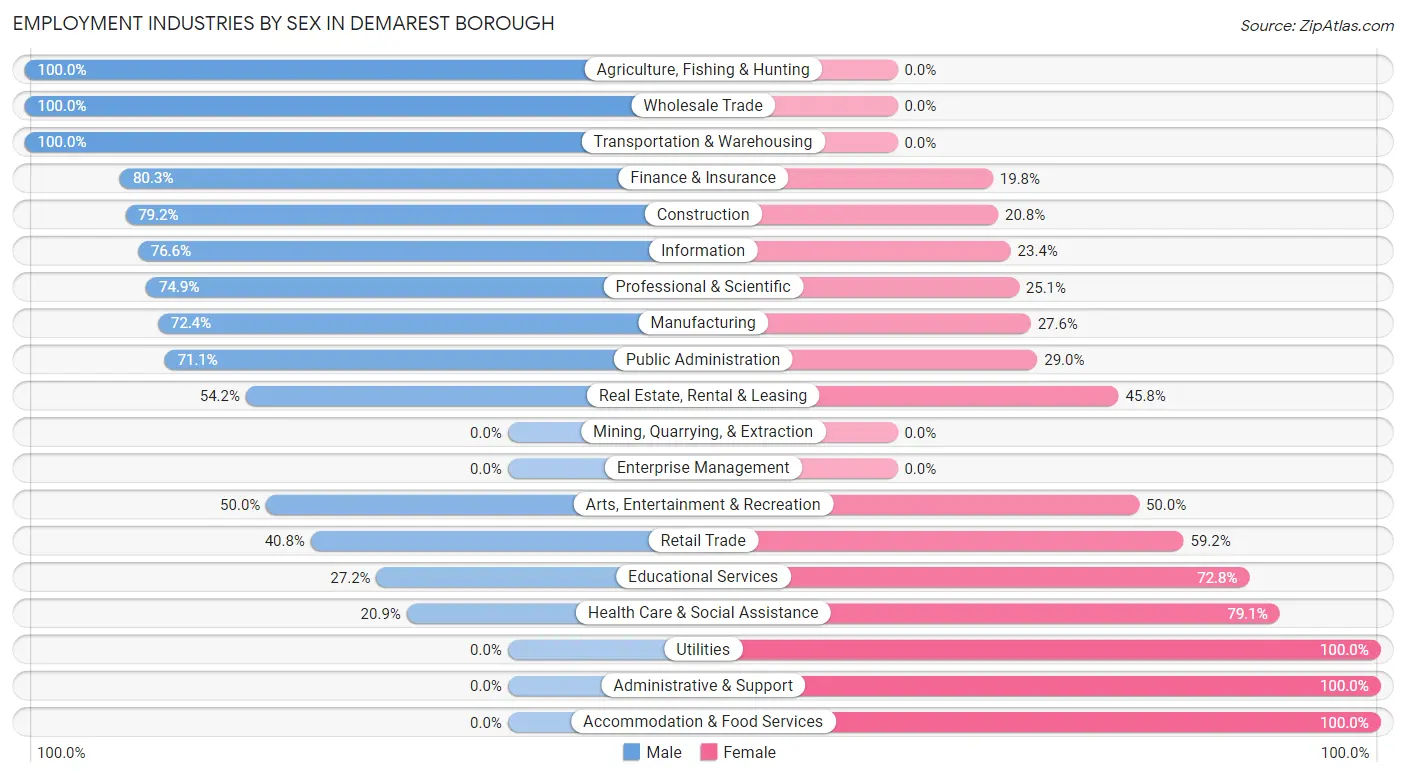
Employment Industries by Sex in Demarest borough
The Demarest borough industries that see more men than women are Agriculture, Fishing & Hunting (100.0%), Wholesale Trade (100.0%), and Transportation & Warehousing (100.0%), whereas the industries that tend to have a higher number of women are Utilities (100.0%), Administrative & Support (100.0%), and Accommodation & Food Services (100.0%).
| Industry | Male | Female |
| Agriculture, Fishing & Hunting | 8 (100.0%) | 0 (0.0%) |
| Mining, Quarrying, & Extraction | 0 (0.0%) | 0 (0.0%) |
| Construction | 95 (79.2%) | 25 (20.8%) |
| Manufacturing | 21 (72.4%) | 8 (27.6%) |
| Wholesale Trade | 42 (100.0%) | 0 (0.0%) |
| Retail Trade | 146 (40.8%) | 212 (59.2%) |
| Transportation & Warehousing | 63 (100.0%) | 0 (0.0%) |
| Utilities | 0 (0.0%) | 30 (100.0%) |
| Information | 49 (76.6%) | 15 (23.4%) |
| Finance & Insurance | 195 (80.2%) | 48 (19.8%) |
| Real Estate, Rental & Leasing | 45 (54.2%) | 38 (45.8%) |
| Professional & Scientific | 414 (74.9%) | 139 (25.1%) |
| Enterprise Management | 0 (0.0%) | 0 (0.0%) |
| Administrative & Support | 0 (0.0%) | 28 (100.0%) |
| Educational Services | 56 (27.2%) | 150 (72.8%) |
| Health Care & Social Assistance | 41 (20.9%) | 155 (79.1%) |
| Arts, Entertainment & Recreation | 8 (50.0%) | 8 (50.0%) |
| Accommodation & Food Services | 0 (0.0%) | 11 (100.0%) |
| Public Administration | 27 (71.1%) | 11 (28.9%) |
| Total | 1,253 (56.5%) | 964 (43.5%) |
Education in Demarest borough
School Enrollment in Demarest borough
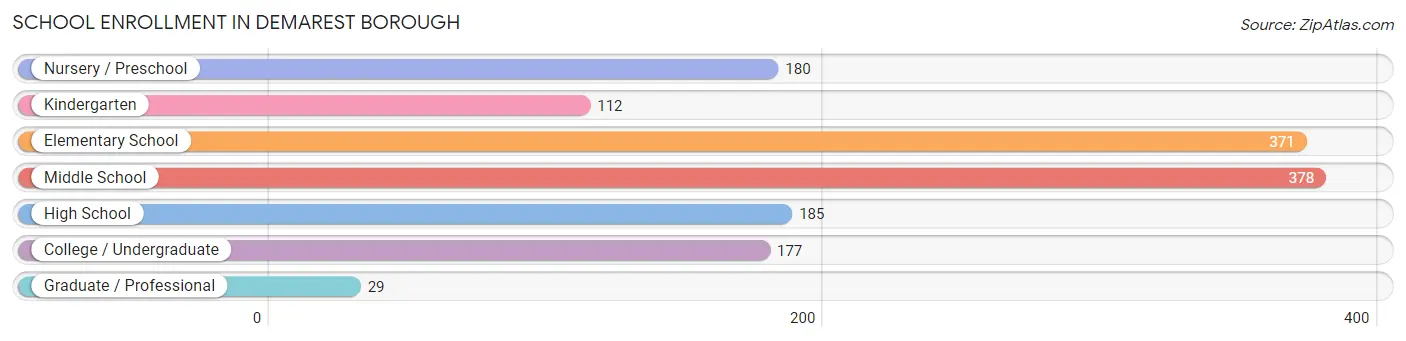
The most common levels of schooling among the 1,432 students in Demarest borough are middle school (378 | 26.4%), elementary school (371 | 25.9%), and high school (185 | 12.9%).
| School Level | # Students | % Students |
| Nursery / Preschool | 180 | 12.6% |
| Kindergarten | 112 | 7.8% |
| Elementary School | 371 | 25.9% |
| Middle School | 378 | 26.4% |
| High School | 185 | 12.9% |
| College / Undergraduate | 177 | 12.4% |
| Graduate / Professional | 29 | 2.0% |
| Total | 1,432 | 100.0% |
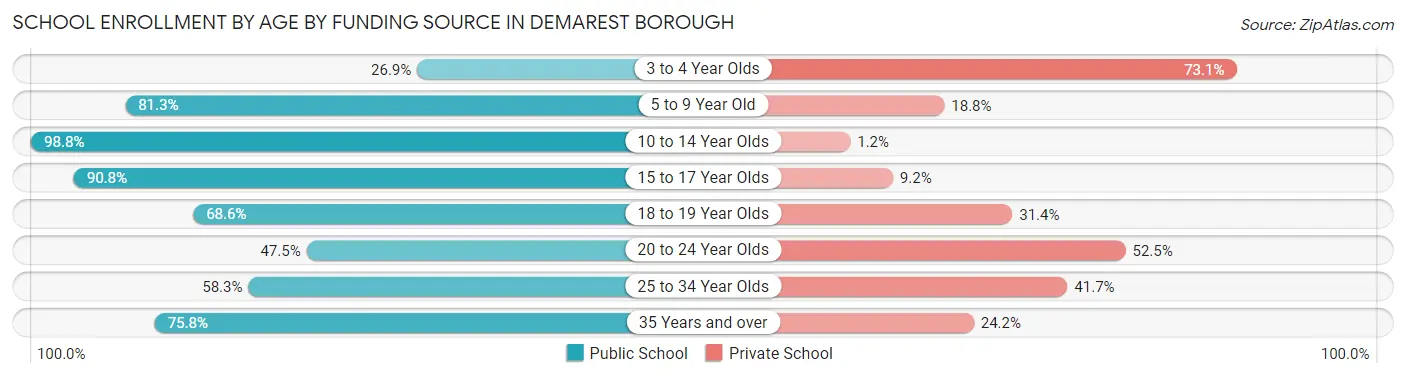
School Enrollment by Age by Funding Source in Demarest borough
Out of a total of 1,432 students who are enrolled in schools in Demarest borough, 288 (20.1%) attend a private institution, while the remaining 1,144 (79.9%) are enrolled in public schools. The age group of 3 to 4 year olds has the highest likelihood of being enrolled in private schools, with 87 (73.1% in the age bracket) enrolled. Conversely, the age group of 10 to 14 year olds has the lowest likelihood of being enrolled in a private school, with 403 (98.8% in the age bracket) attending a public institution.
| Age Bracket | Public School | Private School |
| 3 to 4 Year Olds | 32 (26.9%) | 87 (73.1%) |
| 5 to 9 Year Old | 442 (81.2%) | 102 (18.8%) |
| 10 to 14 Year Olds | 403 (98.8%) | 5 (1.2%) |
| 15 to 17 Year Olds | 109 (90.8%) | 11 (9.2%) |
| 18 to 19 Year Olds | 107 (68.6%) | 49 (31.4%) |
| 20 to 24 Year Olds | 19 (47.5%) | 21 (52.5%) |
| 25 to 34 Year Olds | 7 (58.3%) | 5 (41.7%) |
| 35 Years and over | 25 (75.8%) | 8 (24.2%) |
| Total | 1,144 (79.9%) | 288 (20.1%) |
Educational Attainment by Field of Study in Demarest borough
Business (432 | 16.7%), engineering (331 | 12.8%), social sciences (313 | 12.1%), literature & languages (283 | 10.9%), and computers & mathematics (219 | 8.5%) are the most common fields of study among 2,586 individuals in Demarest borough who have obtained a bachelor's degree or higher.
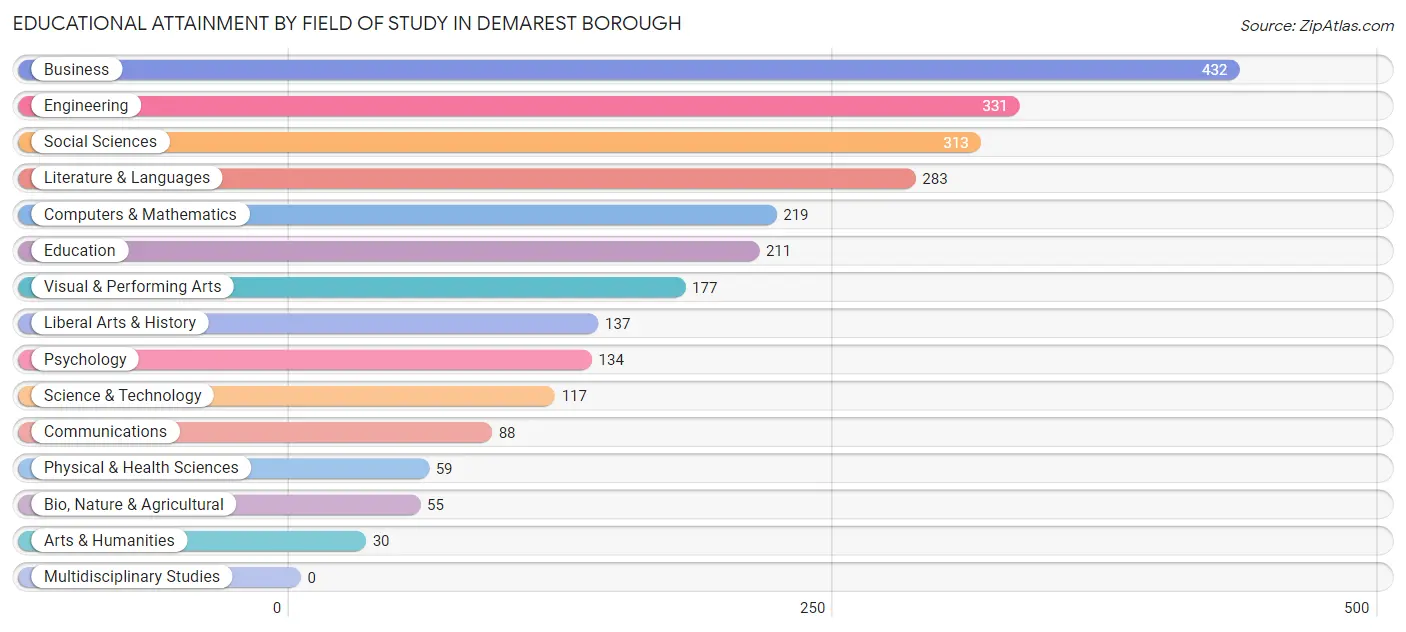
| Field of Study | # Graduates | % Graduates |
| Computers & Mathematics | 219 | 8.5% |
| Bio, Nature & Agricultural | 55 | 2.1% |
| Physical & Health Sciences | 59 | 2.3% |
| Psychology | 134 | 5.2% |
| Social Sciences | 313 | 12.1% |
| Engineering | 331 | 12.8% |
| Multidisciplinary Studies | 0 | 0.0% |
| Science & Technology | 117 | 4.5% |
| Business | 432 | 16.7% |
| Education | 211 | 8.2% |
| Literature & Languages | 283 | 10.9% |
| Liberal Arts & History | 137 | 5.3% |
| Visual & Performing Arts | 177 | 6.8% |
| Communications | 88 | 3.4% |
| Arts & Humanities | 30 | 1.2% |
| Total | 2,586 | 100.0% |
Transportation & Commute in Demarest borough
Vehicle Availability by Sex in Demarest borough
The most prevalent vehicle ownership categories in Demarest borough are males with 2 vehicles (678, accounting for 55.5%) and females with 2 vehicles (561, making up 71.1%).
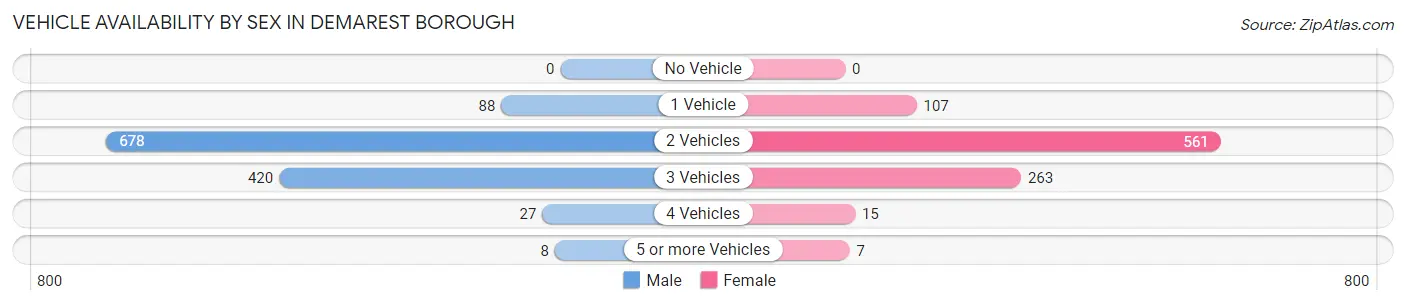
| Vehicles Available | Male | Female |
| No Vehicle | 0 (0.0%) | 0 (0.0%) |
| 1 Vehicle | 88 (7.2%) | 107 (11.2%) |
| 2 Vehicles | 678 (55.5%) | 561 (58.9%) |
| 3 Vehicles | 420 (34.4%) | 263 (27.6%) |
| 4 Vehicles | 27 (2.2%) | 15 (1.6%) |
| 5 or more Vehicles | 8 (0.7%) | 7 (0.7%) |
| Total | 1,221 (100.0%) | 953 (100.0%) |
Commute Time in Demarest borough
The most frequently occuring commute durations in Demarest borough are 60 to 89 minutes (308 commuters, 18.1%), 30 to 34 minutes (276 commuters, 16.3%), and 15 to 19 minutes (214 commuters, 12.6%).
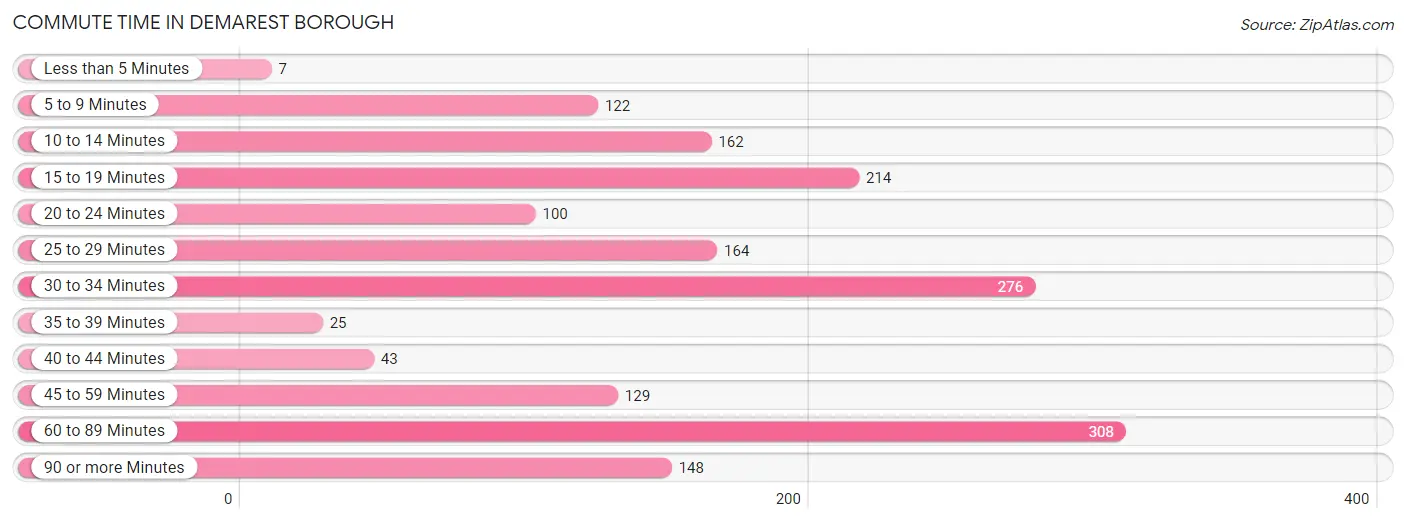
| Commute Time | # Commuters | % Commuters |
| Less than 5 Minutes | 7 | 0.4% |
| 5 to 9 Minutes | 122 | 7.2% |
| 10 to 14 Minutes | 162 | 9.5% |
| 15 to 19 Minutes | 214 | 12.6% |
| 20 to 24 Minutes | 100 | 5.9% |
| 25 to 29 Minutes | 164 | 9.7% |
| 30 to 34 Minutes | 276 | 16.3% |
| 35 to 39 Minutes | 25 | 1.5% |
| 40 to 44 Minutes | 43 | 2.5% |
| 45 to 59 Minutes | 129 | 7.6% |
| 60 to 89 Minutes | 308 | 18.1% |
| 90 or more Minutes | 148 | 8.7% |
Commute Time by Sex in Demarest borough
The most common commute times in Demarest borough are 30 to 34 minutes (157 commuters, 16.0%) for males and 60 to 89 minutes (178 commuters, 24.8%) for females.
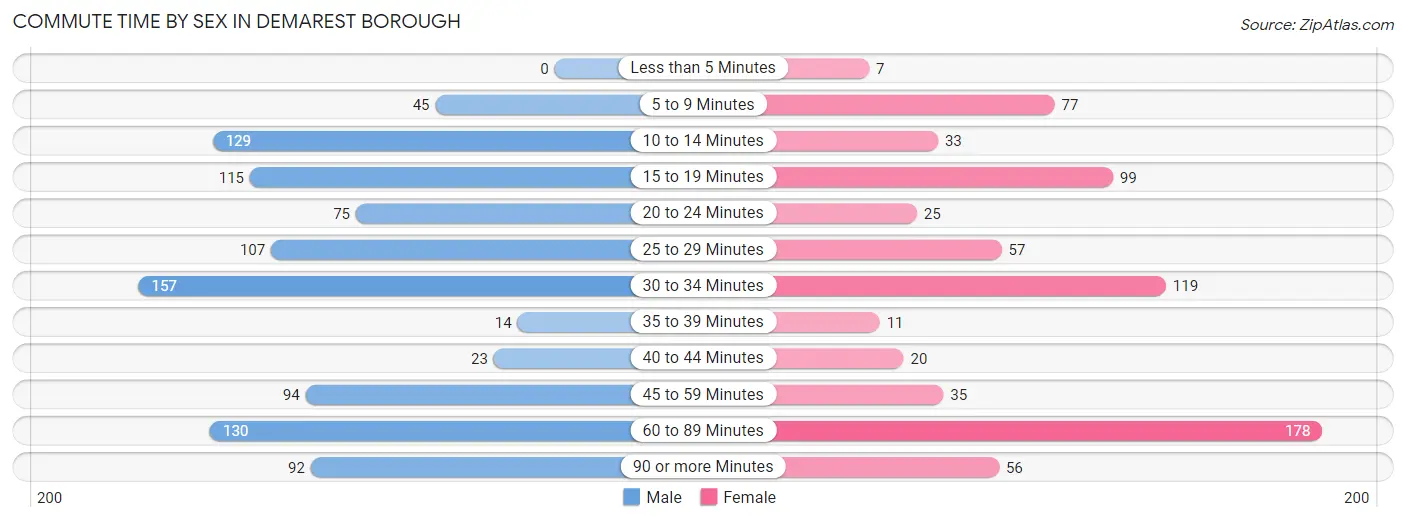
| Commute Time | Male | Female |
| Less than 5 Minutes | 0 (0.0%) | 7 (1.0%) |
| 5 to 9 Minutes | 45 (4.6%) | 77 (10.7%) |
| 10 to 14 Minutes | 129 (13.2%) | 33 (4.6%) |
| 15 to 19 Minutes | 115 (11.7%) | 99 (13.8%) |
| 20 to 24 Minutes | 75 (7.6%) | 25 (3.5%) |
| 25 to 29 Minutes | 107 (10.9%) | 57 (8.0%) |
| 30 to 34 Minutes | 157 (16.0%) | 119 (16.6%) |
| 35 to 39 Minutes | 14 (1.4%) | 11 (1.5%) |
| 40 to 44 Minutes | 23 (2.3%) | 20 (2.8%) |
| 45 to 59 Minutes | 94 (9.6%) | 35 (4.9%) |
| 60 to 89 Minutes | 130 (13.3%) | 178 (24.8%) |
| 90 or more Minutes | 92 (9.4%) | 56 (7.8%) |
Time of Departure to Work by Sex in Demarest borough
The most frequent times of departure to work in Demarest borough are 8:00 AM to 8:29 AM (235, 24.0%) for males and 7:00 AM to 7:29 AM (109, 15.2%) for females.
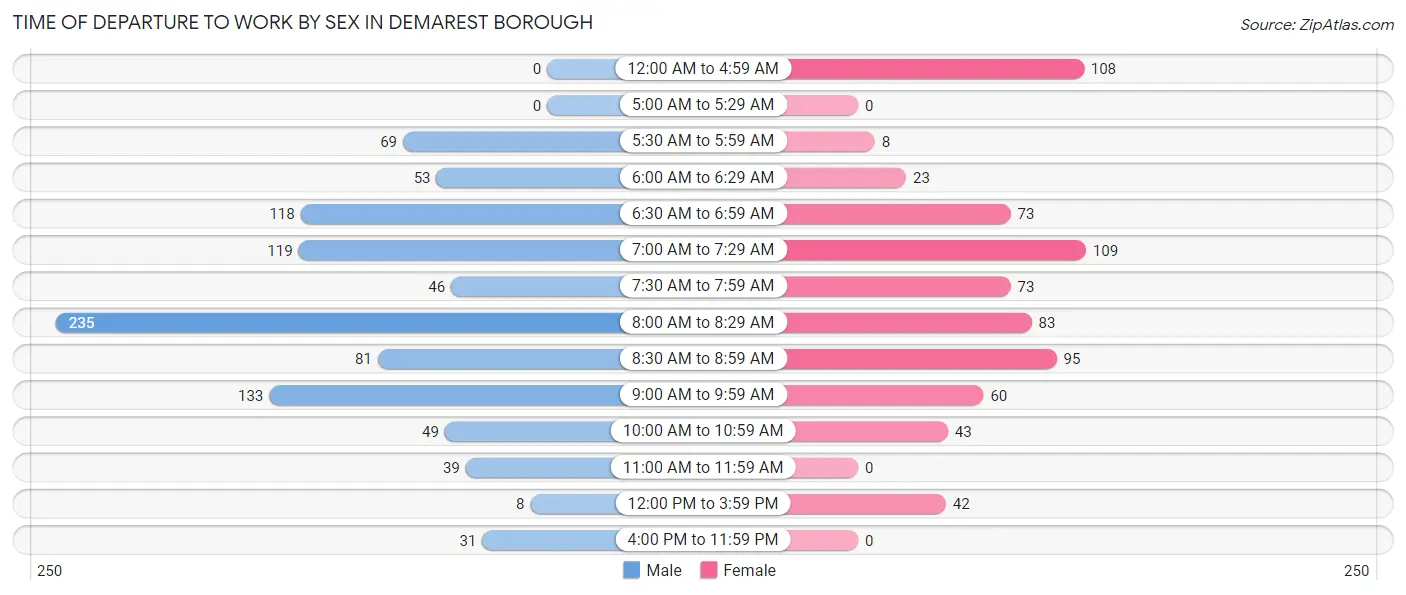
| Time of Departure | Male | Female |
| 12:00 AM to 4:59 AM | 0 (0.0%) | 108 (15.1%) |
| 5:00 AM to 5:29 AM | 0 (0.0%) | 0 (0.0%) |
| 5:30 AM to 5:59 AM | 69 (7.0%) | 8 (1.1%) |
| 6:00 AM to 6:29 AM | 53 (5.4%) | 23 (3.2%) |
| 6:30 AM to 6:59 AM | 118 (12.0%) | 73 (10.2%) |
| 7:00 AM to 7:29 AM | 119 (12.1%) | 109 (15.2%) |
| 7:30 AM to 7:59 AM | 46 (4.7%) | 73 (10.2%) |
| 8:00 AM to 8:29 AM | 235 (24.0%) | 83 (11.6%) |
| 8:30 AM to 8:59 AM | 81 (8.3%) | 95 (13.3%) |
| 9:00 AM to 9:59 AM | 133 (13.6%) | 60 (8.4%) |
| 10:00 AM to 10:59 AM | 49 (5.0%) | 43 (6.0%) |
| 11:00 AM to 11:59 AM | 39 (4.0%) | 0 (0.0%) |
| 12:00 PM to 3:59 PM | 8 (0.8%) | 42 (5.9%) |
| 4:00 PM to 11:59 PM | 31 (3.2%) | 0 (0.0%) |
| Total | 981 (100.0%) | 717 (100.0%) |
Housing Occupancy in Demarest borough
Occupancy by Ownership in Demarest borough
Of the total 1,690 dwellings in Demarest borough, owner-occupied units account for 1,437 (85.0%), while renter-occupied units make up 253 (15.0%).
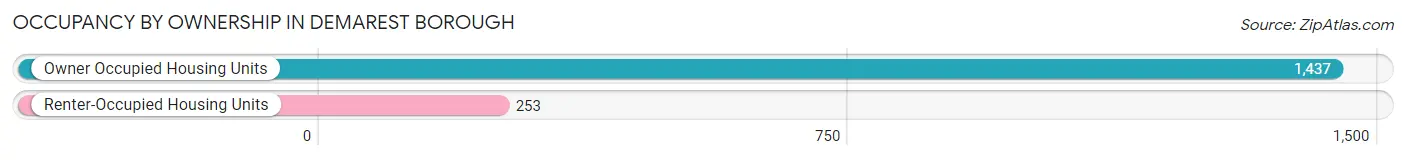
| Occupancy | # Housing Units | % Housing Units |
| Owner Occupied Housing Units | 1,437 | 85.0% |
| Renter-Occupied Housing Units | 253 | 15.0% |
| Total Occupied Housing Units | 1,690 | 100.0% |
Occupancy by Household Size in Demarest borough
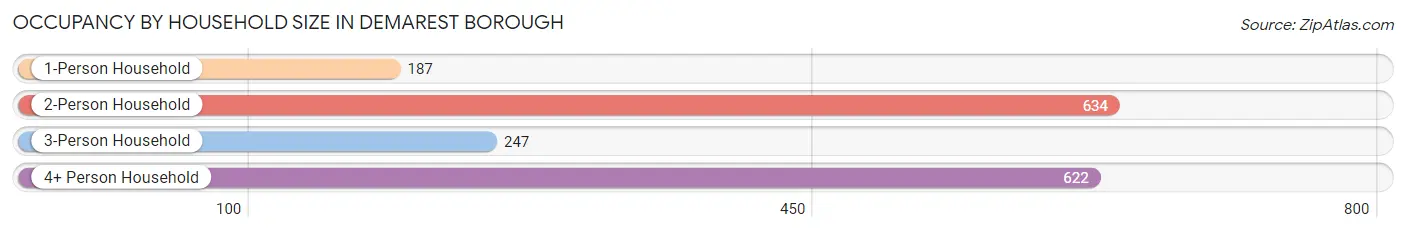
| Household Size | # Housing Units | % Housing Units |
| 1-Person Household | 187 | 11.1% |
| 2-Person Household | 634 | 37.5% |
| 3-Person Household | 247 | 14.6% |
| 4+ Person Household | 622 | 36.8% |
| Total Housing Units | 1,690 | 100.0% |
Occupancy by Ownership by Household Size in Demarest borough
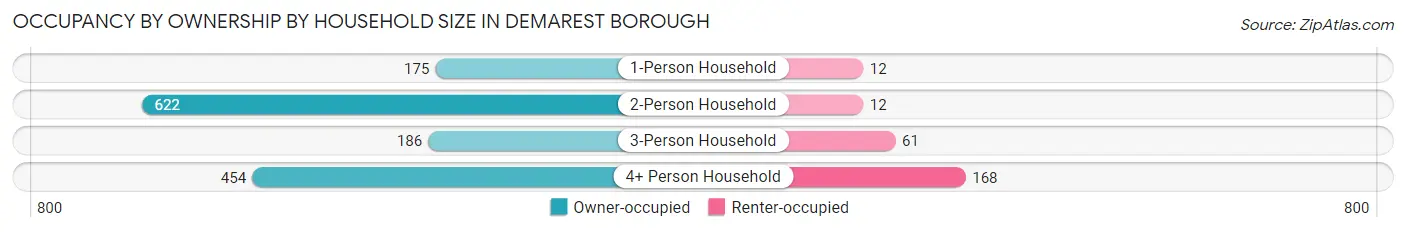
| Household Size | Owner-occupied | Renter-occupied |
| 1-Person Household | 175 (93.6%) | 12 (6.4%) |
| 2-Person Household | 622 (98.1%) | 12 (1.9%) |
| 3-Person Household | 186 (75.3%) | 61 (24.7%) |
| 4+ Person Household | 454 (73.0%) | 168 (27.0%) |
| Total Housing Units | 1,437 (85.0%) | 253 (15.0%) |
Occupancy by Educational Attainment in Demarest borough
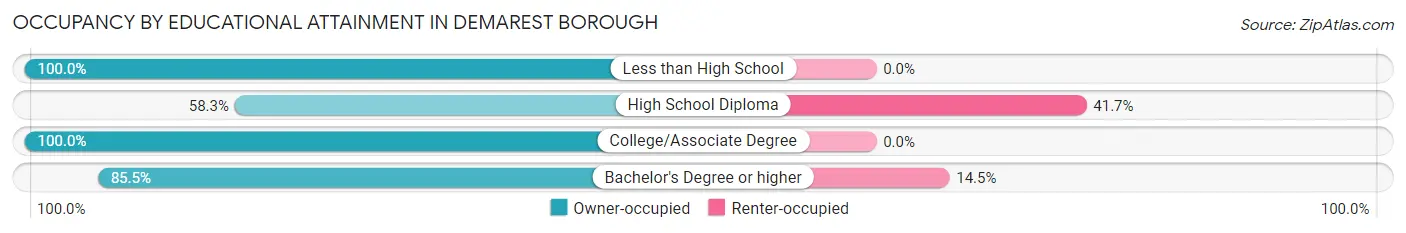
| Household Size | Owner-occupied | Renter-occupied |
| Less than High School | 8 (100.0%) | 0 (0.0%) |
| High School Diploma | 70 (58.3%) | 50 (41.7%) |
| College/Associate Degree | 162 (100.0%) | 0 (0.0%) |
| Bachelor's Degree or higher | 1,197 (85.5%) | 203 (14.5%) |
Occupancy by Age of Householder in Demarest borough
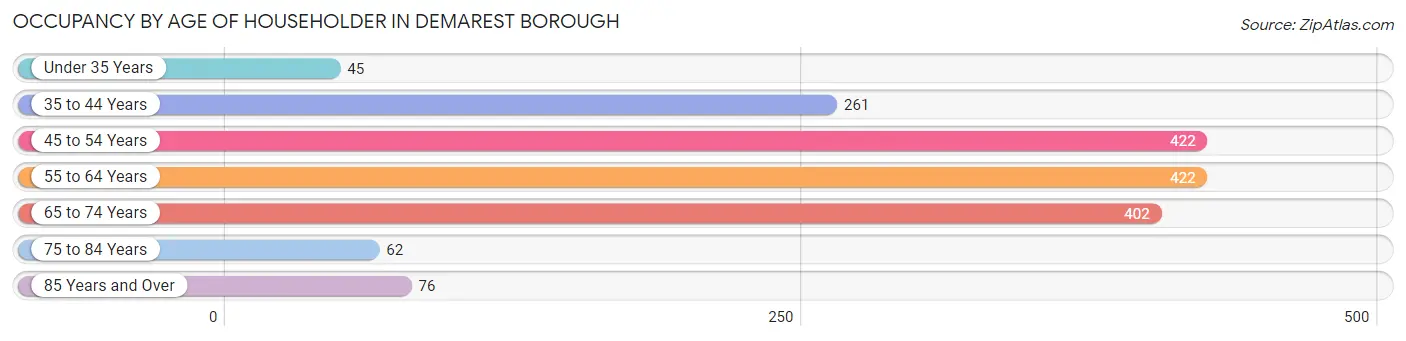
| Age Bracket | # Households | % Households |
| Under 35 Years | 45 | 2.7% |
| 35 to 44 Years | 261 | 15.4% |
| 45 to 54 Years | 422 | 25.0% |
| 55 to 64 Years | 422 | 25.0% |
| 65 to 74 Years | 402 | 23.8% |
| 75 to 84 Years | 62 | 3.7% |
| 85 Years and Over | 76 | 4.5% |
| Total | 1,690 | 100.0% |
Housing Finances in Demarest borough
Median Income by Occupancy in Demarest borough
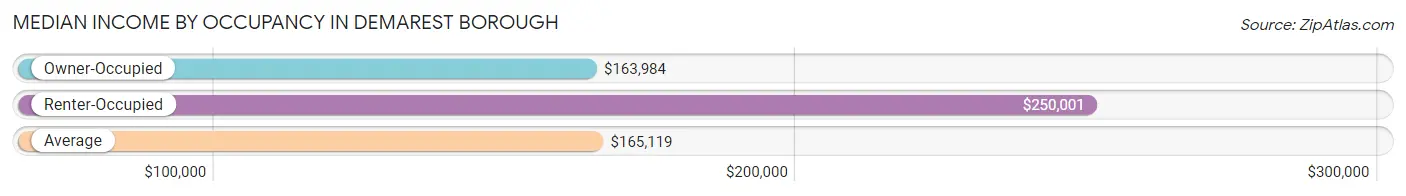
| Occupancy Type | # Households | Median Income |
| Owner-Occupied | 1,437 (85.0%) | $163,984 |
| Renter-Occupied | 253 (15.0%) | $250,001 |
| Average | 1,690 (100.0%) | $165,119 |
Occupancy by Householder Income Bracket in Demarest borough
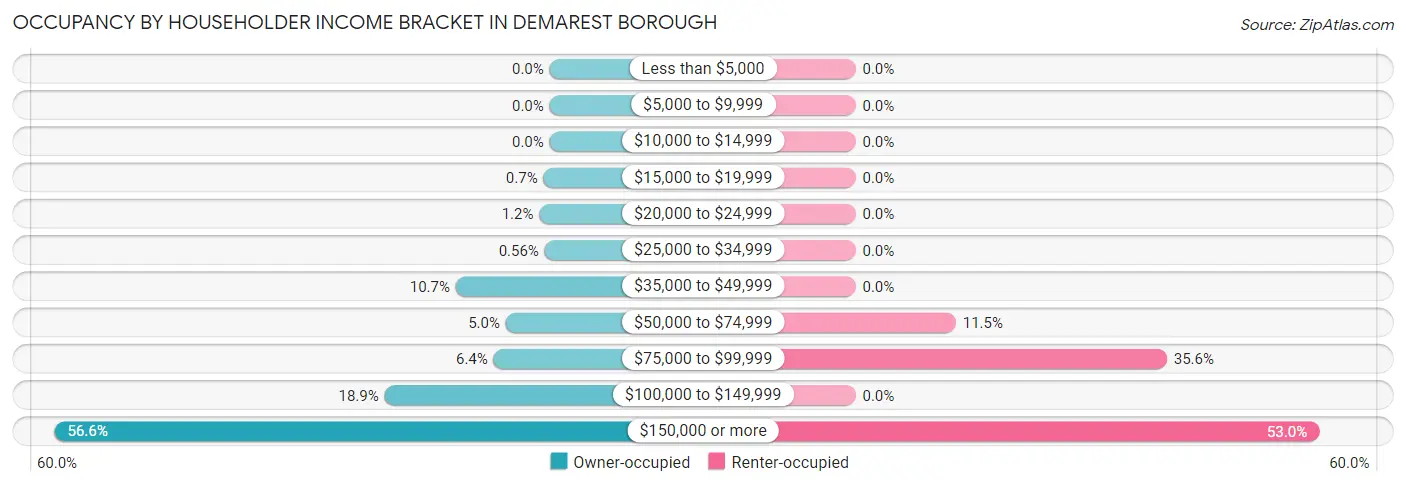
| Income Bracket | Owner-occupied | Renter-occupied |
| Less than $5,000 | 0 (0.0%) | 0 (0.0%) |
| $5,000 to $9,999 | 0 (0.0%) | 0 (0.0%) |
| $10,000 to $14,999 | 0 (0.0%) | 0 (0.0%) |
| $15,000 to $19,999 | 10 (0.7%) | 0 (0.0%) |
| $20,000 to $24,999 | 17 (1.2%) | 0 (0.0%) |
| $25,000 to $34,999 | 8 (0.6%) | 0 (0.0%) |
| $35,000 to $49,999 | 154 (10.7%) | 0 (0.0%) |
| $50,000 to $74,999 | 72 (5.0%) | 29 (11.5%) |
| $75,000 to $99,999 | 92 (6.4%) | 90 (35.6%) |
| $100,000 to $149,999 | 271 (18.9%) | 0 (0.0%) |
| $150,000 or more | 813 (56.6%) | 134 (53.0%) |
| Total | 1,437 (100.0%) | 253 (100.0%) |
Monthly Housing Cost Tiers in Demarest borough
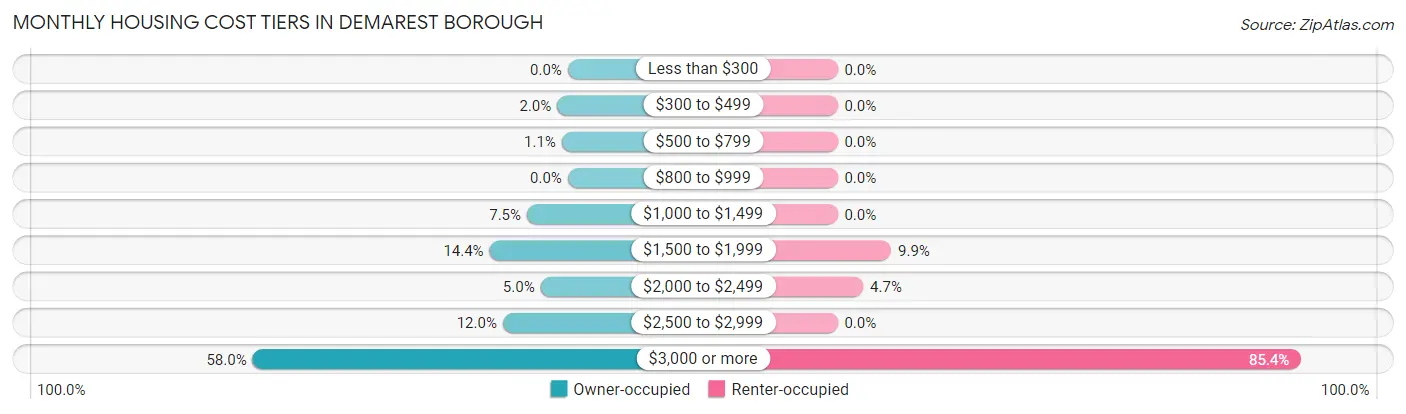
| Monthly Cost | Owner-occupied | Renter-occupied |
| Less than $300 | 0 (0.0%) | 0 (0.0%) |
| $300 to $499 | 28 (1.9%) | 0 (0.0%) |
| $500 to $799 | 16 (1.1%) | 0 (0.0%) |
| $800 to $999 | 0 (0.0%) | 0 (0.0%) |
| $1,000 to $1,499 | 108 (7.5%) | 0 (0.0%) |
| $1,500 to $1,999 | 207 (14.4%) | 25 (9.9%) |
| $2,000 to $2,499 | 72 (5.0%) | 12 (4.7%) |
| $2,500 to $2,999 | 172 (12.0%) | 0 (0.0%) |
| $3,000 or more | 834 (58.0%) | 216 (85.4%) |
| Total | 1,437 (100.0%) | 253 (100.0%) |
Physical Housing Characteristics in Demarest borough
Housing Structures in Demarest borough
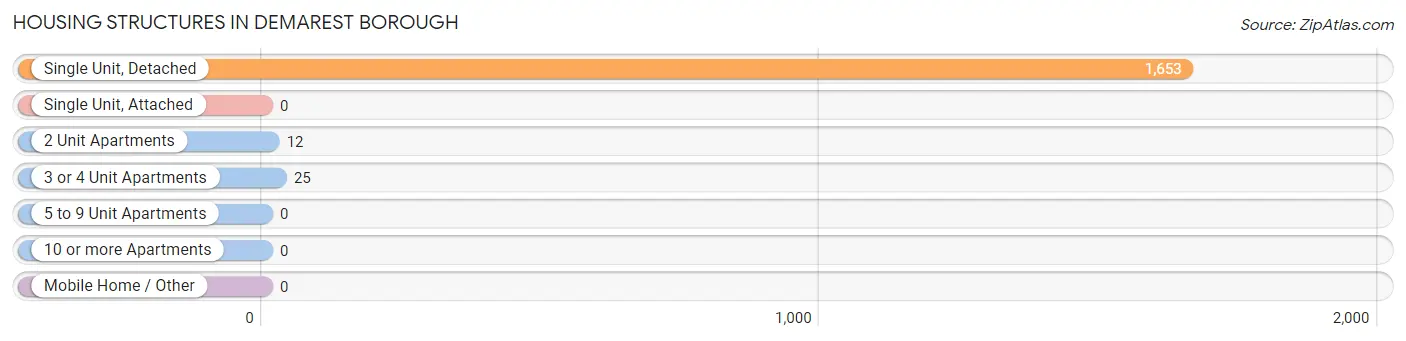
| Structure Type | # Housing Units | % Housing Units |
| Single Unit, Detached | 1,653 | 97.8% |
| Single Unit, Attached | 0 | 0.0% |
| 2 Unit Apartments | 12 | 0.7% |
| 3 or 4 Unit Apartments | 25 | 1.5% |
| 5 to 9 Unit Apartments | 0 | 0.0% |
| 10 or more Apartments | 0 | 0.0% |
| Mobile Home / Other | 0 | 0.0% |
| Total | 1,690 | 100.0% |
Housing Structures by Occupancy in Demarest borough
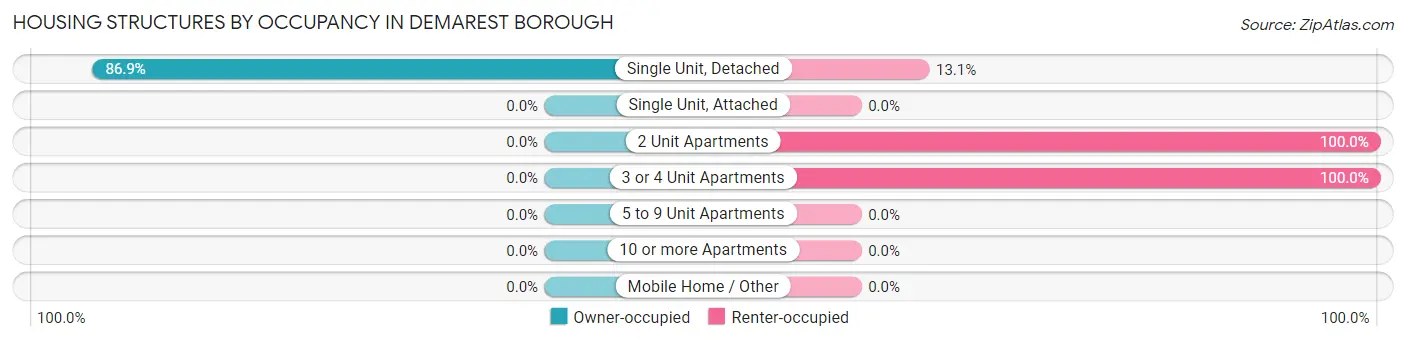
| Structure Type | Owner-occupied | Renter-occupied |
| Single Unit, Detached | 1,437 (86.9%) | 216 (13.1%) |
| Single Unit, Attached | 0 (0.0%) | 0 (0.0%) |
| 2 Unit Apartments | 0 (0.0%) | 12 (100.0%) |
| 3 or 4 Unit Apartments | 0 (0.0%) | 25 (100.0%) |
| 5 to 9 Unit Apartments | 0 (0.0%) | 0 (0.0%) |
| 10 or more Apartments | 0 (0.0%) | 0 (0.0%) |
| Mobile Home / Other | 0 (0.0%) | 0 (0.0%) |
| Total | 1,437 (85.0%) | 253 (15.0%) |
Housing Structures by Number of Rooms in Demarest borough
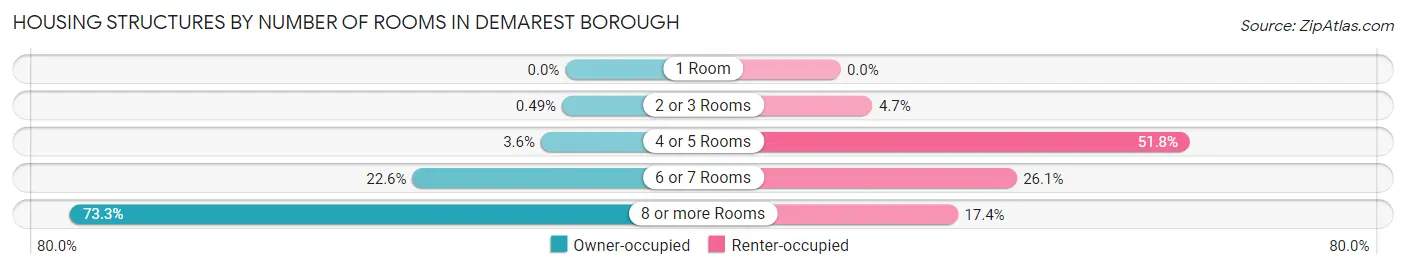
| Number of Rooms | Owner-occupied | Renter-occupied |
| 1 Room | 0 (0.0%) | 0 (0.0%) |
| 2 or 3 Rooms | 7 (0.5%) | 12 (4.7%) |
| 4 or 5 Rooms | 52 (3.6%) | 131 (51.8%) |
| 6 or 7 Rooms | 325 (22.6%) | 66 (26.1%) |
| 8 or more Rooms | 1,053 (73.3%) | 44 (17.4%) |
| Total | 1,437 (100.0%) | 253 (100.0%) |
Housing Structure by Heating Type in Demarest borough
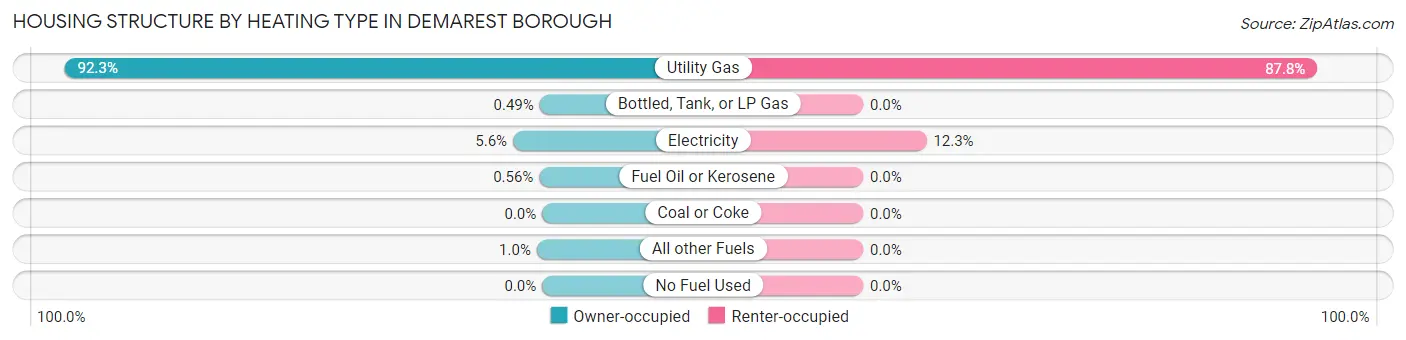
| Heating Type | Owner-occupied | Renter-occupied |
| Utility Gas | 1,326 (92.3%) | 222 (87.7%) |
| Bottled, Tank, or LP Gas | 7 (0.5%) | 0 (0.0%) |
| Electricity | 81 (5.6%) | 31 (12.2%) |
| Fuel Oil or Kerosene | 8 (0.6%) | 0 (0.0%) |
| Coal or Coke | 0 (0.0%) | 0 (0.0%) |
| All other Fuels | 15 (1.0%) | 0 (0.0%) |
| No Fuel Used | 0 (0.0%) | 0 (0.0%) |
| Total | 1,437 (100.0%) | 253 (100.0%) |
Household Vehicle Usage in Demarest borough
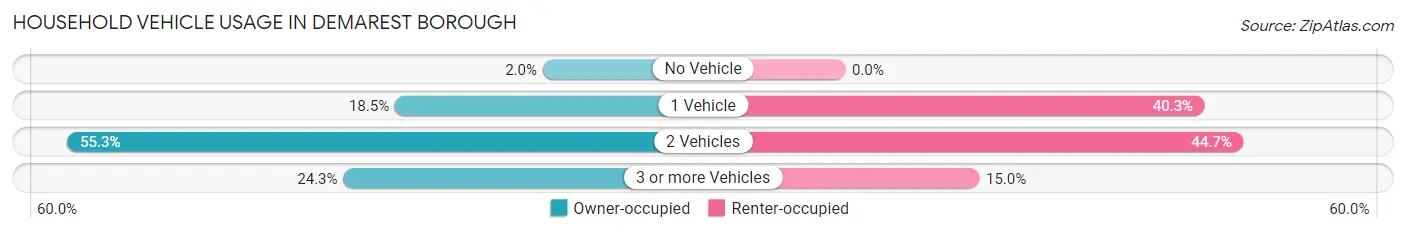
| Vehicles per Household | Owner-occupied | Renter-occupied |
| No Vehicle | 28 (1.9%) | 0 (0.0%) |
| 1 Vehicle | 266 (18.5%) | 102 (40.3%) |
| 2 Vehicles | 794 (55.2%) | 113 (44.7%) |
| 3 or more Vehicles | 349 (24.3%) | 38 (15.0%) |
| Total | 1,437 (100.0%) | 253 (100.0%) |
Real Estate & Mortgages in Demarest borough
Real Estate and Mortgage Overview in Demarest borough
| Characteristic | Without Mortgage | With Mortgage |
| Housing Units | 565 | 872 |
| Median Property Value | $830,600 | $1,100,000 |
| Median Household Income | $118,750 | $596 |
| Monthly Housing Costs | $1,501 | $743 |
| Real Estate Taxes | $10,001 | $4 |
Property Value by Mortgage Status in Demarest borough
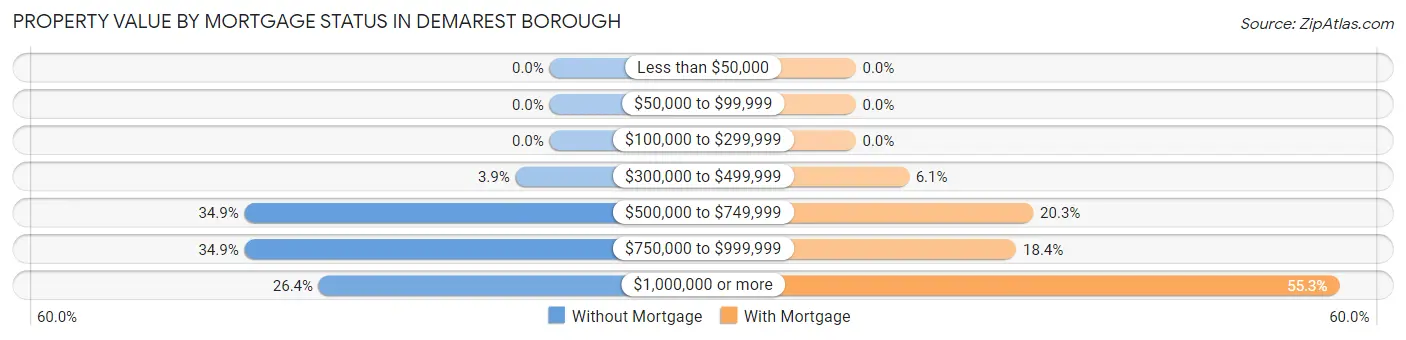
| Property Value | Without Mortgage | With Mortgage |
| Less than $50,000 | 0 (0.0%) | 0 (0.0%) |
| $50,000 to $99,999 | 0 (0.0%) | 0 (0.0%) |
| $100,000 to $299,999 | 0 (0.0%) | 0 (0.0%) |
| $300,000 to $499,999 | 22 (3.9%) | 53 (6.1%) |
| $500,000 to $749,999 | 197 (34.9%) | 177 (20.3%) |
| $750,000 to $999,999 | 197 (34.9%) | 160 (18.3%) |
| $1,000,000 or more | 149 (26.4%) | 482 (55.3%) |
| Total | 565 (100.0%) | 872 (100.0%) |
Household Income by Mortgage Status in Demarest borough
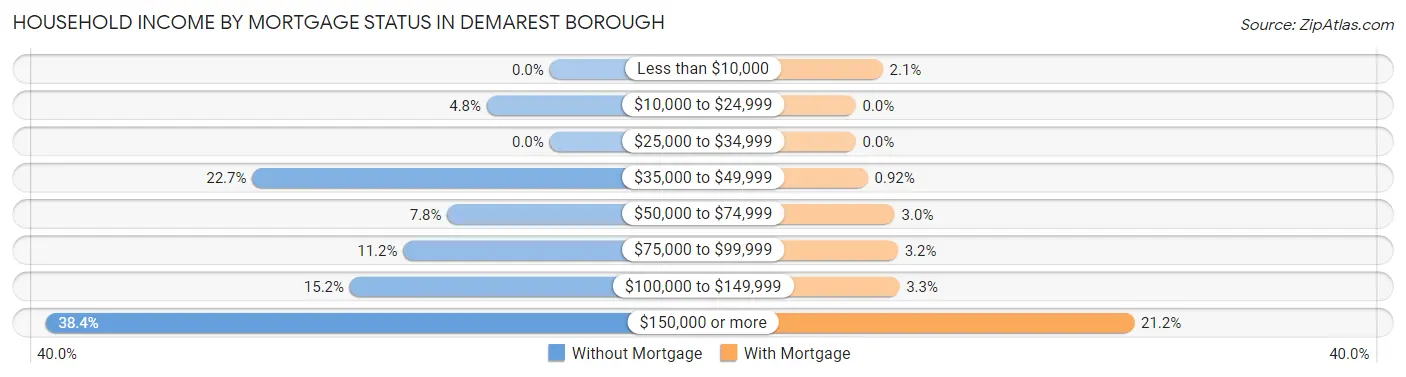
| Household Income | Without Mortgage | With Mortgage |
| Less than $10,000 | 0 (0.0%) | 18 (2.1%) |
| $10,000 to $24,999 | 27 (4.8%) | 0 (0.0%) |
| $25,000 to $34,999 | 0 (0.0%) | 0 (0.0%) |
| $35,000 to $49,999 | 128 (22.7%) | 8 (0.9%) |
| $50,000 to $74,999 | 44 (7.8%) | 26 (3.0%) |
| $75,000 to $99,999 | 63 (11.2%) | 28 (3.2%) |
| $100,000 to $149,999 | 86 (15.2%) | 29 (3.3%) |
| $150,000 or more | 217 (38.4%) | 185 (21.2%) |
| Total | 565 (100.0%) | 872 (100.0%) |
Property Value to Household Income Ratio in Demarest borough
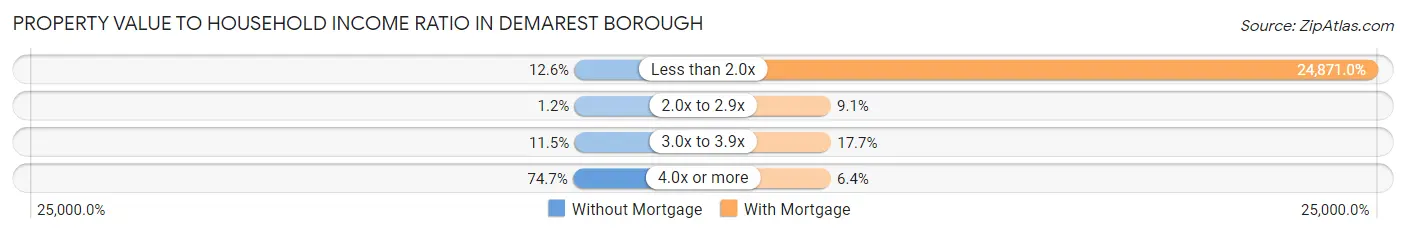
| Value-to-Income Ratio | Without Mortgage | With Mortgage |
| Less than 2.0x | 71 (12.6%) | 216,875 (24,871.0%) |
| 2.0x to 2.9x | 7 (1.2%) | 79 (9.1%) |
| 3.0x to 3.9x | 65 (11.5%) | 154 (17.7%) |
| 4.0x or more | 422 (74.7%) | 56 (6.4%) |
| Total | 565 (100.0%) | 872 (100.0%) |
Real Estate Taxes by Mortgage Status in Demarest borough
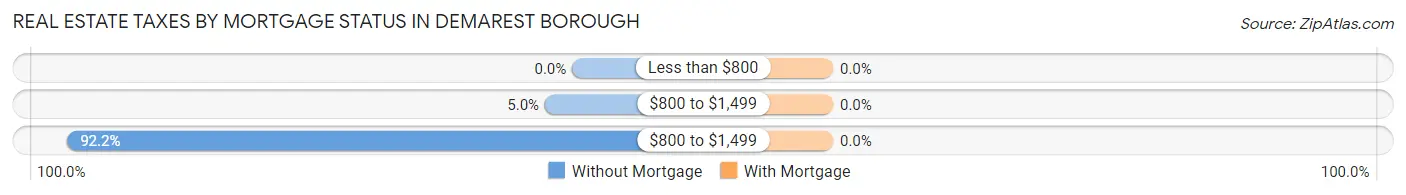
| Property Taxes | Without Mortgage | With Mortgage |
| Less than $800 | 0 (0.0%) | 0 (0.0%) |
| $800 to $1,499 | 28 (5.0%) | 0 (0.0%) |
| $800 to $1,499 | 521 (92.2%) | 0 (0.0%) |
| Total | 565 (100.0%) | 872 (100.0%) |
Health & Disability in Demarest borough
Health Insurance Coverage by Age in Demarest borough
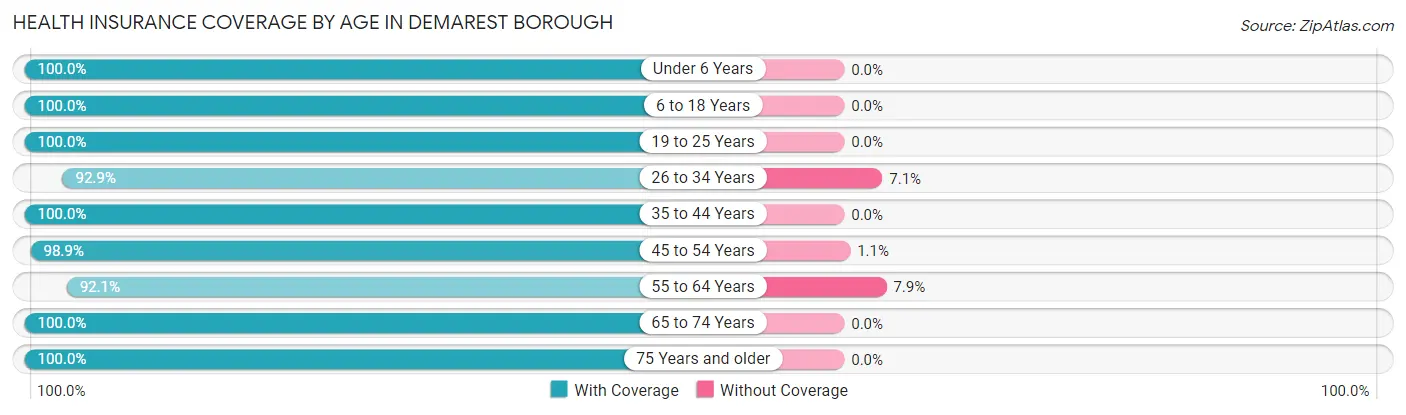
| Age Bracket | With Coverage | Without Coverage |
| Under 6 Years | 384 (100.0%) | 0 (0.0%) |
| 6 to 18 Years | 1,120 (100.0%) | 0 (0.0%) |
| 19 to 25 Years | 149 (100.0%) | 0 (0.0%) |
| 26 to 34 Years | 131 (92.9%) | 10 (7.1%) |
| 35 to 44 Years | 626 (100.0%) | 0 (0.0%) |
| 45 to 54 Years | 712 (98.9%) | 8 (1.1%) |
| 55 to 64 Years | 856 (92.1%) | 73 (7.9%) |
| 65 to 74 Years | 632 (100.0%) | 0 (0.0%) |
| 75 Years and older | 229 (100.0%) | 0 (0.0%) |
| Total | 4,839 (98.2%) | 91 (1.8%) |
Health Insurance Coverage by Citizenship Status in Demarest borough
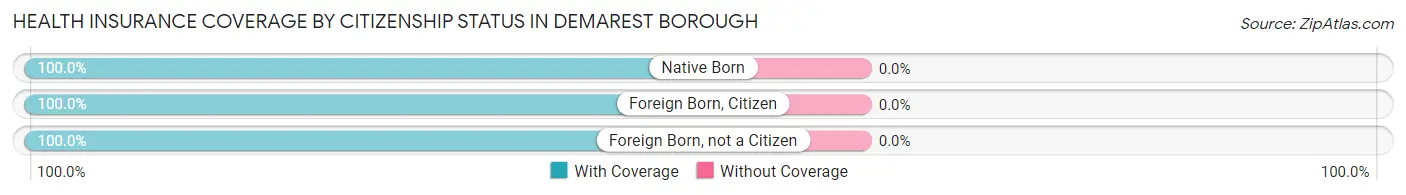
| Citizenship Status | With Coverage | Without Coverage |
| Native Born | 384 (100.0%) | 0 (0.0%) |
| Foreign Born, Citizen | 1,120 (100.0%) | 0 (0.0%) |
| Foreign Born, not a Citizen | 149 (100.0%) | 0 (0.0%) |
Health Insurance Coverage by Household Income in Demarest borough
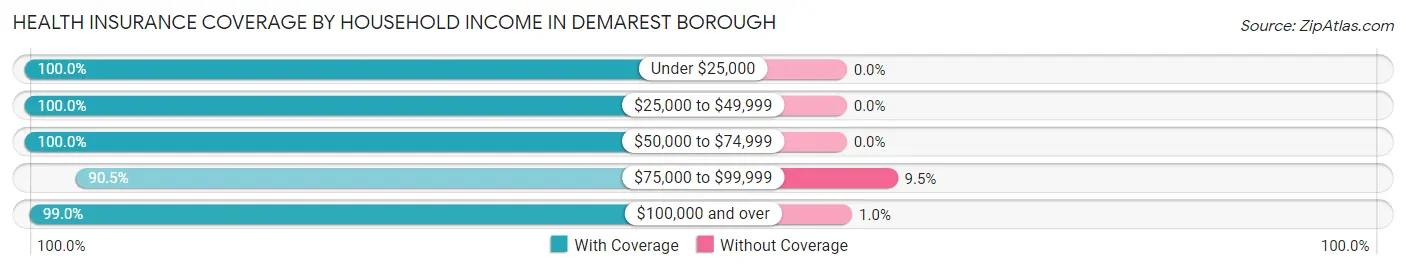
| Household Income | With Coverage | Without Coverage |
| Under $25,000 | 37 (100.0%) | 0 (0.0%) |
| $25,000 to $49,999 | 275 (100.0%) | 0 (0.0%) |
| $50,000 to $74,999 | 259 (100.0%) | 0 (0.0%) |
| $75,000 to $99,999 | 418 (90.5%) | 44 (9.5%) |
| $100,000 and over | 3,846 (99.0%) | 39 (1.0%) |
Public vs Private Health Insurance Coverage by Age in Demarest borough
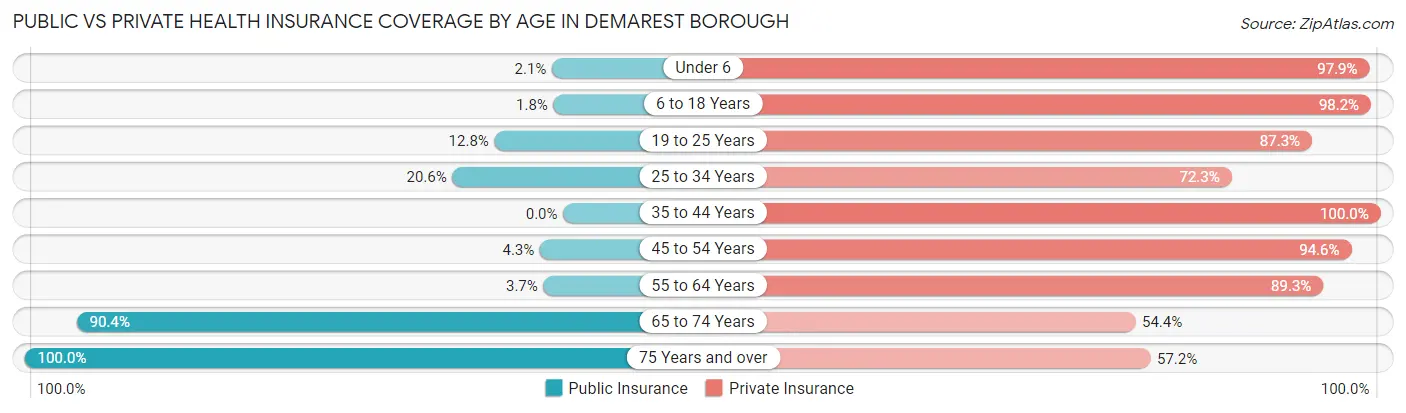
| Age Bracket | Public Insurance | Private Insurance |
| Under 6 | 8 (2.1%) | 376 (97.9%) |
| 6 to 18 Years | 20 (1.8%) | 1,100 (98.2%) |
| 19 to 25 Years | 19 (12.8%) | 130 (87.3%) |
| 25 to 34 Years | 29 (20.6%) | 102 (72.3%) |
| 35 to 44 Years | 0 (0.0%) | 626 (100.0%) |
| 45 to 54 Years | 31 (4.3%) | 681 (94.6%) |
| 55 to 64 Years | 34 (3.7%) | 830 (89.3%) |
| 65 to 74 Years | 571 (90.3%) | 344 (54.4%) |
| 75 Years and over | 229 (100.0%) | 131 (57.2%) |
| Total | 941 (19.1%) | 4,320 (87.6%) |
Disability Status by Sex by Age in Demarest borough
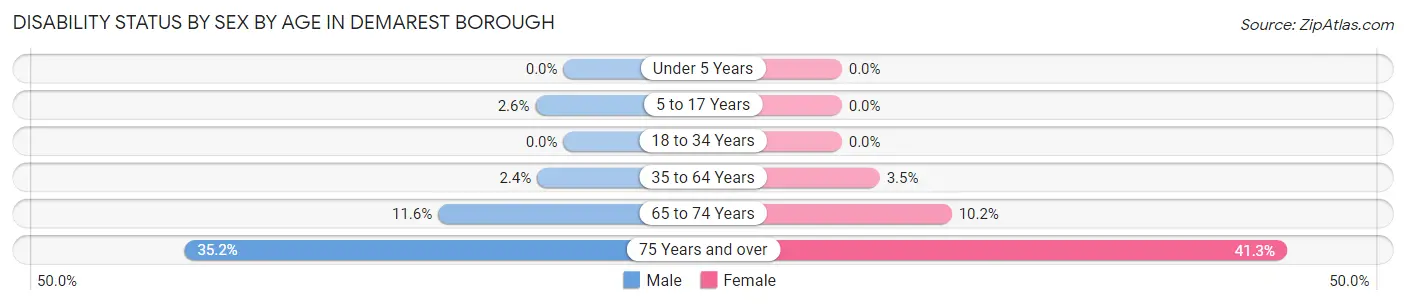
| Age Bracket | Male | Female |
| Under 5 Years | 0 (0.0%) | 0 (0.0%) |
| 5 to 17 Years | 14 (2.6%) | 0 (0.0%) |
| 18 to 34 Years | 0 (0.0%) | 0 (0.0%) |
| 35 to 64 Years | 25 (2.4%) | 44 (3.5%) |
| 65 to 74 Years | 45 (11.6%) | 25 (10.2%) |
| 75 Years and over | 32 (35.2%) | 57 (41.3%) |
Disability Class by Sex by Age in Demarest borough
Disability Class: Hearing Difficulty
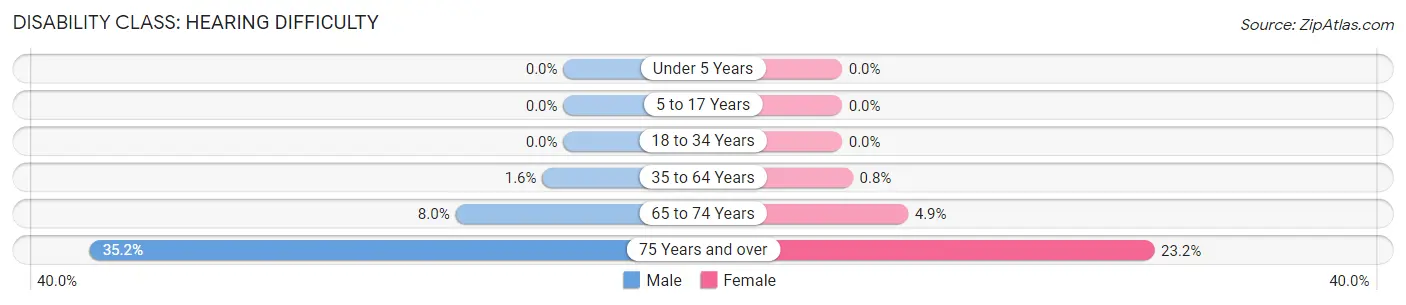
| Age Bracket | Male | Female |
| Under 5 Years | 0 (0.0%) | 0 (0.0%) |
| 5 to 17 Years | 0 (0.0%) | 0 (0.0%) |
| 18 to 34 Years | 0 (0.0%) | 0 (0.0%) |
| 35 to 64 Years | 16 (1.6%) | 10 (0.8%) |
| 65 to 74 Years | 31 (8.0%) | 12 (4.9%) |
| 75 Years and over | 32 (35.2%) | 32 (23.2%) |
Disability Class: Vision Difficulty
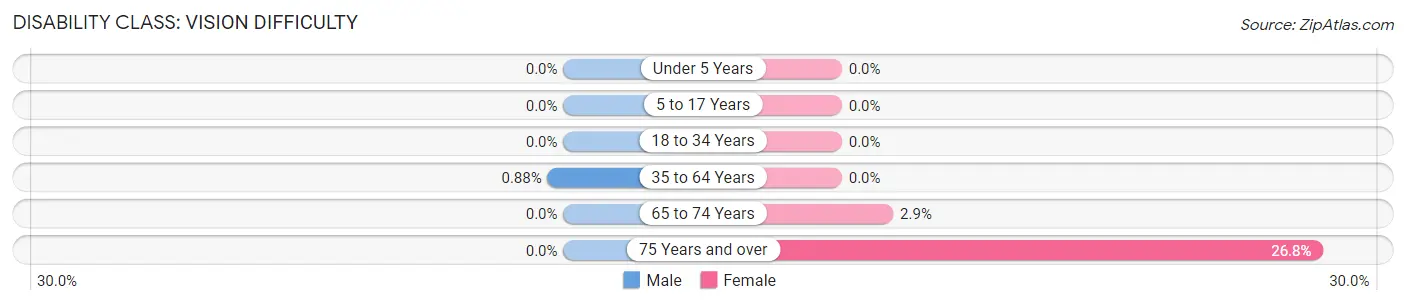
| Age Bracket | Male | Female |
| Under 5 Years | 0 (0.0%) | 0 (0.0%) |
| 5 to 17 Years | 0 (0.0%) | 0 (0.0%) |
| 18 to 34 Years | 0 (0.0%) | 0 (0.0%) |
| 35 to 64 Years | 9 (0.9%) | 0 (0.0%) |
| 65 to 74 Years | 0 (0.0%) | 7 (2.9%) |
| 75 Years and over | 0 (0.0%) | 37 (26.8%) |
Disability Class: Cognitive Difficulty
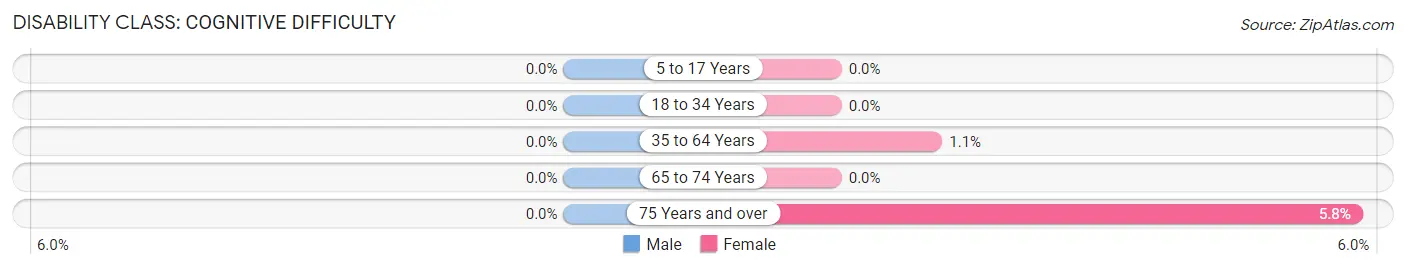
| Age Bracket | Male | Female |
| 5 to 17 Years | 0 (0.0%) | 0 (0.0%) |
| 18 to 34 Years | 0 (0.0%) | 0 (0.0%) |
| 35 to 64 Years | 0 (0.0%) | 14 (1.1%) |
| 65 to 74 Years | 0 (0.0%) | 0 (0.0%) |
| 75 Years and over | 0 (0.0%) | 8 (5.8%) |
Disability Class: Ambulatory Difficulty
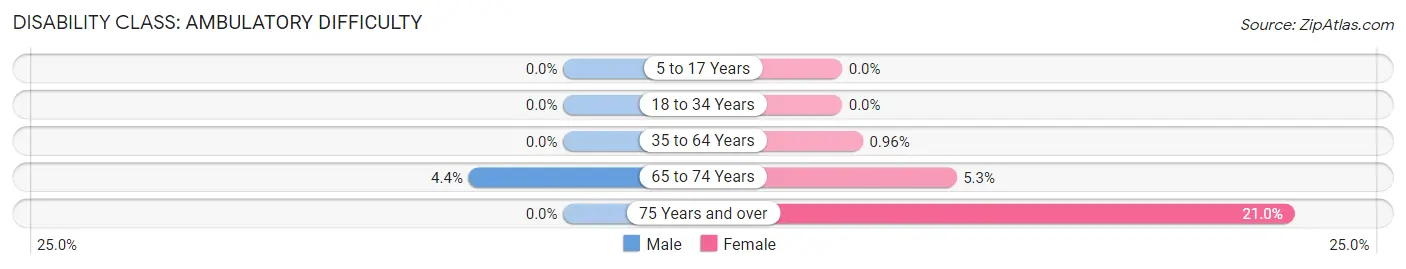
| Age Bracket | Male | Female |
| 5 to 17 Years | 0 (0.0%) | 0 (0.0%) |
| 18 to 34 Years | 0 (0.0%) | 0 (0.0%) |
| 35 to 64 Years | 0 (0.0%) | 12 (1.0%) |
| 65 to 74 Years | 17 (4.4%) | 13 (5.3%) |
| 75 Years and over | 0 (0.0%) | 29 (21.0%) |
Disability Class: Self-Care Difficulty
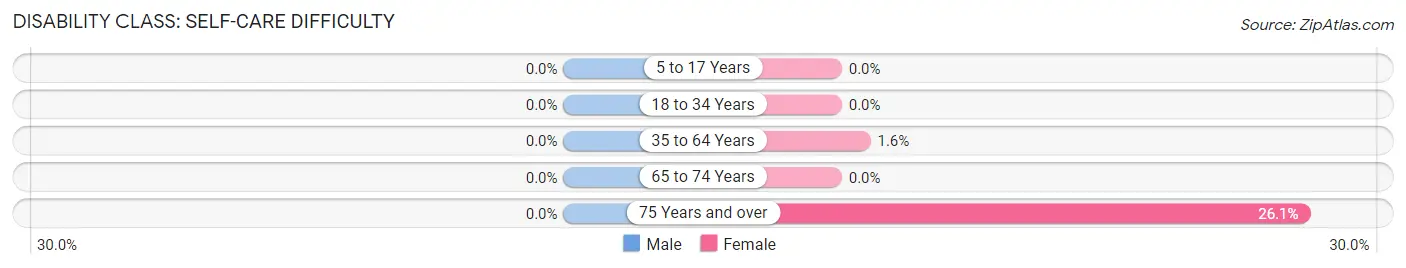
| Age Bracket | Male | Female |
| 5 to 17 Years | 0 (0.0%) | 0 (0.0%) |
| 18 to 34 Years | 0 (0.0%) | 0 (0.0%) |
| 35 to 64 Years | 0 (0.0%) | 20 (1.6%) |
| 65 to 74 Years | 0 (0.0%) | 0 (0.0%) |
| 75 Years and over | 0 (0.0%) | 36 (26.1%) |
Technology Access in Demarest borough
Computing Device Access in Demarest borough
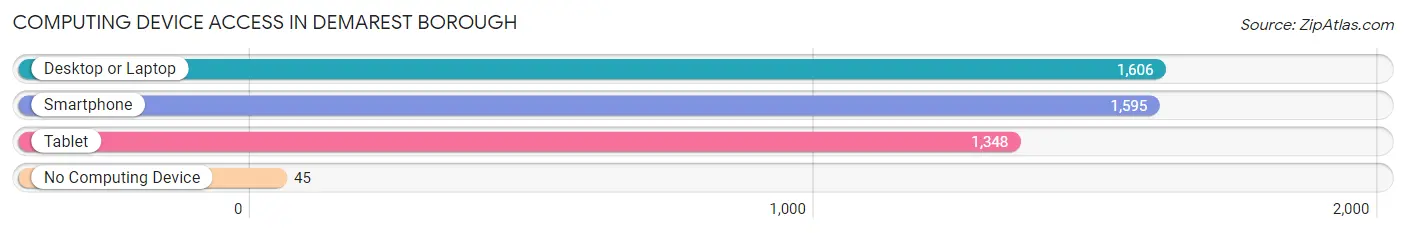
| Device Type | # Households | % Households |
| Desktop or Laptop | 1,606 | 95.0% |
| Smartphone | 1,595 | 94.4% |
| Tablet | 1,348 | 79.8% |
| No Computing Device | 45 | 2.7% |
| Total | 1,690 | 100.0% |
Internet Access in Demarest borough
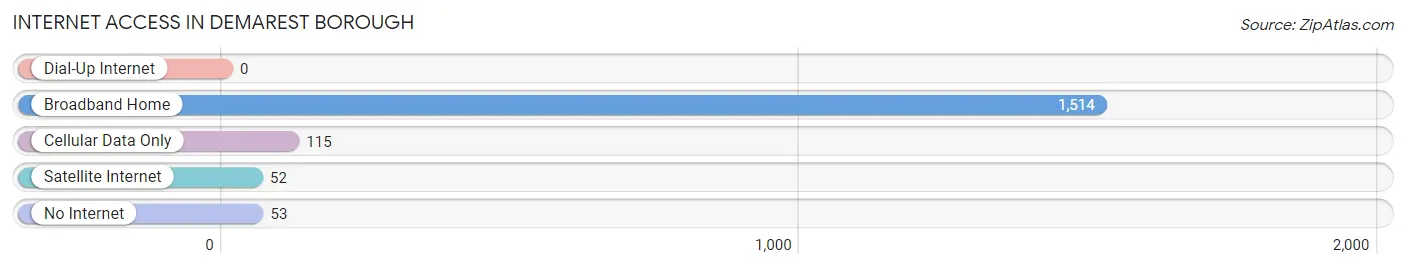
| Internet Type | # Households | % Households |
| Dial-Up Internet | 0 | 0.0% |
| Broadband Home | 1,514 | 89.6% |
| Cellular Data Only | 115 | 6.8% |
| Satellite Internet | 52 | 3.1% |
| No Internet | 53 | 3.1% |
| Total | 1,690 | 100.0% |
Demarest borough Summary
Demarest Borough is a small borough located in Bergen County, New Jersey. It is situated on the Hackensack River, just north of the George Washington Bridge. The borough was incorporated in 1894 and is home to approximately 4,000 people.
Geography
Demarest Borough is located in the northeastern corner of Bergen County, New Jersey. It is bordered by the Hackensack River to the east, the borough of Closter to the north, the borough of Haworth to the west, and the borough of Harrington Park to the south. The borough covers an area of 1.3 square miles and is located approximately 15 miles northwest of New York City.
Demarest Borough is situated on a hilly terrain, with elevations ranging from sea level to over 200 feet. The borough is home to several parks, including the Demarest Nature Center, which offers a variety of outdoor activities, including hiking, fishing, and bird watching.
Demarest Borough is served by the New Jersey Transit bus system, which provides service to New York City and other nearby towns. The borough is also served by the Pascack Valley Line of the NJ Transit rail system, which provides service to Hoboken and Secaucus.
History
Demarest Borough was originally part of Harrington Township, which was established in 1775. In 1894, the borough was incorporated as its own municipality. The borough was named after the Demarest family, who were among the first settlers in the area.
The borough was primarily a rural farming community until the early 20th century, when the population began to grow rapidly. The borough experienced a period of rapid growth in the 1950s and 1960s, when many new homes were built.
Economy
Demarest Borough has a diverse economy, with a mix of retail, manufacturing, and service businesses. The borough is home to several large employers, including the Demarest Manufacturing Company, which produces industrial machinery, and the Demarest Medical Center, which provides medical services to the community.
Demarest Borough is also home to several small businesses, including restaurants, shops, and professional services. The borough is also home to several corporate offices, including those of the pharmaceutical company Merck & Co. and the financial services company Prudential Financial.
Demographics
As of the 2010 census, Demarest Borough had a population of 4,058. The racial makeup of the borough was 79.2% White, 8.2% Asian, 6.7% Hispanic or Latino, and 5.9% African American.
The median household income in Demarest Borough was $107,917, and the median family income was $125,917. The per capita income was $50,917. The unemployment rate was 4.2%.
Demarest Borough is home to a large number of families, with nearly half of the population under the age of 18. The borough is also home to a large number of seniors, with nearly one-quarter of the population over the age of 65.
Common Questions
What is Per Capita Income in Demarest borough?
Per Capita income in Demarest borough is $91,523.
What is the Median Family Income in Demarest borough?
Median Family Income in Demarest borough is $200,104.
What is the Median Household income in Demarest borough?
Median Household Income in Demarest borough is $165,119.
What is Income or Wage Gap in Demarest borough?
Income or Wage Gap in Demarest borough is 60.4%.
Women in Demarest borough earn 39.6 cents for every dollar earned by a man.
What is Inequality or Gini Index in Demarest borough?
Inequality or Gini Index in Demarest borough is 0.47.
What is the Total Population of Demarest borough?
Total Population of Demarest borough is 4,930.
What is the Total Male Population of Demarest borough?
Total Male Population of Demarest borough is 2,457.
What is the Total Female Population of Demarest borough?
Total Female Population of Demarest borough is 2,473.
What is the Ratio of Males per 100 Females in Demarest borough?
There are 99.35 Males per 100 Females in Demarest borough.
What is the Ratio of Females per 100 Males in Demarest borough?
There are 100.65 Females per 100 Males in Demarest borough.
What is the Median Population Age in Demarest borough?
Median Population Age in Demarest borough is 45.6 Years.
What is the Average Family Size in Demarest borough
Average Family Size in Demarest borough is 3.1 People.
What is the Average Household Size in Demarest borough
Average Household Size in Demarest borough is 2.9 People.
How Large is the Labor Force in Demarest borough?
There are 2,329 People in the Labor Forcein in Demarest borough.
What is the Percentage of People in the Labor Force in Demarest borough?
64.0% of People are in the Labor Force in Demarest borough.
What is the Unemployment Rate in Demarest borough?
Unemployment Rate in Demarest borough is 4.8%.