Zip Codes with the Highest Percentage of Population Employed in Computer, Engineering & Science in Vineland, NJ
RELATED REPORTS & OPTIONS
Computer, Engineering & Science
Vineland
Compare Zip Codes
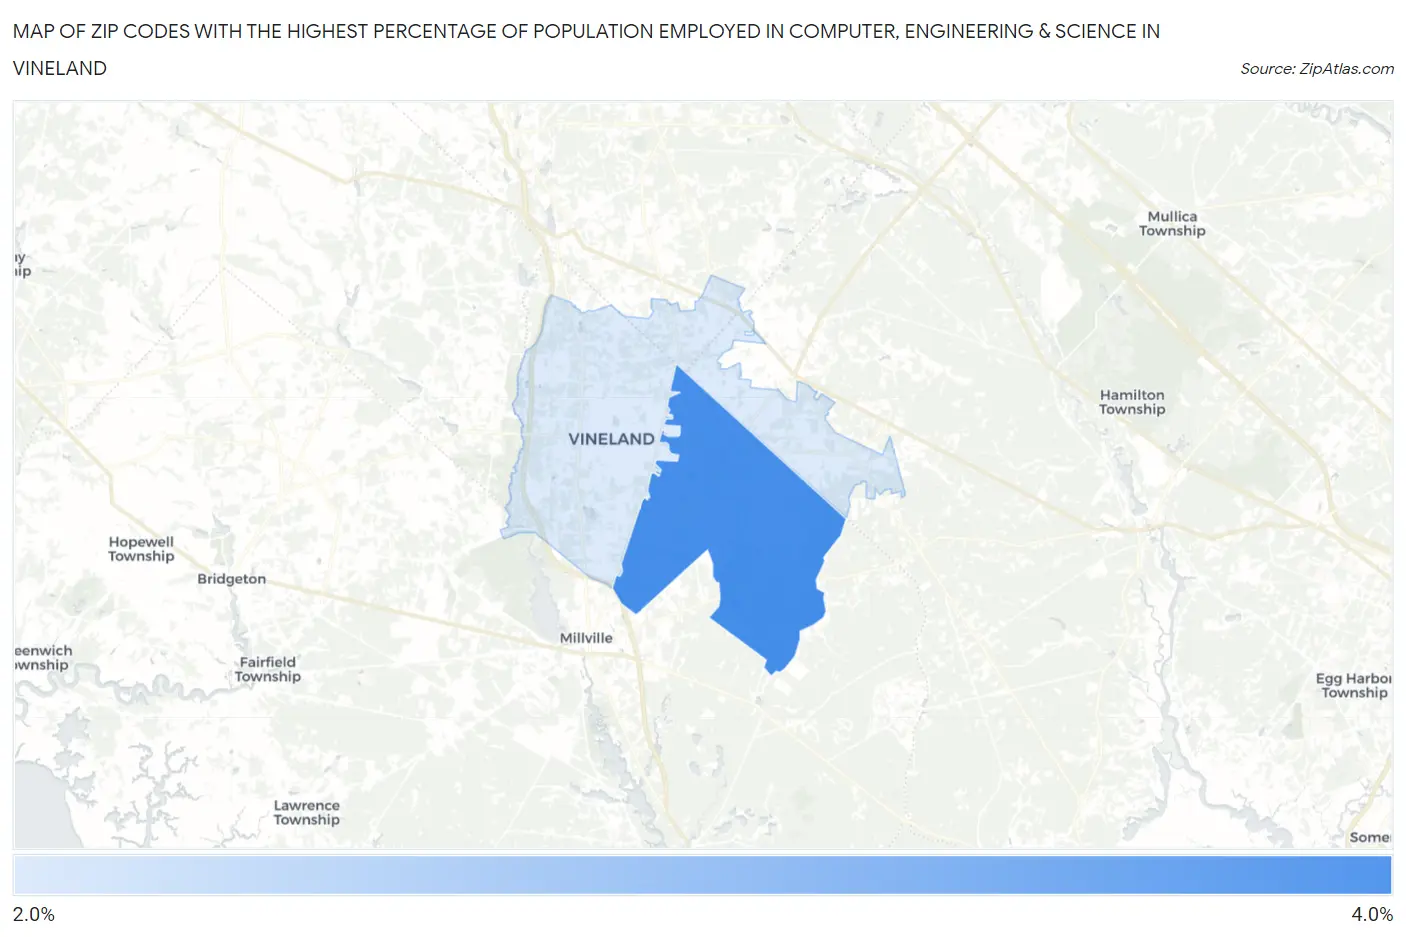
Map of Zip Codes with the Highest Percentage of Population Employed in Computer, Engineering & Science in Vineland
2.1%
3.5%
Zip Codes with the Highest Percentage of Population Employed in Computer, Engineering & Science in Vineland, NJ
| Zip Code | % Employed | vs State | vs National | |
| 1. | 08361 | 3.5% | 7.7%(-4.18)#481 | 6.8%(-3.27)#16,297 |
| 2. | 08360 | 2.1% | 7.7%(-5.56)#529 | 6.8%(-4.66)#21,448 |
1
Common Questions
What are the Top Zip Codes with the Highest Percentage of Population Employed in Computer, Engineering & Science in Vineland, NJ?
Top Zip Codes with the Highest Percentage of Population Employed in Computer, Engineering & Science in Vineland, NJ are:
What zip code has the Highest Percentage of Population Employed in Computer, Engineering & Science in Vineland, NJ?
08361 has the Highest Percentage of Population Employed in Computer, Engineering & Science in Vineland, NJ with 3.5%.
What is the Percentage of Population Employed in Computer, Engineering & Science in Vineland, NJ?
Percentage of Population Employed in Computer, Engineering & Science in Vineland is 2.4%.
What is the Percentage of Population Employed in Computer, Engineering & Science in New Jersey?
Percentage of Population Employed in Computer, Engineering & Science in New Jersey is 7.7%.
What is the Percentage of Population Employed in Computer, Engineering & Science in the United States?
Percentage of Population Employed in Computer, Engineering & Science in the United States is 6.8%.