Pleasant Plains, NJ Map & Demographics
Pleasant Plains Map
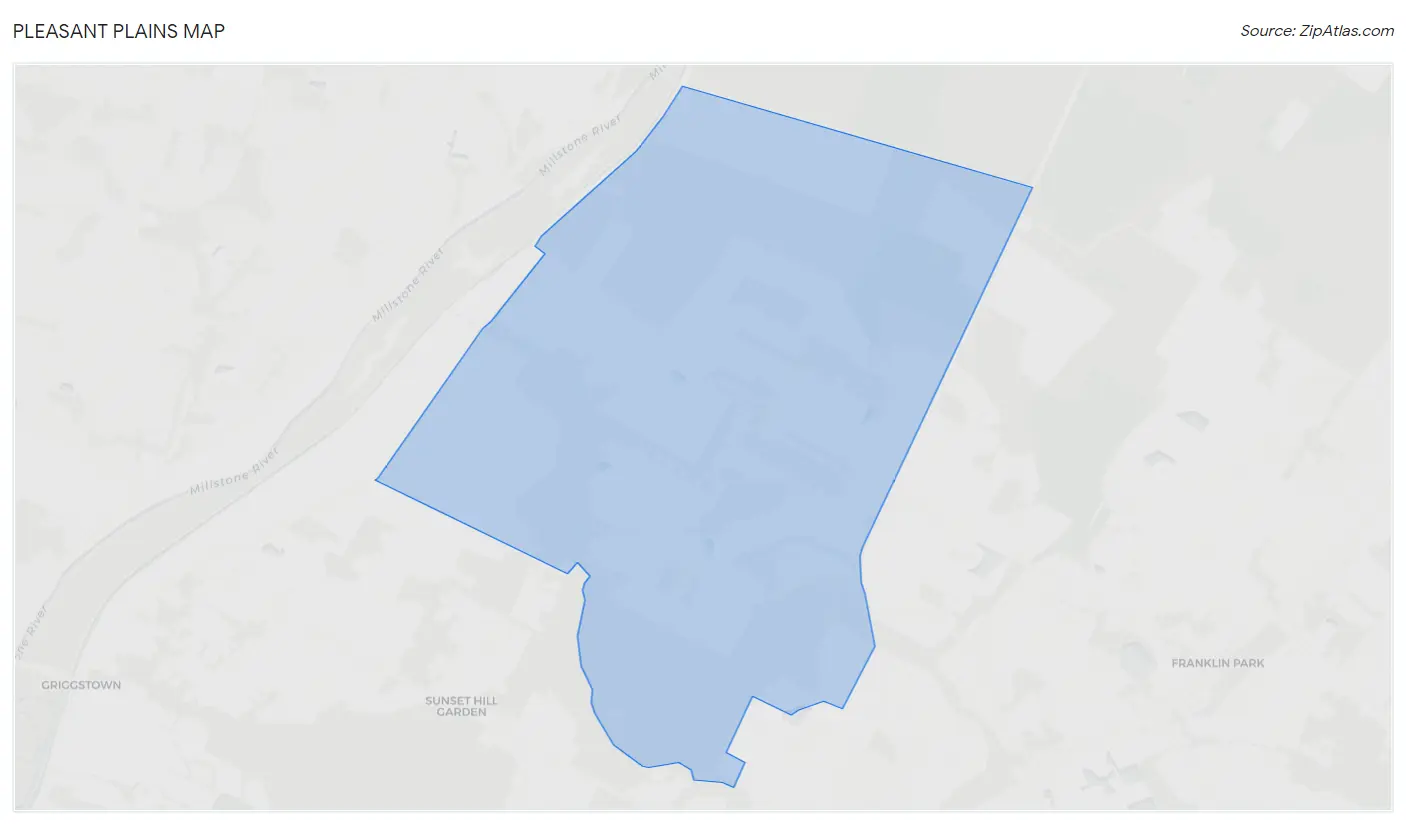
Pleasant Plains Overview
$92,098
PER CAPITA INCOME
0.49
INEQUALITY / GINI INDEX
525
TOTAL POPULATION
203
MALE POPULATION
322
FEMALE POPULATION
63.04
MALES / 100 FEMALES
158.62
FEMALES / 100 MALES
45.5
MEDIAN AGE
2.8
AVG FAMILY SIZE
3.0
AVG HOUSEHOLD SIZE
314
LABOR FORCE [ PEOPLE ]
74.4%
PERCENT IN LABOR FORCE
11.1%
UNEMPLOYMENT RATE
Income in Pleasant Plains
Income Overview in Pleasant Plains
| Characteristic | Number | Measure |
| Per Capita Income | 525 | $92,098 |
| Median Family Income | 161 | $0 |
| Mean Family Income | 161 | $263,051 |
| Median Household Income | 178 | $0 |
| Mean Household Income | 178 | $275,428 |
| Income Deficit | 161 | $0 |
| Wage / Income Gap (%) | 525 | 0.00% |
| Wage / Income Gap ($) | 525 | 100.00¢ per $1 |
| Gini / Inequality Index | 525 | 0.49 |
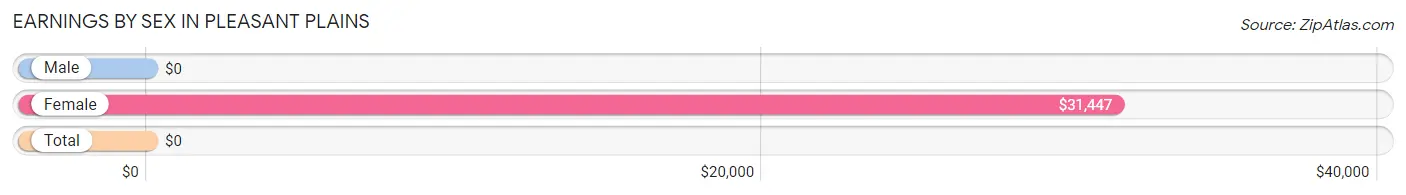
Earnings by Sex in Pleasant Plains
| Sex | Number | Average Earnings |
| Male | 144 (45.9%) | $0 |
| Female | 170 (54.1%) | $31,447 |
| Total | 314 (100.0%) | $0 |
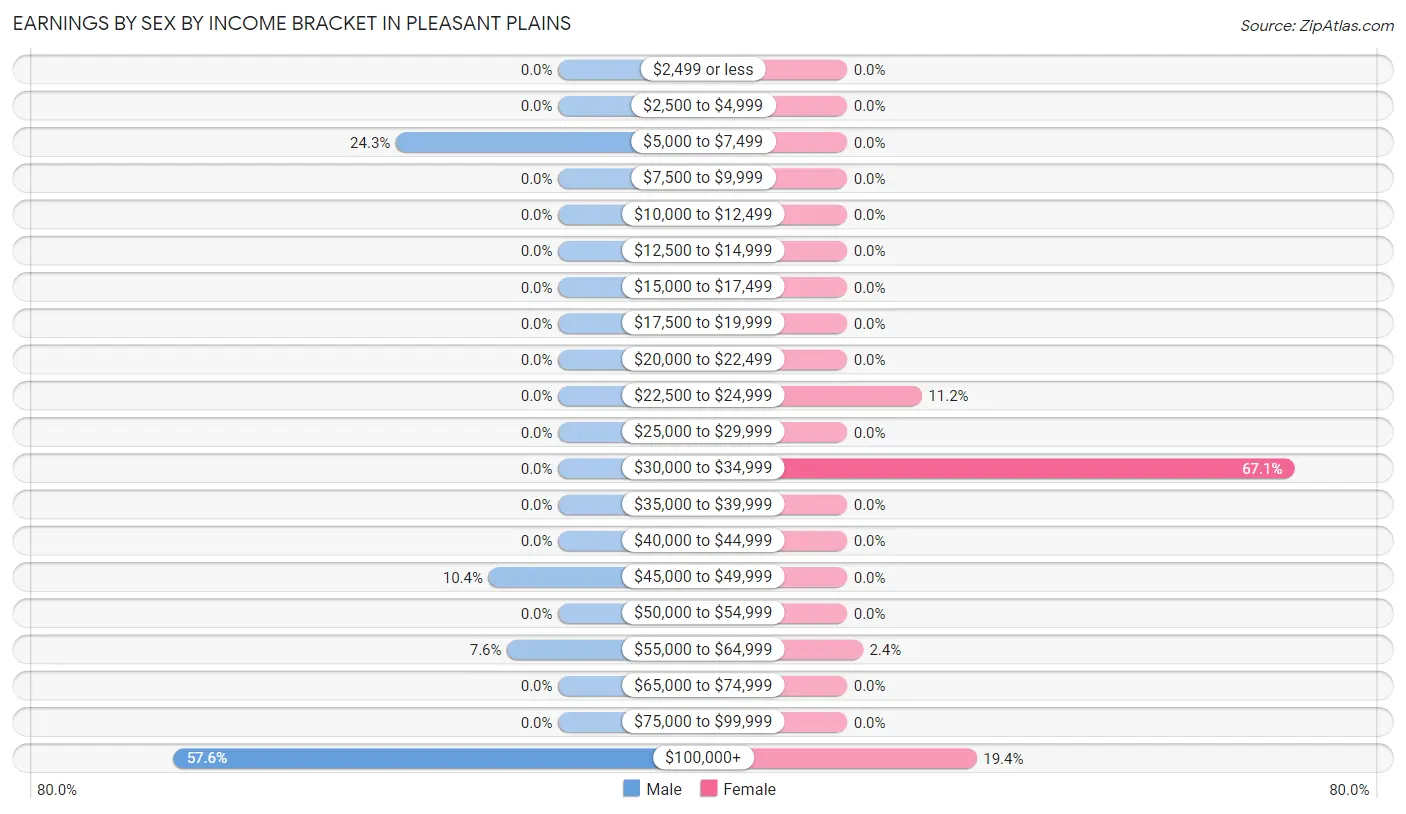
Earnings by Sex by Income Bracket in Pleasant Plains
The most common earnings brackets in Pleasant Plains are $100,000+ for men (83 | 57.6%) and $30,000 to $34,999 for women (114 | 67.1%).
| Income | Male | Female |
| $2,499 or less | 0 (0.0%) | 0 (0.0%) |
| $2,500 to $4,999 | 0 (0.0%) | 0 (0.0%) |
| $5,000 to $7,499 | 35 (24.3%) | 0 (0.0%) |
| $7,500 to $9,999 | 0 (0.0%) | 0 (0.0%) |
| $10,000 to $12,499 | 0 (0.0%) | 0 (0.0%) |
| $12,500 to $14,999 | 0 (0.0%) | 0 (0.0%) |
| $15,000 to $17,499 | 0 (0.0%) | 0 (0.0%) |
| $17,500 to $19,999 | 0 (0.0%) | 0 (0.0%) |
| $20,000 to $22,499 | 0 (0.0%) | 0 (0.0%) |
| $22,500 to $24,999 | 0 (0.0%) | 19 (11.2%) |
| $25,000 to $29,999 | 0 (0.0%) | 0 (0.0%) |
| $30,000 to $34,999 | 0 (0.0%) | 114 (67.1%) |
| $35,000 to $39,999 | 0 (0.0%) | 0 (0.0%) |
| $40,000 to $44,999 | 0 (0.0%) | 0 (0.0%) |
| $45,000 to $49,999 | 15 (10.4%) | 0 (0.0%) |
| $50,000 to $54,999 | 0 (0.0%) | 0 (0.0%) |
| $55,000 to $64,999 | 11 (7.6%) | 4 (2.4%) |
| $65,000 to $74,999 | 0 (0.0%) | 0 (0.0%) |
| $75,000 to $99,999 | 0 (0.0%) | 0 (0.0%) |
| $100,000+ | 83 (57.6%) | 33 (19.4%) |
| Total | 144 (100.0%) | 170 (100.0%) |
Earnings by Sex by Educational Attainment in Pleasant Plains
| Educational Attainment | Male Income | Female Income |
| Less than High School | - | - |
| High School Diploma | - | - |
| College or Associate's Degree | - | - |
| Bachelor's Degree | - | - |
| Graduate Degree | - | - |
| Total | - | - |
Family Income in Pleasant Plains
Family Income Brackets in Pleasant Plains
According to the Pleasant Plains family income data, there are 63 families falling into the $200,000+ income range, which is the most common income bracket and makes up 39.1% of all families.
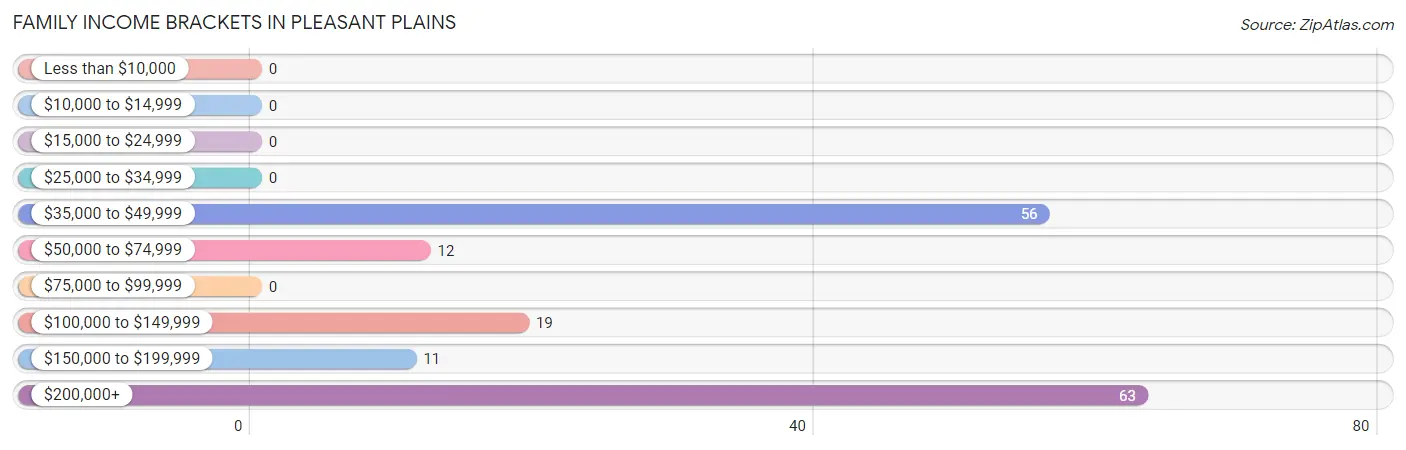
| Income Bracket | # Families | % Families |
| Less than $10,000 | 0 | 0.0% |
| $10,000 to $14,999 | 0 | 0.0% |
| $15,000 to $24,999 | 0 | 0.0% |
| $25,000 to $34,999 | 0 | 0.0% |
| $35,000 to $49,999 | 56 | 34.8% |
| $50,000 to $74,999 | 12 | 7.5% |
| $75,000 to $99,999 | 0 | 0.0% |
| $100,000 to $149,999 | 19 | 11.8% |
| $150,000 to $199,999 | 11 | 6.8% |
| $200,000+ | 63 | 39.1% |
Family Income by Famaliy Size in Pleasant Plains
3-person families (42 | 26.1%) account for the highest median family income in Pleasant Plains with $150,455 per family, while 3-person families (42 | 26.1%) have the highest median income of $50,152 per family member.
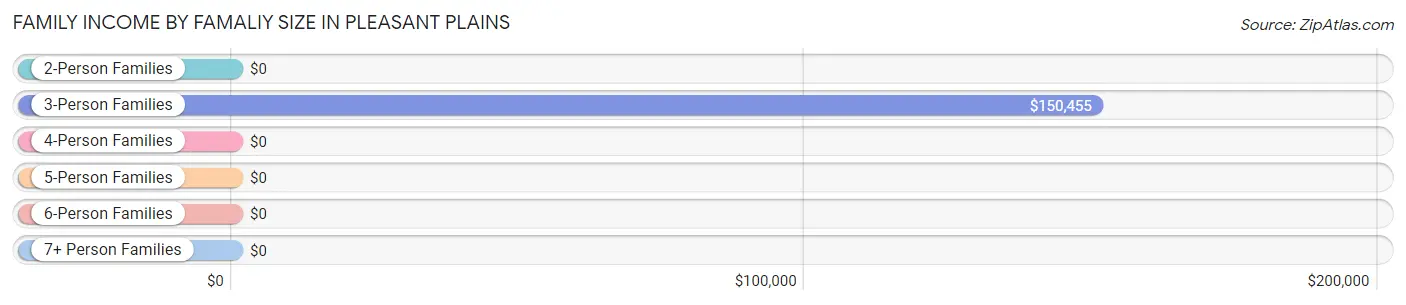
| Income Bracket | # Families | Median Income |
| 2-Person Families | 84 (52.2%) | $0 |
| 3-Person Families | 42 (26.1%) | $150,455 |
| 4-Person Families | 0 (0.0%) | $0 |
| 5-Person Families | 19 (11.8%) | $0 |
| 6-Person Families | 16 (9.9%) | $0 |
| 7+ Person Families | 0 (0.0%) | $0 |
| Total | 161 (100.0%) | $0 |
Family Income by Number of Earners in Pleasant Plains
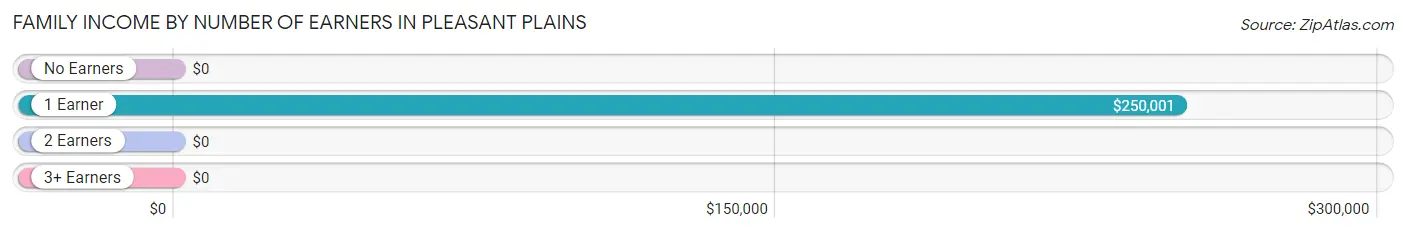
| Number of Earners | # Families | Median Income |
| No Earners | 12 (7.4%) | $0 |
| 1 Earner | 47 (29.2%) | $250,001 |
| 2 Earners | 86 (53.4%) | $0 |
| 3+ Earners | 16 (9.9%) | $0 |
| Total | 161 (100.0%) | $0 |
Household Income in Pleasant Plains
Household Income Brackets in Pleasant Plains
With 80 households falling in the category, the $200,000+ income range is the most frequent in Pleasant Plains, accounting for 44.9% of all households.
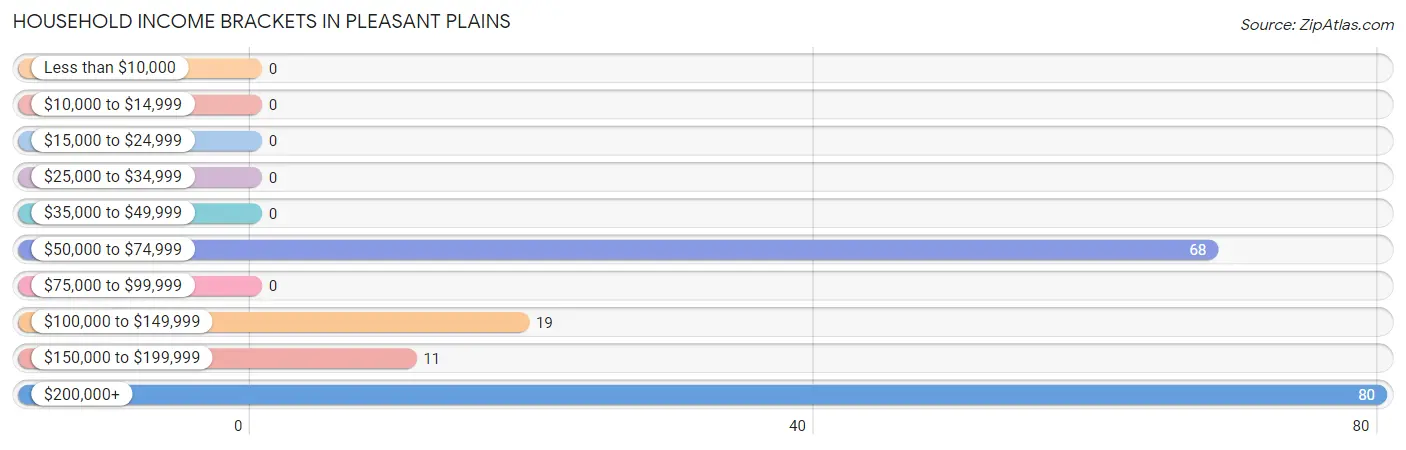
| Income Bracket | # Households | % Households |
| Less than $10,000 | 0 | 0.0% |
| $10,000 to $14,999 | 0 | 0.0% |
| $15,000 to $24,999 | 0 | 0.0% |
| $25,000 to $34,999 | 0 | 0.0% |
| $35,000 to $49,999 | 0 | 0.0% |
| $50,000 to $74,999 | 68 | 38.2% |
| $75,000 to $99,999 | 0 | 0.0% |
| $100,000 to $149,999 | 19 | 10.7% |
| $150,000 to $199,999 | 11 | 6.2% |
| $200,000+ | 80 | 44.9% |
Household Income by Householder Age in Pleasant Plains
The median household income in Pleasant Plains is $0, with the highest median household income of $250,001 found in the 45 to 64 years age bracket for the primary householder. A total of 64 households (36.0%) fall into this category. Meanwhile, the 15 to 24 years age bracket for the primary householder has the lowest median household income of $0, with 56 households (31.5%) in this group.
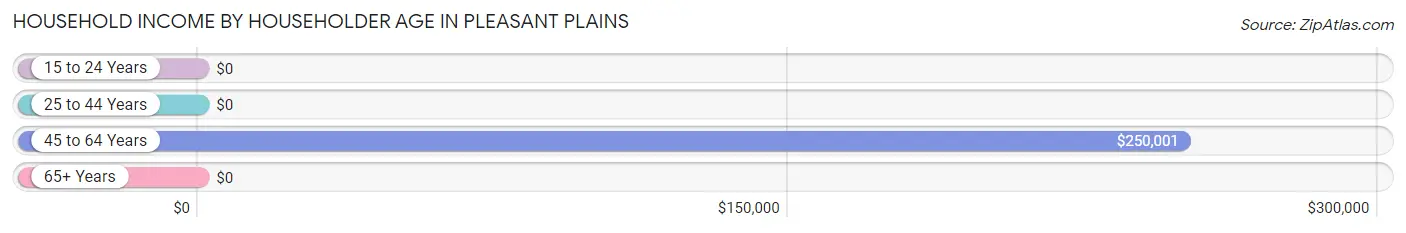
| Income Bracket | # Households | Median Income |
| 15 to 24 Years | 56 (31.5%) | $0 |
| 25 to 44 Years | 19 (10.7%) | $0 |
| 45 to 64 Years | 64 (36.0%) | $250,001 |
| 65+ Years | 39 (21.9%) | $0 |
| Total | 178 (100.0%) | $0 |
Poverty in Pleasant Plains
Income Below Poverty by Sex and Age in Pleasant Plains
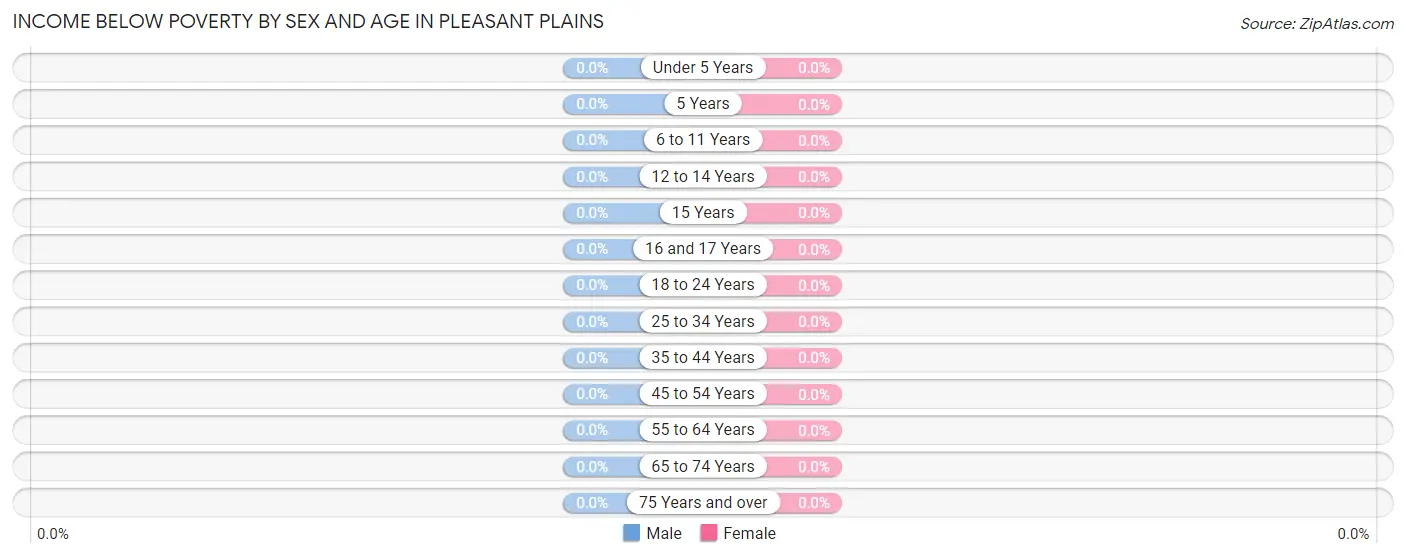
| Age Bracket | Male | Female |
| Under 5 Years | 0 (0.0%) | 0 (0.0%) |
| 5 Years | 0 (0.0%) | 0 (0.0%) |
| 6 to 11 Years | 0 (0.0%) | 0 (0.0%) |
| 12 to 14 Years | 0 (0.0%) | 0 (0.0%) |
| 15 Years | 0 (0.0%) | 0 (0.0%) |
| 16 and 17 Years | 0 (0.0%) | 0 (0.0%) |
| 18 to 24 Years | 0 (0.0%) | 0 (0.0%) |
| 25 to 34 Years | 0 (0.0%) | 0 (0.0%) |
| 35 to 44 Years | 0 (0.0%) | 0 (0.0%) |
| 45 to 54 Years | 0 (0.0%) | 0 (0.0%) |
| 55 to 64 Years | 0 (0.0%) | 0 (0.0%) |
| 65 to 74 Years | 0 (0.0%) | 0 (0.0%) |
| 75 Years and over | 0 (0.0%) | 0 (0.0%) |
| Total | 0 (0.0%) | 0 (0.0%) |
Income Above Poverty by Sex and Age in Pleasant Plains
According to the poverty statistics in Pleasant Plains, males aged under 5 years and females aged 6 to 11 years are the age groups that are most secure financially, with 100.0% of males and 100.0% of females in these age groups living above the poverty line.
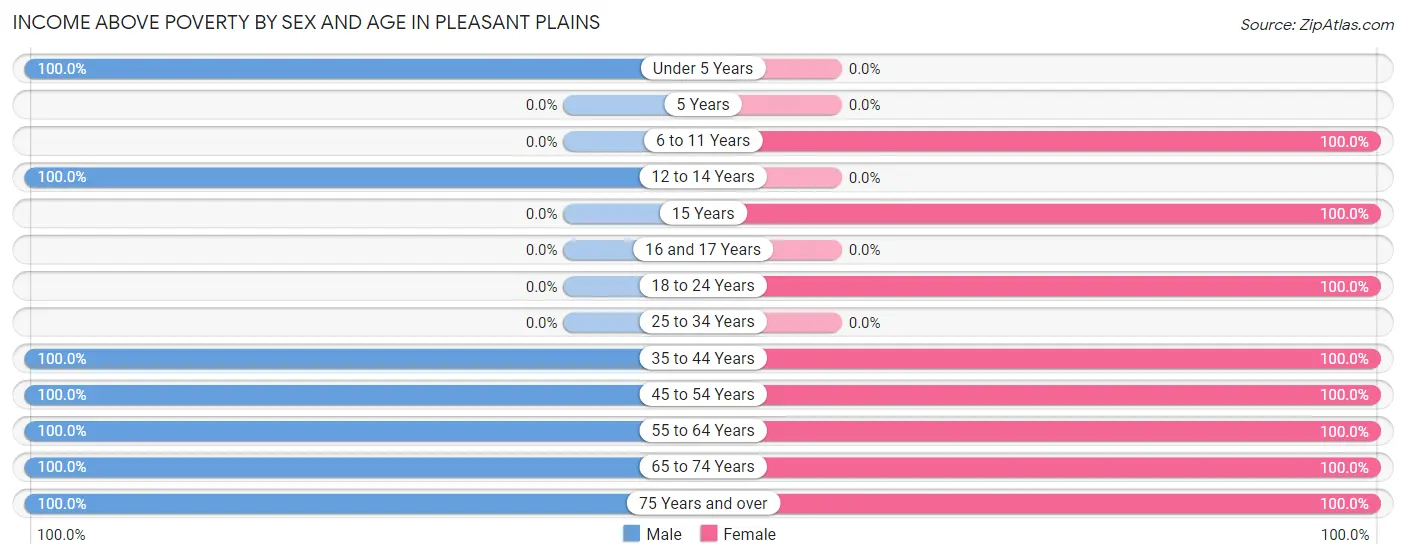
| Age Bracket | Male | Female |
| Under 5 Years | 14 (100.0%) | 0 (0.0%) |
| 5 Years | 0 (0.0%) | 0 (0.0%) |
| 6 to 11 Years | 0 (0.0%) | 53 (100.0%) |
| 12 to 14 Years | 17 (100.0%) | 0 (0.0%) |
| 15 Years | 0 (0.0%) | 19 (100.0%) |
| 16 and 17 Years | 0 (0.0%) | 0 (0.0%) |
| 18 to 24 Years | 0 (0.0%) | 114 (100.0%) |
| 25 to 34 Years | 0 (0.0%) | 0 (0.0%) |
| 35 to 44 Years | 19 (100.0%) | 19 (100.0%) |
| 45 to 54 Years | 47 (100.0%) | 46 (100.0%) |
| 55 to 64 Years | 51 (100.0%) | 4 (100.0%) |
| 65 to 74 Years | 27 (100.0%) | 41 (100.0%) |
| 75 Years and over | 28 (100.0%) | 26 (100.0%) |
| Total | 203 (100.0%) | 322 (100.0%) |
Income Below Poverty Among Married-Couple Families in Pleasant Plains
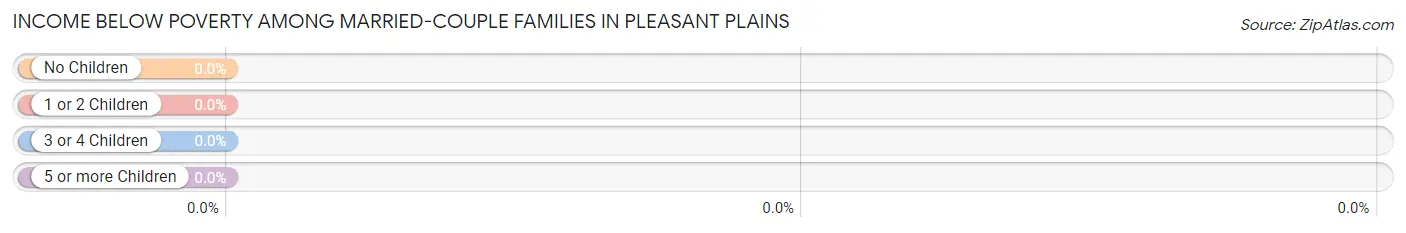
| Children | Above Poverty | Below Poverty |
| No Children | 39 (100.0%) | 0 (0.0%) |
| 1 or 2 Children | 47 (100.0%) | 0 (0.0%) |
| 3 or 4 Children | 19 (100.0%) | 0 (0.0%) |
| 5 or more Children | 0 (0.0%) | 0 (0.0%) |
| Total | 105 (100.0%) | 0 (0.0%) |
Income Below Poverty Among Single-Parent Households in Pleasant Plains
| Children | Single Father | Single Mother |
| No Children | 0 (0.0%) | 0 (0.0%) |
| 1 or 2 Children | 0 (0.0%) | 0 (0.0%) |
| 3 or 4 Children | 0 (0.0%) | 0 (0.0%) |
| 5 or more Children | 0 (0.0%) | 0 (0.0%) |
| Total | 0 (0.0%) | 0 (0.0%) |
Income Below Poverty Among Married-Couple vs Single-Parent Households in Pleasant Plains
| Children | Married-Couple Families | Single-Parent Households |
| No Children | 0 (0.0%) | 0 (0.0%) |
| 1 or 2 Children | 0 (0.0%) | 0 (0.0%) |
| 3 or 4 Children | 0 (0.0%) | 0 (0.0%) |
| 5 or more Children | 0 (0.0%) | 0 (0.0%) |
| Total | 0 (0.0%) | 0 (0.0%) |
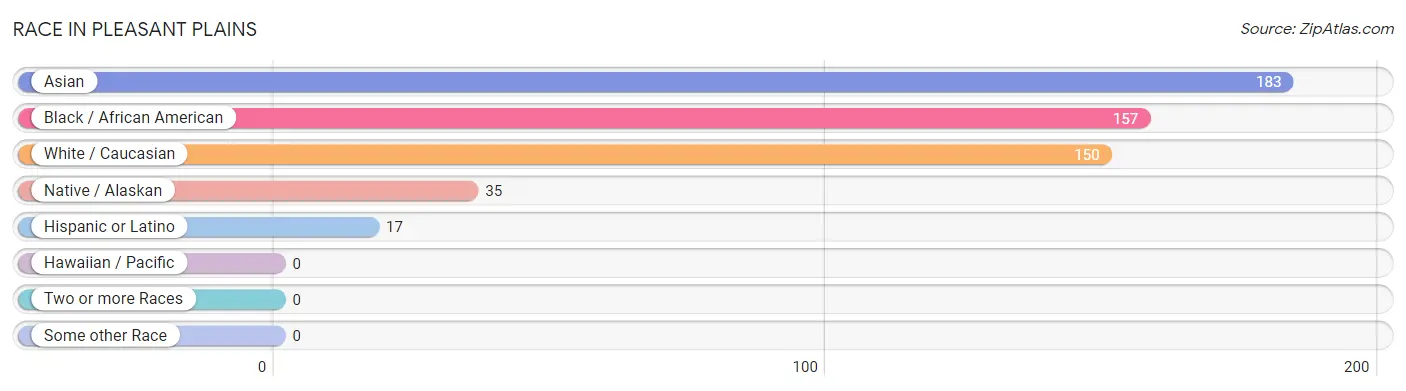
Race in Pleasant Plains
The most populous races in Pleasant Plains are Asian (183 | 34.9%), Black / African American (157 | 29.9%), and White / Caucasian (150 | 28.6%).
| Race | # Population | % Population |
| Asian | 183 | 34.9% |
| Black / African American | 157 | 29.9% |
| Hawaiian / Pacific | 0 | 0.0% |
| Hispanic or Latino | 17 | 3.2% |
| Native / Alaskan | 35 | 6.7% |
| White / Caucasian | 150 | 28.6% |
| Two or more Races | 0 | 0.0% |
| Some other Race | 0 | 0.0% |
| Total | 525 | 100.0% |
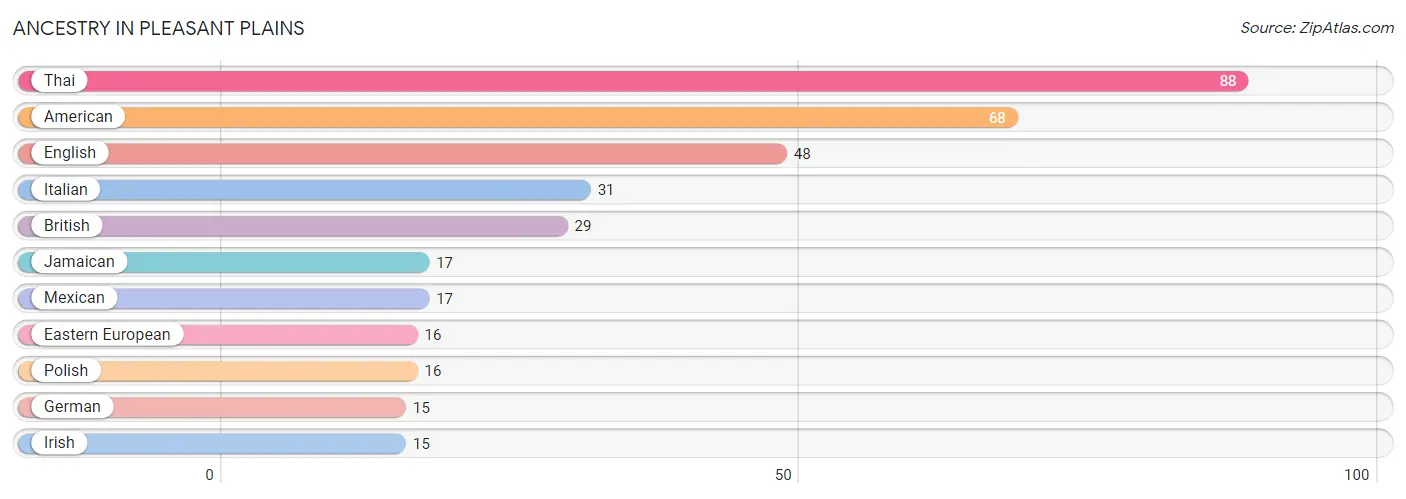
Ancestry in Pleasant Plains
The most populous ancestries reported in Pleasant Plains are Thai (88 | 16.8%), American (68 | 13.0%), English (48 | 9.1%), Italian (31 | 5.9%), and British (29 | 5.5%), together accounting for 50.3% of all Pleasant Plains residents.
| Ancestry | # Population | % Population |
| American | 68 | 13.0% |
| British | 29 | 5.5% |
| Eastern European | 16 | 3.0% |
| English | 48 | 9.1% |
| German | 15 | 2.9% |
| Irish | 15 | 2.9% |
| Italian | 31 | 5.9% |
| Jamaican | 17 | 3.2% |
| Mexican | 17 | 3.2% |
| Polish | 16 | 3.0% |
| Thai | 88 | 16.8% | View All 11 Rows |
Immigrants in Pleasant Plains
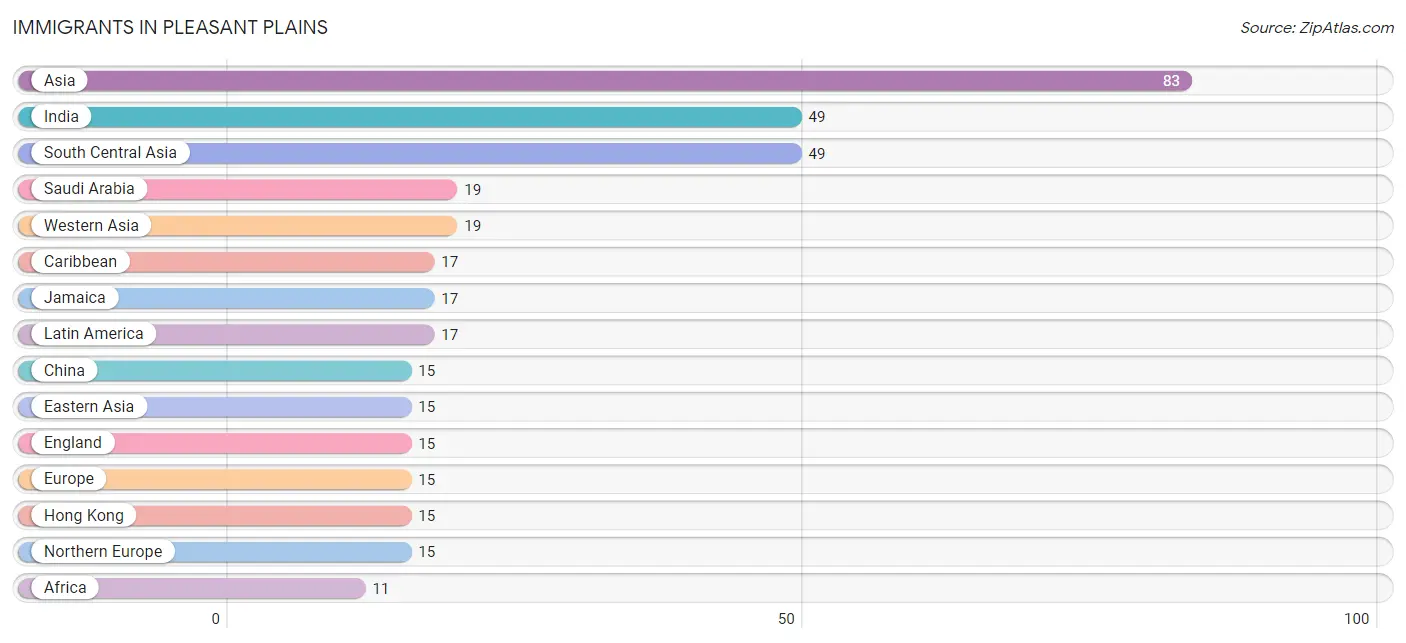
The most numerous immigrant groups reported in Pleasant Plains came from Asia (83 | 15.8%), India (49 | 9.3%), South Central Asia (49 | 9.3%), Saudi Arabia (19 | 3.6%), and Western Asia (19 | 3.6%), together accounting for 41.7% of all Pleasant Plains residents.
| Immigration Origin | # Population | % Population |
| Africa | 11 | 2.1% |
| Asia | 83 | 15.8% |
| Caribbean | 17 | 3.2% |
| China | 15 | 2.9% |
| Eastern Asia | 15 | 2.9% |
| England | 15 | 2.9% |
| Europe | 15 | 2.9% |
| Ghana | 11 | 2.1% |
| Hong Kong | 15 | 2.9% |
| India | 49 | 9.3% |
| Jamaica | 17 | 3.2% |
| Latin America | 17 | 3.2% |
| Northern Europe | 15 | 2.9% |
| Saudi Arabia | 19 | 3.6% |
| South Central Asia | 49 | 9.3% |
| Western Africa | 11 | 2.1% |
| Western Asia | 19 | 3.6% | View All 17 Rows |
Sex and Age in Pleasant Plains
Sex and Age in Pleasant Plains
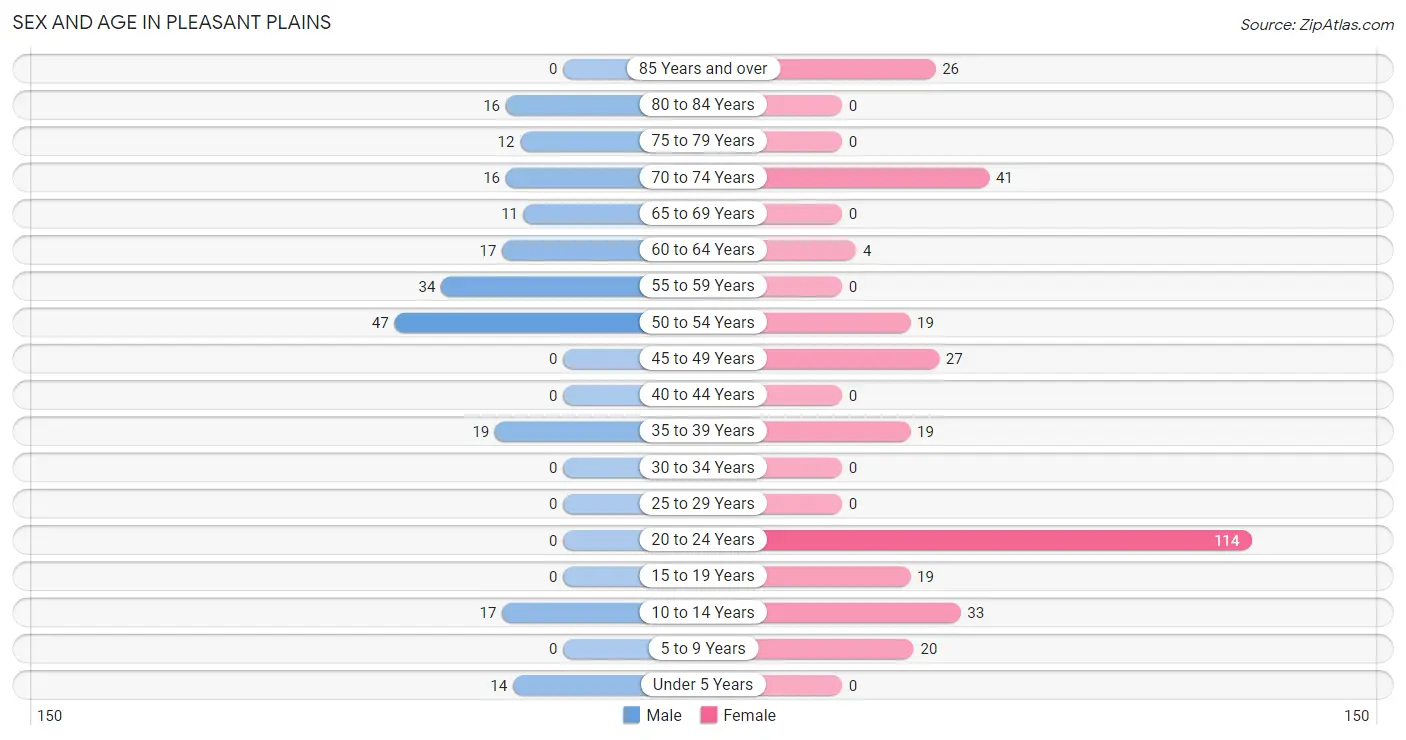
The most populous age groups in Pleasant Plains are 50 to 54 Years (47 | 23.2%) for men and 20 to 24 Years (114 | 35.4%) for women.
| Age Bracket | Male | Female |
| Under 5 Years | 14 (6.9%) | 0 (0.0%) |
| 5 to 9 Years | 0 (0.0%) | 20 (6.2%) |
| 10 to 14 Years | 17 (8.4%) | 33 (10.2%) |
| 15 to 19 Years | 0 (0.0%) | 19 (5.9%) |
| 20 to 24 Years | 0 (0.0%) | 114 (35.4%) |
| 25 to 29 Years | 0 (0.0%) | 0 (0.0%) |
| 30 to 34 Years | 0 (0.0%) | 0 (0.0%) |
| 35 to 39 Years | 19 (9.4%) | 19 (5.9%) |
| 40 to 44 Years | 0 (0.0%) | 0 (0.0%) |
| 45 to 49 Years | 0 (0.0%) | 27 (8.4%) |
| 50 to 54 Years | 47 (23.2%) | 19 (5.9%) |
| 55 to 59 Years | 34 (16.8%) | 0 (0.0%) |
| 60 to 64 Years | 17 (8.4%) | 4 (1.2%) |
| 65 to 69 Years | 11 (5.4%) | 0 (0.0%) |
| 70 to 74 Years | 16 (7.9%) | 41 (12.7%) |
| 75 to 79 Years | 12 (5.9%) | 0 (0.0%) |
| 80 to 84 Years | 16 (7.9%) | 0 (0.0%) |
| 85 Years and over | 0 (0.0%) | 26 (8.1%) |
| Total | 203 (100.0%) | 322 (100.0%) |
Families and Households in Pleasant Plains
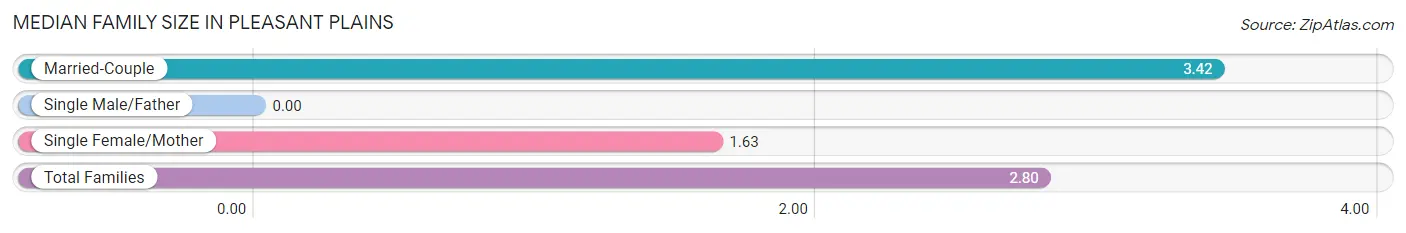
Median Family Size in Pleasant Plains
| Family Type | # Families | Family Size |
| Married-Couple | 105 (65.2%) | 3.42 |
| Single Male/Father | 0 (0.0%) | - |
| Single Female/Mother | 56 (34.8%) | 1.63 |
| Total Families | 161 (100.0%) | 2.80 |
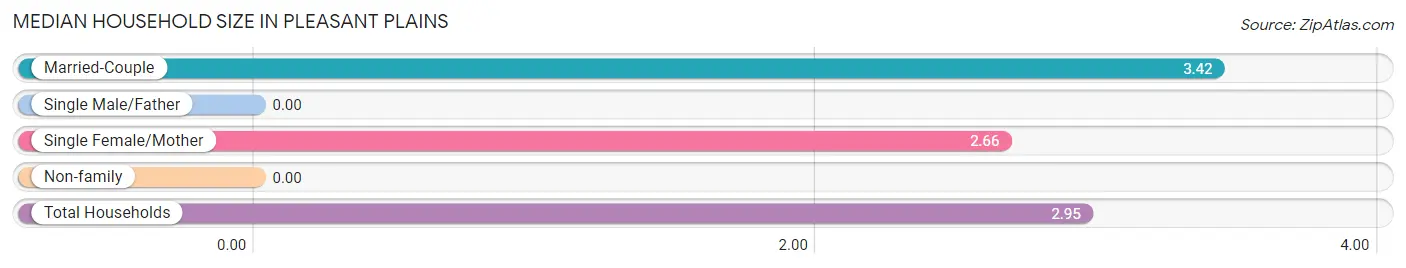
Median Household Size in Pleasant Plains
| Household Type | # Households | Household Size |
| Married-Couple | 105 (59.0%) | 3.42 |
| Single Male/Father | 0 (0.0%) | - |
| Single Female/Mother | 56 (31.5%) | 2.66 |
| Non-family | 17 (9.6%) | - |
| Total Households | 178 (100.0%) | 2.95 |
Household Size by Marriage Status in Pleasant Plains
Out of a total of 178 households in Pleasant Plains, 161 (90.4%) are family households, while 17 (9.6%) are nonfamily households. The most numerous type of family households are 3-person households, comprising 98, and the most common type of nonfamily households are 1-person households, comprising 17.
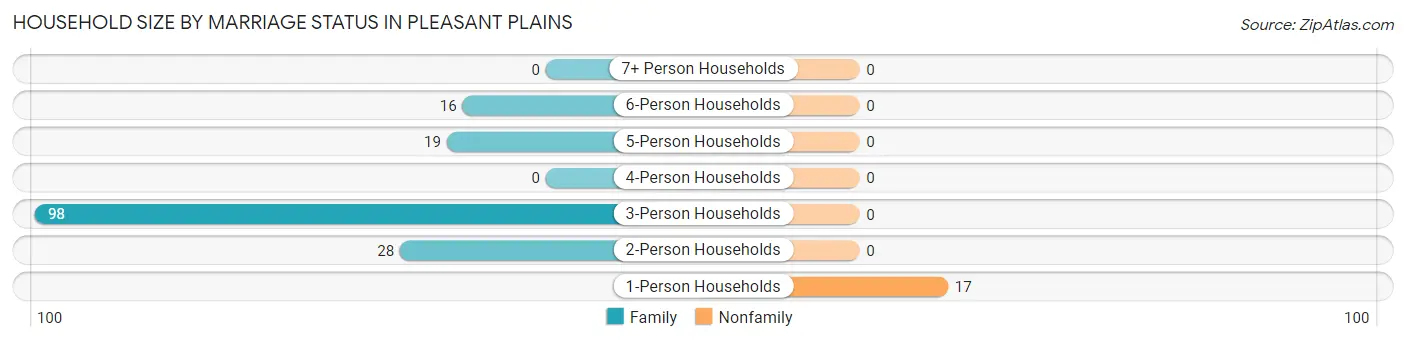
| Household Size | Family Households | Nonfamily Households |
| 1-Person Households | - | 17 (9.6%) |
| 2-Person Households | 28 (15.7%) | 0 (0.0%) |
| 3-Person Households | 98 (55.1%) | 0 (0.0%) |
| 4-Person Households | 0 (0.0%) | 0 (0.0%) |
| 5-Person Households | 19 (10.7%) | 0 (0.0%) |
| 6-Person Households | 16 (9.0%) | 0 (0.0%) |
| 7+ Person Households | 0 (0.0%) | 0 (0.0%) |
| Total | 161 (90.4%) | 17 (9.6%) |
Female Fertility in Pleasant Plains
Fertility by Age in Pleasant Plains
| Age Bracket | Women with Births | Births / 1,000 Women |
| 15 to 19 years | 0 (0.0%) | 0.0 |
| 20 to 34 years | 0 (0.0%) | 0.0 |
| 35 to 50 years | 0 (0.0%) | 0.0 |
| Total | 0 (0.0%) | 0.0 |
Fertility by Age by Marriage Status in Pleasant Plains
| Age Bracket | Married | Unmarried |
| 15 to 19 years | 0 (0.0%) | 0 (0.0%) |
| 20 to 34 years | 0 (0.0%) | 0 (0.0%) |
| 35 to 50 years | 0 (0.0%) | 0 (0.0%) |
| Total | 0 (0.0%) | 0 (0.0%) |
Fertility by Education in Pleasant Plains
| Educational Attainment | Women with Births | Births / 1,000 Women |
| Less than High School | 0 (0.0%) | 0.0 |
| High School Diploma | 0 (0.0%) | 0.0 |
| College or Associate's Degree | 0 (0.0%) | 0.0 |
| Bachelor's Degree | 0 (0.0%) | 0.0 |
| Graduate Degree | 0 (0.0%) | 0.0 |
| Total | 0 (0.0%) | 0.0 |
Fertility by Education by Marriage Status in Pleasant Plains
| Educational Attainment | Married | Unmarried |
| Less than High School | 0 (0.0%) | 0 (0.0%) |
| High School Diploma | 0 (0.0%) | 0 (0.0%) |
| College or Associate's Degree | 0 (0.0%) | 0 (0.0%) |
| Bachelor's Degree | 0 (0.0%) | 0 (0.0%) |
| Graduate Degree | 0 (0.0%) | 0 (0.0%) |
| Total | 0 (0.0%) | 0 (0.0%) |
Employment Characteristics in Pleasant Plains
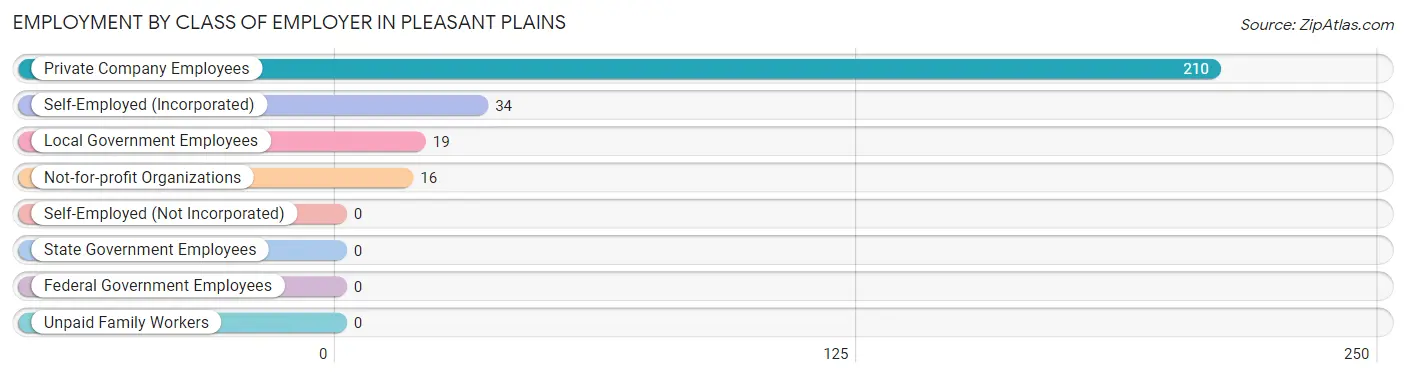
Employment by Class of Employer in Pleasant Plains
Among the 279 employed individuals in Pleasant Plains, private company employees (210 | 75.3%), self-employed (incorporated) (34 | 12.2%), and local government employees (19 | 6.8%) make up the most common classes of employment.
| Employer Class | # Employees | % Employees |
| Private Company Employees | 210 | 75.3% |
| Self-Employed (Incorporated) | 34 | 12.2% |
| Self-Employed (Not Incorporated) | 0 | 0.0% |
| Not-for-profit Organizations | 16 | 5.7% |
| Local Government Employees | 19 | 6.8% |
| State Government Employees | 0 | 0.0% |
| Federal Government Employees | 0 | 0.0% |
| Unpaid Family Workers | 0 | 0.0% |
| Total | 279 | 100.0% |
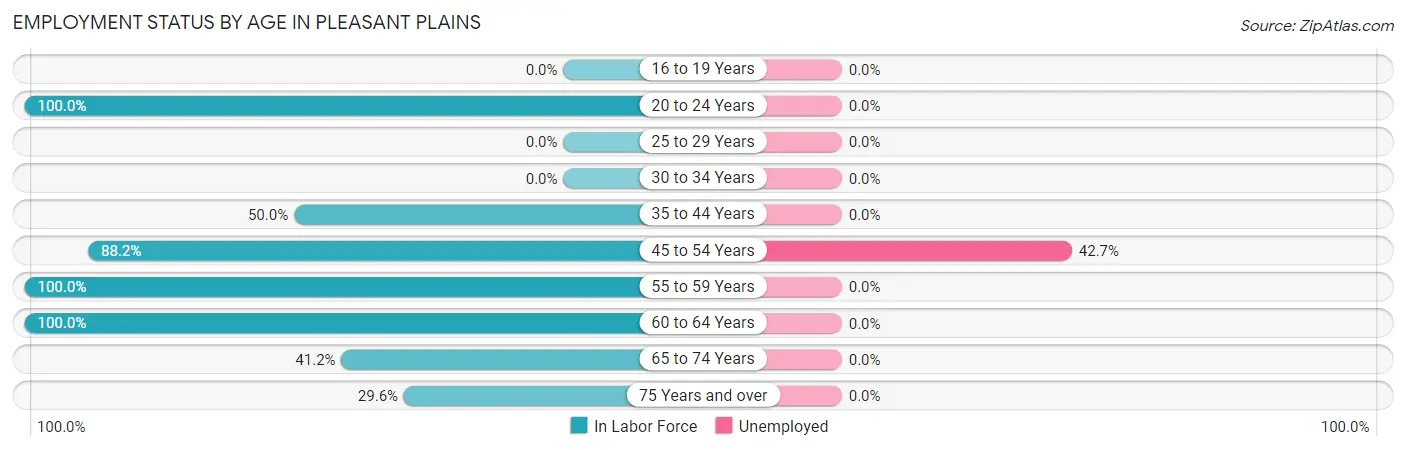
Employment Status by Age in Pleasant Plains
According to the labor force statistics for Pleasant Plains, out of the total population over 16 years of age (422), 74.4% or 314 individuals are in the labor force, with 11.1% or 35 of them unemployed. The age group with the highest labor force participation rate is 20 to 24 years, with 100.0% or 114 individuals in the labor force. Within the labor force, the 45 to 54 years age range has the highest percentage of unemployed individuals, with 42.7% or 35 of them being unemployed.
| Age Bracket | In Labor Force | Unemployed |
| 16 to 19 Years | 0 (0.0%) | 0 (0.0%) |
| 20 to 24 Years | 114 (100.0%) | 0 (0.0%) |
| 25 to 29 Years | 0 (0.0%) | 0 (0.0%) |
| 30 to 34 Years | 0 (0.0%) | 0 (0.0%) |
| 35 to 44 Years | 19 (50.0%) | 0 (0.0%) |
| 45 to 54 Years | 82 (88.2%) | 35 (42.7%) |
| 55 to 59 Years | 34 (100.0%) | 0 (0.0%) |
| 60 to 64 Years | 21 (100.0%) | 0 (0.0%) |
| 65 to 74 Years | 28 (41.2%) | 0 (0.0%) |
| 75 Years and over | 16 (29.6%) | 0 (0.0%) |
| Total | 314 (74.4%) | 35 (11.1%) |
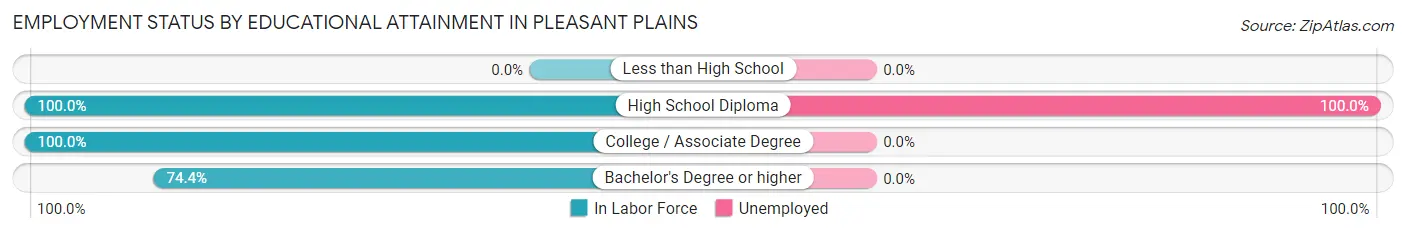
Employment Status by Educational Attainment in Pleasant Plains
According to labor force statistics for Pleasant Plains, 83.9% of individuals (156) out of the total population between 25 and 64 years of age (186) are in the labor force, with 22.4% or 35 of them being unemployed. The group with the highest labor force participation rate are those with the educational attainment of high school diploma, with 100.0% or 35 individuals in the labor force. Within the labor force, individuals with high school diploma education have the highest percentage of unemployment, with 100.0% or 35 of them being unemployed.
| Educational Attainment | In Labor Force | Unemployed |
| Less than High School | 0 (0.0%) | 0 (0.0%) |
| High School Diploma | 35 (100.0%) | 35 (100.0%) |
| College / Associate Degree | 34 (100.0%) | 0 (0.0%) |
| Bachelor's Degree or higher | 87 (74.4%) | 0 (0.0%) |
| Total | 156 (83.9%) | 42 (22.4%) |
Employment Occupations by Sex in Pleasant Plains
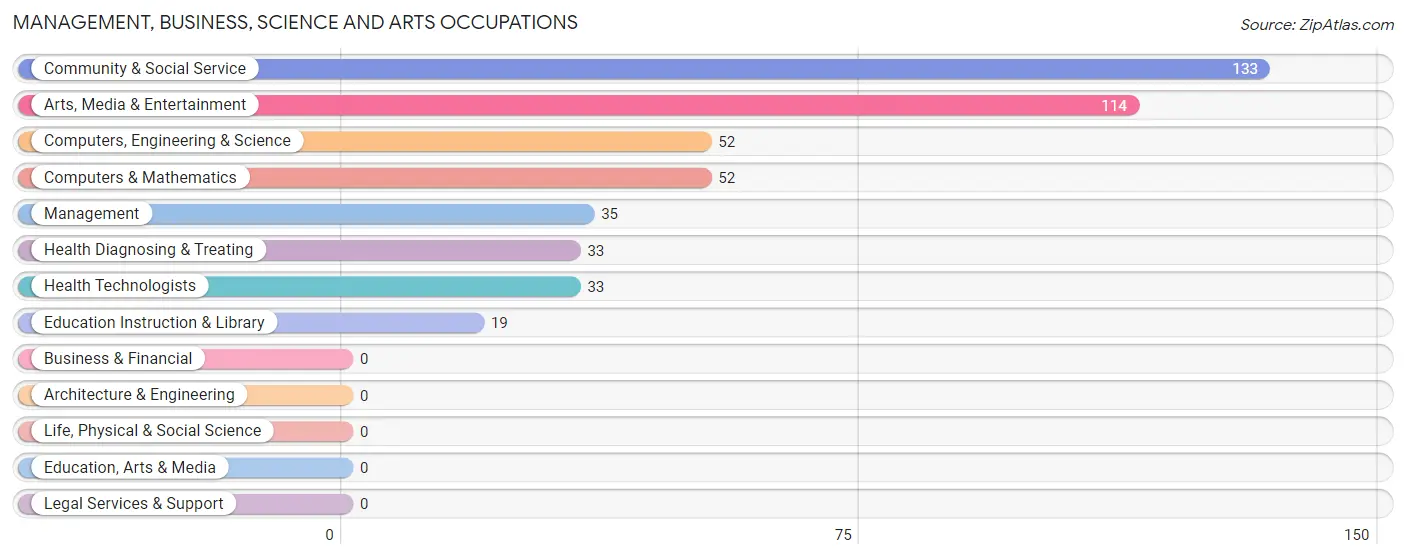
Management, Business, Science and Arts Occupations
The most common Management, Business, Science and Arts occupations in Pleasant Plains are Community & Social Service (133 | 47.7%), Arts, Media & Entertainment (114 | 40.9%), Computers, Engineering & Science (52 | 18.6%), Computers & Mathematics (52 | 18.6%), and Management (35 | 12.5%).
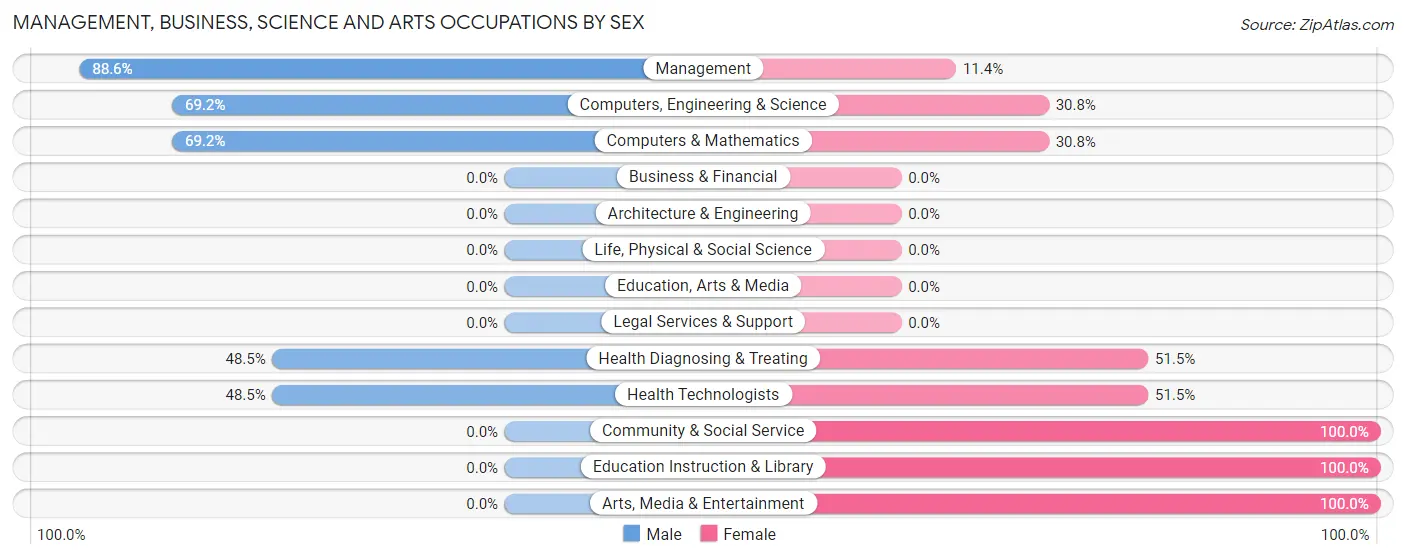
Management, Business, Science and Arts Occupations by Sex
Within the Management, Business, Science and Arts occupations in Pleasant Plains, the most male-oriented occupations are Management (88.6%), Computers, Engineering & Science (69.2%), and Computers & Mathematics (69.2%), while the most female-oriented occupations are Community & Social Service (100.0%), Education Instruction & Library (100.0%), and Arts, Media & Entertainment (100.0%).
| Occupation | Male | Female |
| Management | 31 (88.6%) | 4 (11.4%) |
| Business & Financial | 0 (0.0%) | 0 (0.0%) |
| Computers, Engineering & Science | 36 (69.2%) | 16 (30.8%) |
| Computers & Mathematics | 36 (69.2%) | 16 (30.8%) |
| Architecture & Engineering | 0 (0.0%) | 0 (0.0%) |
| Life, Physical & Social Science | 0 (0.0%) | 0 (0.0%) |
| Community & Social Service | 0 (0.0%) | 133 (100.0%) |
| Education, Arts & Media | 0 (0.0%) | 0 (0.0%) |
| Legal Services & Support | 0 (0.0%) | 0 (0.0%) |
| Education Instruction & Library | 0 (0.0%) | 19 (100.0%) |
| Arts, Media & Entertainment | 0 (0.0%) | 114 (100.0%) |
| Health Diagnosing & Treating | 16 (48.5%) | 17 (51.5%) |
| Health Technologists | 16 (48.5%) | 17 (51.5%) |
| Total (Category) | 83 (32.8%) | 170 (67.2%) |
| Total (Overall) | 109 (39.1%) | 170 (60.9%) |
Services Occupations
Services Occupations by Sex
| Occupation | Male | Female |
| Healthcare Support | 0 (0.0%) | 0 (0.0%) |
| Security & Protection | 0 (0.0%) | 0 (0.0%) |
| Firefighting & Prevention | 0 (0.0%) | 0 (0.0%) |
| Law Enforcement | 0 (0.0%) | 0 (0.0%) |
| Food Preparation & Serving | 0 (0.0%) | 0 (0.0%) |
| Cleaning & Maintenance | 0 (0.0%) | 0 (0.0%) |
| Personal Care & Service | 0 (0.0%) | 0 (0.0%) |
| Total (Category) | 0 (0.0%) | 0 (0.0%) |
| Total (Overall) | 109 (39.1%) | 170 (60.9%) |
Sales and Office Occupations
Sales and Office Occupations by Sex
| Occupation | Male | Female |
| Sales & Related | 0 (0.0%) | 0 (0.0%) |
| Office & Administration | 0 (0.0%) | 0 (0.0%) |
| Total (Category) | 0 (0.0%) | 0 (0.0%) |
| Total (Overall) | 109 (39.1%) | 170 (60.9%) |
Natural Resources, Construction and Maintenance Occupations
The most common Natural Resources, Construction and Maintenance occupations in Pleasant Plains are , and Construction & Extraction (15 | 5.4%).
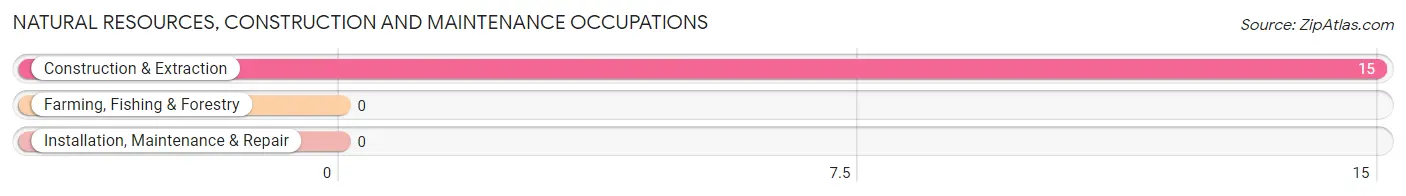
Natural Resources, Construction and Maintenance Occupations by Sex
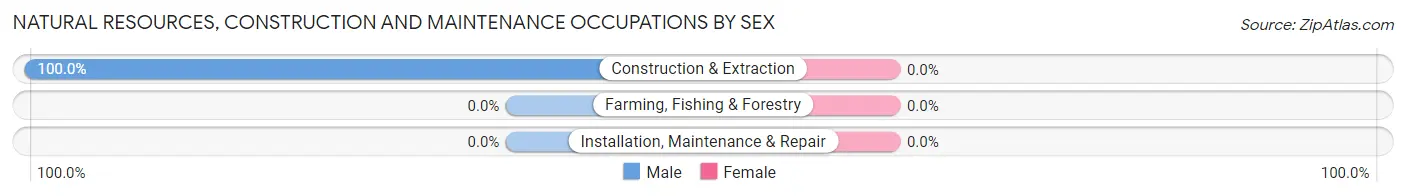
| Occupation | Male | Female |
| Farming, Fishing & Forestry | 0 (0.0%) | 0 (0.0%) |
| Construction & Extraction | 15 (100.0%) | 0 (0.0%) |
| Installation, Maintenance & Repair | 0 (0.0%) | 0 (0.0%) |
| Total (Category) | 15 (100.0%) | 0 (0.0%) |
| Total (Overall) | 109 (39.1%) | 170 (60.9%) |
Production, Transportation and Moving Occupations
The most common Production, Transportation and Moving occupations in Pleasant Plains are , and Production (11 | 3.9%).
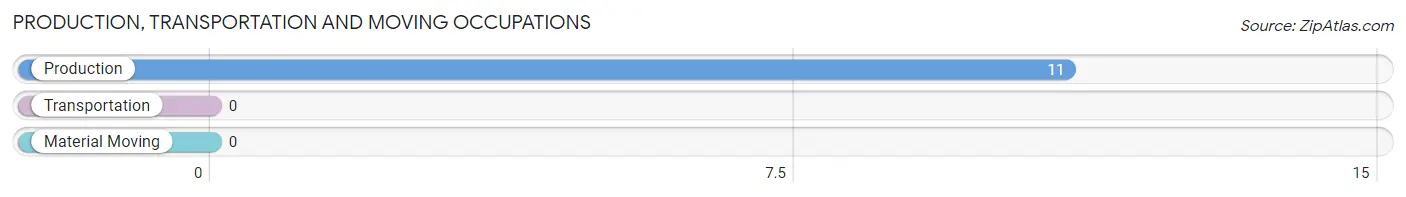
Production, Transportation and Moving Occupations by Sex
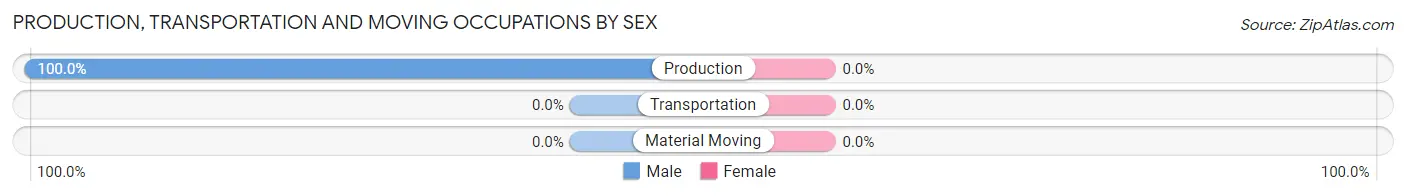
| Occupation | Male | Female |
| Production | 11 (100.0%) | 0 (0.0%) |
| Transportation | 0 (0.0%) | 0 (0.0%) |
| Material Moving | 0 (0.0%) | 0 (0.0%) |
| Total (Category) | 11 (100.0%) | 0 (0.0%) |
| Total (Overall) | 109 (39.1%) | 170 (60.9%) |
Employment Industries by Sex in Pleasant Plains
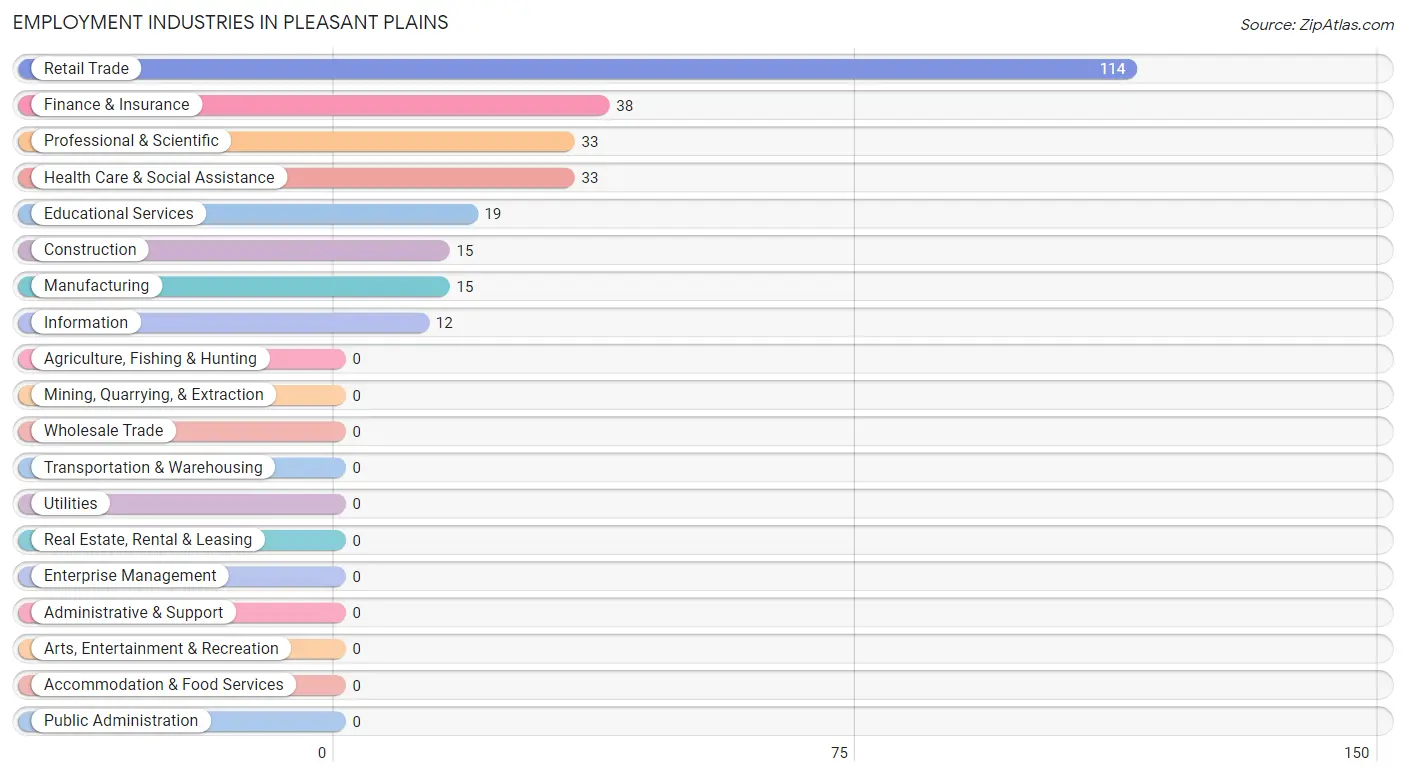
Employment Industries in Pleasant Plains
The major employment industries in Pleasant Plains include Retail Trade (114 | 40.9%), Finance & Insurance (38 | 13.6%), Professional & Scientific (33 | 11.8%), Health Care & Social Assistance (33 | 11.8%), and Educational Services (19 | 6.8%).
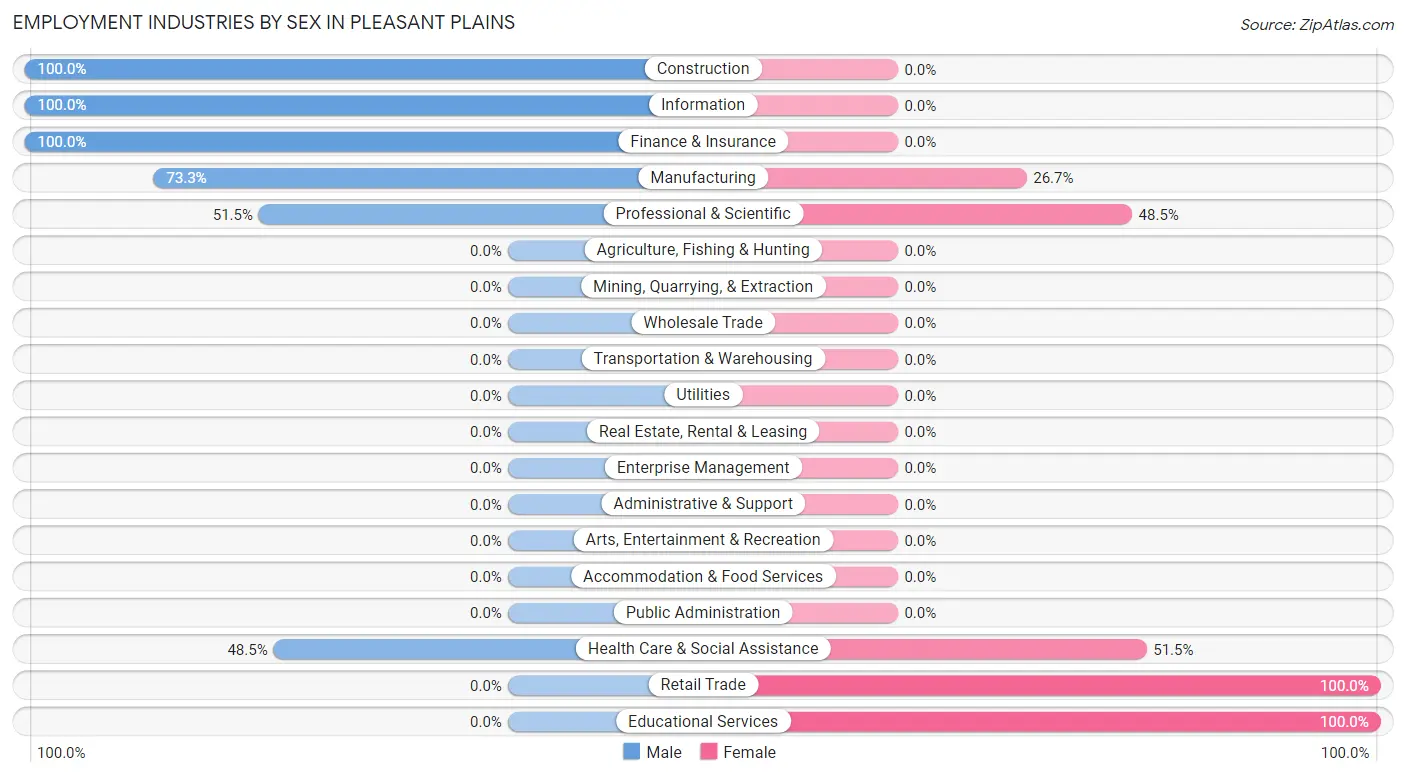
Employment Industries by Sex in Pleasant Plains
The Pleasant Plains industries that see more men than women are Construction (100.0%), Information (100.0%), and Finance & Insurance (100.0%), whereas the industries that tend to have a higher number of women are Retail Trade (100.0%), Educational Services (100.0%), and Health Care & Social Assistance (51.5%).
| Industry | Male | Female |
| Agriculture, Fishing & Hunting | 0 (0.0%) | 0 (0.0%) |
| Mining, Quarrying, & Extraction | 0 (0.0%) | 0 (0.0%) |
| Construction | 15 (100.0%) | 0 (0.0%) |
| Manufacturing | 11 (73.3%) | 4 (26.7%) |
| Wholesale Trade | 0 (0.0%) | 0 (0.0%) |
| Retail Trade | 0 (0.0%) | 114 (100.0%) |
| Transportation & Warehousing | 0 (0.0%) | 0 (0.0%) |
| Utilities | 0 (0.0%) | 0 (0.0%) |
| Information | 12 (100.0%) | 0 (0.0%) |
| Finance & Insurance | 38 (100.0%) | 0 (0.0%) |
| Real Estate, Rental & Leasing | 0 (0.0%) | 0 (0.0%) |
| Professional & Scientific | 17 (51.5%) | 16 (48.5%) |
| Enterprise Management | 0 (0.0%) | 0 (0.0%) |
| Administrative & Support | 0 (0.0%) | 0 (0.0%) |
| Educational Services | 0 (0.0%) | 19 (100.0%) |
| Health Care & Social Assistance | 16 (48.5%) | 17 (51.5%) |
| Arts, Entertainment & Recreation | 0 (0.0%) | 0 (0.0%) |
| Accommodation & Food Services | 0 (0.0%) | 0 (0.0%) |
| Public Administration | 0 (0.0%) | 0 (0.0%) |
| Total | 109 (39.1%) | 170 (60.9%) |
Education in Pleasant Plains
School Enrollment in Pleasant Plains
The most common levels of schooling among the 103 students in Pleasant Plains are middle school (50 | 48.5%), elementary school (20 | 19.4%), and high school (19 | 18.4%).
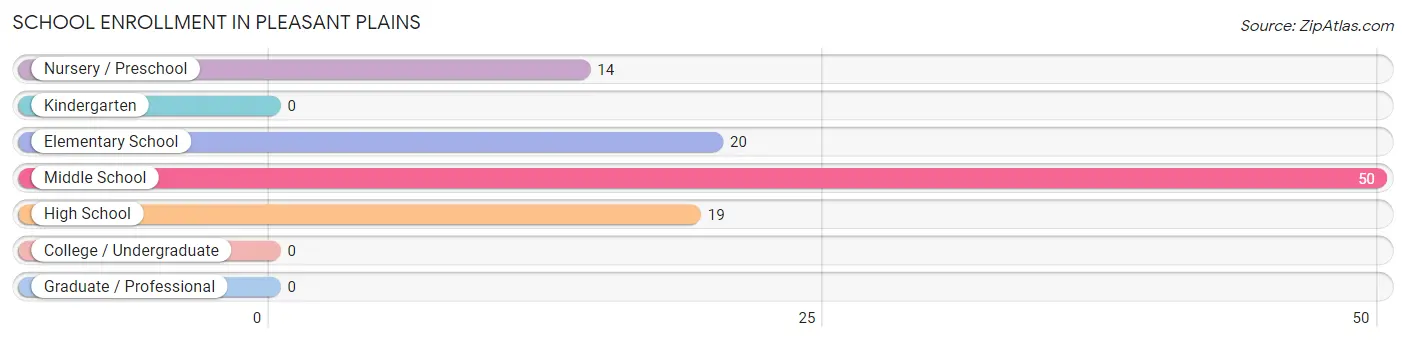
| School Level | # Students | % Students |
| Nursery / Preschool | 14 | 13.6% |
| Kindergarten | 0 | 0.0% |
| Elementary School | 20 | 19.4% |
| Middle School | 50 | 48.5% |
| High School | 19 | 18.4% |
| College / Undergraduate | 0 | 0.0% |
| Graduate / Professional | 0 | 0.0% |
| Total | 103 | 100.0% |
School Enrollment by Age by Funding Source in Pleasant Plains
Out of a total of 103 students who are enrolled in schools in Pleasant Plains, 84 (81.6%) attend a private institution, while the remaining 19 (18.4%) are enrolled in public schools. The age group of 3 to 4 year olds has the highest likelihood of being enrolled in private schools, with 14 (100.0% in the age bracket) enrolled. Conversely, the age group of 15 to 17 year olds has the lowest likelihood of being enrolled in a private school, with 19 (100.0% in the age bracket) attending a public institution.
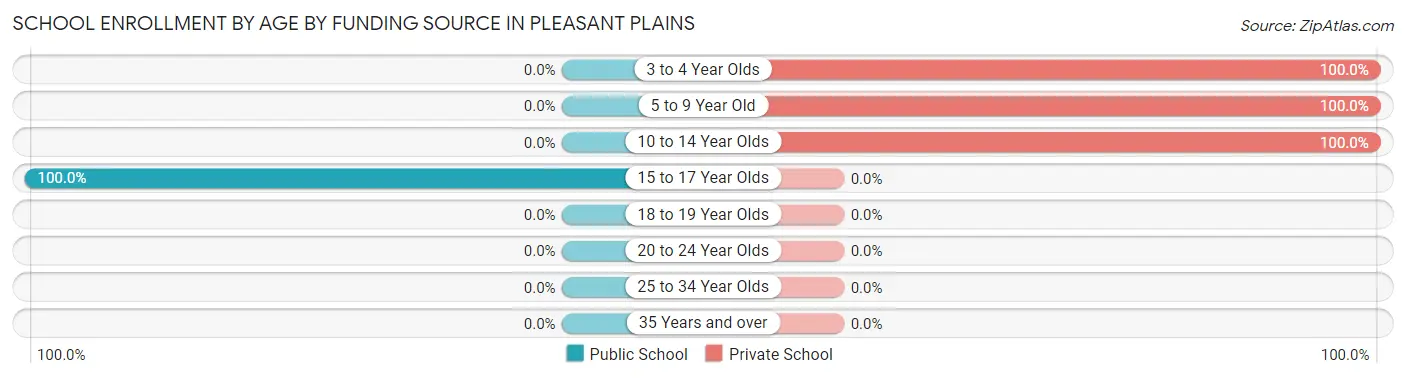
| Age Bracket | Public School | Private School |
| 3 to 4 Year Olds | 0 (0.0%) | 14 (100.0%) |
| 5 to 9 Year Old | 0 (0.0%) | 20 (100.0%) |
| 10 to 14 Year Olds | 0 (0.0%) | 50 (100.0%) |
| 15 to 17 Year Olds | 19 (100.0%) | 0 (0.0%) |
| 18 to 19 Year Olds | 0 (0.0%) | 0 (0.0%) |
| 20 to 24 Year Olds | 0 (0.0%) | 0 (0.0%) |
| 25 to 34 Year Olds | 0 (0.0%) | 0 (0.0%) |
| 35 Years and over | 0 (0.0%) | 0 (0.0%) |
| Total | 19 (18.4%) | 84 (81.6%) |
Educational Attainment by Field of Study in Pleasant Plains
Computers & mathematics (48 | 26.5%), business (35 | 19.3%), bio, nature & agricultural (27 | 14.9%), social sciences (27 | 14.9%), and education (19 | 10.5%) are the most common fields of study among 181 individuals in Pleasant Plains who have obtained a bachelor's degree or higher.
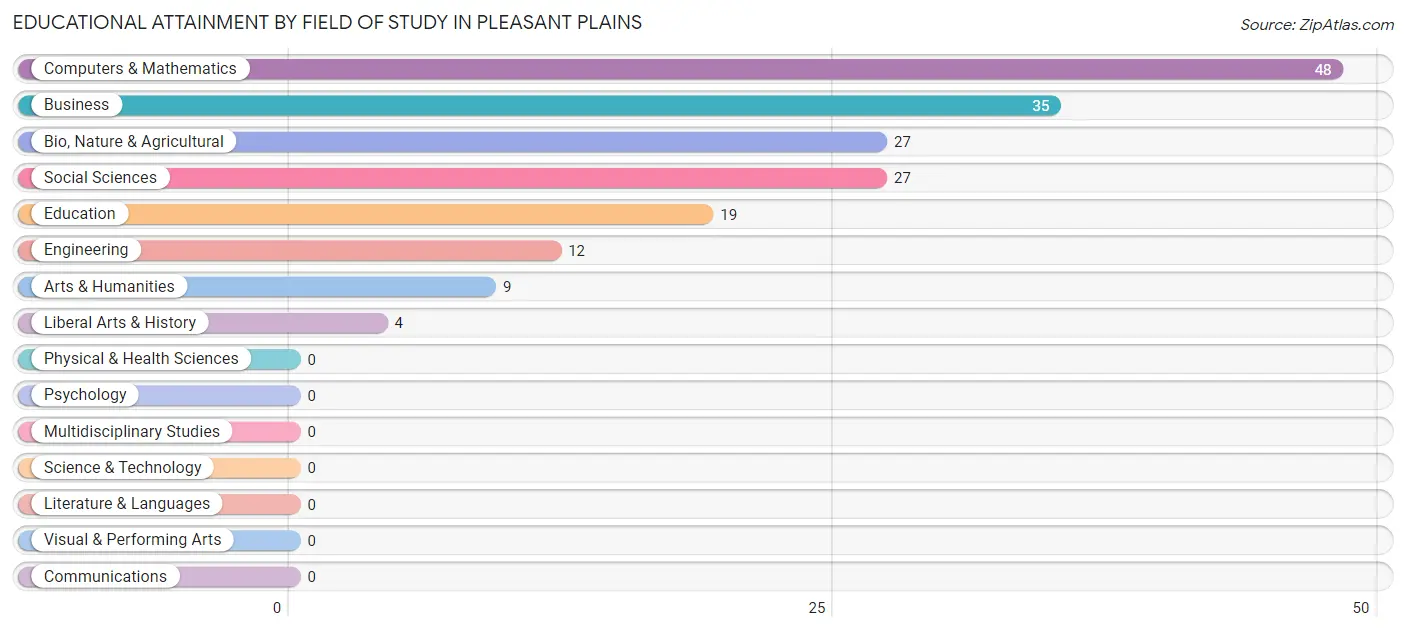
| Field of Study | # Graduates | % Graduates |
| Computers & Mathematics | 48 | 26.5% |
| Bio, Nature & Agricultural | 27 | 14.9% |
| Physical & Health Sciences | 0 | 0.0% |
| Psychology | 0 | 0.0% |
| Social Sciences | 27 | 14.9% |
| Engineering | 12 | 6.6% |
| Multidisciplinary Studies | 0 | 0.0% |
| Science & Technology | 0 | 0.0% |
| Business | 35 | 19.3% |
| Education | 19 | 10.5% |
| Literature & Languages | 0 | 0.0% |
| Liberal Arts & History | 4 | 2.2% |
| Visual & Performing Arts | 0 | 0.0% |
| Communications | 0 | 0.0% |
| Arts & Humanities | 9 | 5.0% |
| Total | 181 | 100.0% |
Transportation & Commute in Pleasant Plains
Vehicle Availability by Sex in Pleasant Plains
The most prevalent vehicle ownership categories in Pleasant Plains are males with 2 vehicles (46, accounting for 42.2%) and females with 2 vehicles (4, making up 27.1%).
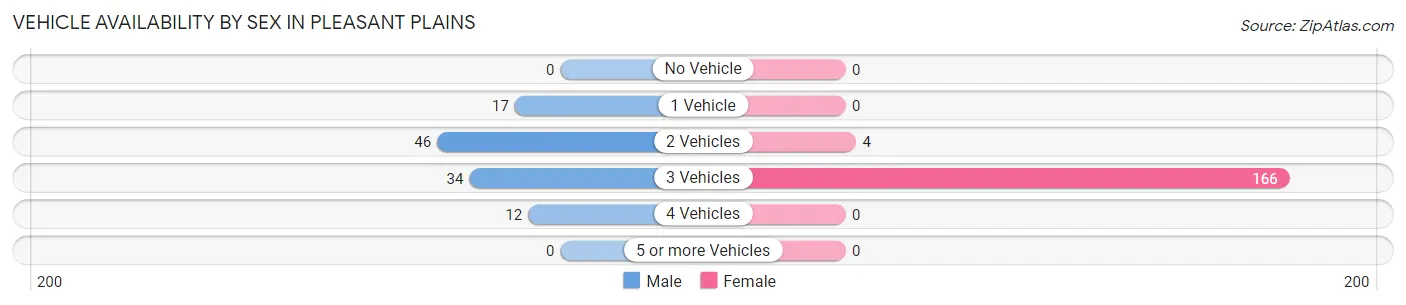
| Vehicles Available | Male | Female |
| No Vehicle | 0 (0.0%) | 0 (0.0%) |
| 1 Vehicle | 17 (15.6%) | 0 (0.0%) |
| 2 Vehicles | 46 (42.2%) | 4 (2.4%) |
| 3 Vehicles | 34 (31.2%) | 166 (97.7%) |
| 4 Vehicles | 12 (11.0%) | 0 (0.0%) |
| 5 or more Vehicles | 0 (0.0%) | 0 (0.0%) |
| Total | 109 (100.0%) | 170 (100.0%) |
Commute Time in Pleasant Plains
The most frequently occuring commute durations in Pleasant Plains are 20 to 24 minutes (35 commuters, 25.7%), 5 to 9 minutes (19 commuters, 14.0%), and 90 or more minutes (19 commuters, 14.0%).
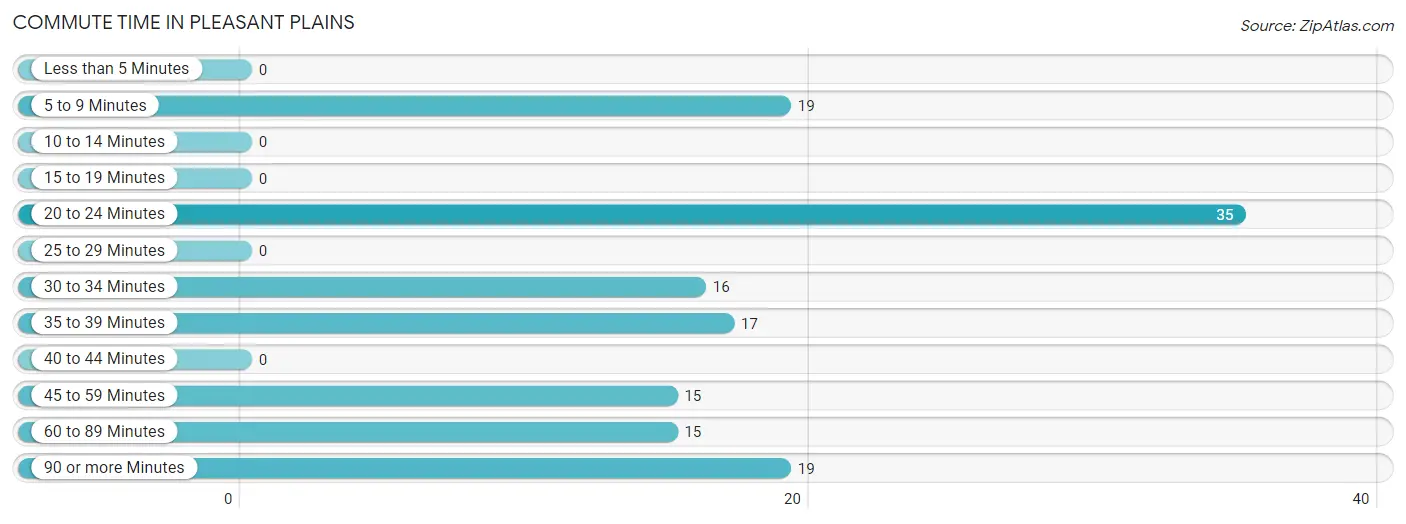
| Commute Time | # Commuters | % Commuters |
| Less than 5 Minutes | 0 | 0.0% |
| 5 to 9 Minutes | 19 | 14.0% |
| 10 to 14 Minutes | 0 | 0.0% |
| 15 to 19 Minutes | 0 | 0.0% |
| 20 to 24 Minutes | 35 | 25.7% |
| 25 to 29 Minutes | 0 | 0.0% |
| 30 to 34 Minutes | 16 | 11.8% |
| 35 to 39 Minutes | 17 | 12.5% |
| 40 to 44 Minutes | 0 | 0.0% |
| 45 to 59 Minutes | 15 | 11.0% |
| 60 to 89 Minutes | 15 | 11.0% |
| 90 or more Minutes | 19 | 14.0% |
Commute Time by Sex in Pleasant Plains
The most common commute times in Pleasant Plains are 5 to 9 minutes (19 commuters, 23.7%) for males and 20 to 24 minutes (19 commuters, 33.9%) for females.
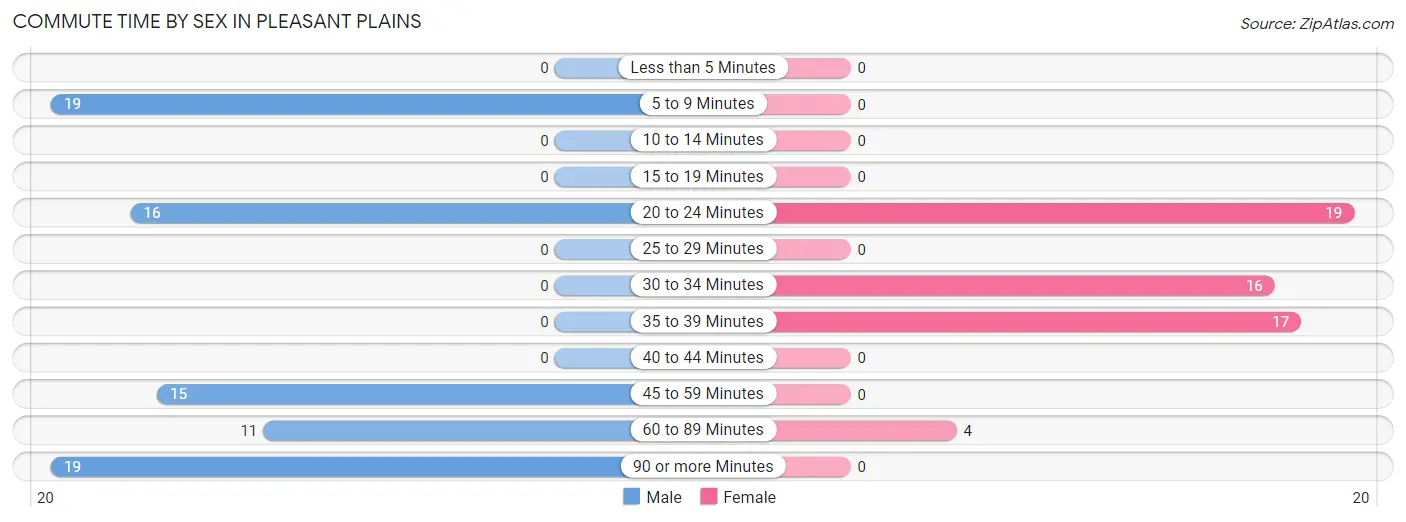
| Commute Time | Male | Female |
| Less than 5 Minutes | 0 (0.0%) | 0 (0.0%) |
| 5 to 9 Minutes | 19 (23.7%) | 0 (0.0%) |
| 10 to 14 Minutes | 0 (0.0%) | 0 (0.0%) |
| 15 to 19 Minutes | 0 (0.0%) | 0 (0.0%) |
| 20 to 24 Minutes | 16 (20.0%) | 19 (33.9%) |
| 25 to 29 Minutes | 0 (0.0%) | 0 (0.0%) |
| 30 to 34 Minutes | 0 (0.0%) | 16 (28.6%) |
| 35 to 39 Minutes | 0 (0.0%) | 17 (30.4%) |
| 40 to 44 Minutes | 0 (0.0%) | 0 (0.0%) |
| 45 to 59 Minutes | 15 (18.8%) | 0 (0.0%) |
| 60 to 89 Minutes | 11 (13.8%) | 4 (7.1%) |
| 90 or more Minutes | 19 (23.7%) | 0 (0.0%) |
Time of Departure to Work by Sex in Pleasant Plains
The most frequent times of departure to work in Pleasant Plains are 7:00 AM to 7:29 AM (45, 56.2%) for males and 7:30 AM to 7:59 AM (19, 33.9%) for females.
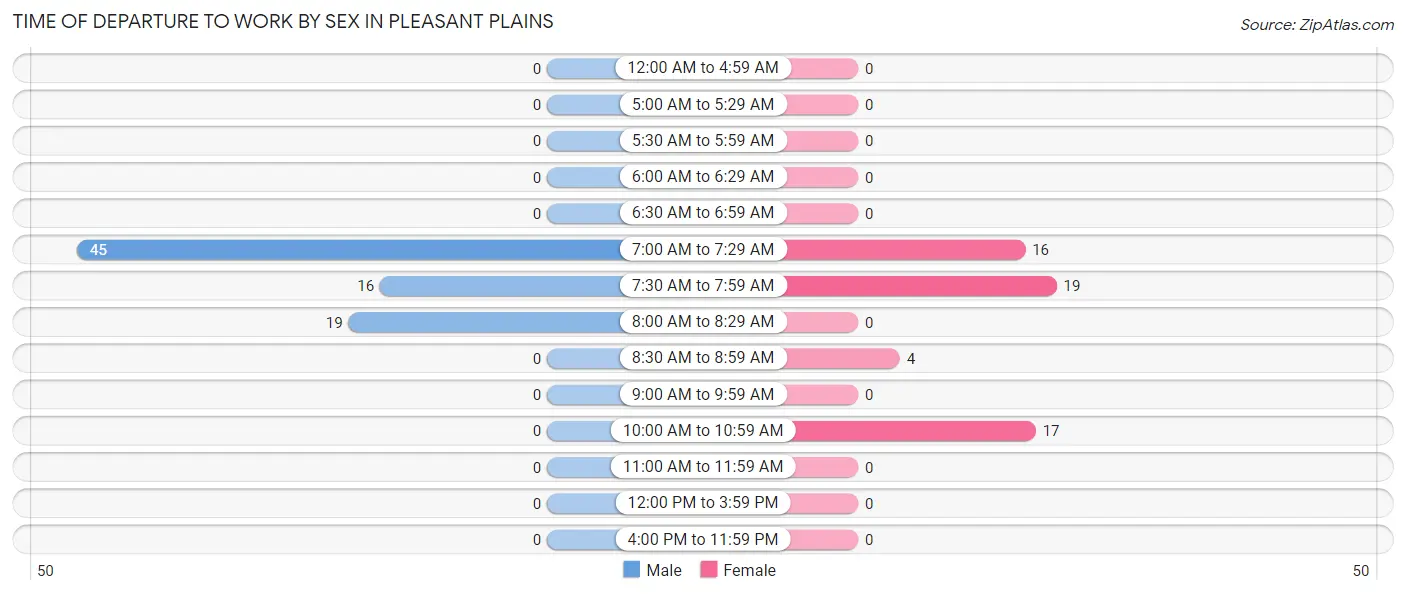
| Time of Departure | Male | Female |
| 12:00 AM to 4:59 AM | 0 (0.0%) | 0 (0.0%) |
| 5:00 AM to 5:29 AM | 0 (0.0%) | 0 (0.0%) |
| 5:30 AM to 5:59 AM | 0 (0.0%) | 0 (0.0%) |
| 6:00 AM to 6:29 AM | 0 (0.0%) | 0 (0.0%) |
| 6:30 AM to 6:59 AM | 0 (0.0%) | 0 (0.0%) |
| 7:00 AM to 7:29 AM | 45 (56.2%) | 16 (28.6%) |
| 7:30 AM to 7:59 AM | 16 (20.0%) | 19 (33.9%) |
| 8:00 AM to 8:29 AM | 19 (23.7%) | 0 (0.0%) |
| 8:30 AM to 8:59 AM | 0 (0.0%) | 4 (7.1%) |
| 9:00 AM to 9:59 AM | 0 (0.0%) | 0 (0.0%) |
| 10:00 AM to 10:59 AM | 0 (0.0%) | 17 (30.4%) |
| 11:00 AM to 11:59 AM | 0 (0.0%) | 0 (0.0%) |
| 12:00 PM to 3:59 PM | 0 (0.0%) | 0 (0.0%) |
| 4:00 PM to 11:59 PM | 0 (0.0%) | 0 (0.0%) |
| Total | 80 (100.0%) | 56 (100.0%) |
Housing Occupancy in Pleasant Plains
Occupancy by Ownership in Pleasant Plains
Of the total 178 dwellings in Pleasant Plains, owner-occupied units account for 162 (91.0%), while renter-occupied units make up 16 (9.0%).
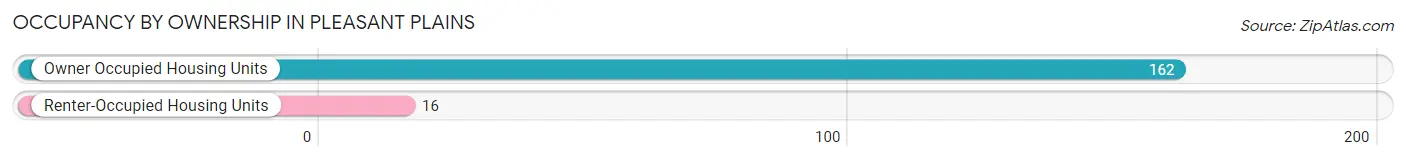
| Occupancy | # Housing Units | % Housing Units |
| Owner Occupied Housing Units | 162 | 91.0% |
| Renter-Occupied Housing Units | 16 | 9.0% |
| Total Occupied Housing Units | 178 | 100.0% |
Occupancy by Household Size in Pleasant Plains
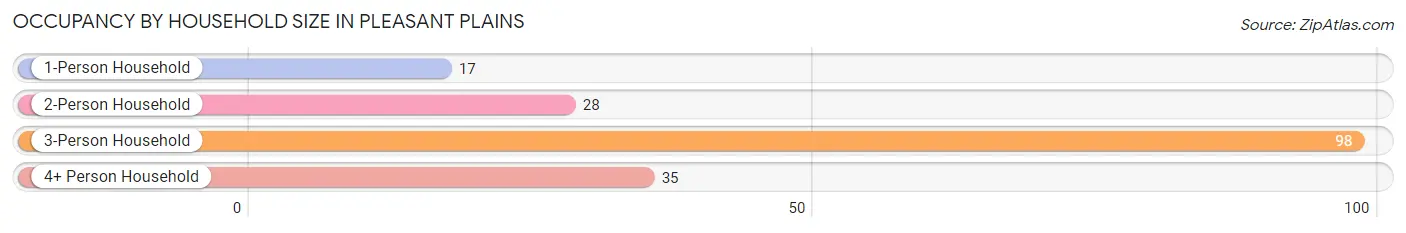
| Household Size | # Housing Units | % Housing Units |
| 1-Person Household | 17 | 9.6% |
| 2-Person Household | 28 | 15.7% |
| 3-Person Household | 98 | 55.1% |
| 4+ Person Household | 35 | 19.7% |
| Total Housing Units | 178 | 100.0% |
Occupancy by Ownership by Household Size in Pleasant Plains
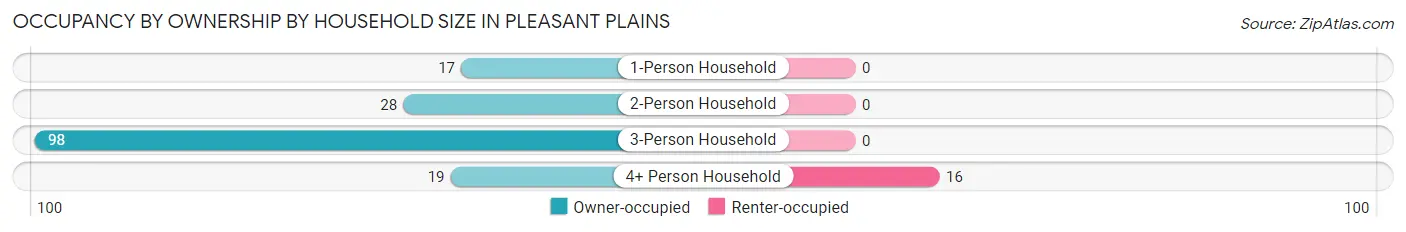
| Household Size | Owner-occupied | Renter-occupied |
| 1-Person Household | 17 (100.0%) | 0 (0.0%) |
| 2-Person Household | 28 (100.0%) | 0 (0.0%) |
| 3-Person Household | 98 (100.0%) | 0 (0.0%) |
| 4+ Person Household | 19 (54.3%) | 16 (45.7%) |
| Total Housing Units | 162 (91.0%) | 16 (9.0%) |
Occupancy by Educational Attainment in Pleasant Plains
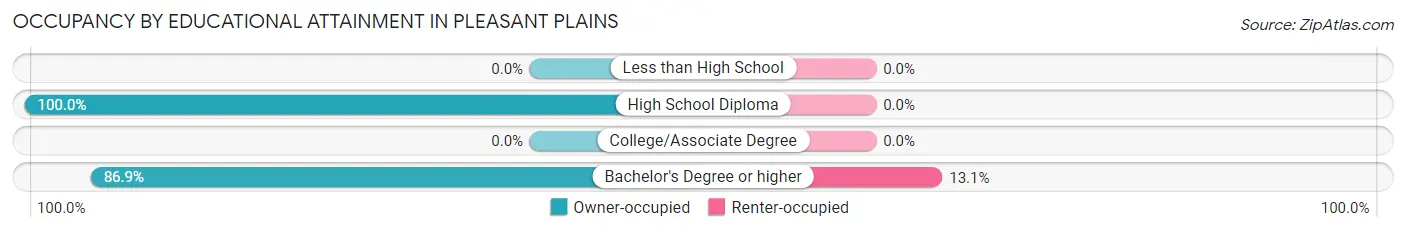
| Household Size | Owner-occupied | Renter-occupied |
| Less than High School | 0 (0.0%) | 0 (0.0%) |
| High School Diploma | 56 (100.0%) | 0 (0.0%) |
| College/Associate Degree | 0 (0.0%) | 0 (0.0%) |
| Bachelor's Degree or higher | 106 (86.9%) | 16 (13.1%) |
Occupancy by Age of Householder in Pleasant Plains
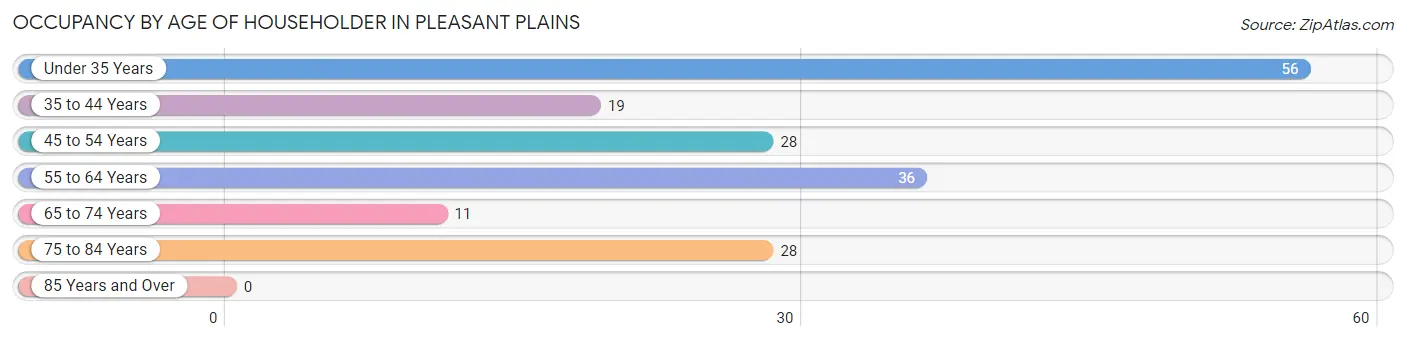
| Age Bracket | # Households | % Households |
| Under 35 Years | 56 | 31.5% |
| 35 to 44 Years | 19 | 10.7% |
| 45 to 54 Years | 28 | 15.7% |
| 55 to 64 Years | 36 | 20.2% |
| 65 to 74 Years | 11 | 6.2% |
| 75 to 84 Years | 28 | 15.7% |
| 85 Years and Over | 0 | 0.0% |
| Total | 178 | 100.0% |
Housing Finances in Pleasant Plains
Median Income by Occupancy in Pleasant Plains
| Occupancy Type | # Households | Median Income |
| Owner-Occupied | 162 (91.0%) | $0 |
| Renter-Occupied | 16 (9.0%) | $0 |
| Average | 178 (100.0%) | $0 |
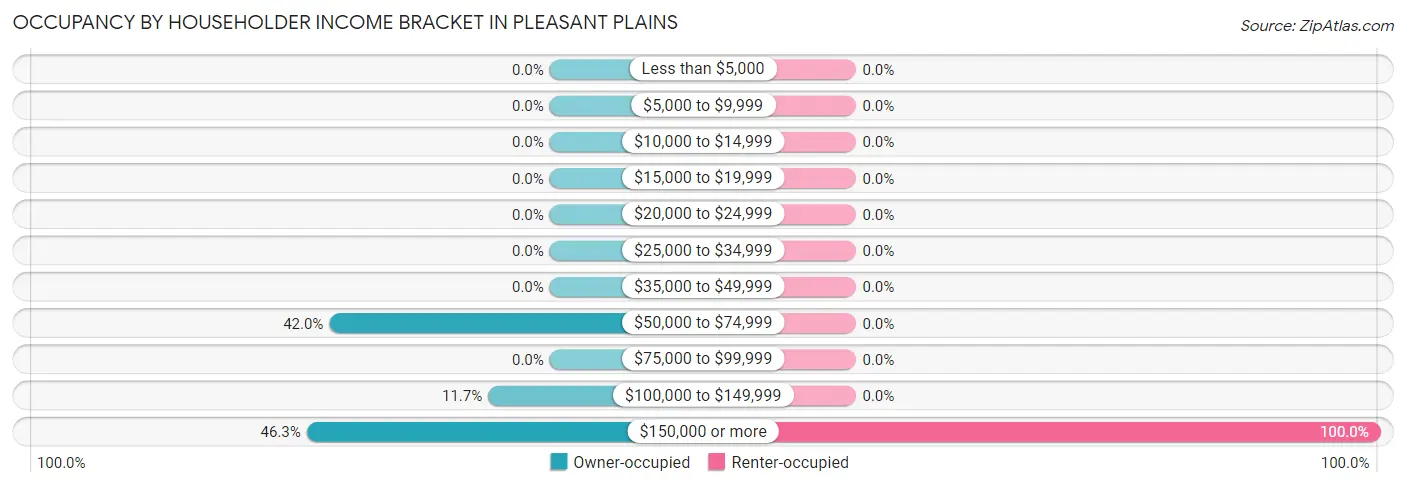
Occupancy by Householder Income Bracket in Pleasant Plains
| Income Bracket | Owner-occupied | Renter-occupied |
| Less than $5,000 | 0 (0.0%) | 0 (0.0%) |
| $5,000 to $9,999 | 0 (0.0%) | 0 (0.0%) |
| $10,000 to $14,999 | 0 (0.0%) | 0 (0.0%) |
| $15,000 to $19,999 | 0 (0.0%) | 0 (0.0%) |
| $20,000 to $24,999 | 0 (0.0%) | 0 (0.0%) |
| $25,000 to $34,999 | 0 (0.0%) | 0 (0.0%) |
| $35,000 to $49,999 | 0 (0.0%) | 0 (0.0%) |
| $50,000 to $74,999 | 68 (42.0%) | 0 (0.0%) |
| $75,000 to $99,999 | 0 (0.0%) | 0 (0.0%) |
| $100,000 to $149,999 | 19 (11.7%) | 0 (0.0%) |
| $150,000 or more | 75 (46.3%) | 16 (100.0%) |
| Total | 162 (100.0%) | 16 (100.0%) |
Monthly Housing Cost Tiers in Pleasant Plains
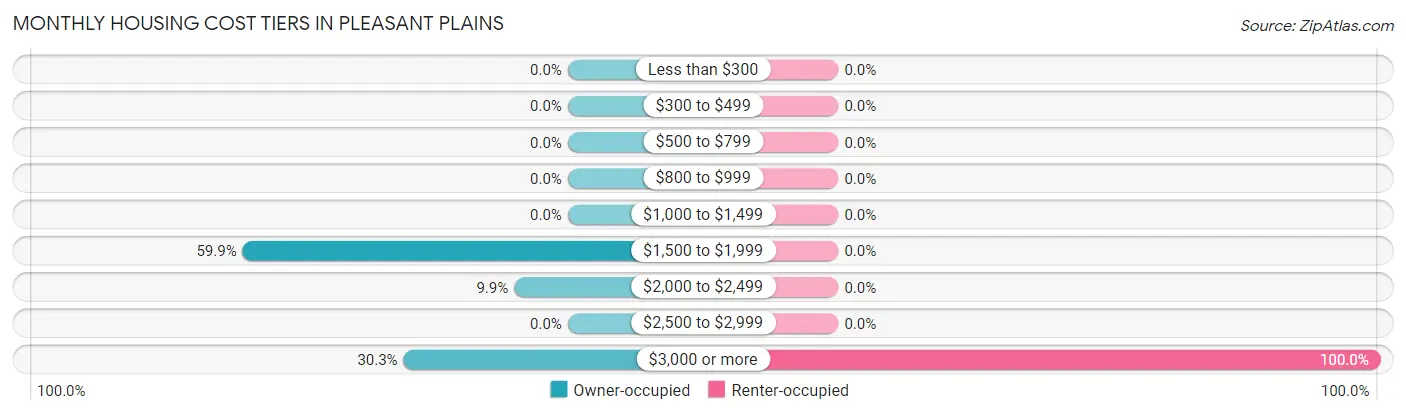
| Monthly Cost | Owner-occupied | Renter-occupied |
| Less than $300 | 0 (0.0%) | 0 (0.0%) |
| $300 to $499 | 0 (0.0%) | 0 (0.0%) |
| $500 to $799 | 0 (0.0%) | 0 (0.0%) |
| $800 to $999 | 0 (0.0%) | 0 (0.0%) |
| $1,000 to $1,499 | 0 (0.0%) | 0 (0.0%) |
| $1,500 to $1,999 | 97 (59.9%) | 0 (0.0%) |
| $2,000 to $2,499 | 16 (9.9%) | 0 (0.0%) |
| $2,500 to $2,999 | 0 (0.0%) | 0 (0.0%) |
| $3,000 or more | 49 (30.2%) | 16 (100.0%) |
| Total | 162 (100.0%) | 16 (100.0%) |
Physical Housing Characteristics in Pleasant Plains
Housing Structures in Pleasant Plains
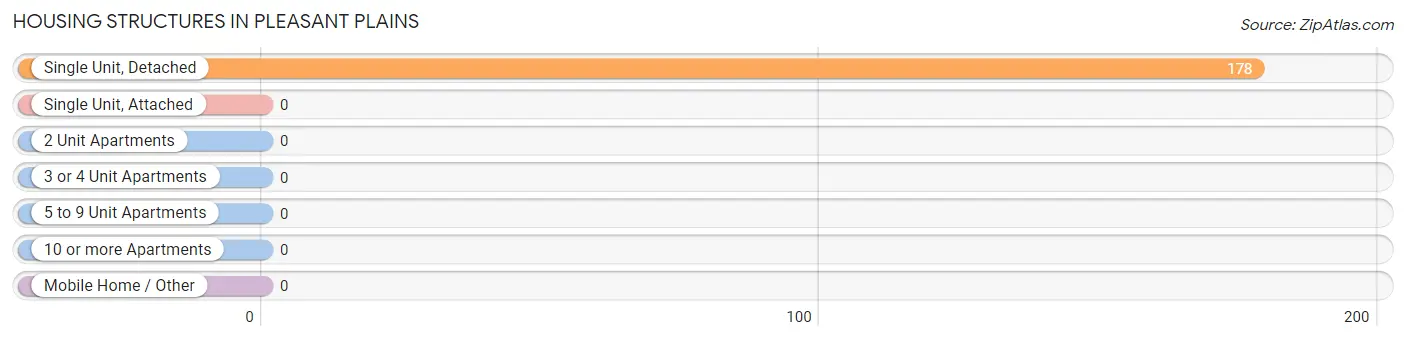
| Structure Type | # Housing Units | % Housing Units |
| Single Unit, Detached | 178 | 100.0% |
| Single Unit, Attached | 0 | 0.0% |
| 2 Unit Apartments | 0 | 0.0% |
| 3 or 4 Unit Apartments | 0 | 0.0% |
| 5 to 9 Unit Apartments | 0 | 0.0% |
| 10 or more Apartments | 0 | 0.0% |
| Mobile Home / Other | 0 | 0.0% |
| Total | 178 | 100.0% |
Housing Structures by Occupancy in Pleasant Plains
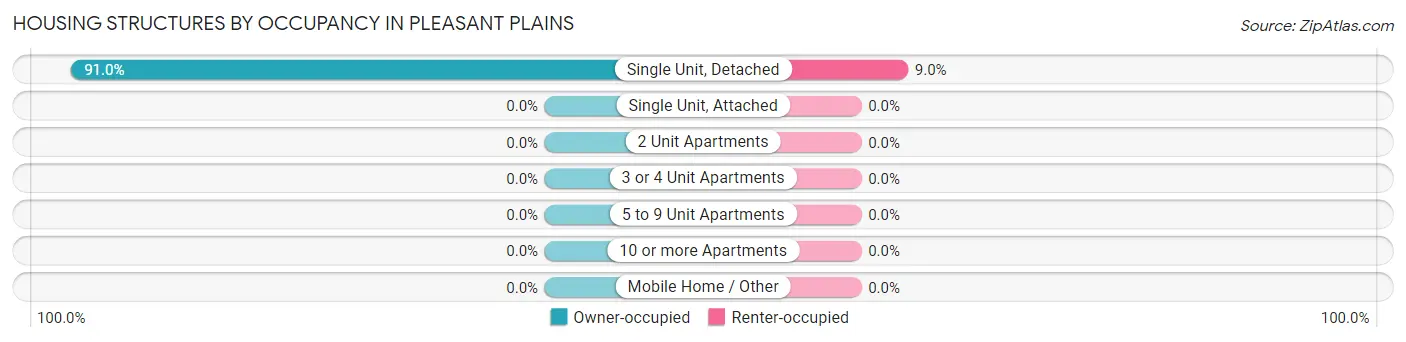
| Structure Type | Owner-occupied | Renter-occupied |
| Single Unit, Detached | 162 (91.0%) | 16 (9.0%) |
| Single Unit, Attached | 0 (0.0%) | 0 (0.0%) |
| 2 Unit Apartments | 0 (0.0%) | 0 (0.0%) |
| 3 or 4 Unit Apartments | 0 (0.0%) | 0 (0.0%) |
| 5 to 9 Unit Apartments | 0 (0.0%) | 0 (0.0%) |
| 10 or more Apartments | 0 (0.0%) | 0 (0.0%) |
| Mobile Home / Other | 0 (0.0%) | 0 (0.0%) |
| Total | 162 (91.0%) | 16 (9.0%) |
Housing Structures by Number of Rooms in Pleasant Plains
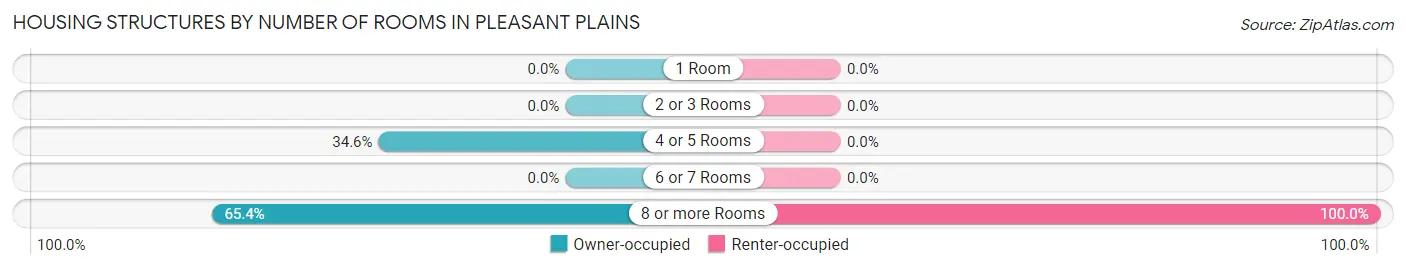
| Number of Rooms | Owner-occupied | Renter-occupied |
| 1 Room | 0 (0.0%) | 0 (0.0%) |
| 2 or 3 Rooms | 0 (0.0%) | 0 (0.0%) |
| 4 or 5 Rooms | 56 (34.6%) | 0 (0.0%) |
| 6 or 7 Rooms | 0 (0.0%) | 0 (0.0%) |
| 8 or more Rooms | 106 (65.4%) | 16 (100.0%) |
| Total | 162 (100.0%) | 16 (100.0%) |
Housing Structure by Heating Type in Pleasant Plains
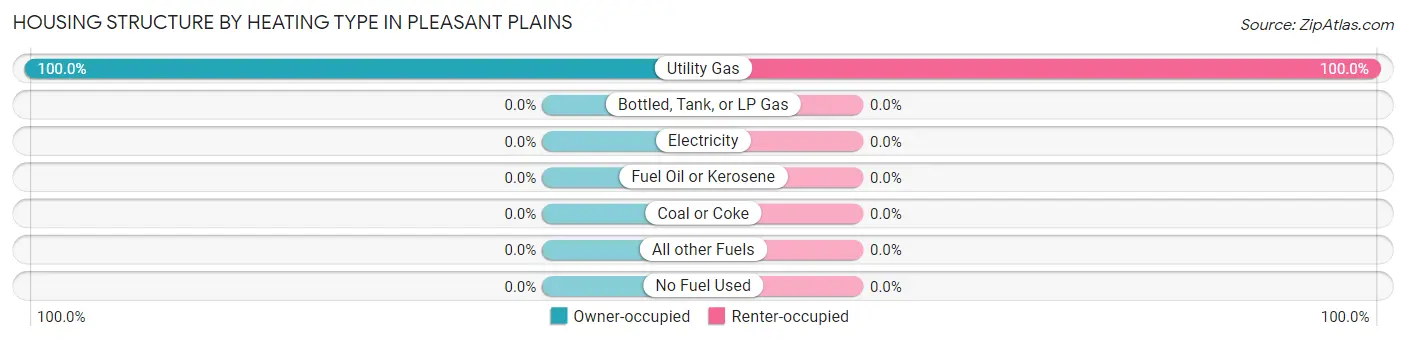
| Heating Type | Owner-occupied | Renter-occupied |
| Utility Gas | 162 (100.0%) | 16 (100.0%) |
| Bottled, Tank, or LP Gas | 0 (0.0%) | 0 (0.0%) |
| Electricity | 0 (0.0%) | 0 (0.0%) |
| Fuel Oil or Kerosene | 0 (0.0%) | 0 (0.0%) |
| Coal or Coke | 0 (0.0%) | 0 (0.0%) |
| All other Fuels | 0 (0.0%) | 0 (0.0%) |
| No Fuel Used | 0 (0.0%) | 0 (0.0%) |
| Total | 162 (100.0%) | 16 (100.0%) |
Household Vehicle Usage in Pleasant Plains
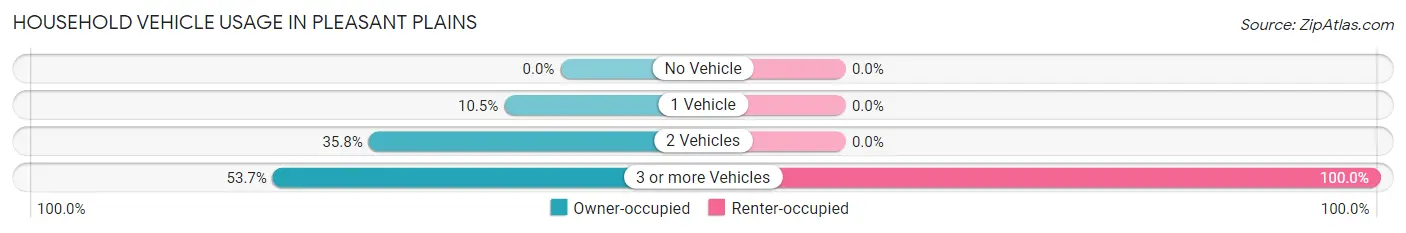
| Vehicles per Household | Owner-occupied | Renter-occupied |
| No Vehicle | 0 (0.0%) | 0 (0.0%) |
| 1 Vehicle | 17 (10.5%) | 0 (0.0%) |
| 2 Vehicles | 58 (35.8%) | 0 (0.0%) |
| 3 or more Vehicles | 87 (53.7%) | 16 (100.0%) |
| Total | 162 (100.0%) | 16 (100.0%) |
Real Estate & Mortgages in Pleasant Plains
Real Estate and Mortgage Overview in Pleasant Plains
| Characteristic | Without Mortgage | With Mortgage |
| Housing Units | 57 | 105 |
| Median Property Value | $745,700 | $0 |
| Median Household Income | $250,001 | $30 |
| Monthly Housing Costs | $1,501 | $49 |
| Real Estate Taxes | $10,001 | $0 |
Property Value by Mortgage Status in Pleasant Plains
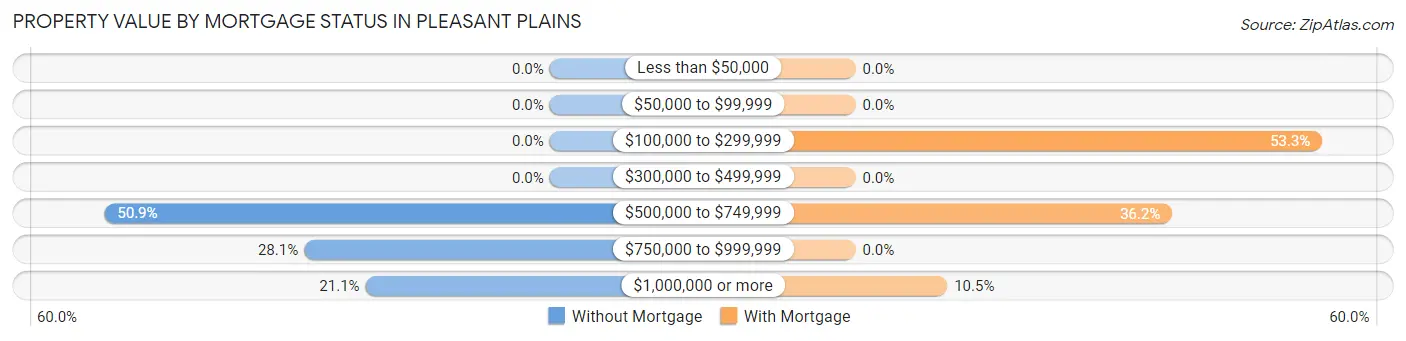
| Property Value | Without Mortgage | With Mortgage |
| Less than $50,000 | 0 (0.0%) | 0 (0.0%) |
| $50,000 to $99,999 | 0 (0.0%) | 0 (0.0%) |
| $100,000 to $299,999 | 0 (0.0%) | 56 (53.3%) |
| $300,000 to $499,999 | 0 (0.0%) | 0 (0.0%) |
| $500,000 to $749,999 | 29 (50.9%) | 38 (36.2%) |
| $750,000 to $999,999 | 16 (28.1%) | 0 (0.0%) |
| $1,000,000 or more | 12 (21.0%) | 11 (10.5%) |
| Total | 57 (100.0%) | 105 (100.0%) |
Household Income by Mortgage Status in Pleasant Plains
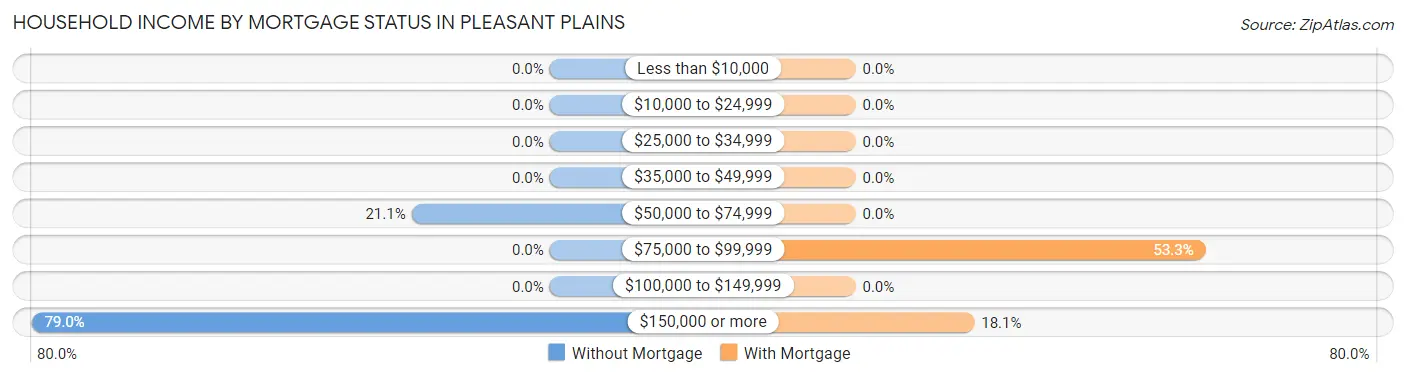
| Household Income | Without Mortgage | With Mortgage |
| Less than $10,000 | 0 (0.0%) | 0 (0.0%) |
| $10,000 to $24,999 | 0 (0.0%) | 0 (0.0%) |
| $25,000 to $34,999 | 0 (0.0%) | 0 (0.0%) |
| $35,000 to $49,999 | 0 (0.0%) | 0 (0.0%) |
| $50,000 to $74,999 | 12 (21.0%) | 0 (0.0%) |
| $75,000 to $99,999 | 0 (0.0%) | 56 (53.3%) |
| $100,000 to $149,999 | 0 (0.0%) | 0 (0.0%) |
| $150,000 or more | 45 (78.9%) | 19 (18.1%) |
| Total | 57 (100.0%) | 105 (100.0%) |
Property Value to Household Income Ratio in Pleasant Plains
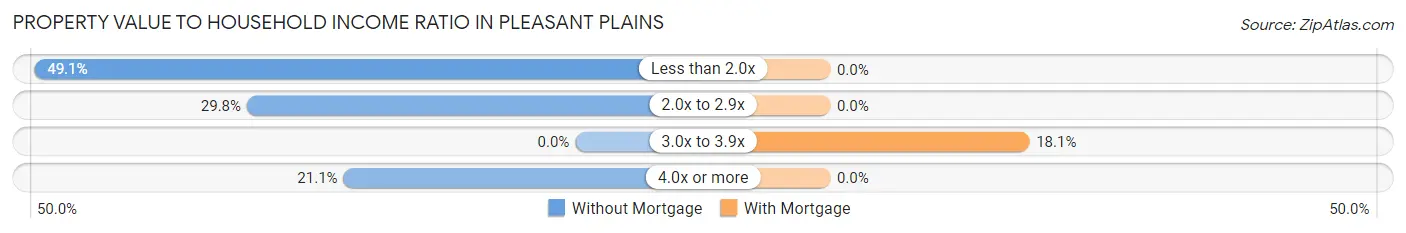
| Value-to-Income Ratio | Without Mortgage | With Mortgage |
| Less than 2.0x | 28 (49.1%) | 0 (0.0%) |
| 2.0x to 2.9x | 17 (29.8%) | 0 (0.0%) |
| 3.0x to 3.9x | 0 (0.0%) | 19 (18.1%) |
| 4.0x or more | 12 (21.0%) | 0 (0.0%) |
| Total | 57 (100.0%) | 105 (100.0%) |
Real Estate Taxes by Mortgage Status in Pleasant Plains
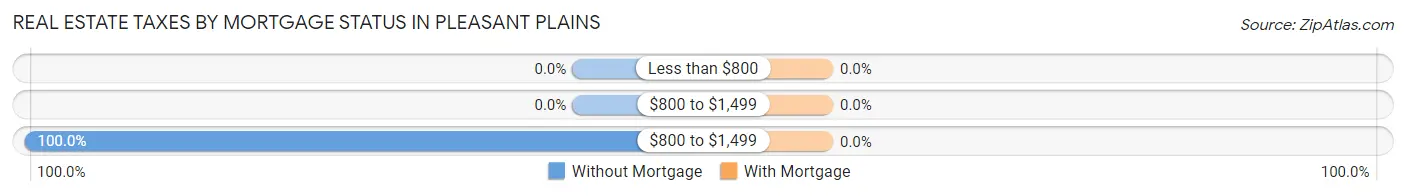
| Property Taxes | Without Mortgage | With Mortgage |
| Less than $800 | 0 (0.0%) | 0 (0.0%) |
| $800 to $1,499 | 0 (0.0%) | 0 (0.0%) |
| $800 to $1,499 | 57 (100.0%) | 0 (0.0%) |
| Total | 57 (100.0%) | 105 (100.0%) |
Health & Disability in Pleasant Plains
Health Insurance Coverage by Age in Pleasant Plains
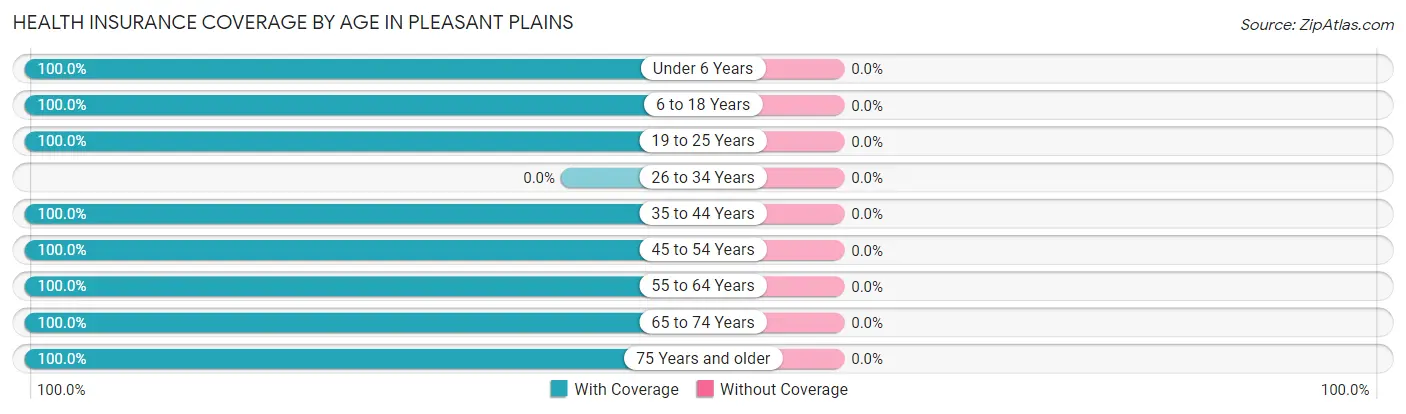
| Age Bracket | With Coverage | Without Coverage |
| Under 6 Years | 14 (100.0%) | 0 (0.0%) |
| 6 to 18 Years | 89 (100.0%) | 0 (0.0%) |
| 19 to 25 Years | 114 (100.0%) | 0 (0.0%) |
| 26 to 34 Years | 0 (0.0%) | 0 (0.0%) |
| 35 to 44 Years | 38 (100.0%) | 0 (0.0%) |
| 45 to 54 Years | 93 (100.0%) | 0 (0.0%) |
| 55 to 64 Years | 55 (100.0%) | 0 (0.0%) |
| 65 to 74 Years | 68 (100.0%) | 0 (0.0%) |
| 75 Years and older | 54 (100.0%) | 0 (0.0%) |
| Total | 525 (100.0%) | 0 (0.0%) |
Health Insurance Coverage by Citizenship Status in Pleasant Plains
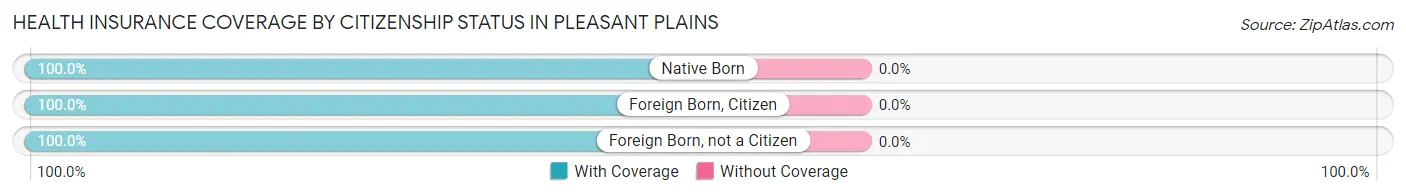
| Citizenship Status | With Coverage | Without Coverage |
| Native Born | 14 (100.0%) | 0 (0.0%) |
| Foreign Born, Citizen | 89 (100.0%) | 0 (0.0%) |
| Foreign Born, not a Citizen | 114 (100.0%) | 0 (0.0%) |
Health Insurance Coverage by Household Income in Pleasant Plains
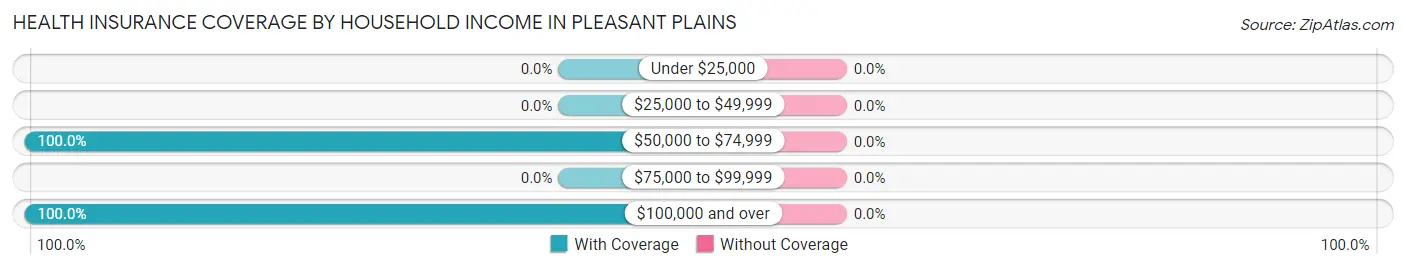
| Household Income | With Coverage | Without Coverage |
| Under $25,000 | 0 (0.0%) | 0 (0.0%) |
| $25,000 to $49,999 | 0 (0.0%) | 0 (0.0%) |
| $50,000 to $74,999 | 170 (100.0%) | 0 (0.0%) |
| $75,000 to $99,999 | 0 (0.0%) | 0 (0.0%) |
| $100,000 and over | 355 (100.0%) | 0 (0.0%) |
Public vs Private Health Insurance Coverage by Age in Pleasant Plains
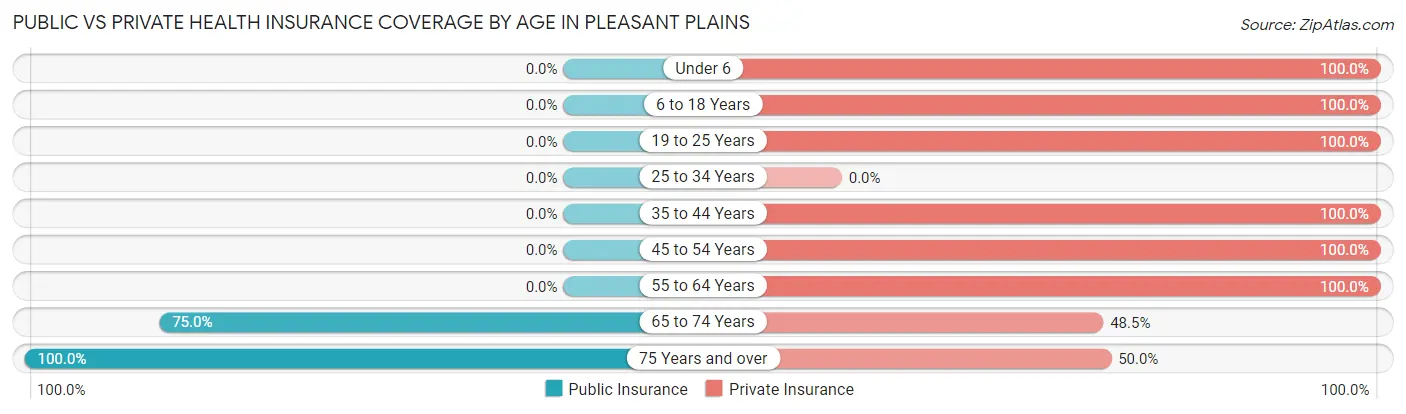
| Age Bracket | Public Insurance | Private Insurance |
| Under 6 | 0 (0.0%) | 14 (100.0%) |
| 6 to 18 Years | 0 (0.0%) | 89 (100.0%) |
| 19 to 25 Years | 0 (0.0%) | 114 (100.0%) |
| 25 to 34 Years | 0 (0.0%) | 0 (0.0%) |
| 35 to 44 Years | 0 (0.0%) | 38 (100.0%) |
| 45 to 54 Years | 0 (0.0%) | 93 (100.0%) |
| 55 to 64 Years | 0 (0.0%) | 55 (100.0%) |
| 65 to 74 Years | 51 (75.0%) | 33 (48.5%) |
| 75 Years and over | 54 (100.0%) | 27 (50.0%) |
| Total | 105 (20.0%) | 463 (88.2%) |
Disability Status by Sex by Age in Pleasant Plains
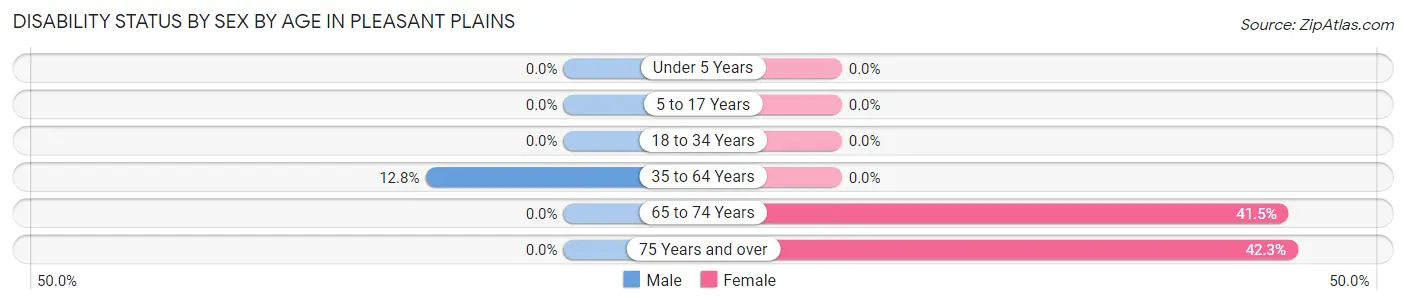
| Age Bracket | Male | Female |
| Under 5 Years | 0 (0.0%) | 0 (0.0%) |
| 5 to 17 Years | 0 (0.0%) | 0 (0.0%) |
| 18 to 34 Years | 0 (0.0%) | 0 (0.0%) |
| 35 to 64 Years | 15 (12.8%) | 0 (0.0%) |
| 65 to 74 Years | 0 (0.0%) | 17 (41.5%) |
| 75 Years and over | 0 (0.0%) | 11 (42.3%) |
Disability Class by Sex by Age in Pleasant Plains
Disability Class: Hearing Difficulty
| Age Bracket | Male | Female |
| Under 5 Years | 0 (0.0%) | 0 (0.0%) |
| 5 to 17 Years | 0 (0.0%) | 0 (0.0%) |
| 18 to 34 Years | 0 (0.0%) | 0 (0.0%) |
| 35 to 64 Years | 0 (0.0%) | 0 (0.0%) |
| 65 to 74 Years | 0 (0.0%) | 0 (0.0%) |
| 75 Years and over | 0 (0.0%) | 0 (0.0%) |
Disability Class: Vision Difficulty
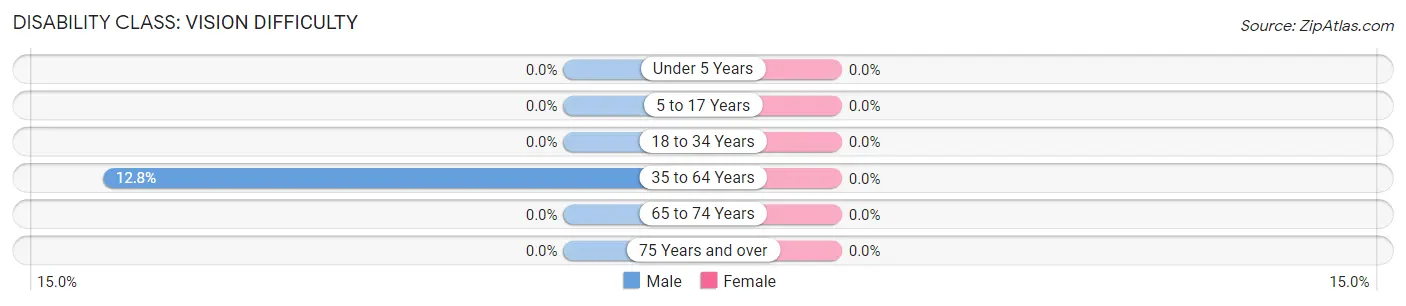
| Age Bracket | Male | Female |
| Under 5 Years | 0 (0.0%) | 0 (0.0%) |
| 5 to 17 Years | 0 (0.0%) | 0 (0.0%) |
| 18 to 34 Years | 0 (0.0%) | 0 (0.0%) |
| 35 to 64 Years | 15 (12.8%) | 0 (0.0%) |
| 65 to 74 Years | 0 (0.0%) | 0 (0.0%) |
| 75 Years and over | 0 (0.0%) | 0 (0.0%) |
Disability Class: Cognitive Difficulty
| Age Bracket | Male | Female |
| 5 to 17 Years | 0 (0.0%) | 0 (0.0%) |
| 18 to 34 Years | 0 (0.0%) | 0 (0.0%) |
| 35 to 64 Years | 0 (0.0%) | 0 (0.0%) |
| 65 to 74 Years | 0 (0.0%) | 0 (0.0%) |
| 75 Years and over | 0 (0.0%) | 0 (0.0%) |
Disability Class: Ambulatory Difficulty
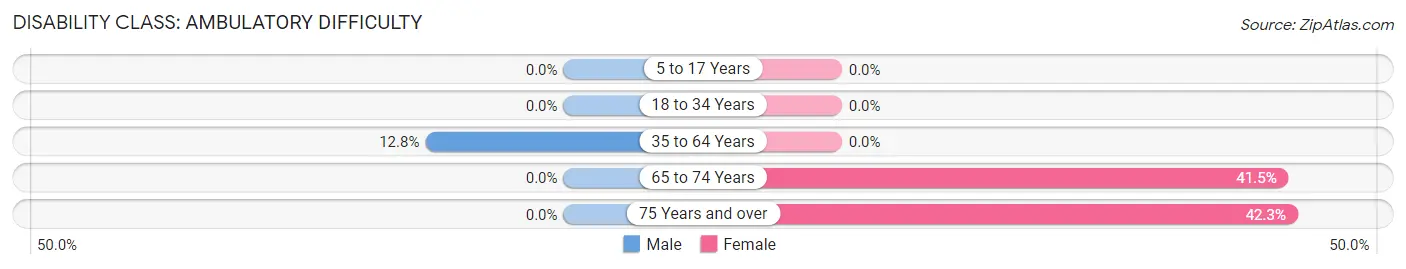
| Age Bracket | Male | Female |
| 5 to 17 Years | 0 (0.0%) | 0 (0.0%) |
| 18 to 34 Years | 0 (0.0%) | 0 (0.0%) |
| 35 to 64 Years | 15 (12.8%) | 0 (0.0%) |
| 65 to 74 Years | 0 (0.0%) | 17 (41.5%) |
| 75 Years and over | 0 (0.0%) | 11 (42.3%) |
Disability Class: Self-Care Difficulty
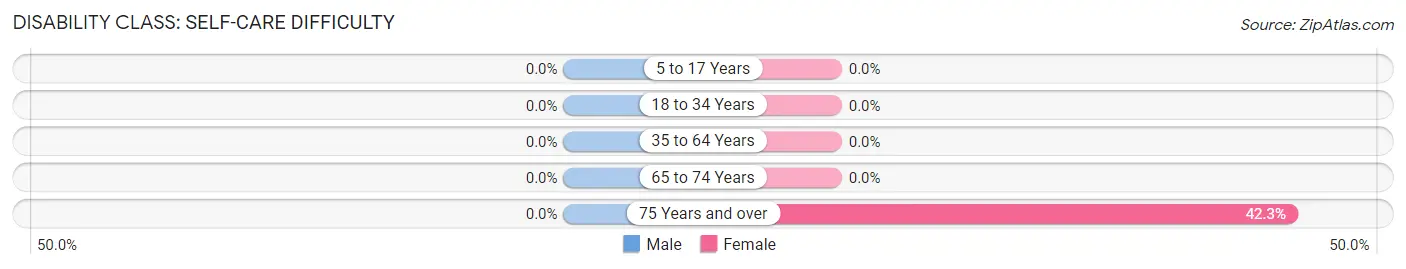
| Age Bracket | Male | Female |
| 5 to 17 Years | 0 (0.0%) | 0 (0.0%) |
| 18 to 34 Years | 0 (0.0%) | 0 (0.0%) |
| 35 to 64 Years | 0 (0.0%) | 0 (0.0%) |
| 65 to 74 Years | 0 (0.0%) | 0 (0.0%) |
| 75 Years and over | 0 (0.0%) | 11 (42.3%) |
Technology Access in Pleasant Plains
Computing Device Access in Pleasant Plains
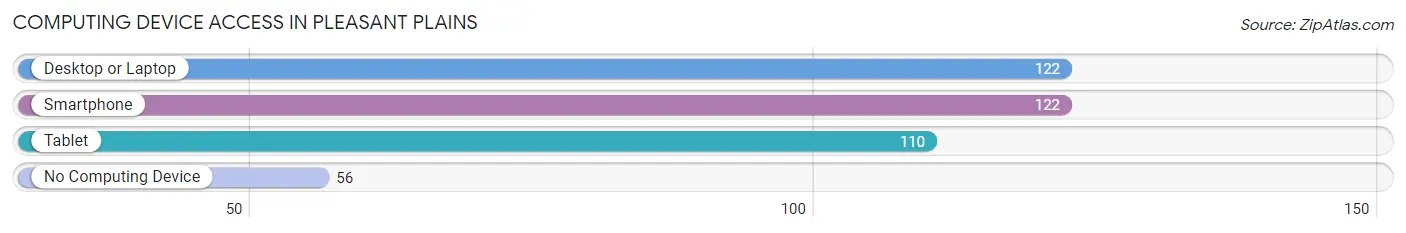
| Device Type | # Households | % Households |
| Desktop or Laptop | 122 | 68.5% |
| Smartphone | 122 | 68.5% |
| Tablet | 110 | 61.8% |
| No Computing Device | 56 | 31.5% |
| Total | 178 | 100.0% |
Internet Access in Pleasant Plains
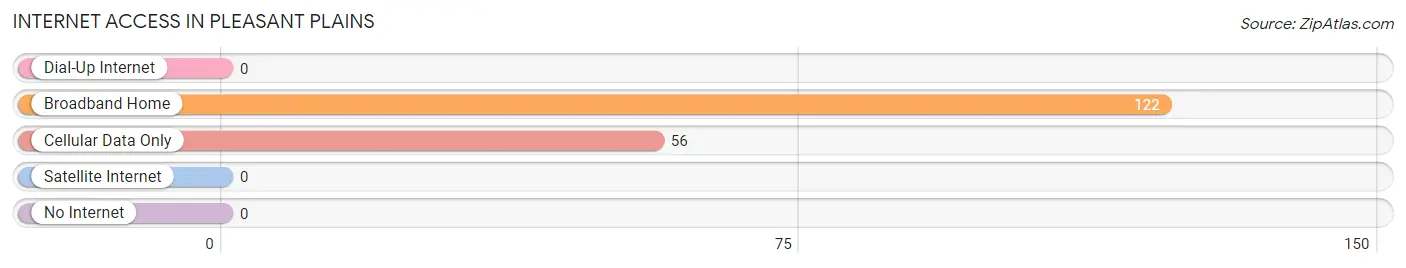
| Internet Type | # Households | % Households |
| Dial-Up Internet | 0 | 0.0% |
| Broadband Home | 122 | 68.5% |
| Cellular Data Only | 56 | 31.5% |
| Satellite Internet | 0 | 0.0% |
| No Internet | 0 | 0.0% |
| Total | 178 | 100.0% |
Pleasant Plains Summary
Pleasant Plains is a small unincorporated community located in Atlantic County, New Jersey. It is situated in the northern part of the county, just south of the city of Atlantic City. The community is bordered by the towns of Egg Harbor Township, Hamilton Township, and Galloway Township. The population of Pleasant Plains was estimated to be 1,845 in 2019.
History
Pleasant Plains was first settled in the late 1700s by a group of Quakers from Pennsylvania. The community was originally known as Quaker Plains, but the name was changed to Pleasant Plains in 1845. The community was largely agricultural, with many of the residents growing vegetables and raising livestock. The area was also known for its cranberry bogs, which were a major source of income for the community.
In the late 1800s, the area began to experience a period of growth and development. The Atlantic City and Shore Railroad was built through the area in 1883, connecting Pleasant Plains to Atlantic City and other nearby towns. This allowed for increased trade and commerce in the area, and the population began to grow.
Geography
Pleasant Plains is located in northern Atlantic County, just south of the city of Atlantic City. The community is bordered by the towns of Egg Harbor Township, Hamilton Township, and Galloway Township. The area is mostly flat, with some rolling hills in the northern part of the community. The soil in the area is mostly sandy, with some areas of clay.
The climate in Pleasant Plains is typical of the mid-Atlantic region, with hot, humid summers and cold, wet winters. The average annual temperature is around 55 degrees Fahrenheit, with an average annual precipitation of around 45 inches.
Economy
The economy of Pleasant Plains is largely based on agriculture and tourism. The area is known for its cranberry bogs, which are a major source of income for the community. The area is also home to several small businesses, including restaurants, retail stores, and service providers.
The area is also home to several casinos, which are a major source of employment and income for the community. The casinos provide jobs for many of the residents, as well as bringing in tourists from all over the world.
Demographics
The population of Pleasant Plains was estimated to be 1,845 in 2019. The population is largely white, with a small percentage of African Americans and Hispanics. The median household income in the area is around $50,000, and the median home value is around $200,000.
The area is served by the Pleasant Plains School District, which includes two elementary schools, one middle school, and one high school. The area is also home to several churches, including the Pleasant Plains United Methodist Church and the Pleasant Plains Presbyterian Church.
Conclusion
Pleasant Plains is a small unincorporated community located in Atlantic County, New Jersey. The area has a long history, dating back to the late 1700s when it was first settled by a group of Quakers. The economy of the area is largely based on agriculture and tourism, with the area being known for its cranberry bogs and casinos. The population of Pleasant Plains was estimated to be 1,845 in 2019, and the median household income is around $50,000. The area is served by the Pleasant Plains School District, and is home to several churches.
Common Questions
What is Per Capita Income in Pleasant Plains?
Per Capita income in Pleasant Plains is $92,098.
What is Inequality or Gini Index in Pleasant Plains?
Inequality or Gini Index in Pleasant Plains is 0.49.
What is the Total Population of Pleasant Plains?
Total Population of Pleasant Plains is 525.
What is the Total Male Population of Pleasant Plains?
Total Male Population of Pleasant Plains is 203.
What is the Total Female Population of Pleasant Plains?
Total Female Population of Pleasant Plains is 322.
What is the Ratio of Males per 100 Females in Pleasant Plains?
There are 63.04 Males per 100 Females in Pleasant Plains.
What is the Ratio of Females per 100 Males in Pleasant Plains?
There are 158.62 Females per 100 Males in Pleasant Plains.
What is the Median Population Age in Pleasant Plains?
Median Population Age in Pleasant Plains is 45.5 Years.
What is the Average Family Size in Pleasant Plains
Average Family Size in Pleasant Plains is 2.8 People.
What is the Average Household Size in Pleasant Plains
Average Household Size in Pleasant Plains is 3.0 People.
How Large is the Labor Force in Pleasant Plains?
There are 314 People in the Labor Forcein in Pleasant Plains.
What is the Percentage of People in the Labor Force in Pleasant Plains?
74.4% of People are in the Labor Force in Pleasant Plains.
What is the Unemployment Rate in Pleasant Plains?
Unemployment Rate in Pleasant Plains is 11.1%.