Zip Codes with the Highest Percentage of Population Employed in Computer, Engineering & Science in Montclair, NJ
RELATED REPORTS & OPTIONS
Computer, Engineering & Science
Montclair
Compare Zip Codes
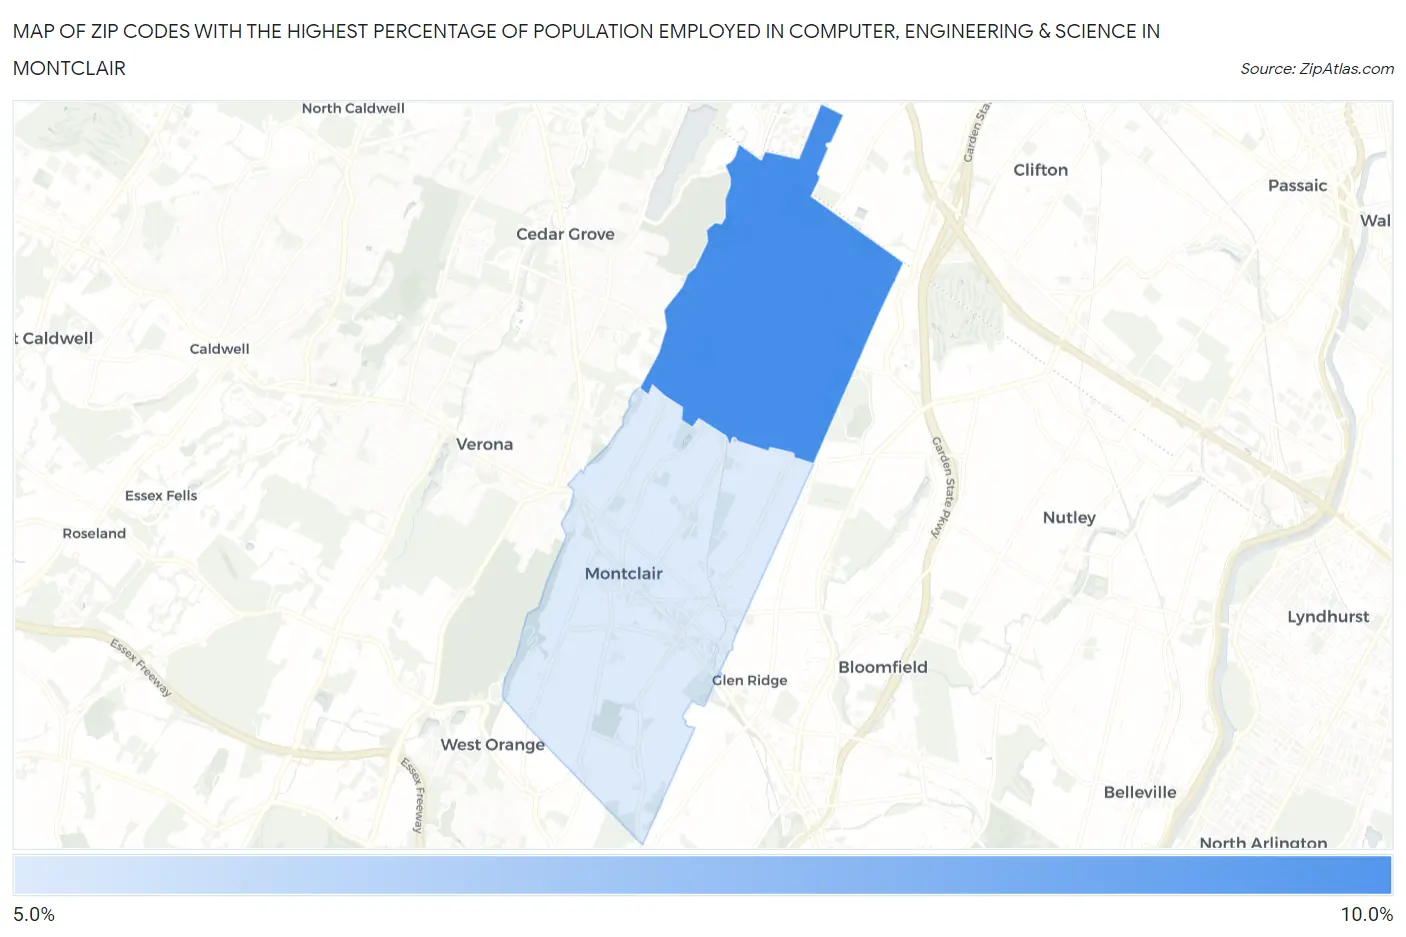
Map of Zip Codes with the Highest Percentage of Population Employed in Computer, Engineering & Science in Montclair
5.9%
8.0%
Zip Codes with the Highest Percentage of Population Employed in Computer, Engineering & Science in Montclair, NJ
| Zip Code | % Employed | vs State | vs National | |
| 1. | 07043 | 8.0% | 7.7%(+0.349)#199 | 6.8%(+1.26)#5,238 |
| 2. | 07042 | 5.9% | 7.7%(-1.74)#320 | 6.8%(-0.836)#9,001 |
1
Common Questions
What are the Top Zip Codes with the Highest Percentage of Population Employed in Computer, Engineering & Science in Montclair, NJ?
Top Zip Codes with the Highest Percentage of Population Employed in Computer, Engineering & Science in Montclair, NJ are:
What zip code has the Highest Percentage of Population Employed in Computer, Engineering & Science in Montclair, NJ?
07043 has the Highest Percentage of Population Employed in Computer, Engineering & Science in Montclair, NJ with 8.0%.
What is the Percentage of Population Employed in Computer, Engineering & Science in New Jersey?
Percentage of Population Employed in Computer, Engineering & Science in New Jersey is 7.7%.
What is the Percentage of Population Employed in Computer, Engineering & Science in the United States?
Percentage of Population Employed in Computer, Engineering & Science in the United States is 6.8%.