Morganville, NJ Map & Demographics
Morganville Map
Morganville Overview
$71,523
PER CAPITA INCOME
$160,304
AVG FAMILY INCOME
$129,521
AVG HOUSEHOLD INCOME
69.6%
WAGE / INCOME GAP [ % ]
30.4¢/ $1
WAGE / INCOME GAP [ $ ]
0.41
INEQUALITY / GINI INDEX
5,153
TOTAL POPULATION
2,457
MALE POPULATION
2,696
FEMALE POPULATION
91.14
MALES / 100 FEMALES
109.73
FEMALES / 100 MALES
45.1
MEDIAN AGE
3.1
AVG FAMILY SIZE
2.6
AVG HOUSEHOLD SIZE
2,723
LABOR FORCE [ PEOPLE ]
63.3%
PERCENT IN LABOR FORCE
1.8%
UNEMPLOYMENT RATE
Morganville Zip Codes
Income in Morganville
Income Overview in Morganville
Per Capita Income in Morganville is $71,523, while median incomes of families and households are $160,304 and $129,521 respectively.
| Characteristic | Number | Measure |
| Per Capita Income | 5,153 | $71,523 |
| Median Family Income | 1,461 | $160,304 |
| Mean Family Income | 1,461 | $224,880 |
| Median Household Income | 1,979 | $129,521 |
| Mean Household Income | 1,979 | $189,264 |
| Income Deficit | 1,461 | $0 |
| Wage / Income Gap (%) | 5,153 | 69.64% |
| Wage / Income Gap ($) | 5,153 | 30.36¢ per $1 |
| Gini / Inequality Index | 5,153 | 0.41 |
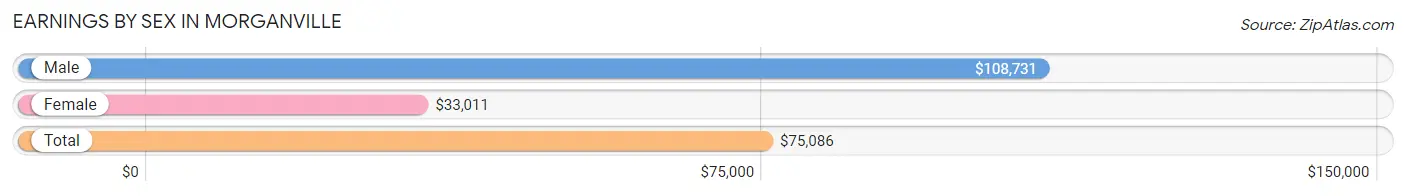
Earnings by Sex in Morganville
Average Earnings in Morganville are $75,086, $108,731 for men and $33,011 for women, a difference of 69.6%.
| Sex | Number | Average Earnings |
| Male | 1,571 (54.7%) | $108,731 |
| Female | 1,299 (45.3%) | $33,011 |
| Total | 2,870 (100.0%) | $75,086 |
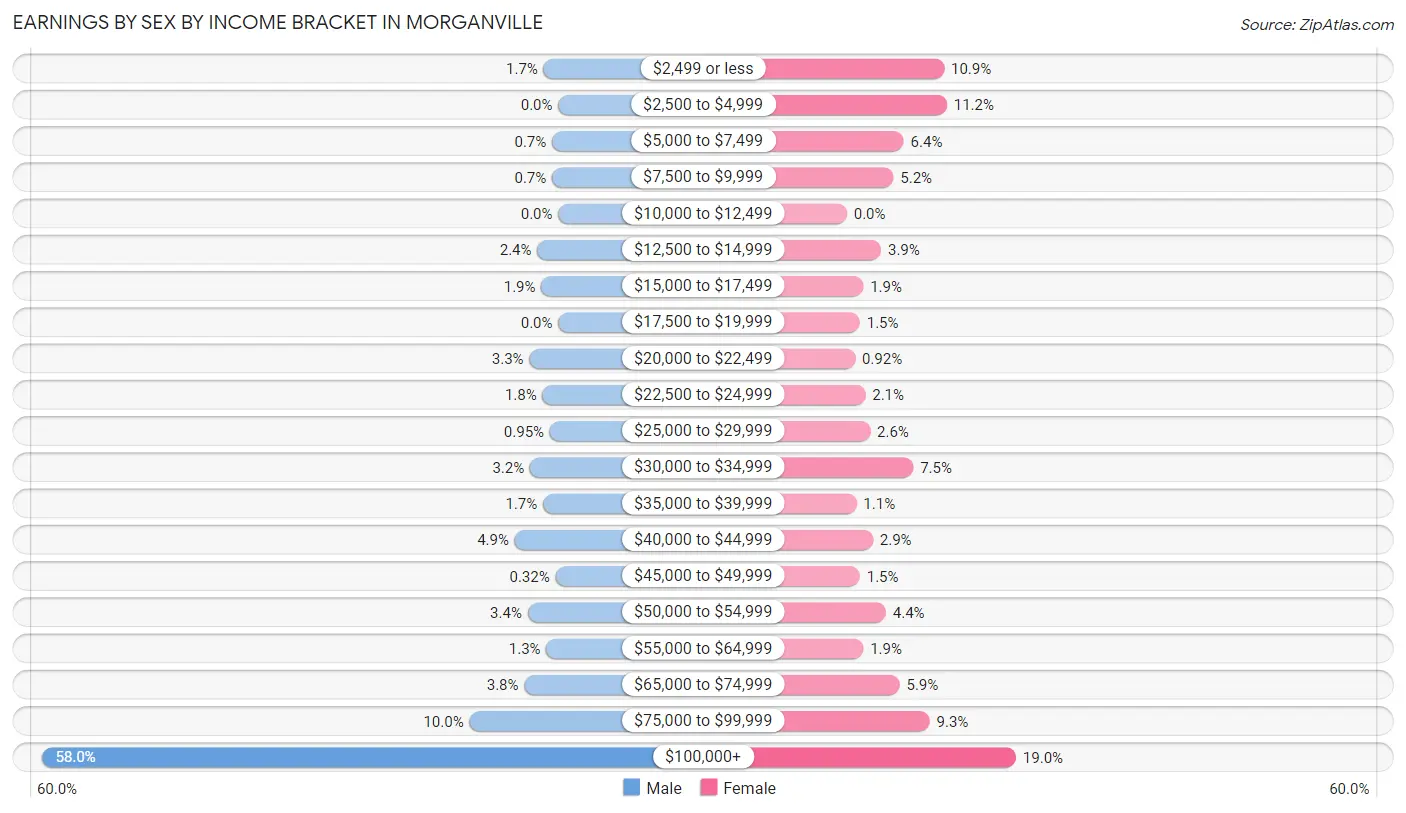
Earnings by Sex by Income Bracket in Morganville
The most common earnings brackets in Morganville are $100,000+ for men (911 | 58.0%) and $100,000+ for women (247 | 19.0%).
| Income | Male | Female |
| $2,499 or less | 26 (1.7%) | 142 (10.9%) |
| $2,500 to $4,999 | 0 (0.0%) | 146 (11.2%) |
| $5,000 to $7,499 | 11 (0.7%) | 83 (6.4%) |
| $7,500 to $9,999 | 11 (0.7%) | 68 (5.2%) |
| $10,000 to $12,499 | 0 (0.0%) | 0 (0.0%) |
| $12,500 to $14,999 | 37 (2.4%) | 50 (3.8%) |
| $15,000 to $17,499 | 30 (1.9%) | 24 (1.8%) |
| $17,500 to $19,999 | 0 (0.0%) | 19 (1.5%) |
| $20,000 to $22,499 | 51 (3.3%) | 12 (0.9%) |
| $22,500 to $24,999 | 28 (1.8%) | 27 (2.1%) |
| $25,000 to $29,999 | 15 (0.9%) | 34 (2.6%) |
| $30,000 to $34,999 | 50 (3.2%) | 97 (7.5%) |
| $35,000 to $39,999 | 27 (1.7%) | 14 (1.1%) |
| $40,000 to $44,999 | 77 (4.9%) | 38 (2.9%) |
| $45,000 to $49,999 | 5 (0.3%) | 19 (1.5%) |
| $50,000 to $54,999 | 54 (3.4%) | 57 (4.4%) |
| $55,000 to $64,999 | 21 (1.3%) | 24 (1.8%) |
| $65,000 to $74,999 | 60 (3.8%) | 77 (5.9%) |
| $75,000 to $99,999 | 157 (10.0%) | 121 (9.3%) |
| $100,000+ | 911 (58.0%) | 247 (19.0%) |
| Total | 1,571 (100.0%) | 1,299 (100.0%) |
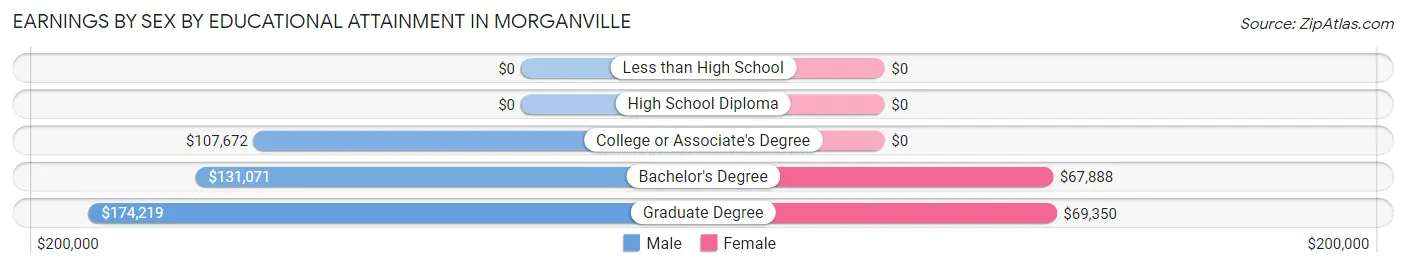
Earnings by Sex by Educational Attainment in Morganville
Average earnings in Morganville are $109,892 for men and $53,313 for women, a difference of 51.5%. Men with an educational attainment of graduate degree enjoy the highest average annual earnings of $174,219, while those with college or associate's degree education earn the least with $107,672. Women with an educational attainment of graduate degree earn the most with the average annual earnings of $69,350, while those with bachelor's degree education have the smallest earnings of $67,888.
| Educational Attainment | Male Income | Female Income |
| Less than High School | - | - |
| High School Diploma | - | - |
| College or Associate's Degree | $107,672 | $0 |
| Bachelor's Degree | $131,071 | $67,888 |
| Graduate Degree | $174,219 | $69,350 |
| Total | $109,892 | $53,313 |
Family Income in Morganville
Family Income Brackets in Morganville
According to the Morganville family income data, there are 595 families falling into the $200,000+ income range, which is the most common income bracket and makes up 40.7% of all families.
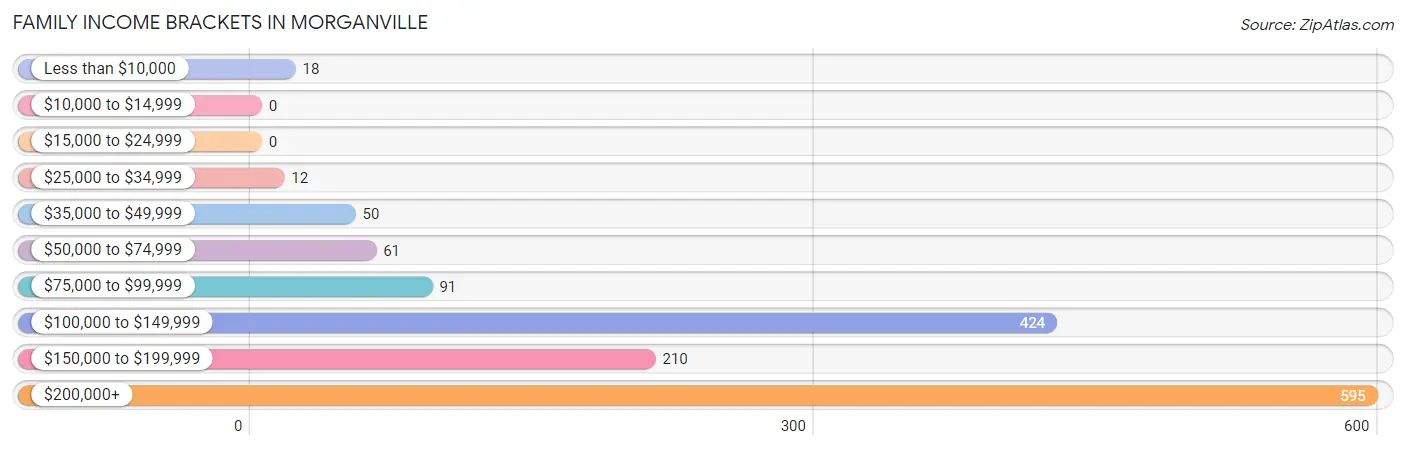
| Income Bracket | # Families | % Families |
| Less than $10,000 | 18 | 1.2% |
| $10,000 to $14,999 | 0 | 0.0% |
| $15,000 to $24,999 | 0 | 0.0% |
| $25,000 to $34,999 | 12 | 0.8% |
| $35,000 to $49,999 | 50 | 3.4% |
| $50,000 to $74,999 | 61 | 4.2% |
| $75,000 to $99,999 | 91 | 6.2% |
| $100,000 to $149,999 | 424 | 29.0% |
| $150,000 to $199,999 | 210 | 14.4% |
| $200,000+ | 595 | 40.7% |
Family Income by Famaliy Size in Morganville
4-person families (412 | 28.2%) account for the highest median family income in Morganville with $223,214 per family, while 3-person families (320 | 21.9%) have the highest median income of $71,319 per family member.
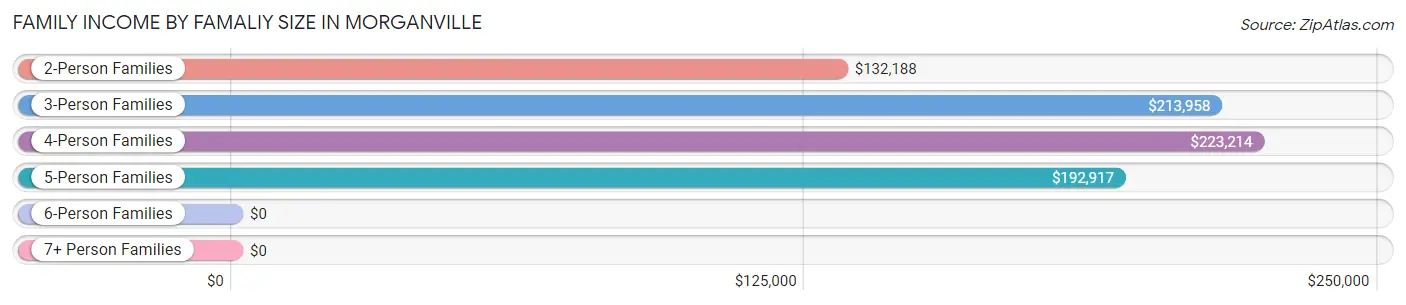
| Income Bracket | # Families | Median Income |
| 2-Person Families | 590 (40.4%) | $132,188 |
| 3-Person Families | 320 (21.9%) | $213,958 |
| 4-Person Families | 412 (28.2%) | $223,214 |
| 5-Person Families | 136 (9.3%) | $192,917 |
| 6-Person Families | 3 (0.2%) | $0 |
| 7+ Person Families | 0 (0.0%) | $0 |
| Total | 1,461 (100.0%) | $160,304 |
Family Income by Number of Earners in Morganville
The median family income in Morganville is $160,304, with families comprising 3+ earners (144) having the highest median family income of $250,001, while families with no earners (285) have the lowest median family income of $126,607, accounting for 9.9% and 19.5% of families, respectively.
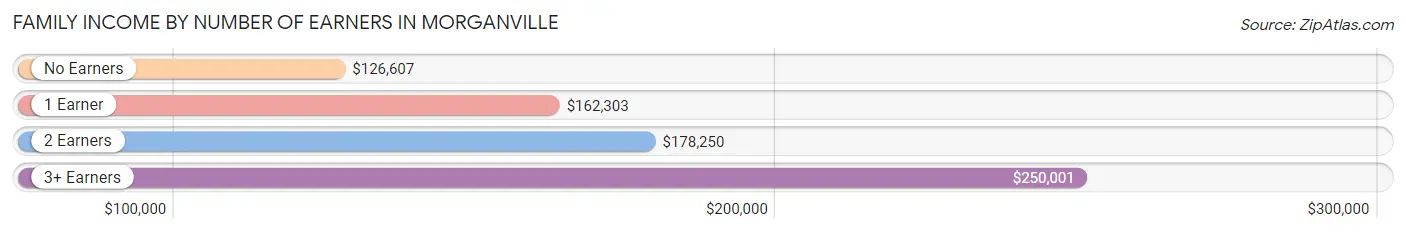
| Number of Earners | # Families | Median Income |
| No Earners | 285 (19.5%) | $126,607 |
| 1 Earner | 249 (17.0%) | $162,303 |
| 2 Earners | 783 (53.6%) | $178,250 |
| 3+ Earners | 144 (9.9%) | $250,001 |
| Total | 1,461 (100.0%) | $160,304 |
Household Income in Morganville
Household Income Brackets in Morganville
With 736 households falling in the category, the $100,000 to $149,999 income range is the most frequent in Morganville, accounting for 37.2% of all households.
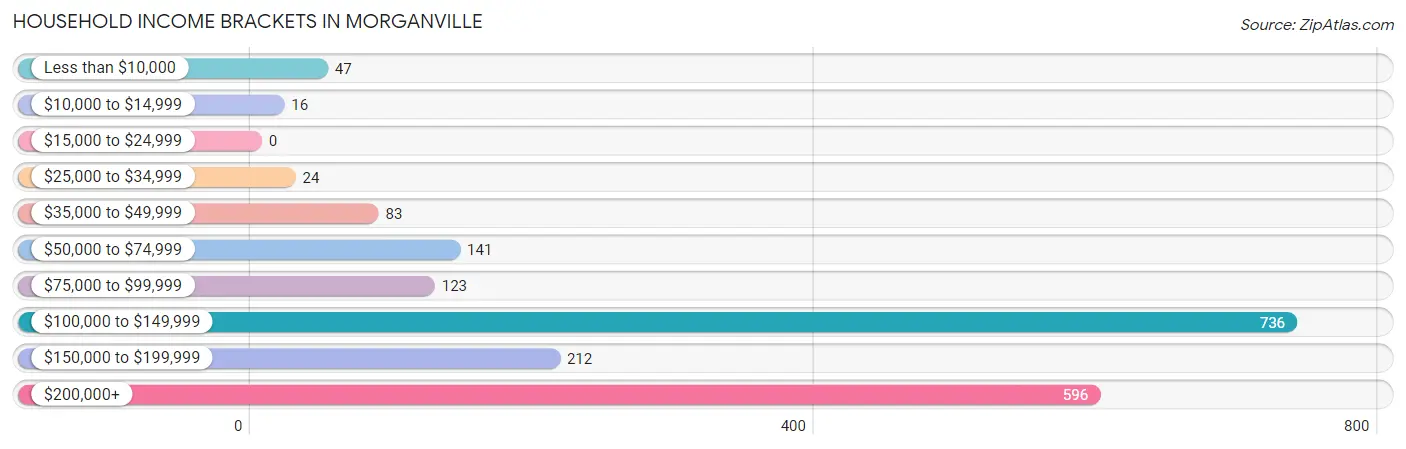
| Income Bracket | # Households | % Households |
| Less than $10,000 | 47 | 2.4% |
| $10,000 to $14,999 | 16 | 0.8% |
| $15,000 to $24,999 | 0 | 0.0% |
| $25,000 to $34,999 | 24 | 1.2% |
| $35,000 to $49,999 | 83 | 4.2% |
| $50,000 to $74,999 | 141 | 7.1% |
| $75,000 to $99,999 | 123 | 6.2% |
| $100,000 to $149,999 | 736 | 37.2% |
| $150,000 to $199,999 | 212 | 10.7% |
| $200,000+ | 596 | 30.1% |
Household Income by Householder Age in Morganville
The median household income in Morganville is $129,521, with the highest median household income of $209,500 found in the 45 to 64 years age bracket for the primary householder. A total of 860 households (43.5%) fall into this category.
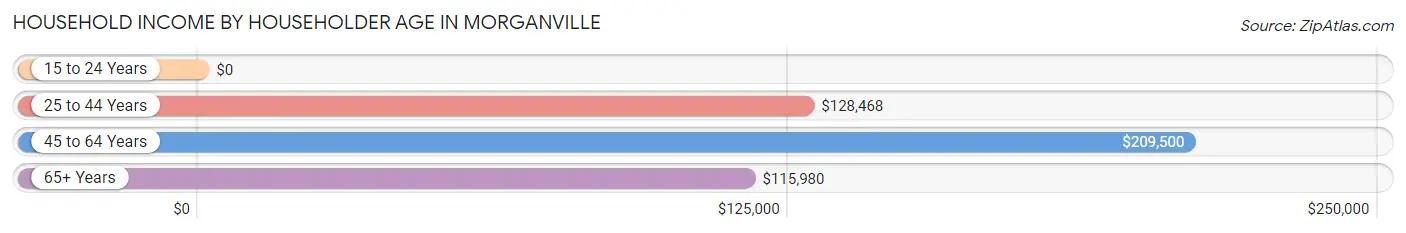
| Income Bracket | # Households | Median Income |
| 15 to 24 Years | 0 (0.0%) | $0 |
| 25 to 44 Years | 536 (27.1%) | $128,468 |
| 45 to 64 Years | 860 (43.5%) | $209,500 |
| 65+ Years | 583 (29.5%) | $115,980 |
| Total | 1,979 (100.0%) | $129,521 |
Poverty in Morganville
Income Below Poverty by Sex and Age in Morganville
With 0.7% poverty level for males and 7.3% for females among the residents of Morganville, 65 to 74 year old males and 18 to 24 year old females are the most vulnerable to poverty, with 18 males (5.4%) and 100 females (31.4%) in their respective age groups living below the poverty level.
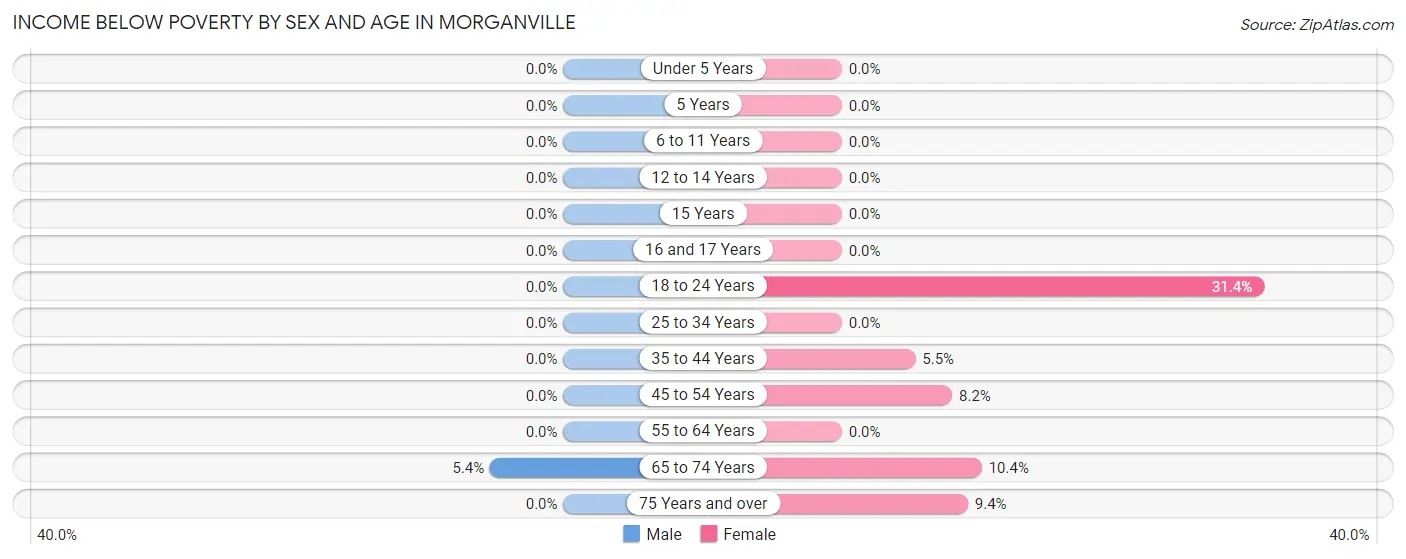
| Age Bracket | Male | Female |
| Under 5 Years | 0 (0.0%) | 0 (0.0%) |
| 5 Years | 0 (0.0%) | 0 (0.0%) |
| 6 to 11 Years | 0 (0.0%) | 0 (0.0%) |
| 12 to 14 Years | 0 (0.0%) | 0 (0.0%) |
| 15 Years | 0 (0.0%) | 0 (0.0%) |
| 16 and 17 Years | 0 (0.0%) | 0 (0.0%) |
| 18 to 24 Years | 0 (0.0%) | 100 (31.4%) |
| 25 to 34 Years | 0 (0.0%) | 0 (0.0%) |
| 35 to 44 Years | 0 (0.0%) | 13 (5.5%) |
| 45 to 54 Years | 0 (0.0%) | 33 (8.2%) |
| 55 to 64 Years | 0 (0.0%) | 0 (0.0%) |
| 65 to 74 Years | 18 (5.4%) | 35 (10.4%) |
| 75 Years and over | 0 (0.0%) | 16 (9.4%) |
| Total | 18 (0.7%) | 197 (7.3%) |
Income Above Poverty by Sex and Age in Morganville
According to the poverty statistics in Morganville, males aged under 5 years and females aged under 5 years are the age groups that are most secure financially, with 100.0% of males and 100.0% of females in these age groups living above the poverty line.
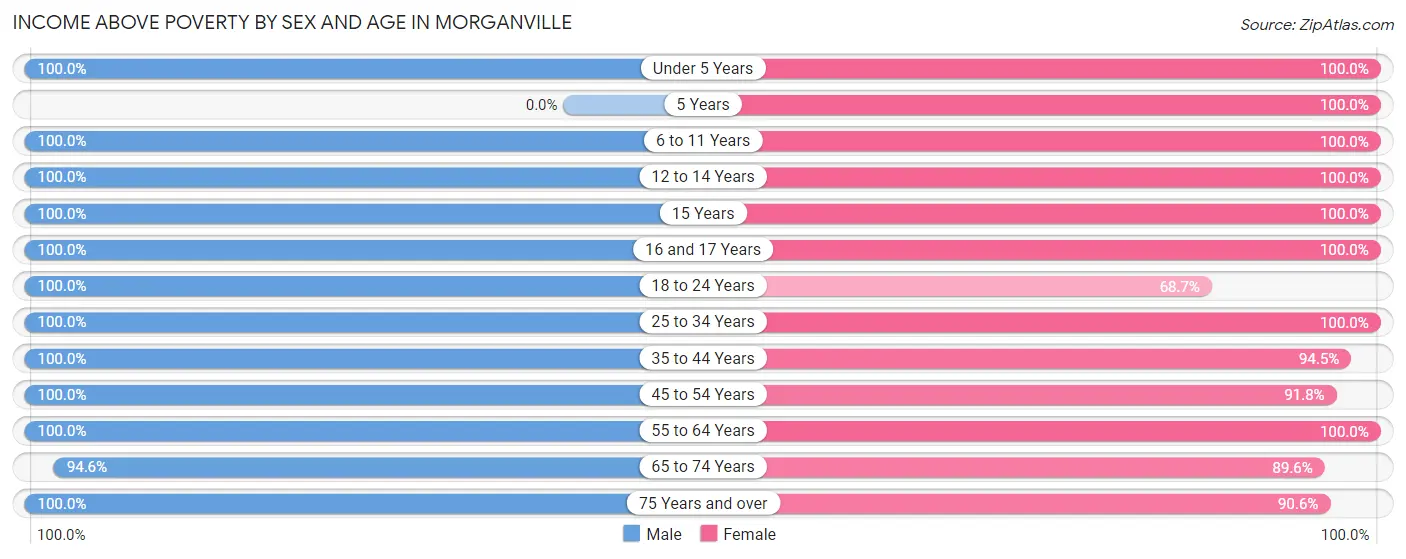
| Age Bracket | Male | Female |
| Under 5 Years | 121 (100.0%) | 92 (100.0%) |
| 5 Years | 0 (0.0%) | 48 (100.0%) |
| 6 to 11 Years | 102 (100.0%) | 206 (100.0%) |
| 12 to 14 Years | 75 (100.0%) | 144 (100.0%) |
| 15 Years | 5 (100.0%) | 54 (100.0%) |
| 16 and 17 Years | 112 (100.0%) | 80 (100.0%) |
| 18 to 24 Years | 180 (100.0%) | 219 (68.6%) |
| 25 to 34 Years | 204 (100.0%) | 206 (100.0%) |
| 35 to 44 Years | 374 (100.0%) | 225 (94.5%) |
| 45 to 54 Years | 329 (100.0%) | 370 (91.8%) |
| 55 to 64 Years | 455 (100.0%) | 391 (100.0%) |
| 65 to 74 Years | 313 (94.6%) | 302 (89.6%) |
| 75 Years and over | 169 (100.0%) | 155 (90.6%) |
| Total | 2,439 (99.3%) | 2,492 (92.7%) |
Income Below Poverty Among Married-Couple Families in Morganville
The poverty statistics for married-couple families in Morganville show that 1.4% or 18 of the total 1,304 families live below the poverty line. Families with no children have the highest poverty rate of 2.6%, comprising of 18 families. On the other hand, families with 1 or 2 children have the lowest poverty rate of 0.0%, which includes 0 families.
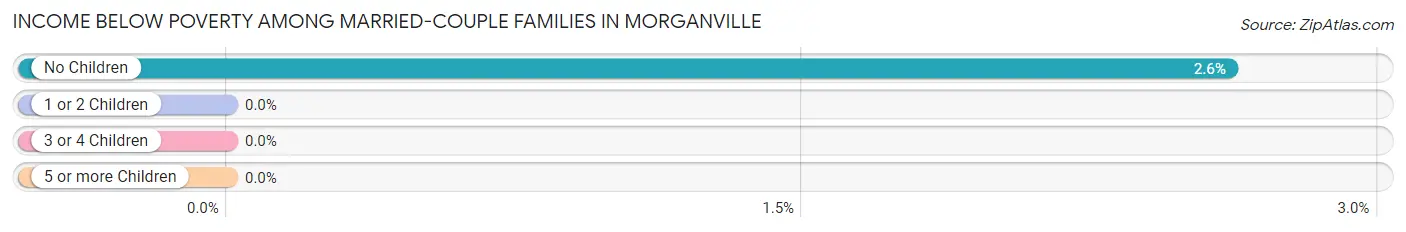
| Children | Above Poverty | Below Poverty |
| No Children | 672 (97.4%) | 18 (2.6%) |
| 1 or 2 Children | 551 (100.0%) | 0 (0.0%) |
| 3 or 4 Children | 63 (100.0%) | 0 (0.0%) |
| 5 or more Children | 0 (0.0%) | 0 (0.0%) |
| Total | 1,286 (98.6%) | 18 (1.4%) |
Income Below Poverty Among Single-Parent Households in Morganville
| Children | Single Father | Single Mother |
| No Children | 0 (0.0%) | 0 (0.0%) |
| 1 or 2 Children | 0 (0.0%) | 0 (0.0%) |
| 3 or 4 Children | 0 (0.0%) | 0 (0.0%) |
| 5 or more Children | 0 (0.0%) | 0 (0.0%) |
| Total | 0 (0.0%) | 0 (0.0%) |
Income Below Poverty Among Married-Couple vs Single-Parent Households in Morganville
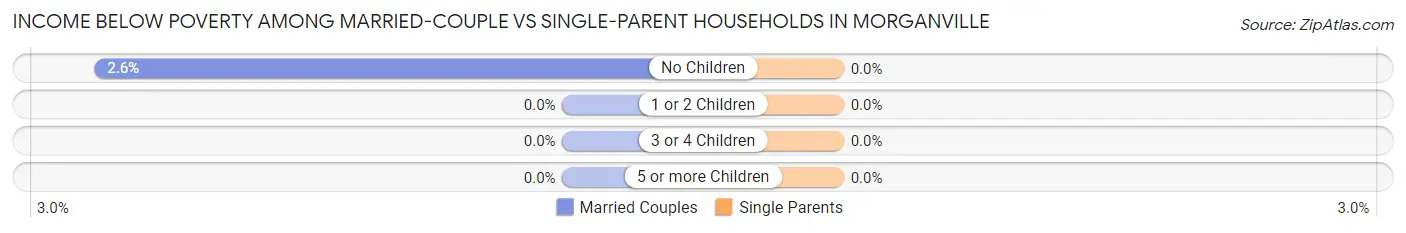
| Children | Married-Couple Families | Single-Parent Households |
| No Children | 18 (2.6%) | 0 (0.0%) |
| 1 or 2 Children | 0 (0.0%) | 0 (0.0%) |
| 3 or 4 Children | 0 (0.0%) | 0 (0.0%) |
| 5 or more Children | 0 (0.0%) | 0 (0.0%) |
| Total | 18 (1.4%) | 0 (0.0%) |
Race in Morganville
The most populous races in Morganville are White / Caucasian (3,435 | 66.7%), Asian (1,161 | 22.5%), and Hispanic or Latino (462 | 9.0%).
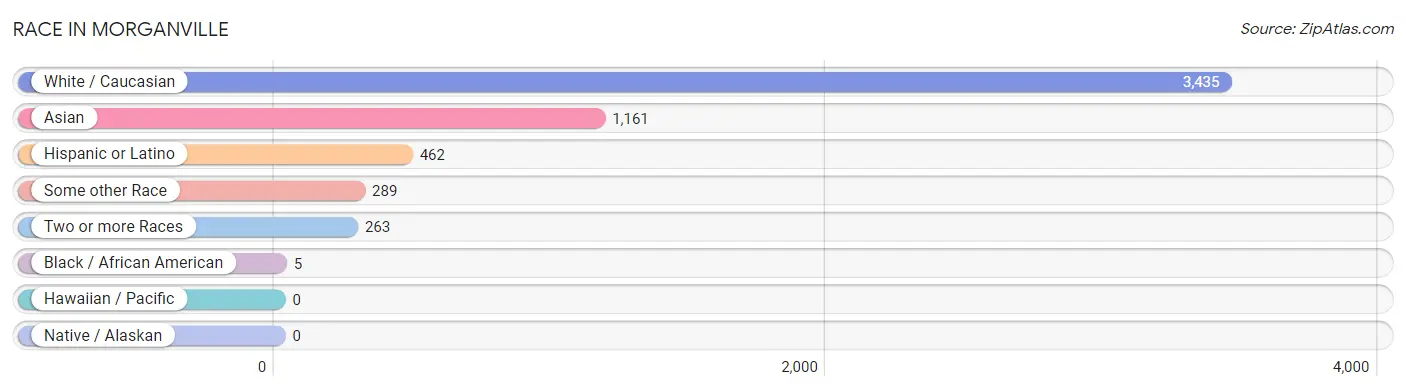
| Race | # Population | % Population |
| Asian | 1,161 | 22.5% |
| Black / African American | 5 | 0.1% |
| Hawaiian / Pacific | 0 | 0.0% |
| Hispanic or Latino | 462 | 9.0% |
| Native / Alaskan | 0 | 0.0% |
| White / Caucasian | 3,435 | 66.7% |
| Two or more Races | 263 | 5.1% |
| Some other Race | 289 | 5.6% |
| Total | 5,153 | 100.0% |
Ancestry in Morganville
The most populous ancestries reported in Morganville are Italian (984 | 19.1%), Indian (Asian) (599 | 11.6%), Irish (560 | 10.9%), German (557 | 10.8%), and Thai (426 | 8.3%), together accounting for 60.7% of all Morganville residents.
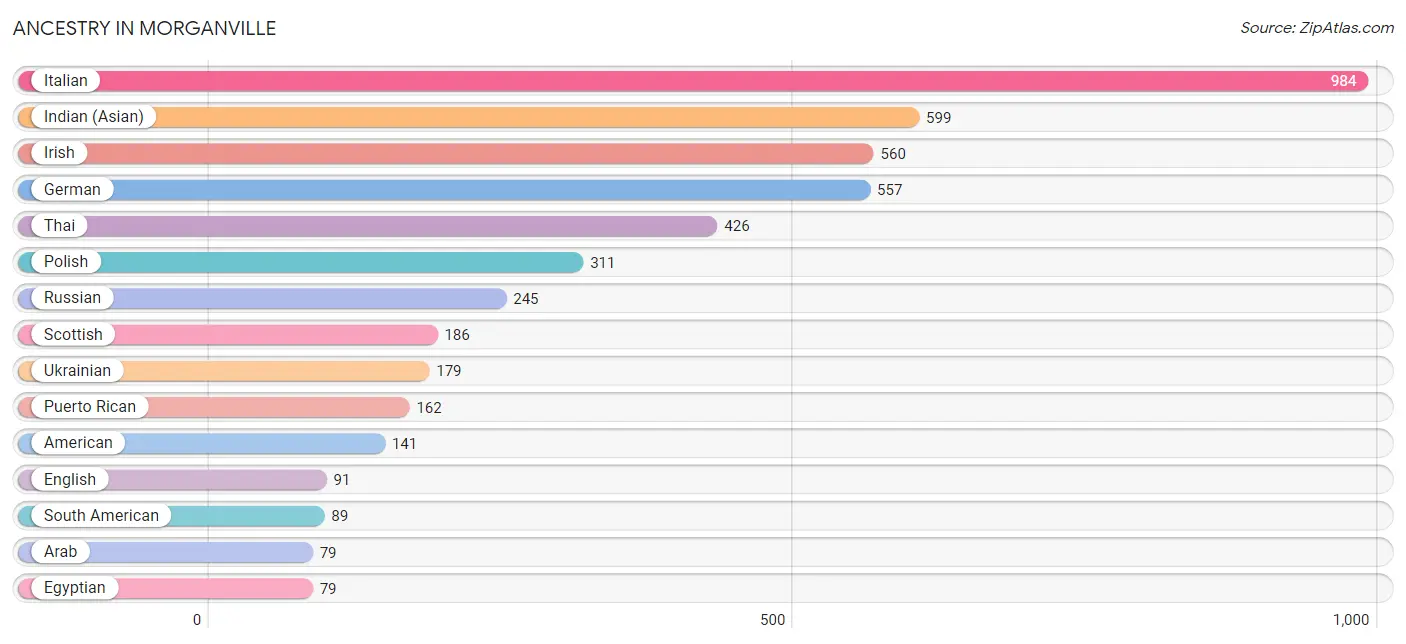
| Ancestry | # Population | % Population |
| American | 141 | 2.7% |
| Arab | 79 | 1.5% |
| Armenian | 77 | 1.5% |
| Austrian | 54 | 1.1% |
| Burmese | 24 | 0.5% |
| Colombian | 21 | 0.4% |
| Cuban | 71 | 1.4% |
| Dominican | 52 | 1.0% |
| Eastern European | 30 | 0.6% |
| Egyptian | 79 | 1.5% |
| English | 91 | 1.8% |
| Finnish | 62 | 1.2% |
| French | 29 | 0.6% |
| German | 557 | 10.8% |
| Greek | 30 | 0.6% |
| Hungarian | 60 | 1.2% |
| Indian (Asian) | 599 | 11.6% |
| Irish | 560 | 10.9% |
| Italian | 984 | 19.1% |
| Korean | 53 | 1.0% |
| Norwegian | 17 | 0.3% |
| Peruvian | 68 | 1.3% |
| Polish | 311 | 6.0% |
| Puerto Rican | 162 | 3.1% |
| Romanian | 17 | 0.3% |
| Russian | 245 | 4.8% |
| Scottish | 186 | 3.6% |
| Serbian | 27 | 0.5% |
| South American | 89 | 1.7% |
| Spaniard | 48 | 0.9% |
| Sri Lankan | 72 | 1.4% |
| Swedish | 37 | 0.7% |
| Thai | 426 | 8.3% |
| Ukrainian | 179 | 3.5% | View All 34 Rows |
Immigrants in Morganville
The most numerous immigrant groups reported in Morganville came from Asia (995 | 19.3%), South Central Asia (439 | 8.5%), Eastern Asia (422 | 8.2%), China (398 | 7.7%), and India (398 | 7.7%), together accounting for 51.5% of all Morganville residents.
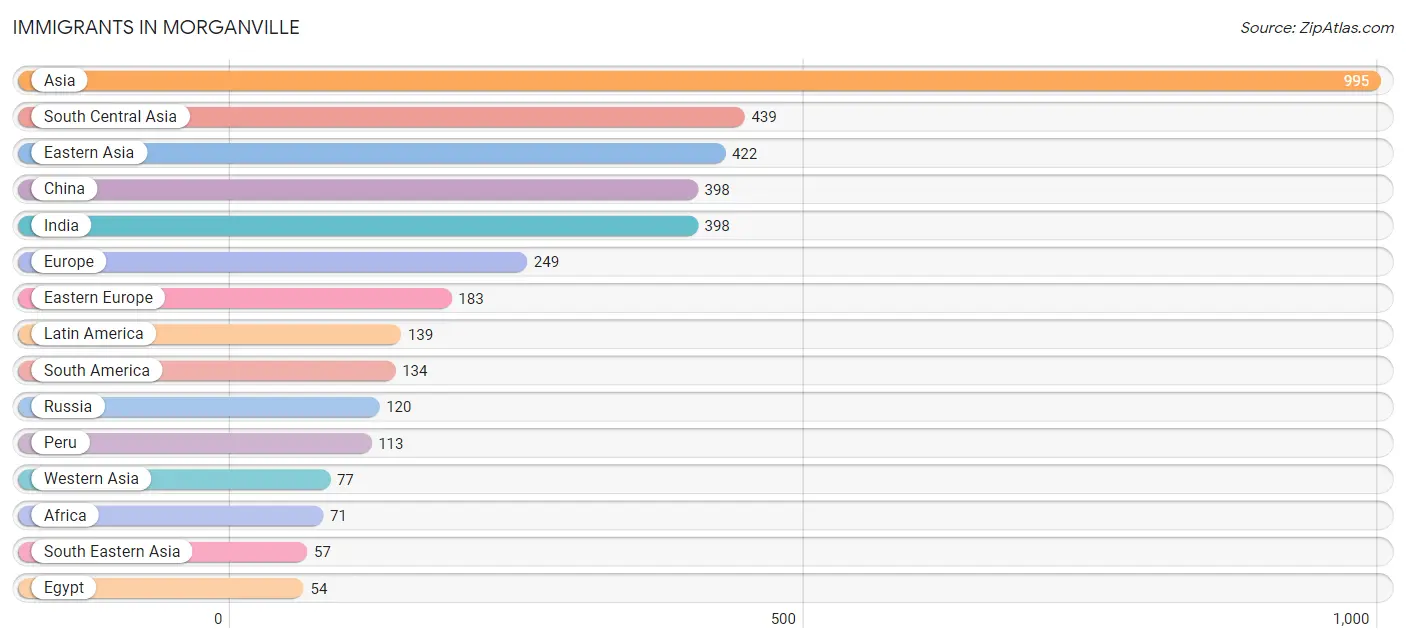
| Immigration Origin | # Population | % Population |
| Africa | 71 | 1.4% |
| Asia | 995 | 19.3% |
| Caribbean | 5 | 0.1% |
| China | 398 | 7.7% |
| Colombia | 21 | 0.4% |
| Dominican Republic | 5 | 0.1% |
| Eastern Africa | 17 | 0.3% |
| Eastern Asia | 422 | 8.2% |
| Eastern Europe | 183 | 3.5% |
| Egypt | 54 | 1.1% |
| Europe | 249 | 4.8% |
| France | 27 | 0.5% |
| Hong Kong | 47 | 0.9% |
| India | 398 | 7.7% |
| Israel | 39 | 0.8% |
| Italy | 39 | 0.8% |
| Kenya | 17 | 0.3% |
| Korea | 24 | 0.5% |
| Latin America | 139 | 2.7% |
| Lebanon | 38 | 0.7% |
| Malaysia | 20 | 0.4% |
| Moldova | 4 | 0.1% |
| Northern Africa | 54 | 1.1% |
| Peru | 113 | 2.2% |
| Philippines | 37 | 0.7% |
| Poland | 26 | 0.5% |
| Romania | 13 | 0.3% |
| Russia | 120 | 2.3% |
| South America | 134 | 2.6% |
| South Central Asia | 439 | 8.5% |
| South Eastern Asia | 57 | 1.1% |
| Southern Europe | 39 | 0.8% |
| Taiwan | 41 | 0.8% |
| Ukraine | 20 | 0.4% |
| Uzbekistan | 41 | 0.8% |
| Western Asia | 77 | 1.5% |
| Western Europe | 27 | 0.5% | View All 37 Rows |
Sex and Age in Morganville
Sex and Age in Morganville
The most populous age groups in Morganville are 55 to 59 Years (271 | 11.0%) for men and 55 to 59 Years (281 | 10.4%) for women.
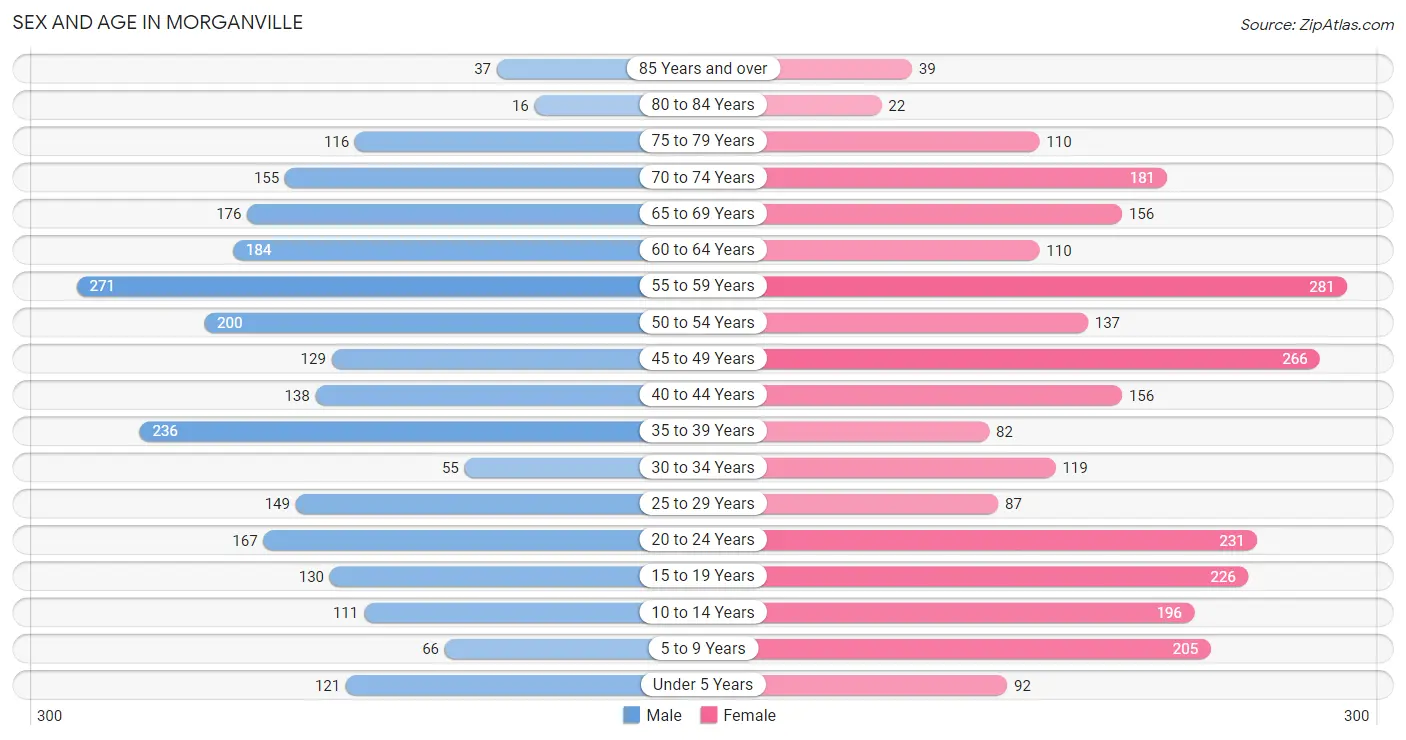
| Age Bracket | Male | Female |
| Under 5 Years | 121 (4.9%) | 92 (3.4%) |
| 5 to 9 Years | 66 (2.7%) | 205 (7.6%) |
| 10 to 14 Years | 111 (4.5%) | 196 (7.3%) |
| 15 to 19 Years | 130 (5.3%) | 226 (8.4%) |
| 20 to 24 Years | 167 (6.8%) | 231 (8.6%) |
| 25 to 29 Years | 149 (6.1%) | 87 (3.2%) |
| 30 to 34 Years | 55 (2.2%) | 119 (4.4%) |
| 35 to 39 Years | 236 (9.6%) | 82 (3.0%) |
| 40 to 44 Years | 138 (5.6%) | 156 (5.8%) |
| 45 to 49 Years | 129 (5.2%) | 266 (9.9%) |
| 50 to 54 Years | 200 (8.1%) | 137 (5.1%) |
| 55 to 59 Years | 271 (11.0%) | 281 (10.4%) |
| 60 to 64 Years | 184 (7.5%) | 110 (4.1%) |
| 65 to 69 Years | 176 (7.2%) | 156 (5.8%) |
| 70 to 74 Years | 155 (6.3%) | 181 (6.7%) |
| 75 to 79 Years | 116 (4.7%) | 110 (4.1%) |
| 80 to 84 Years | 16 (0.6%) | 22 (0.8%) |
| 85 Years and over | 37 (1.5%) | 39 (1.5%) |
| Total | 2,457 (100.0%) | 2,696 (100.0%) |
Families and Households in Morganville
Median Family Size in Morganville
The median family size in Morganville is 3.12 persons per family, with married-couple families (1,304 | 89.2%) accounting for the largest median family size of 3.23 persons per family. On the other hand, single male/father families (108 | 7.4%) represent the smallest median family size with 2.08 persons per family.
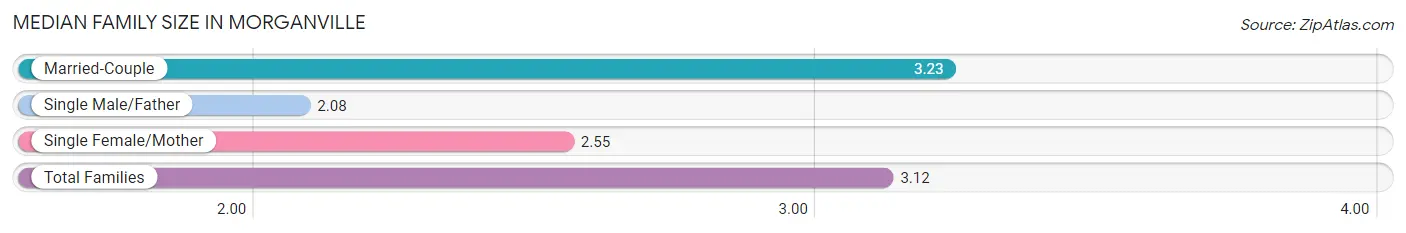
| Family Type | # Families | Family Size |
| Married-Couple | 1,304 (89.2%) | 3.23 |
| Single Male/Father | 108 (7.4%) | 2.08 |
| Single Female/Mother | 49 (3.4%) | 2.55 |
| Total Families | 1,461 (100.0%) | 3.12 |
Median Household Size in Morganville
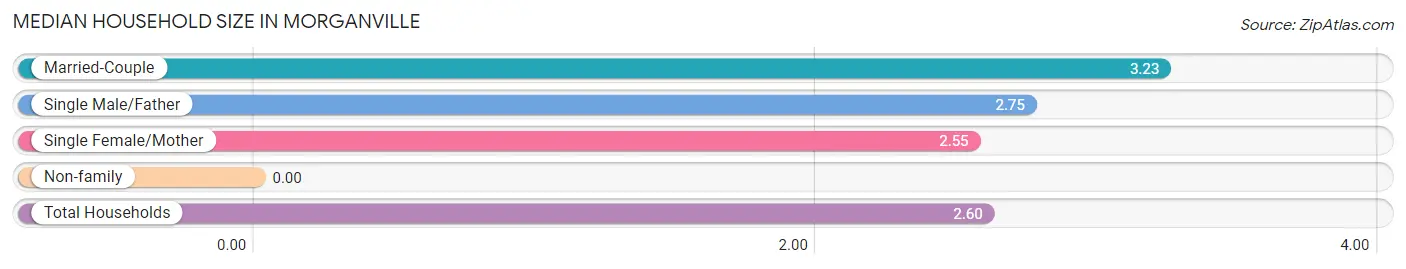
| Household Type | # Households | Household Size |
| Married-Couple | 1,304 (65.9%) | 3.23 |
| Single Male/Father | 108 (5.5%) | 2.75 |
| Single Female/Mother | 49 (2.5%) | 2.55 |
| Non-family | 518 (26.2%) | - |
| Total Households | 1,979 (100.0%) | 2.60 |
Household Size by Marriage Status in Morganville
Out of a total of 1,979 households in Morganville, 1,461 (73.8%) are family households, while 518 (26.2%) are nonfamily households. The most numerous type of family households are 2-person households, comprising 536, and the most common type of nonfamily households are 1-person households, comprising 518.
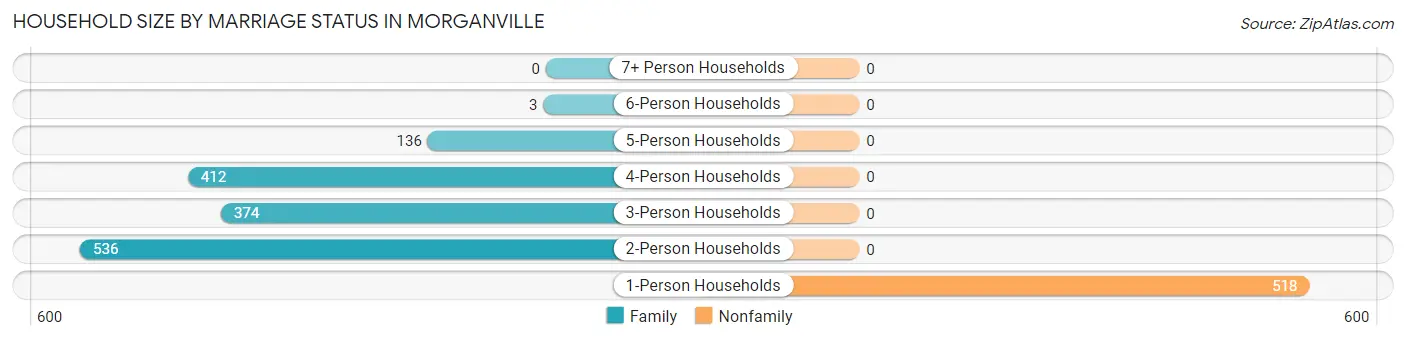
| Household Size | Family Households | Nonfamily Households |
| 1-Person Households | - | 518 (26.2%) |
| 2-Person Households | 536 (27.1%) | 0 (0.0%) |
| 3-Person Households | 374 (18.9%) | 0 (0.0%) |
| 4-Person Households | 412 (20.8%) | 0 (0.0%) |
| 5-Person Households | 136 (6.9%) | 0 (0.0%) |
| 6-Person Households | 3 (0.2%) | 0 (0.0%) |
| 7+ Person Households | 0 (0.0%) | 0 (0.0%) |
| Total | 1,461 (73.8%) | 518 (26.2%) |
Female Fertility in Morganville
Fertility by Age in Morganville
Average fertility rate in Morganville is 30.0 births per 1,000 women. Women in the age bracket of 20 to 34 years have the highest fertility rate with 80.0 births per 1,000 women. Women in the age bracket of 20 to 34 years acount for 100.0% of all women with births.
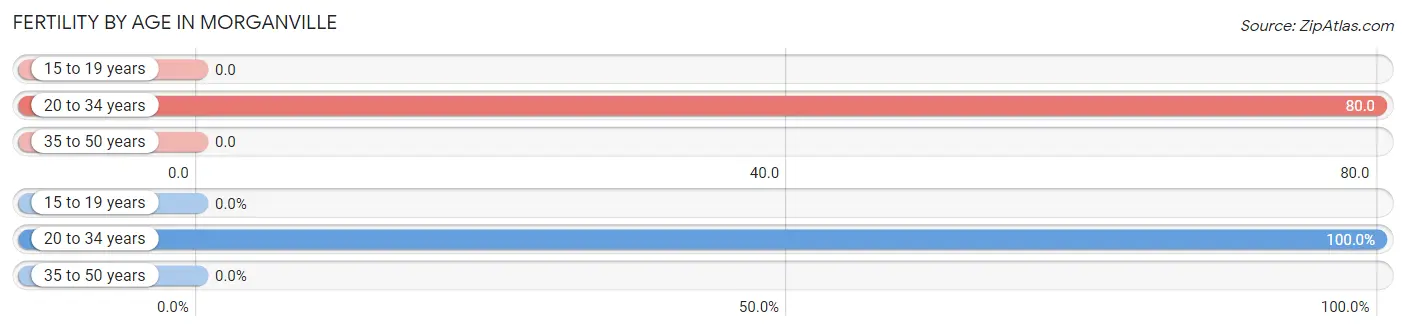
| Age Bracket | Women with Births | Births / 1,000 Women |
| 15 to 19 years | 0 (0.0%) | 0.0 |
| 20 to 34 years | 35 (100.0%) | 80.0 |
| 35 to 50 years | 0 (0.0%) | 0.0 |
| Total | 35 (100.0%) | 30.0 |
Fertility by Age by Marriage Status in Morganville
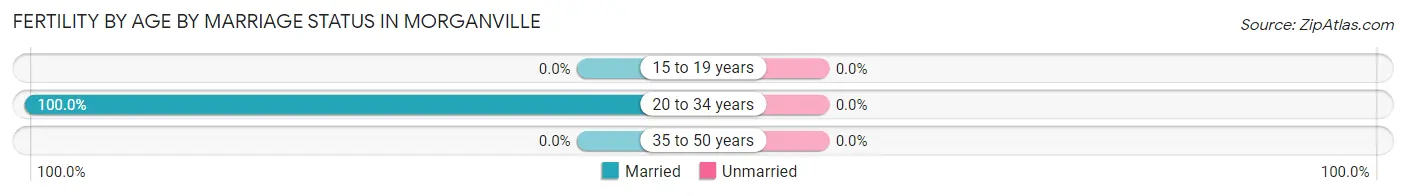
| Age Bracket | Married | Unmarried |
| 15 to 19 years | 0 (0.0%) | 0 (0.0%) |
| 20 to 34 years | 35 (100.0%) | 0 (0.0%) |
| 35 to 50 years | 0 (0.0%) | 0 (0.0%) |
| Total | 35 (100.0%) | 0 (0.0%) |
Fertility by Education in Morganville
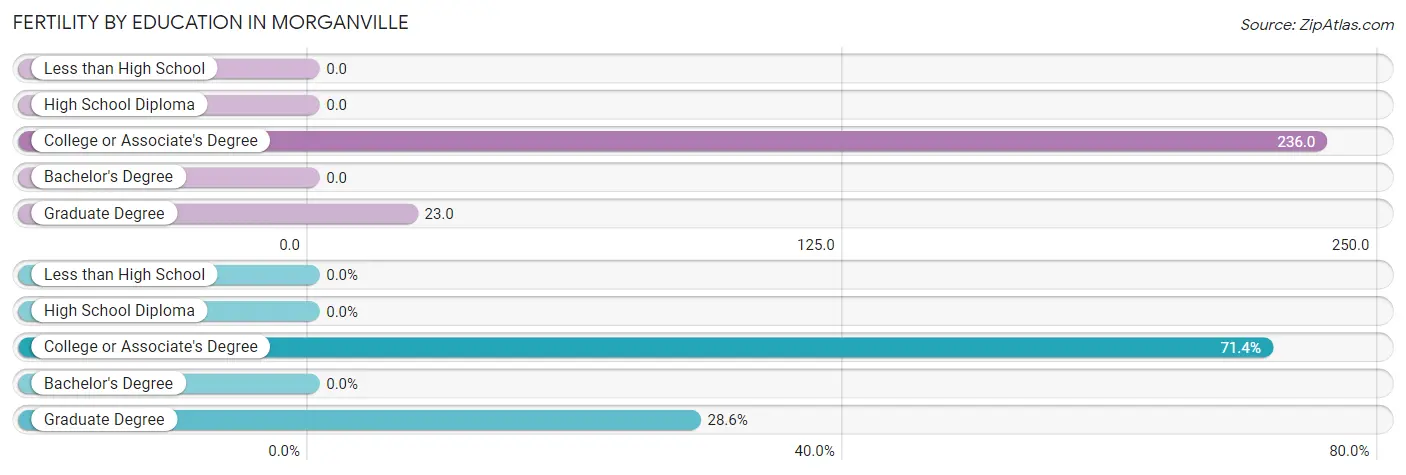
| Educational Attainment | Women with Births | Births / 1,000 Women |
| Less than High School | 0 (0.0%) | 0.0 |
| High School Diploma | 0 (0.0%) | 0.0 |
| College or Associate's Degree | 25 (71.4%) | 236.0 |
| Bachelor's Degree | 0 (0.0%) | 0.0 |
| Graduate Degree | 10 (28.6%) | 23.0 |
| Total | 35 (100.0%) | 30.0 |
Fertility by Education by Marriage Status in Morganville
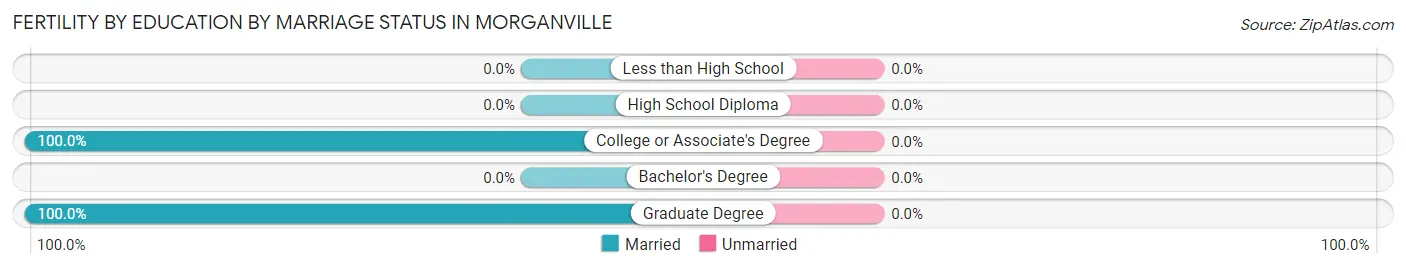
| Educational Attainment | Married | Unmarried |
| Less than High School | 0 (0.0%) | 0 (0.0%) |
| High School Diploma | 0 (0.0%) | 0 (0.0%) |
| College or Associate's Degree | 25 (100.0%) | 0 (0.0%) |
| Bachelor's Degree | 0 (0.0%) | 0 (0.0%) |
| Graduate Degree | 10 (100.0%) | 0 (0.0%) |
| Total | 35 (100.0%) | 0 (0.0%) |
Employment Characteristics in Morganville
Employment by Class of Employer in Morganville
Among the 2,616 employed individuals in Morganville, private company employees (1,948 | 74.5%), local government employees (148 | 5.7%), and not-for-profit organizations (136 | 5.2%) make up the most common classes of employment.
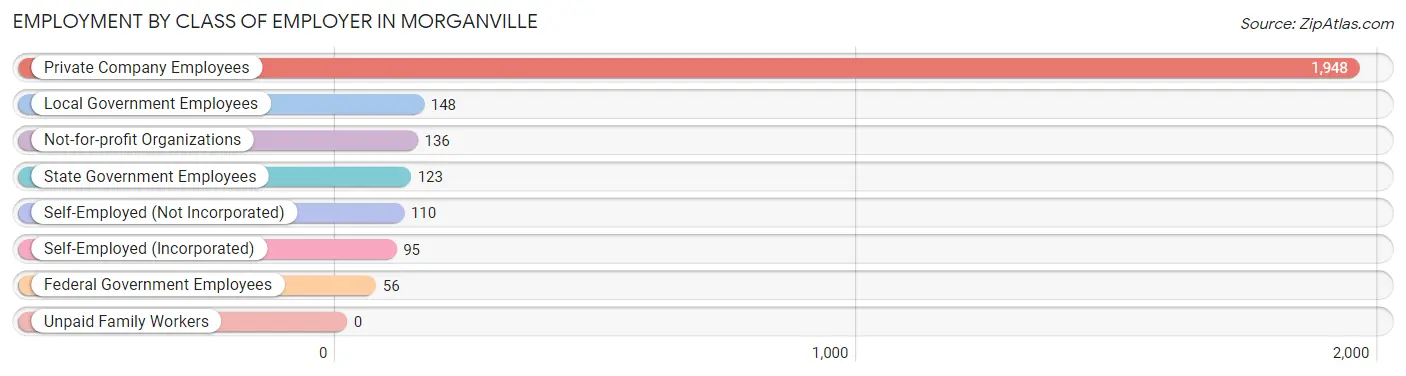
| Employer Class | # Employees | % Employees |
| Private Company Employees | 1,948 | 74.5% |
| Self-Employed (Incorporated) | 95 | 3.6% |
| Self-Employed (Not Incorporated) | 110 | 4.2% |
| Not-for-profit Organizations | 136 | 5.2% |
| Local Government Employees | 148 | 5.7% |
| State Government Employees | 123 | 4.7% |
| Federal Government Employees | 56 | 2.1% |
| Unpaid Family Workers | 0 | 0.0% |
| Total | 2,616 | 100.0% |
Employment Status by Age in Morganville
According to the labor force statistics for Morganville, out of the total population over 16 years of age (4,301), 63.3% or 2,723 individuals are in the labor force, with 1.8% or 49 of them unemployed. The age group with the highest labor force participation rate is 25 to 29 years, with 100.0% or 236 individuals in the labor force. Within the labor force, the 55 to 59 years age range has the highest percentage of unemployed individuals, with 9.4% or 35 of them being unemployed.
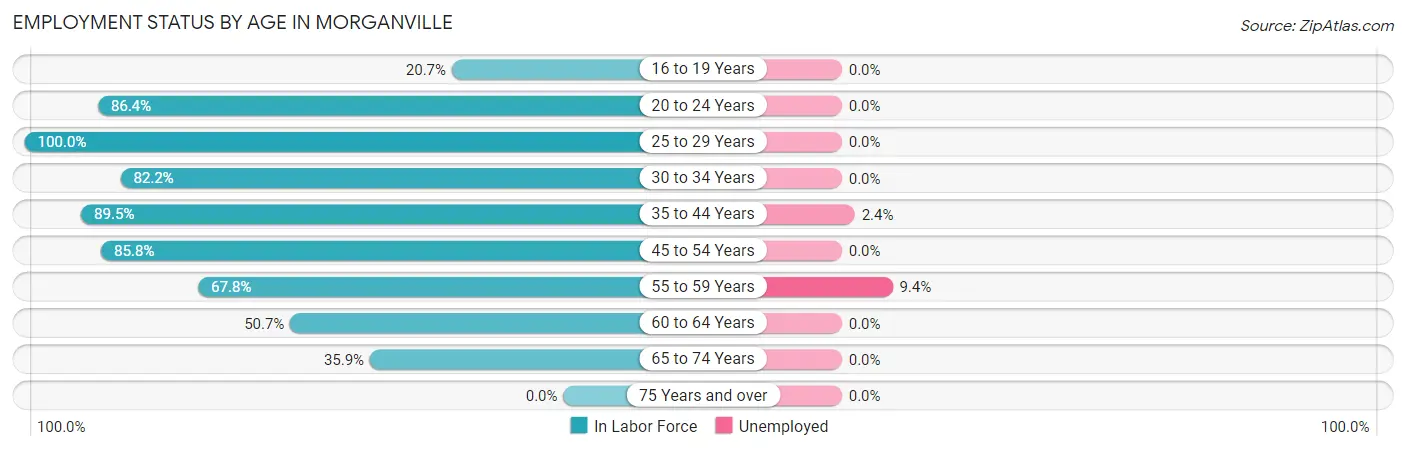
| Age Bracket | In Labor Force | Unemployed |
| 16 to 19 Years | 61 (20.7%) | 0 (0.0%) |
| 20 to 24 Years | 344 (86.4%) | 0 (0.0%) |
| 25 to 29 Years | 236 (100.0%) | 0 (0.0%) |
| 30 to 34 Years | 143 (82.2%) | 0 (0.0%) |
| 35 to 44 Years | 548 (89.5%) | 13 (2.4%) |
| 45 to 54 Years | 628 (85.8%) | 0 (0.0%) |
| 55 to 59 Years | 374 (67.8%) | 35 (9.4%) |
| 60 to 64 Years | 149 (50.7%) | 0 (0.0%) |
| 65 to 74 Years | 240 (35.9%) | 0 (0.0%) |
| 75 Years and over | 0 (0.0%) | 0 (0.0%) |
| Total | 2,723 (63.3%) | 49 (1.8%) |
Employment Status by Educational Attainment in Morganville
According to labor force statistics for Morganville, 79.9% of individuals (2,077) out of the total population between 25 and 64 years of age (2,600) are in the labor force, with 2.3% or 48 of them being unemployed. The group with the highest labor force participation rate are those with the educational attainment of bachelor's degree or higher, with 86.6% or 1,522 individuals in the labor force. Within the labor force, individuals with college / associate degree education have the highest percentage of unemployment, with 4.1% or 16 of them being unemployed.
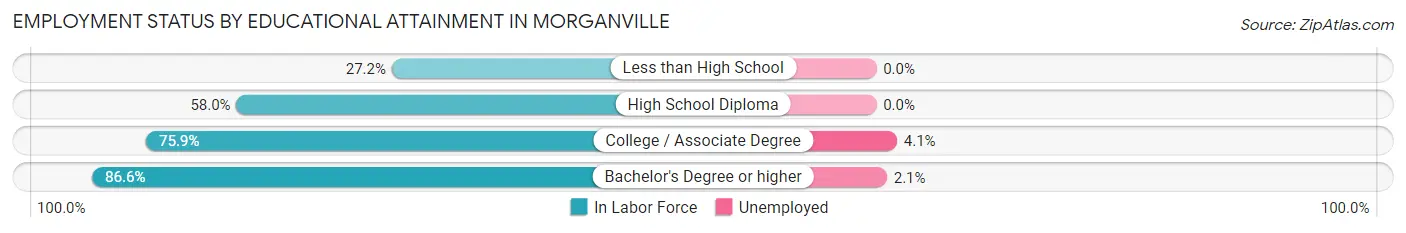
| Educational Attainment | In Labor Force | Unemployed |
| Less than High School | 22 (27.2%) | 0 (0.0%) |
| High School Diploma | 141 (58.0%) | 0 (0.0%) |
| College / Associate Degree | 394 (75.9%) | 21 (4.1%) |
| Bachelor's Degree or higher | 1,522 (86.6%) | 37 (2.1%) |
| Total | 2,077 (79.9%) | 60 (2.3%) |
Employment Occupations by Sex in Morganville
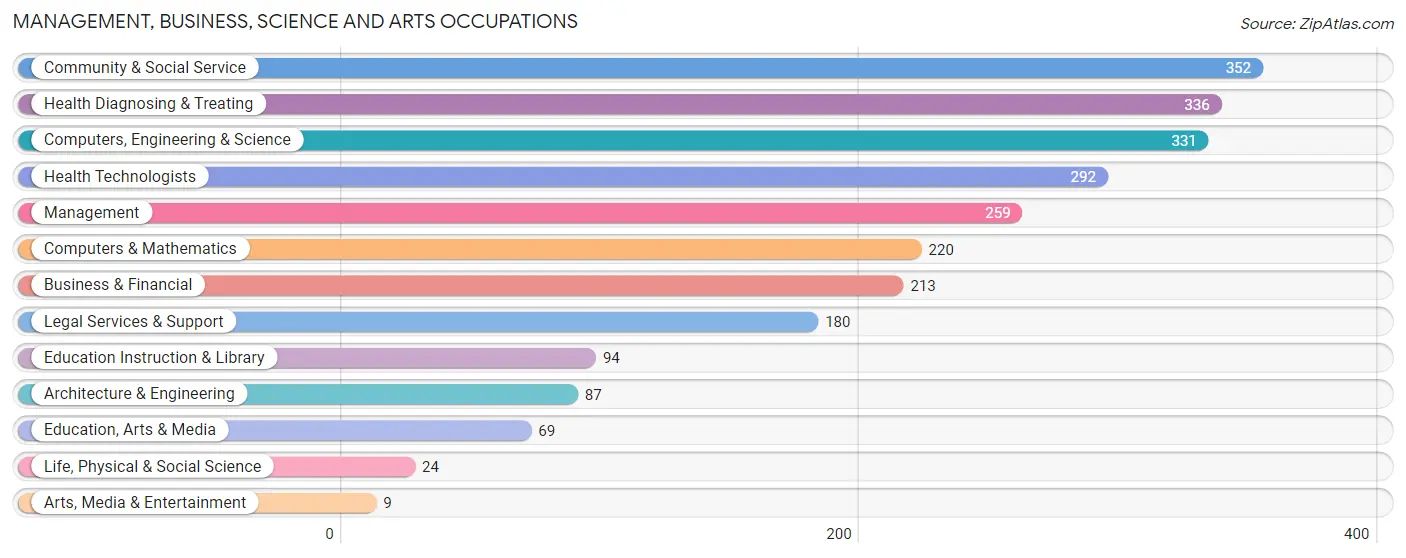
Management, Business, Science and Arts Occupations
The most common Management, Business, Science and Arts occupations in Morganville are Community & Social Service (352 | 13.2%), Health Diagnosing & Treating (336 | 12.6%), Computers, Engineering & Science (331 | 12.4%), Health Technologists (292 | 10.9%), and Management (259 | 9.7%).
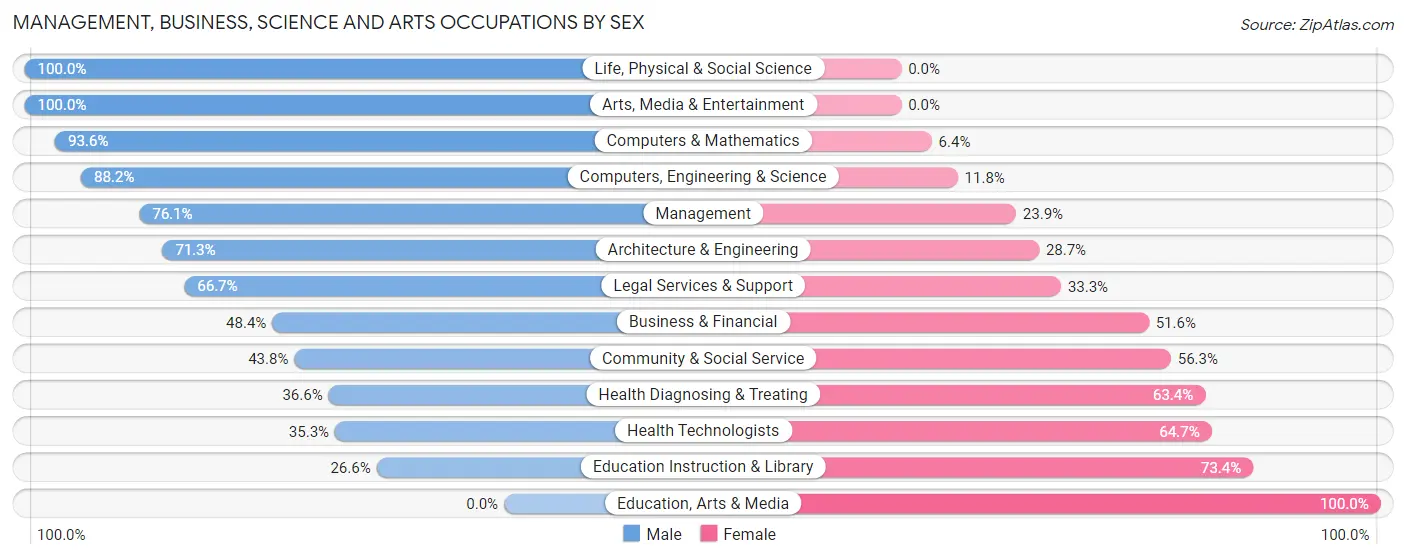
Management, Business, Science and Arts Occupations by Sex
Within the Management, Business, Science and Arts occupations in Morganville, the most male-oriented occupations are Life, Physical & Social Science (100.0%), Arts, Media & Entertainment (100.0%), and Computers & Mathematics (93.6%), while the most female-oriented occupations are Education, Arts & Media (100.0%), Education Instruction & Library (73.4%), and Health Technologists (64.7%).
| Occupation | Male | Female |
| Management | 197 (76.1%) | 62 (23.9%) |
| Business & Financial | 103 (48.4%) | 110 (51.6%) |
| Computers, Engineering & Science | 292 (88.2%) | 39 (11.8%) |
| Computers & Mathematics | 206 (93.6%) | 14 (6.4%) |
| Architecture & Engineering | 62 (71.3%) | 25 (28.7%) |
| Life, Physical & Social Science | 24 (100.0%) | 0 (0.0%) |
| Community & Social Service | 154 (43.8%) | 198 (56.2%) |
| Education, Arts & Media | 0 (0.0%) | 69 (100.0%) |
| Legal Services & Support | 120 (66.7%) | 60 (33.3%) |
| Education Instruction & Library | 25 (26.6%) | 69 (73.4%) |
| Arts, Media & Entertainment | 9 (100.0%) | 0 (0.0%) |
| Health Diagnosing & Treating | 123 (36.6%) | 213 (63.4%) |
| Health Technologists | 103 (35.3%) | 189 (64.7%) |
| Total (Category) | 869 (58.3%) | 622 (41.7%) |
| Total (Overall) | 1,552 (58.0%) | 1,123 (42.0%) |
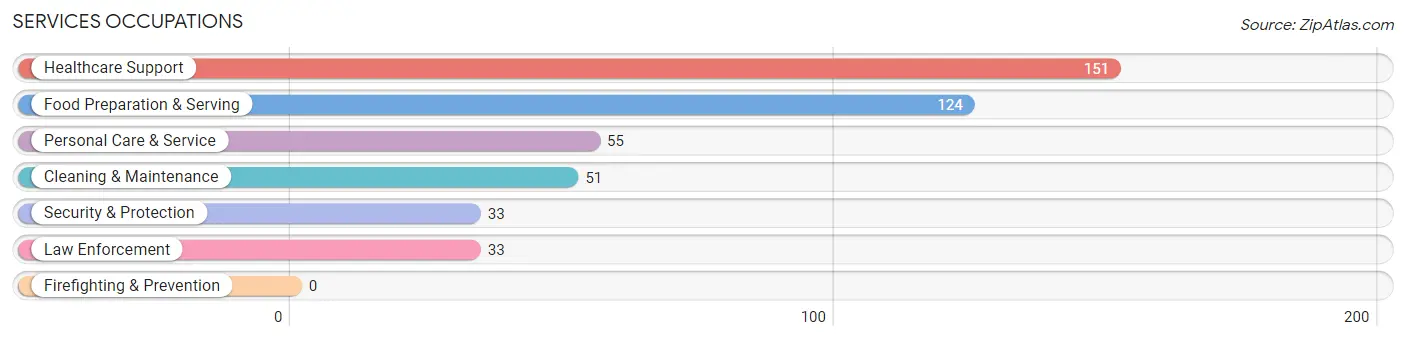
Services Occupations
The most common Services occupations in Morganville are Healthcare Support (151 | 5.6%), Food Preparation & Serving (124 | 4.6%), Personal Care & Service (55 | 2.1%), Cleaning & Maintenance (51 | 1.9%), and Security & Protection (33 | 1.2%).
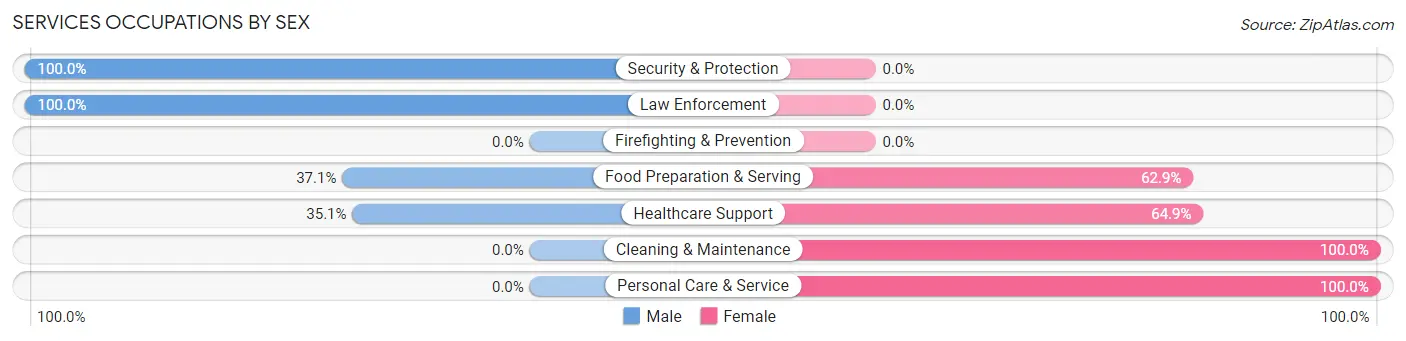
Services Occupations by Sex
Within the Services occupations in Morganville, the most male-oriented occupations are Security & Protection (100.0%), Law Enforcement (100.0%), and Food Preparation & Serving (37.1%), while the most female-oriented occupations are Cleaning & Maintenance (100.0%), Personal Care & Service (100.0%), and Healthcare Support (64.9%).
| Occupation | Male | Female |
| Healthcare Support | 53 (35.1%) | 98 (64.9%) |
| Security & Protection | 33 (100.0%) | 0 (0.0%) |
| Firefighting & Prevention | 0 (0.0%) | 0 (0.0%) |
| Law Enforcement | 33 (100.0%) | 0 (0.0%) |
| Food Preparation & Serving | 46 (37.1%) | 78 (62.9%) |
| Cleaning & Maintenance | 0 (0.0%) | 51 (100.0%) |
| Personal Care & Service | 0 (0.0%) | 55 (100.0%) |
| Total (Category) | 132 (31.9%) | 282 (68.1%) |
| Total (Overall) | 1,552 (58.0%) | 1,123 (42.0%) |
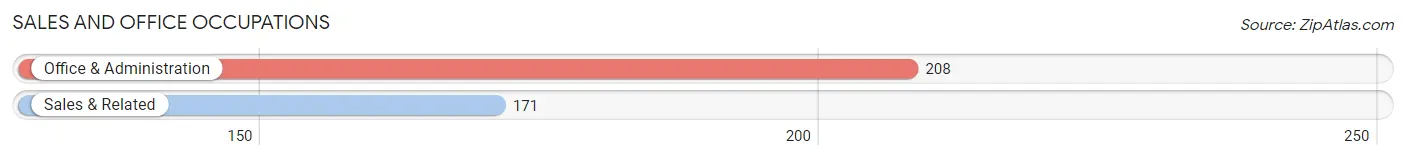
Sales and Office Occupations
The most common Sales and Office occupations in Morganville are Office & Administration (208 | 7.8%), and Sales & Related (171 | 6.4%).
Sales and Office Occupations by Sex
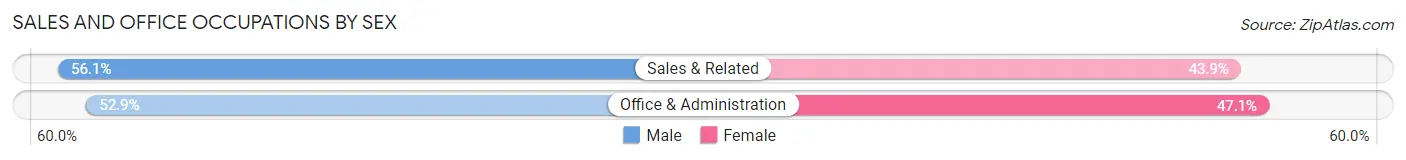
| Occupation | Male | Female |
| Sales & Related | 96 (56.1%) | 75 (43.9%) |
| Office & Administration | 110 (52.9%) | 98 (47.1%) |
| Total (Category) | 206 (54.3%) | 173 (45.7%) |
| Total (Overall) | 1,552 (58.0%) | 1,123 (42.0%) |
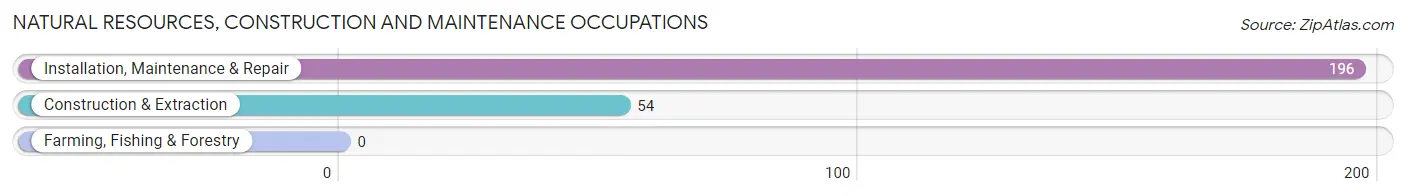
Natural Resources, Construction and Maintenance Occupations
The most common Natural Resources, Construction and Maintenance occupations in Morganville are Installation, Maintenance & Repair (196 | 7.3%), and Construction & Extraction (54 | 2.0%).
Natural Resources, Construction and Maintenance Occupations by Sex
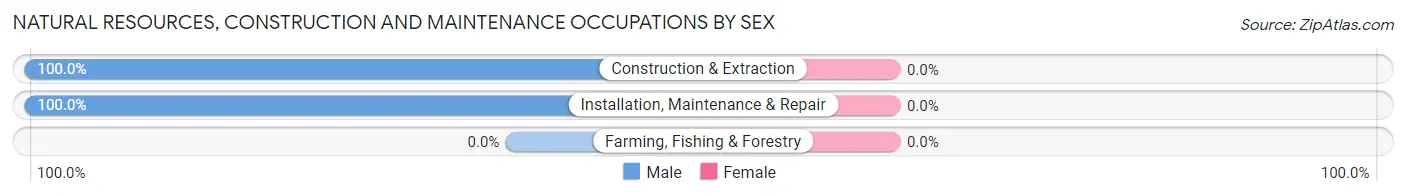
| Occupation | Male | Female |
| Farming, Fishing & Forestry | 0 (0.0%) | 0 (0.0%) |
| Construction & Extraction | 54 (100.0%) | 0 (0.0%) |
| Installation, Maintenance & Repair | 196 (100.0%) | 0 (0.0%) |
| Total (Category) | 250 (100.0%) | 0 (0.0%) |
| Total (Overall) | 1,552 (58.0%) | 1,123 (42.0%) |
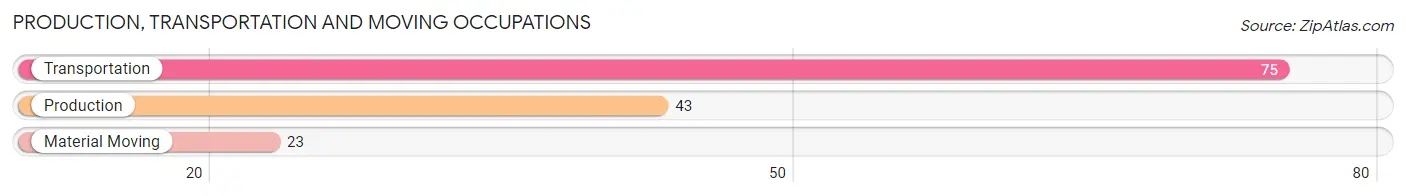
Production, Transportation and Moving Occupations
The most common Production, Transportation and Moving occupations in Morganville are Transportation (75 | 2.8%), Production (43 | 1.6%), and Material Moving (23 | 0.9%).
Production, Transportation and Moving Occupations by Sex
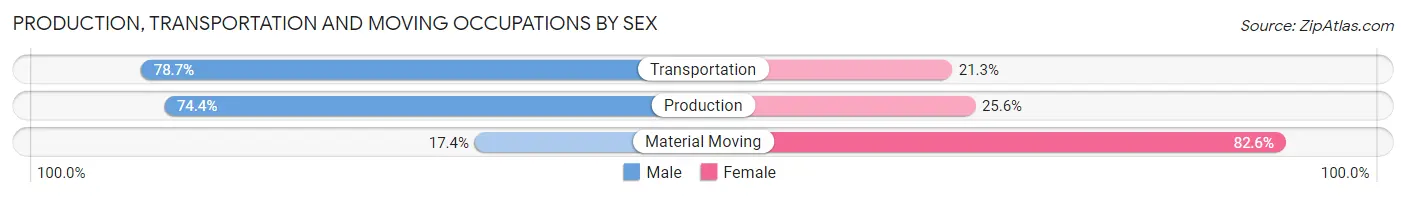
| Occupation | Male | Female |
| Production | 32 (74.4%) | 11 (25.6%) |
| Transportation | 59 (78.7%) | 16 (21.3%) |
| Material Moving | 4 (17.4%) | 19 (82.6%) |
| Total (Category) | 95 (67.4%) | 46 (32.6%) |
| Total (Overall) | 1,552 (58.0%) | 1,123 (42.0%) |
Employment Industries by Sex in Morganville
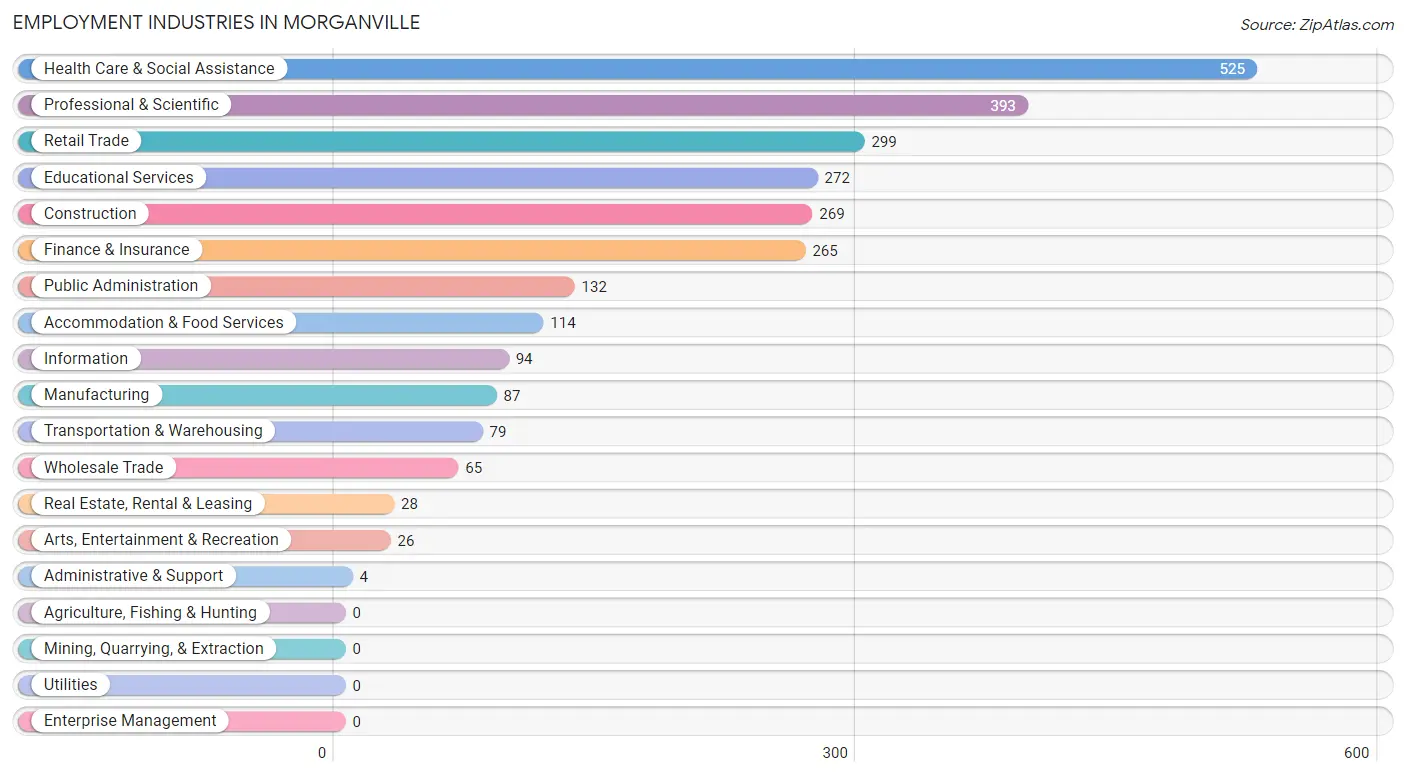
Employment Industries in Morganville
The major employment industries in Morganville include Health Care & Social Assistance (525 | 19.6%), Professional & Scientific (393 | 14.7%), Retail Trade (299 | 11.2%), Educational Services (272 | 10.2%), and Construction (269 | 10.1%).
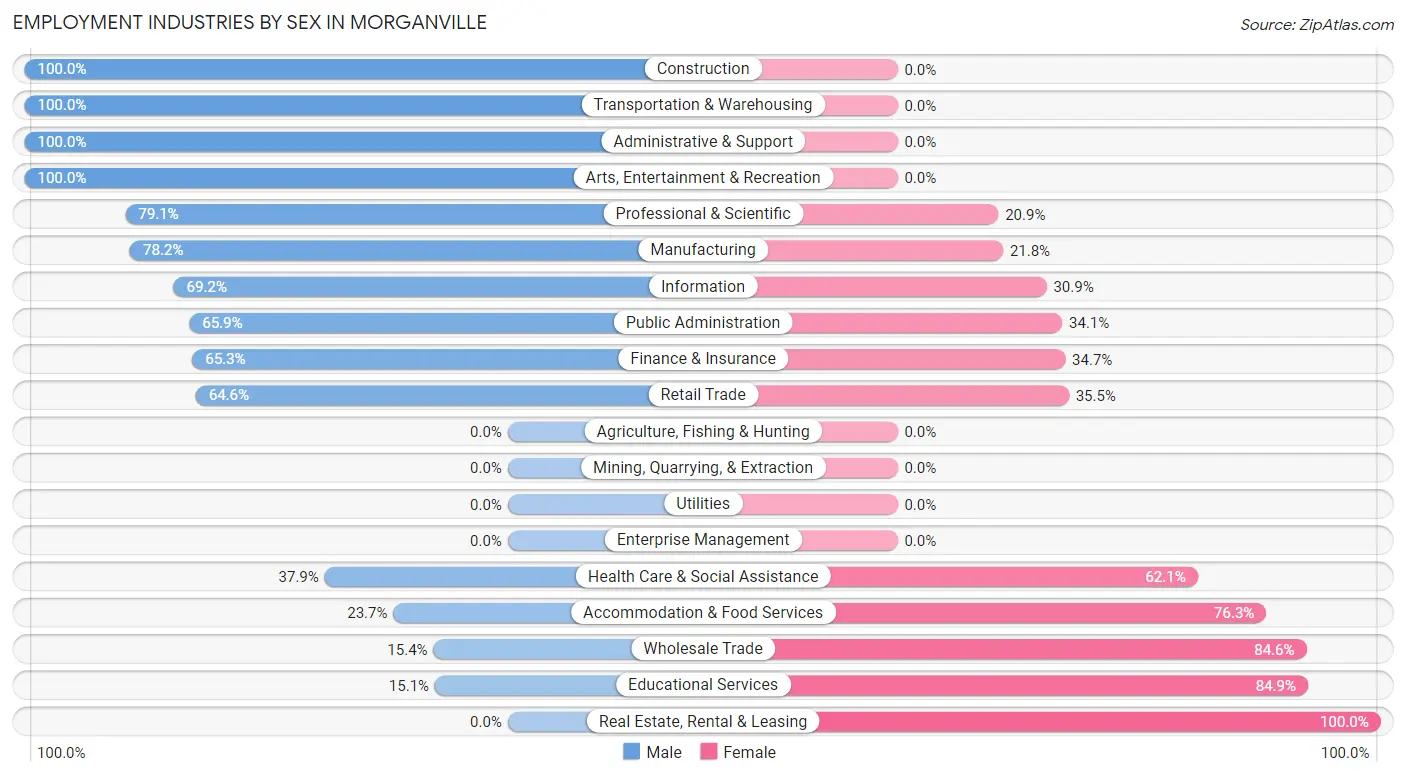
Employment Industries by Sex in Morganville
The Morganville industries that see more men than women are Construction (100.0%), Transportation & Warehousing (100.0%), and Administrative & Support (100.0%), whereas the industries that tend to have a higher number of women are Real Estate, Rental & Leasing (100.0%), Educational Services (84.9%), and Wholesale Trade (84.6%).
| Industry | Male | Female |
| Agriculture, Fishing & Hunting | 0 (0.0%) | 0 (0.0%) |
| Mining, Quarrying, & Extraction | 0 (0.0%) | 0 (0.0%) |
| Construction | 269 (100.0%) | 0 (0.0%) |
| Manufacturing | 68 (78.2%) | 19 (21.8%) |
| Wholesale Trade | 10 (15.4%) | 55 (84.6%) |
| Retail Trade | 193 (64.5%) | 106 (35.4%) |
| Transportation & Warehousing | 79 (100.0%) | 0 (0.0%) |
| Utilities | 0 (0.0%) | 0 (0.0%) |
| Information | 65 (69.2%) | 29 (30.8%) |
| Finance & Insurance | 173 (65.3%) | 92 (34.7%) |
| Real Estate, Rental & Leasing | 0 (0.0%) | 28 (100.0%) |
| Professional & Scientific | 311 (79.1%) | 82 (20.9%) |
| Enterprise Management | 0 (0.0%) | 0 (0.0%) |
| Administrative & Support | 4 (100.0%) | 0 (0.0%) |
| Educational Services | 41 (15.1%) | 231 (84.9%) |
| Health Care & Social Assistance | 199 (37.9%) | 326 (62.1%) |
| Arts, Entertainment & Recreation | 26 (100.0%) | 0 (0.0%) |
| Accommodation & Food Services | 27 (23.7%) | 87 (76.3%) |
| Public Administration | 87 (65.9%) | 45 (34.1%) |
| Total | 1,552 (58.0%) | 1,123 (42.0%) |
Education in Morganville
School Enrollment in Morganville
The most common levels of schooling among the 1,551 students in Morganville are college / undergraduate (521 | 33.6%), high school (312 | 20.1%), and middle school (304 | 19.6%).
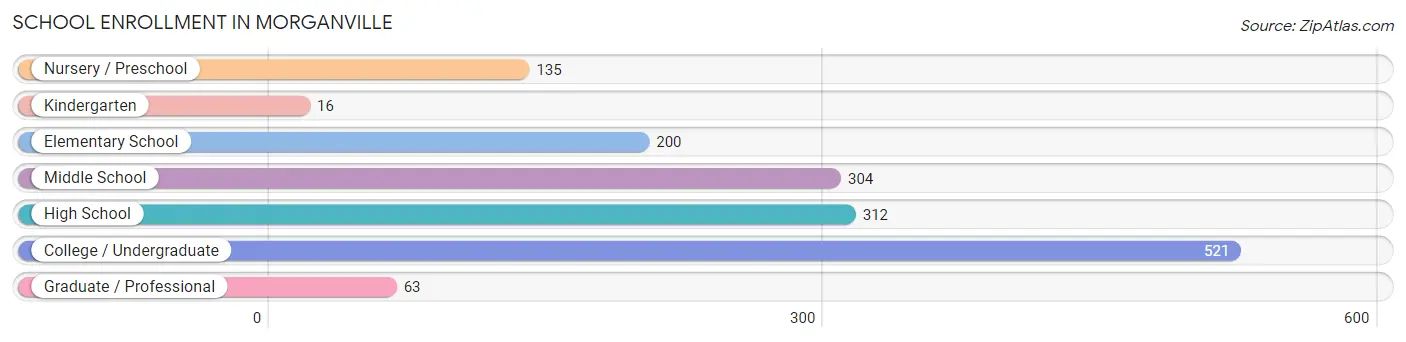
| School Level | # Students | % Students |
| Nursery / Preschool | 135 | 8.7% |
| Kindergarten | 16 | 1.0% |
| Elementary School | 200 | 12.9% |
| Middle School | 304 | 19.6% |
| High School | 312 | 20.1% |
| College / Undergraduate | 521 | 33.6% |
| Graduate / Professional | 63 | 4.1% |
| Total | 1,551 | 100.0% |
School Enrollment by Age by Funding Source in Morganville
Out of a total of 1,551 students who are enrolled in schools in Morganville, 541 (34.9%) attend a private institution, while the remaining 1,010 (65.1%) are enrolled in public schools. The age group of 25 to 34 year olds has the highest likelihood of being enrolled in private schools, with 24 (100.0% in the age bracket) enrolled. Conversely, the age group of 10 to 14 year olds has the lowest likelihood of being enrolled in a private school, with 290 (94.5% in the age bracket) attending a public institution.
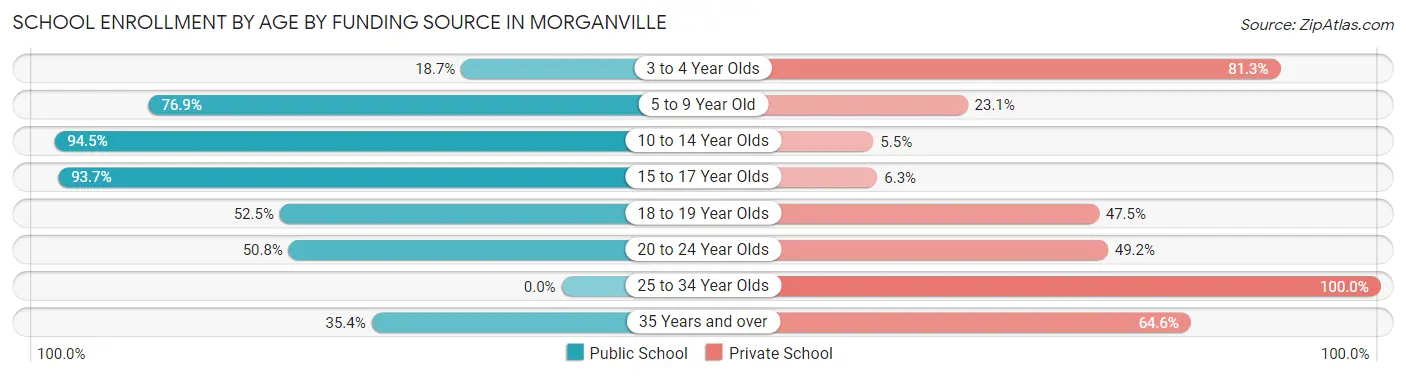
| Age Bracket | Public School | Private School |
| 3 to 4 Year Olds | 17 (18.7%) | 74 (81.3%) |
| 5 to 9 Year Old | 200 (76.9%) | 60 (23.1%) |
| 10 to 14 Year Olds | 290 (94.5%) | 17 (5.5%) |
| 15 to 17 Year Olds | 239 (93.7%) | 16 (6.3%) |
| 18 to 19 Year Olds | 53 (52.5%) | 48 (47.5%) |
| 20 to 24 Year Olds | 94 (50.8%) | 91 (49.2%) |
| 25 to 34 Year Olds | 0 (0.0%) | 24 (100.0%) |
| 35 Years and over | 116 (35.4%) | 212 (64.6%) |
| Total | 1,010 (65.1%) | 541 (34.9%) |
Educational Attainment by Field of Study in Morganville
Engineering (351 | 14.1%), business (302 | 12.1%), computers & mathematics (271 | 10.9%), education (258 | 10.4%), and science & technology (207 | 8.3%) are the most common fields of study among 2,488 individuals in Morganville who have obtained a bachelor's degree or higher.
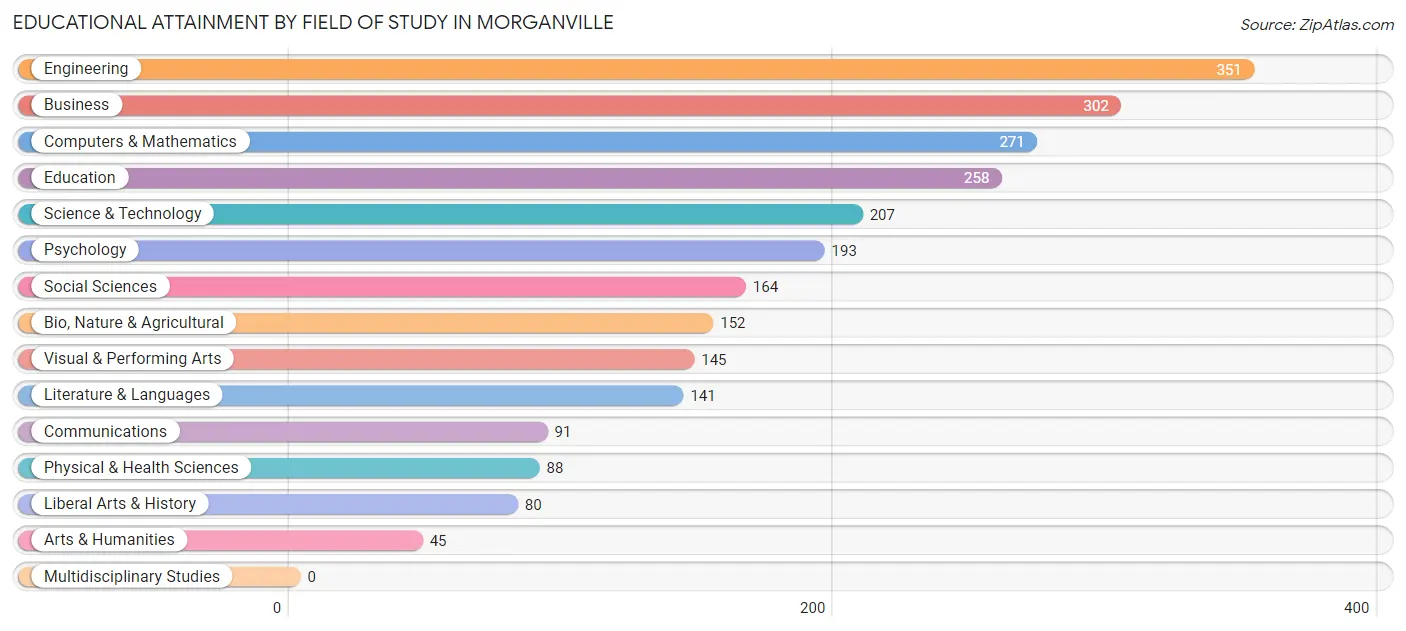
| Field of Study | # Graduates | % Graduates |
| Computers & Mathematics | 271 | 10.9% |
| Bio, Nature & Agricultural | 152 | 6.1% |
| Physical & Health Sciences | 88 | 3.5% |
| Psychology | 193 | 7.8% |
| Social Sciences | 164 | 6.6% |
| Engineering | 351 | 14.1% |
| Multidisciplinary Studies | 0 | 0.0% |
| Science & Technology | 207 | 8.3% |
| Business | 302 | 12.1% |
| Education | 258 | 10.4% |
| Literature & Languages | 141 | 5.7% |
| Liberal Arts & History | 80 | 3.2% |
| Visual & Performing Arts | 145 | 5.8% |
| Communications | 91 | 3.7% |
| Arts & Humanities | 45 | 1.8% |
| Total | 2,488 | 100.0% |
Transportation & Commute in Morganville
Vehicle Availability by Sex in Morganville
The most prevalent vehicle ownership categories in Morganville are males with 2 vehicles (765, accounting for 49.4%) and females with 2 vehicles (530, making up 71.6%).
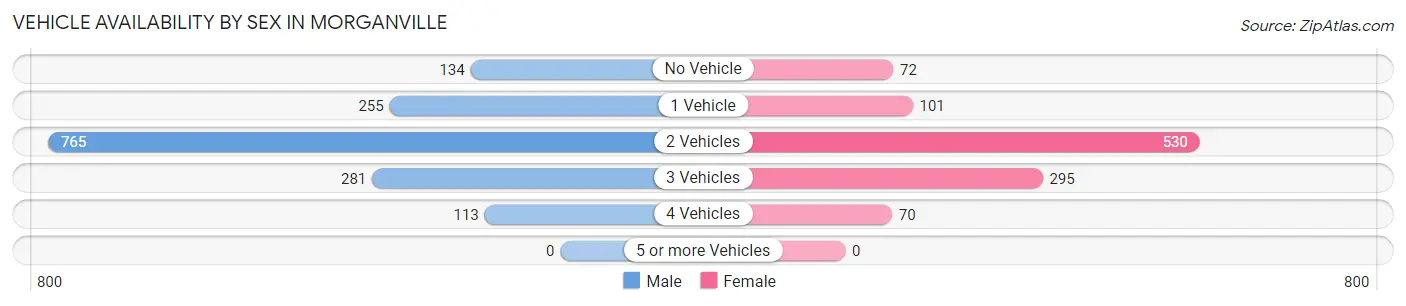
| Vehicles Available | Male | Female |
| No Vehicle | 134 (8.7%) | 72 (6.7%) |
| 1 Vehicle | 255 (16.5%) | 101 (9.5%) |
| 2 Vehicles | 765 (49.4%) | 530 (49.6%) |
| 3 Vehicles | 281 (18.1%) | 295 (27.6%) |
| 4 Vehicles | 113 (7.3%) | 70 (6.6%) |
| 5 or more Vehicles | 0 (0.0%) | 0 (0.0%) |
| Total | 1,548 (100.0%) | 1,068 (100.0%) |
Commute Time in Morganville
The most frequently occuring commute durations in Morganville are 30 to 34 minutes (396 commuters, 17.6%), 45 to 59 minutes (290 commuters, 12.9%), and 20 to 24 minutes (289 commuters, 12.8%).
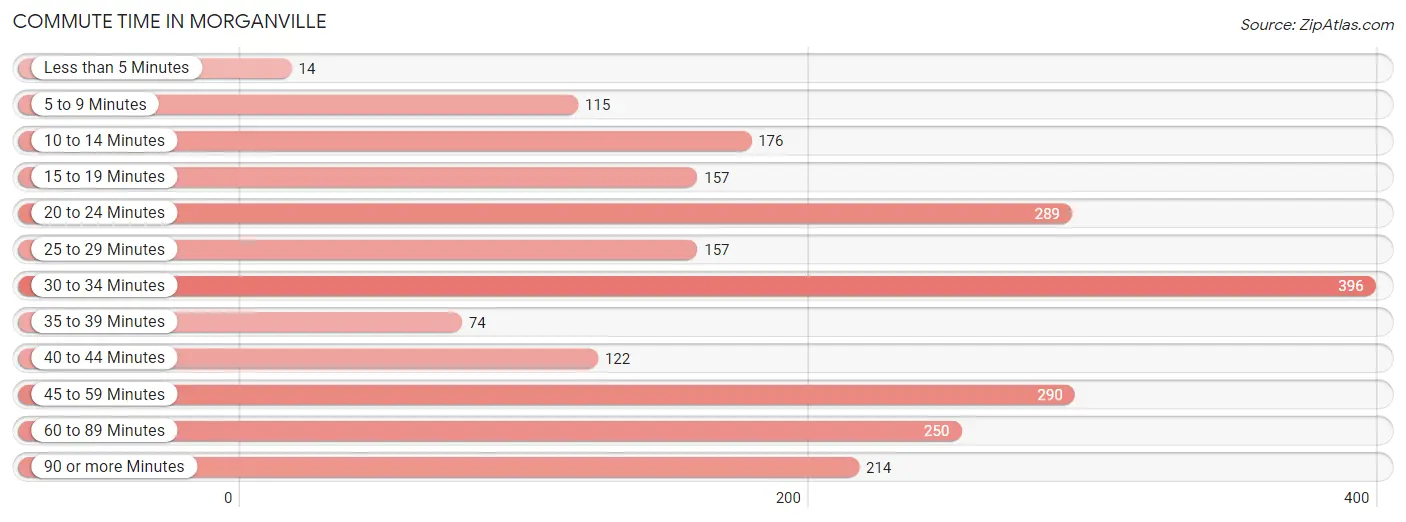
| Commute Time | # Commuters | % Commuters |
| Less than 5 Minutes | 14 | 0.6% |
| 5 to 9 Minutes | 115 | 5.1% |
| 10 to 14 Minutes | 176 | 7.8% |
| 15 to 19 Minutes | 157 | 7.0% |
| 20 to 24 Minutes | 289 | 12.8% |
| 25 to 29 Minutes | 157 | 7.0% |
| 30 to 34 Minutes | 396 | 17.6% |
| 35 to 39 Minutes | 74 | 3.3% |
| 40 to 44 Minutes | 122 | 5.4% |
| 45 to 59 Minutes | 290 | 12.9% |
| 60 to 89 Minutes | 250 | 11.1% |
| 90 or more Minutes | 214 | 9.5% |
Commute Time by Sex in Morganville
The most common commute times in Morganville are 45 to 59 minutes (290 commuters, 22.3%) for males and 30 to 34 minutes (200 commuters, 20.9%) for females.
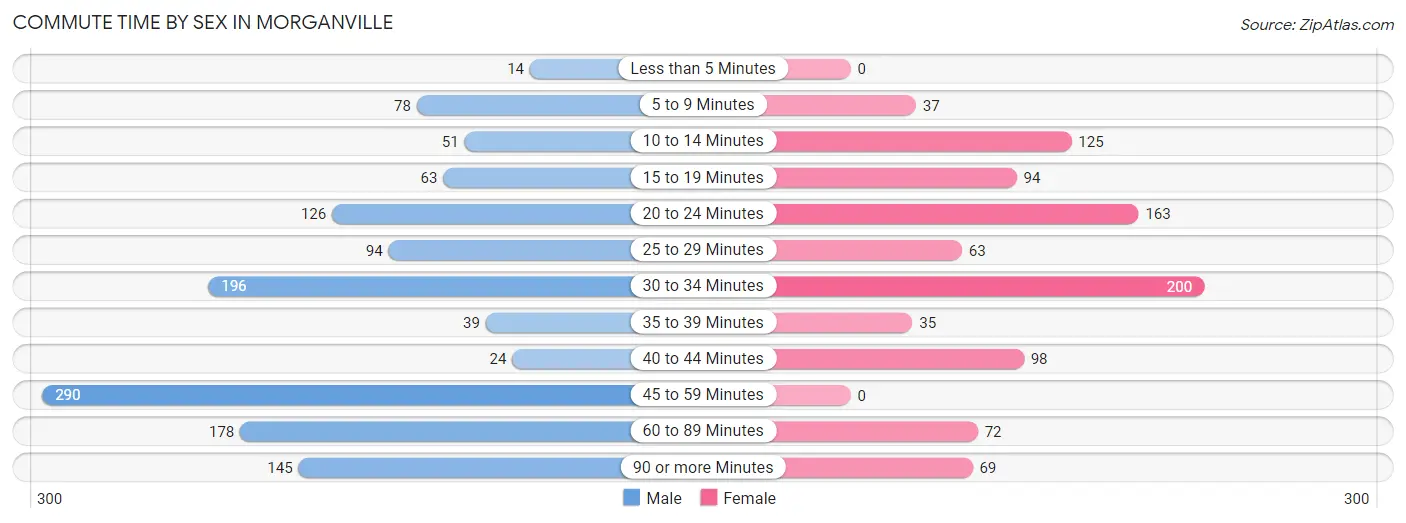
| Commute Time | Male | Female |
| Less than 5 Minutes | 14 (1.1%) | 0 (0.0%) |
| 5 to 9 Minutes | 78 (6.0%) | 37 (3.9%) |
| 10 to 14 Minutes | 51 (3.9%) | 125 (13.1%) |
| 15 to 19 Minutes | 63 (4.9%) | 94 (9.8%) |
| 20 to 24 Minutes | 126 (9.7%) | 163 (17.1%) |
| 25 to 29 Minutes | 94 (7.2%) | 63 (6.6%) |
| 30 to 34 Minutes | 196 (15.1%) | 200 (20.9%) |
| 35 to 39 Minutes | 39 (3.0%) | 35 (3.7%) |
| 40 to 44 Minutes | 24 (1.8%) | 98 (10.2%) |
| 45 to 59 Minutes | 290 (22.3%) | 0 (0.0%) |
| 60 to 89 Minutes | 178 (13.7%) | 72 (7.5%) |
| 90 or more Minutes | 145 (11.2%) | 69 (7.2%) |
Time of Departure to Work by Sex in Morganville
The most frequent times of departure to work in Morganville are 6:00 AM to 6:29 AM (268, 20.6%) for males and 9:00 AM to 9:59 AM (183, 19.1%) for females.
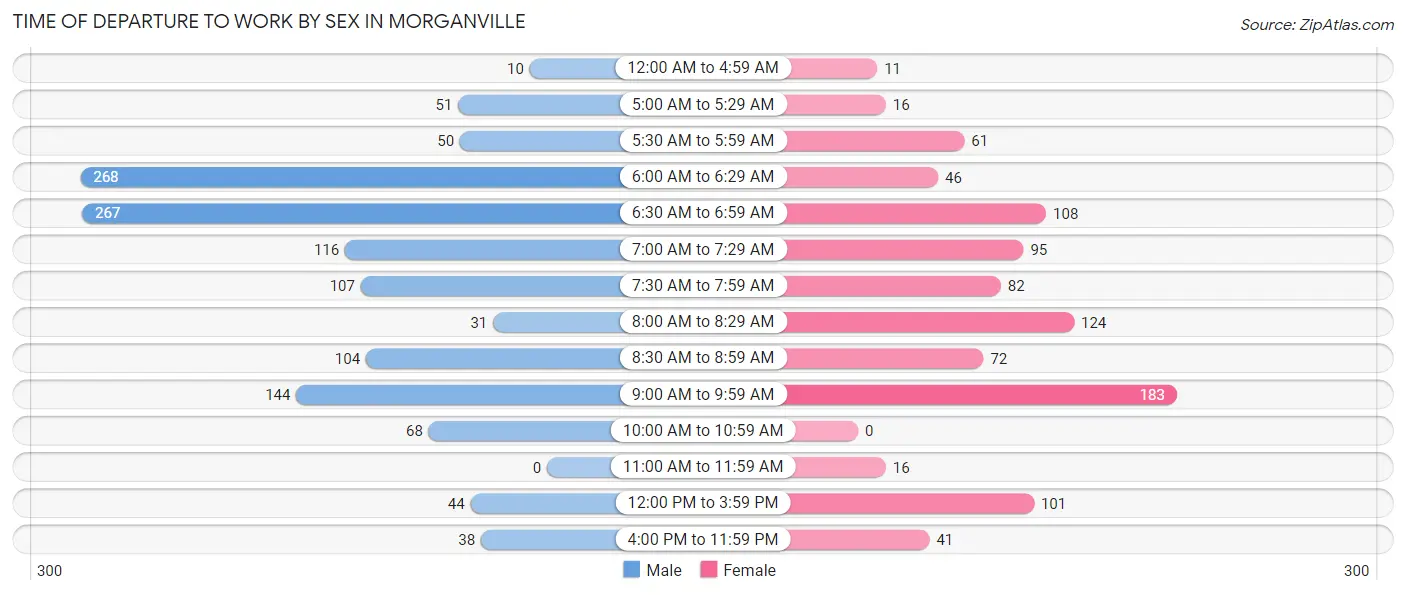
| Time of Departure | Male | Female |
| 12:00 AM to 4:59 AM | 10 (0.8%) | 11 (1.1%) |
| 5:00 AM to 5:29 AM | 51 (3.9%) | 16 (1.7%) |
| 5:30 AM to 5:59 AM | 50 (3.8%) | 61 (6.4%) |
| 6:00 AM to 6:29 AM | 268 (20.6%) | 46 (4.8%) |
| 6:30 AM to 6:59 AM | 267 (20.6%) | 108 (11.3%) |
| 7:00 AM to 7:29 AM | 116 (8.9%) | 95 (9.9%) |
| 7:30 AM to 7:59 AM | 107 (8.2%) | 82 (8.6%) |
| 8:00 AM to 8:29 AM | 31 (2.4%) | 124 (13.0%) |
| 8:30 AM to 8:59 AM | 104 (8.0%) | 72 (7.5%) |
| 9:00 AM to 9:59 AM | 144 (11.1%) | 183 (19.1%) |
| 10:00 AM to 10:59 AM | 68 (5.2%) | 0 (0.0%) |
| 11:00 AM to 11:59 AM | 0 (0.0%) | 16 (1.7%) |
| 12:00 PM to 3:59 PM | 44 (3.4%) | 101 (10.6%) |
| 4:00 PM to 11:59 PM | 38 (2.9%) | 41 (4.3%) |
| Total | 1,298 (100.0%) | 956 (100.0%) |
Housing Occupancy in Morganville
Occupancy by Ownership in Morganville
Of the total 1,979 dwellings in Morganville, owner-occupied units account for 1,774 (89.6%), while renter-occupied units make up 205 (10.4%).
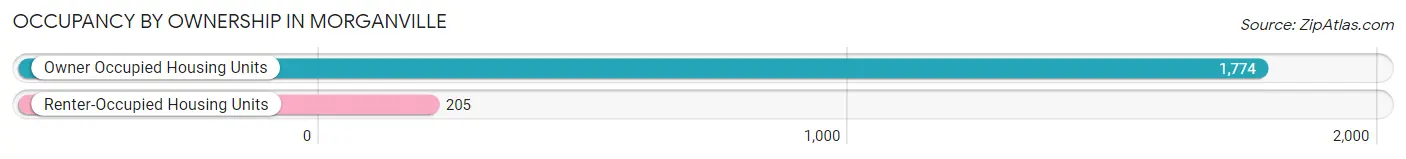
| Occupancy | # Housing Units | % Housing Units |
| Owner Occupied Housing Units | 1,774 | 89.6% |
| Renter-Occupied Housing Units | 205 | 10.4% |
| Total Occupied Housing Units | 1,979 | 100.0% |
Occupancy by Household Size in Morganville
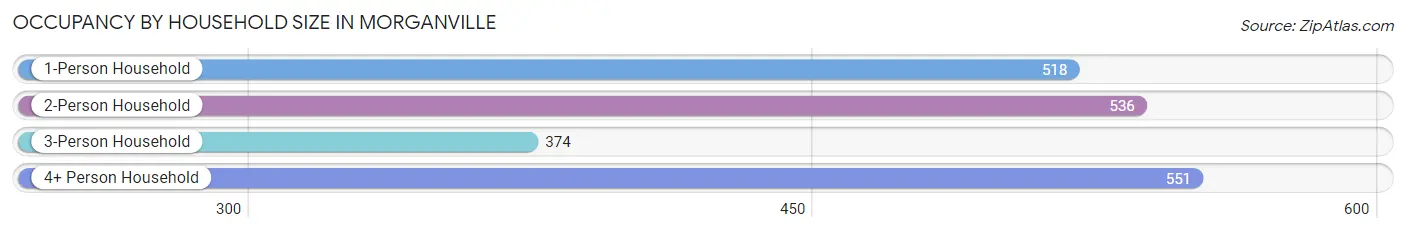
| Household Size | # Housing Units | % Housing Units |
| 1-Person Household | 518 | 26.2% |
| 2-Person Household | 536 | 27.1% |
| 3-Person Household | 374 | 18.9% |
| 4+ Person Household | 551 | 27.8% |
| Total Housing Units | 1,979 | 100.0% |
Occupancy by Ownership by Household Size in Morganville
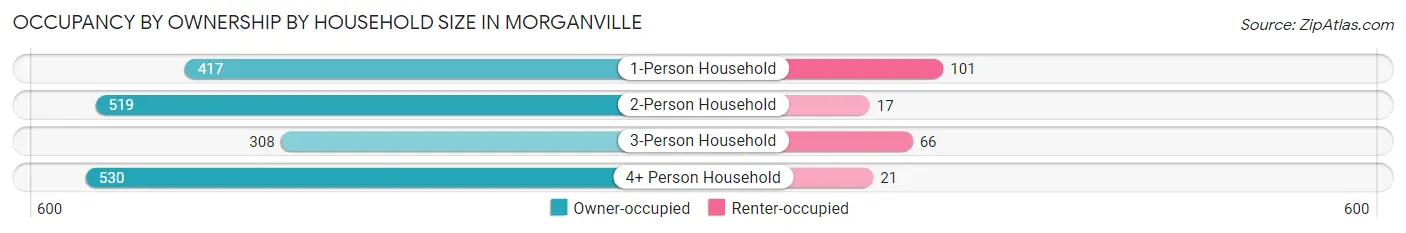
| Household Size | Owner-occupied | Renter-occupied |
| 1-Person Household | 417 (80.5%) | 101 (19.5%) |
| 2-Person Household | 519 (96.8%) | 17 (3.2%) |
| 3-Person Household | 308 (82.4%) | 66 (17.6%) |
| 4+ Person Household | 530 (96.2%) | 21 (3.8%) |
| Total Housing Units | 1,774 (89.6%) | 205 (10.4%) |
Occupancy by Educational Attainment in Morganville
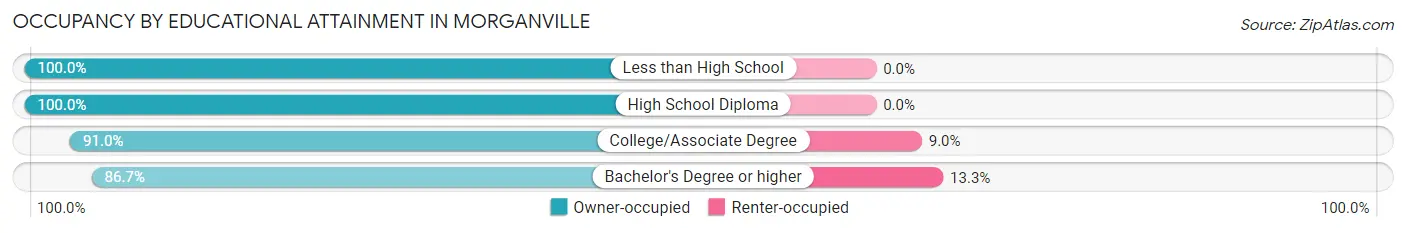
| Household Size | Owner-occupied | Renter-occupied |
| Less than High School | 36 (100.0%) | 0 (0.0%) |
| High School Diploma | 216 (100.0%) | 0 (0.0%) |
| College/Associate Degree | 523 (91.0%) | 52 (9.0%) |
| Bachelor's Degree or higher | 999 (86.7%) | 153 (13.3%) |
Occupancy by Age of Householder in Morganville
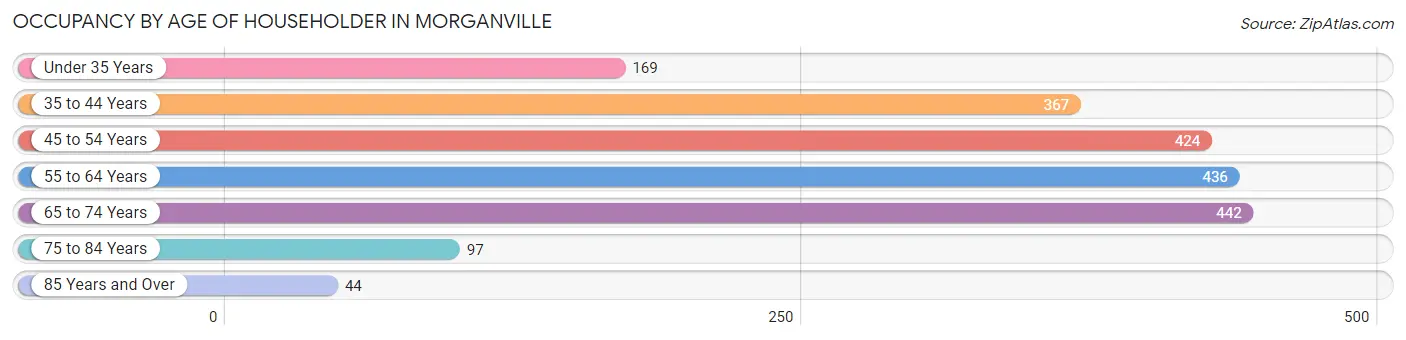
| Age Bracket | # Households | % Households |
| Under 35 Years | 169 | 8.5% |
| 35 to 44 Years | 367 | 18.5% |
| 45 to 54 Years | 424 | 21.4% |
| 55 to 64 Years | 436 | 22.0% |
| 65 to 74 Years | 442 | 22.3% |
| 75 to 84 Years | 97 | 4.9% |
| 85 Years and Over | 44 | 2.2% |
| Total | 1,979 | 100.0% |
Housing Finances in Morganville
Median Income by Occupancy in Morganville
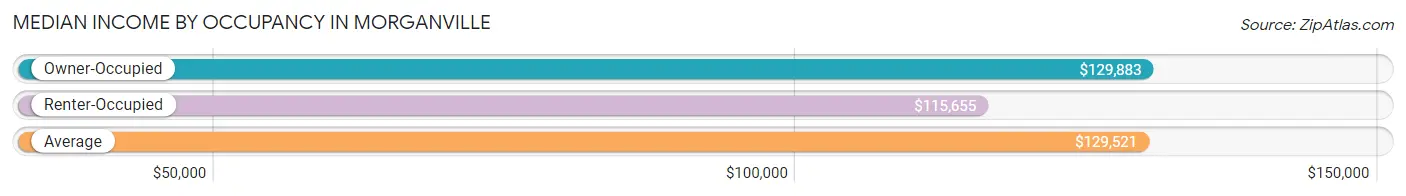
| Occupancy Type | # Households | Median Income |
| Owner-Occupied | 1,774 (89.6%) | $129,883 |
| Renter-Occupied | 205 (10.4%) | $115,655 |
| Average | 1,979 (100.0%) | $129,521 |
Occupancy by Householder Income Bracket in Morganville
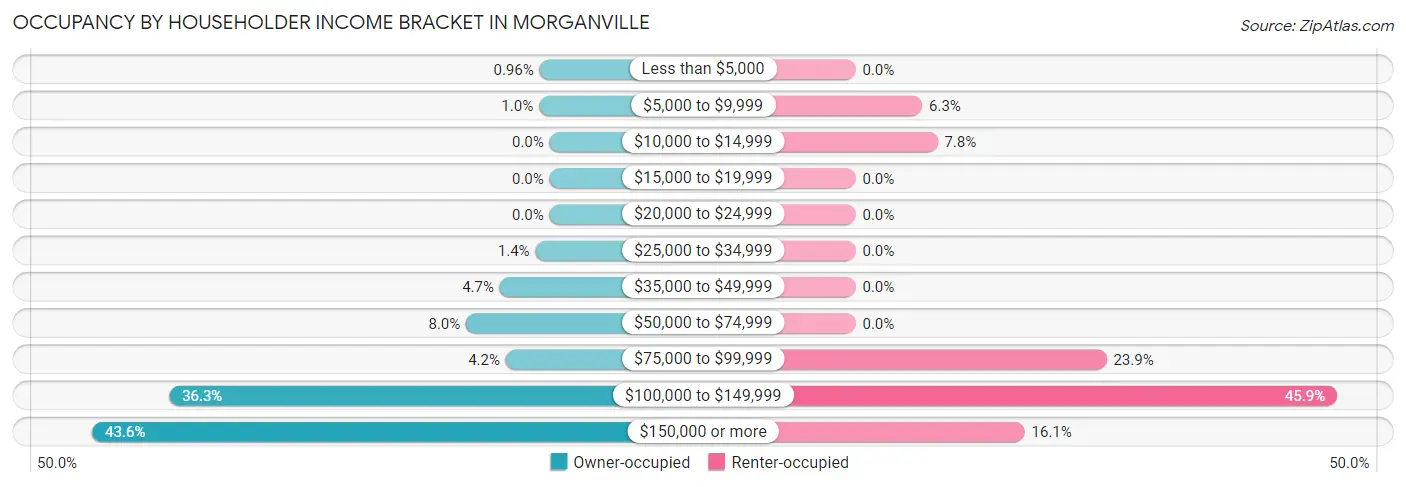
| Income Bracket | Owner-occupied | Renter-occupied |
| Less than $5,000 | 17 (1.0%) | 0 (0.0%) |
| $5,000 to $9,999 | 18 (1.0%) | 13 (6.3%) |
| $10,000 to $14,999 | 0 (0.0%) | 16 (7.8%) |
| $15,000 to $19,999 | 0 (0.0%) | 0 (0.0%) |
| $20,000 to $24,999 | 0 (0.0%) | 0 (0.0%) |
| $25,000 to $34,999 | 24 (1.3%) | 0 (0.0%) |
| $35,000 to $49,999 | 84 (4.7%) | 0 (0.0%) |
| $50,000 to $74,999 | 141 (8.0%) | 0 (0.0%) |
| $75,000 to $99,999 | 74 (4.2%) | 49 (23.9%) |
| $100,000 to $149,999 | 643 (36.2%) | 94 (45.9%) |
| $150,000 or more | 773 (43.6%) | 33 (16.1%) |
| Total | 1,774 (100.0%) | 205 (100.0%) |
Monthly Housing Cost Tiers in Morganville
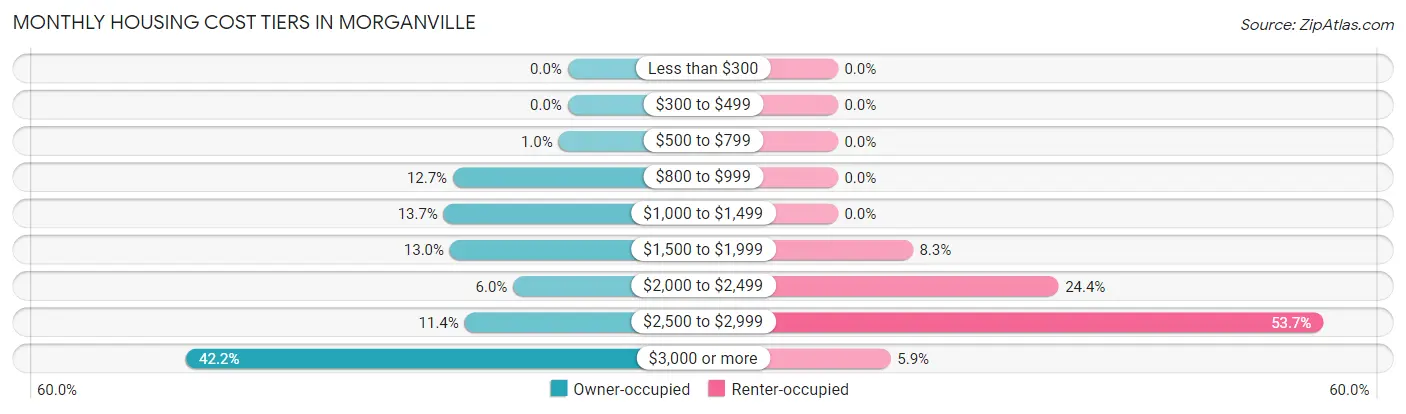
| Monthly Cost | Owner-occupied | Renter-occupied |
| Less than $300 | 0 (0.0%) | 0 (0.0%) |
| $300 to $499 | 0 (0.0%) | 0 (0.0%) |
| $500 to $799 | 18 (1.0%) | 0 (0.0%) |
| $800 to $999 | 225 (12.7%) | 0 (0.0%) |
| $1,000 to $1,499 | 243 (13.7%) | 0 (0.0%) |
| $1,500 to $1,999 | 231 (13.0%) | 17 (8.3%) |
| $2,000 to $2,499 | 107 (6.0%) | 50 (24.4%) |
| $2,500 to $2,999 | 202 (11.4%) | 110 (53.7%) |
| $3,000 or more | 748 (42.2%) | 12 (5.9%) |
| Total | 1,774 (100.0%) | 205 (100.0%) |
Physical Housing Characteristics in Morganville
Housing Structures in Morganville
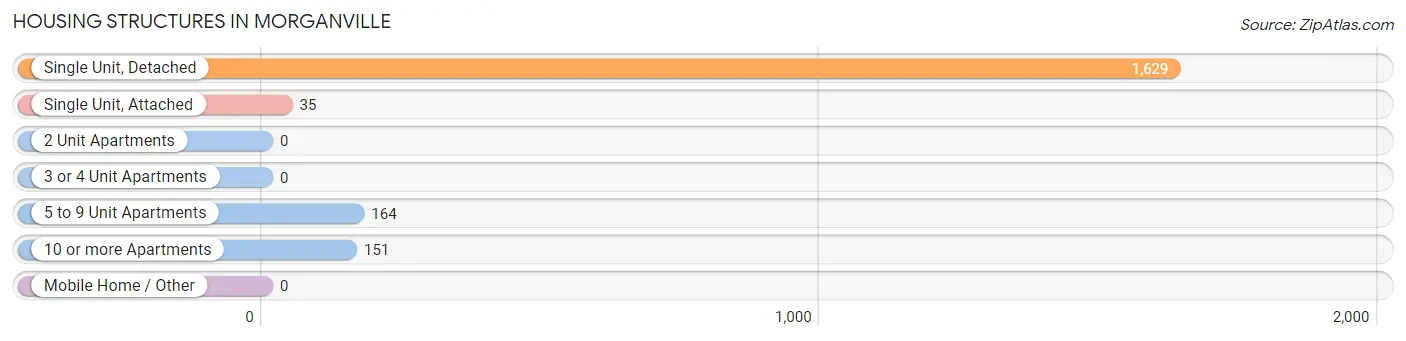
| Structure Type | # Housing Units | % Housing Units |
| Single Unit, Detached | 1,629 | 82.3% |
| Single Unit, Attached | 35 | 1.8% |
| 2 Unit Apartments | 0 | 0.0% |
| 3 or 4 Unit Apartments | 0 | 0.0% |
| 5 to 9 Unit Apartments | 164 | 8.3% |
| 10 or more Apartments | 151 | 7.6% |
| Mobile Home / Other | 0 | 0.0% |
| Total | 1,979 | 100.0% |
Housing Structures by Occupancy in Morganville
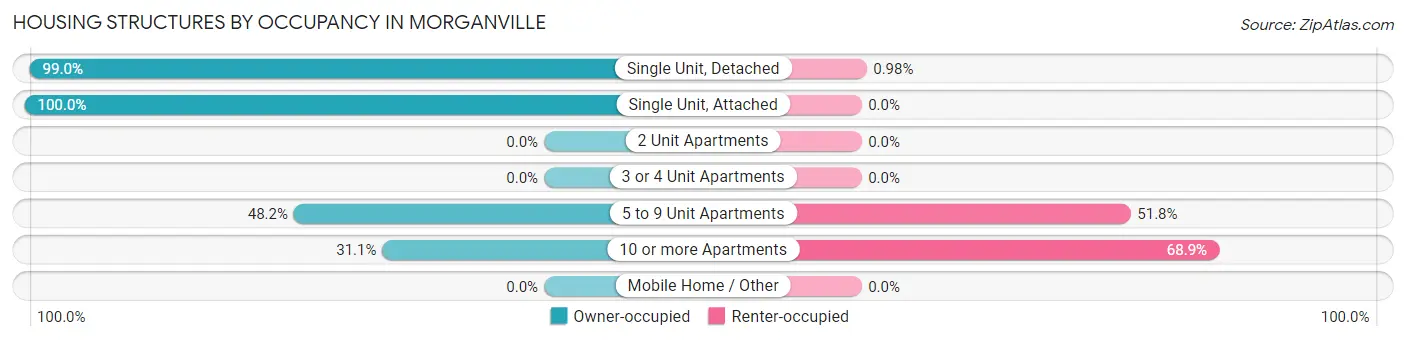
| Structure Type | Owner-occupied | Renter-occupied |
| Single Unit, Detached | 1,613 (99.0%) | 16 (1.0%) |
| Single Unit, Attached | 35 (100.0%) | 0 (0.0%) |
| 2 Unit Apartments | 0 (0.0%) | 0 (0.0%) |
| 3 or 4 Unit Apartments | 0 (0.0%) | 0 (0.0%) |
| 5 to 9 Unit Apartments | 79 (48.2%) | 85 (51.8%) |
| 10 or more Apartments | 47 (31.1%) | 104 (68.9%) |
| Mobile Home / Other | 0 (0.0%) | 0 (0.0%) |
| Total | 1,774 (89.6%) | 205 (10.4%) |
Housing Structures by Number of Rooms in Morganville
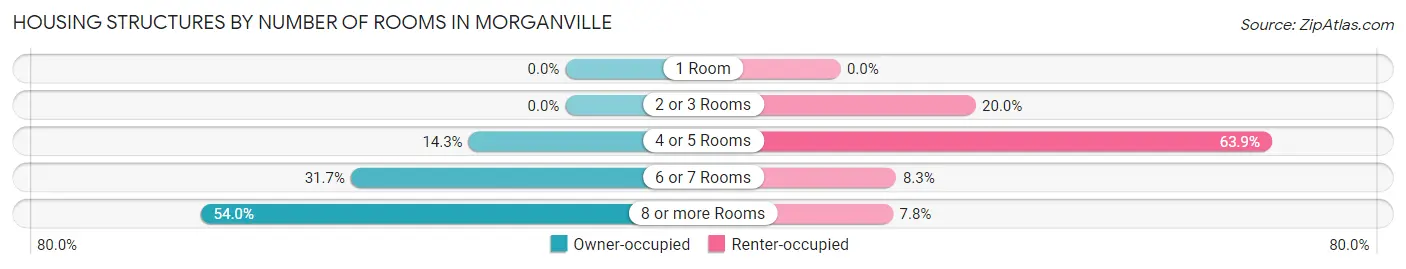
| Number of Rooms | Owner-occupied | Renter-occupied |
| 1 Room | 0 (0.0%) | 0 (0.0%) |
| 2 or 3 Rooms | 0 (0.0%) | 41 (20.0%) |
| 4 or 5 Rooms | 254 (14.3%) | 131 (63.9%) |
| 6 or 7 Rooms | 563 (31.7%) | 17 (8.3%) |
| 8 or more Rooms | 957 (53.9%) | 16 (7.8%) |
| Total | 1,774 (100.0%) | 205 (100.0%) |
Housing Structure by Heating Type in Morganville
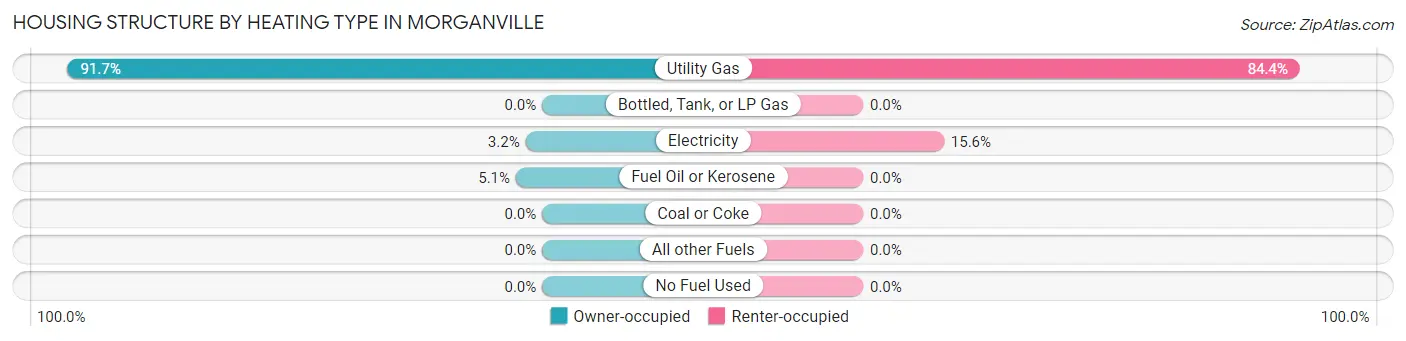
| Heating Type | Owner-occupied | Renter-occupied |
| Utility Gas | 1,627 (91.7%) | 173 (84.4%) |
| Bottled, Tank, or LP Gas | 0 (0.0%) | 0 (0.0%) |
| Electricity | 57 (3.2%) | 32 (15.6%) |
| Fuel Oil or Kerosene | 90 (5.1%) | 0 (0.0%) |
| Coal or Coke | 0 (0.0%) | 0 (0.0%) |
| All other Fuels | 0 (0.0%) | 0 (0.0%) |
| No Fuel Used | 0 (0.0%) | 0 (0.0%) |
| Total | 1,774 (100.0%) | 205 (100.0%) |
Household Vehicle Usage in Morganville
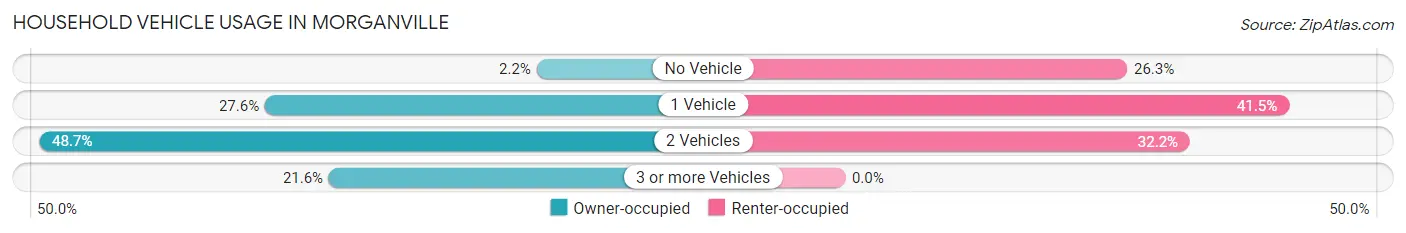
| Vehicles per Household | Owner-occupied | Renter-occupied |
| No Vehicle | 39 (2.2%) | 54 (26.3%) |
| 1 Vehicle | 489 (27.6%) | 85 (41.5%) |
| 2 Vehicles | 863 (48.6%) | 66 (32.2%) |
| 3 or more Vehicles | 383 (21.6%) | 0 (0.0%) |
| Total | 1,774 (100.0%) | 205 (100.0%) |
Real Estate & Mortgages in Morganville
Real Estate and Mortgage Overview in Morganville
| Characteristic | Without Mortgage | With Mortgage |
| Housing Units | 684 | 1,090 |
| Median Property Value | $391,000 | $643,200 |
| Median Household Income | $109,592 | $633 |
| Monthly Housing Costs | $1,325 | $740 |
| Real Estate Taxes | $9,399 | $17 |
Property Value by Mortgage Status in Morganville
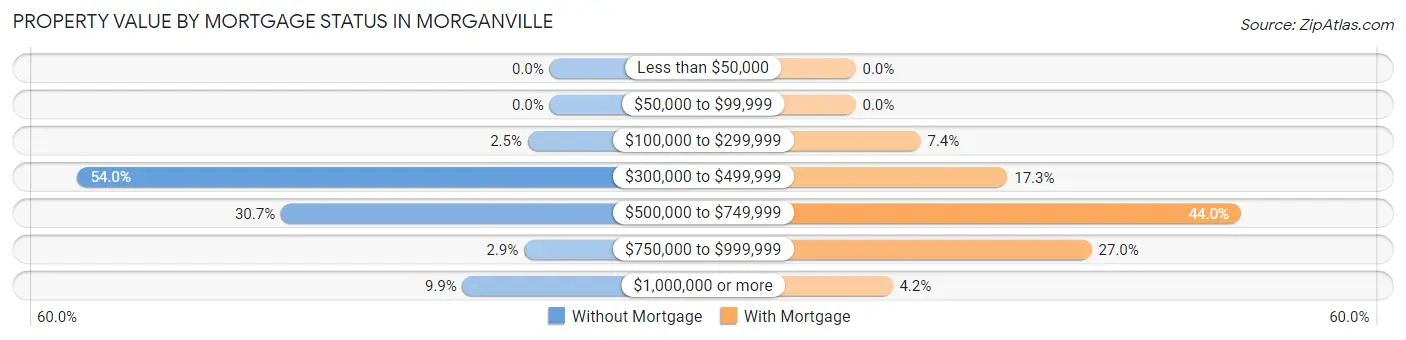
| Property Value | Without Mortgage | With Mortgage |
| Less than $50,000 | 0 (0.0%) | 0 (0.0%) |
| $50,000 to $99,999 | 0 (0.0%) | 0 (0.0%) |
| $100,000 to $299,999 | 17 (2.5%) | 81 (7.4%) |
| $300,000 to $499,999 | 369 (53.9%) | 189 (17.3%) |
| $500,000 to $749,999 | 210 (30.7%) | 480 (44.0%) |
| $750,000 to $999,999 | 20 (2.9%) | 294 (27.0%) |
| $1,000,000 or more | 68 (9.9%) | 46 (4.2%) |
| Total | 684 (100.0%) | 1,090 (100.0%) |
Household Income by Mortgage Status in Morganville
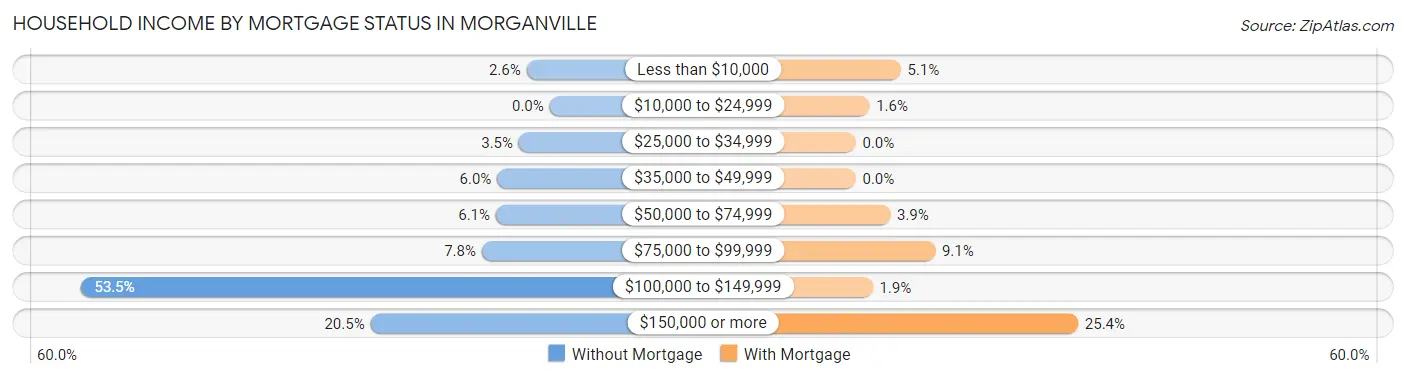
| Household Income | Without Mortgage | With Mortgage |
| Less than $10,000 | 18 (2.6%) | 56 (5.1%) |
| $10,000 to $24,999 | 0 (0.0%) | 17 (1.6%) |
| $25,000 to $34,999 | 24 (3.5%) | 0 (0.0%) |
| $35,000 to $49,999 | 41 (6.0%) | 0 (0.0%) |
| $50,000 to $74,999 | 42 (6.1%) | 43 (3.9%) |
| $75,000 to $99,999 | 53 (7.7%) | 99 (9.1%) |
| $100,000 to $149,999 | 366 (53.5%) | 21 (1.9%) |
| $150,000 or more | 140 (20.5%) | 277 (25.4%) |
| Total | 684 (100.0%) | 1,090 (100.0%) |
Property Value to Household Income Ratio in Morganville
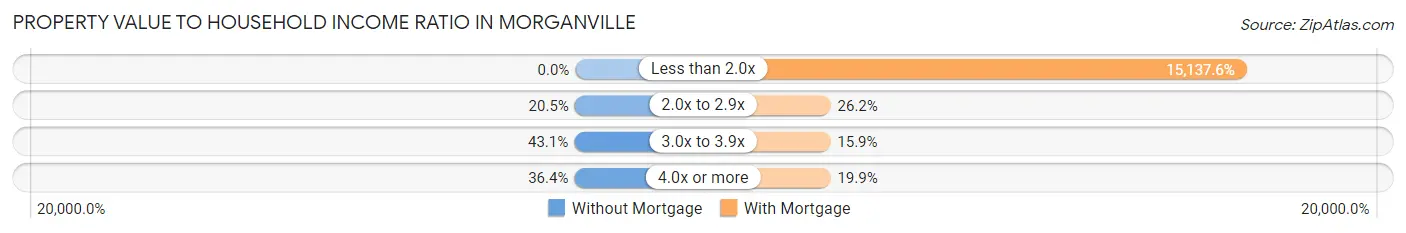
| Value-to-Income Ratio | Without Mortgage | With Mortgage |
| Less than 2.0x | 0 (0.0%) | 165,000 (15,137.6%) |
| 2.0x to 2.9x | 140 (20.5%) | 285 (26.2%) |
| 3.0x to 3.9x | 295 (43.1%) | 173 (15.9%) |
| 4.0x or more | 249 (36.4%) | 217 (19.9%) |
| Total | 684 (100.0%) | 1,090 (100.0%) |
Real Estate Taxes by Mortgage Status in Morganville
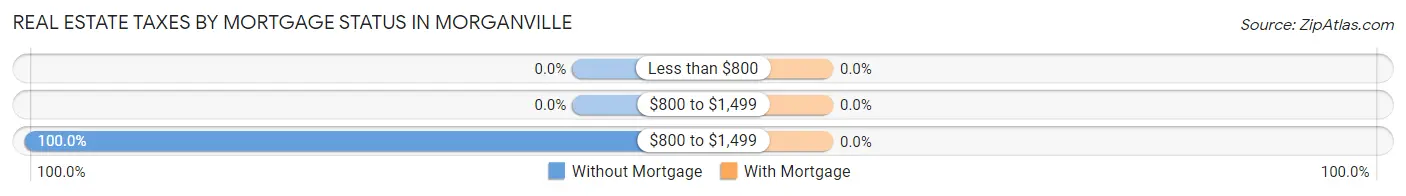
| Property Taxes | Without Mortgage | With Mortgage |
| Less than $800 | 0 (0.0%) | 0 (0.0%) |
| $800 to $1,499 | 0 (0.0%) | 0 (0.0%) |
| $800 to $1,499 | 684 (100.0%) | 0 (0.0%) |
| Total | 684 (100.0%) | 1,090 (100.0%) |
Health & Disability in Morganville
Health Insurance Coverage by Age in Morganville
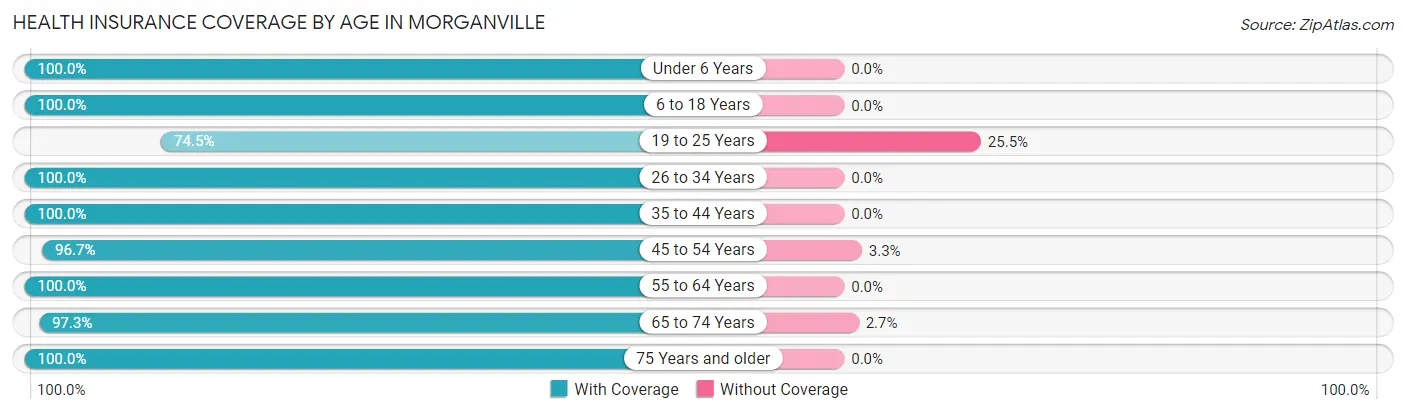
| Age Bracket | With Coverage | Without Coverage |
| Under 6 Years | 261 (100.0%) | 0 (0.0%) |
| 6 to 18 Years | 827 (100.0%) | 0 (0.0%) |
| 19 to 25 Years | 357 (74.5%) | 122 (25.5%) |
| 26 to 34 Years | 381 (100.0%) | 0 (0.0%) |
| 35 to 44 Years | 612 (100.0%) | 0 (0.0%) |
| 45 to 54 Years | 708 (96.7%) | 24 (3.3%) |
| 55 to 64 Years | 846 (100.0%) | 0 (0.0%) |
| 65 to 74 Years | 650 (97.3%) | 18 (2.7%) |
| 75 Years and older | 340 (100.0%) | 0 (0.0%) |
| Total | 4,982 (96.8%) | 164 (3.2%) |
Health Insurance Coverage by Citizenship Status in Morganville
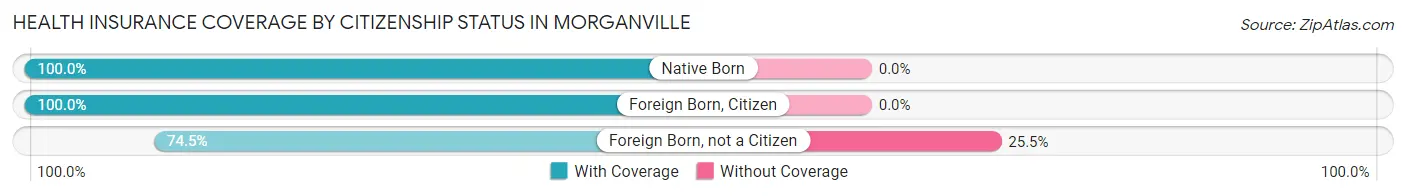
| Citizenship Status | With Coverage | Without Coverage |
| Native Born | 261 (100.0%) | 0 (0.0%) |
| Foreign Born, Citizen | 827 (100.0%) | 0 (0.0%) |
| Foreign Born, not a Citizen | 357 (74.5%) | 122 (25.5%) |
Health Insurance Coverage by Household Income in Morganville
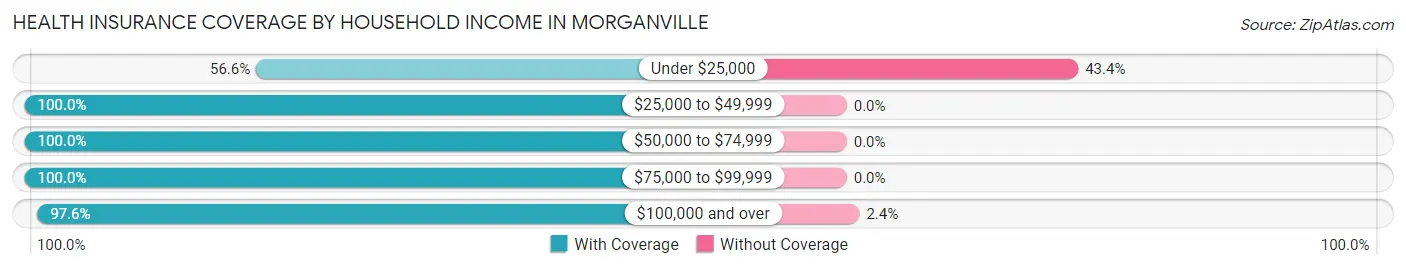
| Household Income | With Coverage | Without Coverage |
| Under $25,000 | 81 (56.6%) | 62 (43.4%) |
| $25,000 to $49,999 | 190 (100.0%) | 0 (0.0%) |
| $50,000 to $74,999 | 219 (100.0%) | 0 (0.0%) |
| $75,000 to $99,999 | 294 (100.0%) | 0 (0.0%) |
| $100,000 and over | 4,198 (97.6%) | 102 (2.4%) |
Public vs Private Health Insurance Coverage by Age in Morganville
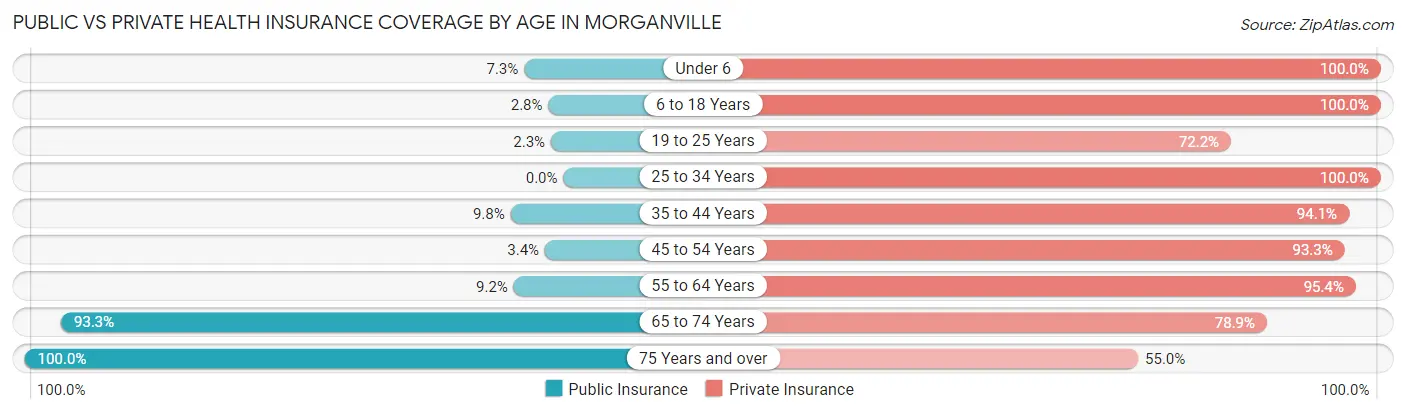
| Age Bracket | Public Insurance | Private Insurance |
| Under 6 | 19 (7.3%) | 261 (100.0%) |
| 6 to 18 Years | 23 (2.8%) | 827 (100.0%) |
| 19 to 25 Years | 11 (2.3%) | 346 (72.2%) |
| 25 to 34 Years | 0 (0.0%) | 381 (100.0%) |
| 35 to 44 Years | 60 (9.8%) | 576 (94.1%) |
| 45 to 54 Years | 25 (3.4%) | 683 (93.3%) |
| 55 to 64 Years | 78 (9.2%) | 807 (95.4%) |
| 65 to 74 Years | 623 (93.3%) | 527 (78.9%) |
| 75 Years and over | 340 (100.0%) | 187 (55.0%) |
| Total | 1,179 (22.9%) | 4,595 (89.3%) |
Disability Status by Sex by Age in Morganville
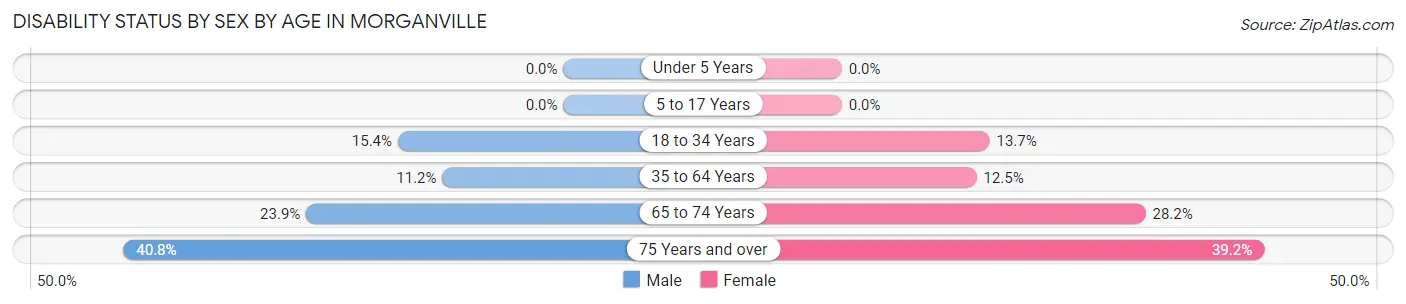
| Age Bracket | Male | Female |
| Under 5 Years | 0 (0.0%) | 0 (0.0%) |
| 5 to 17 Years | 0 (0.0%) | 0 (0.0%) |
| 18 to 34 Years | 59 (15.4%) | 72 (13.7%) |
| 35 to 64 Years | 130 (11.2%) | 129 (12.5%) |
| 65 to 74 Years | 79 (23.9%) | 95 (28.2%) |
| 75 Years and over | 69 (40.8%) | 67 (39.2%) |
Disability Class by Sex by Age in Morganville
Disability Class: Hearing Difficulty
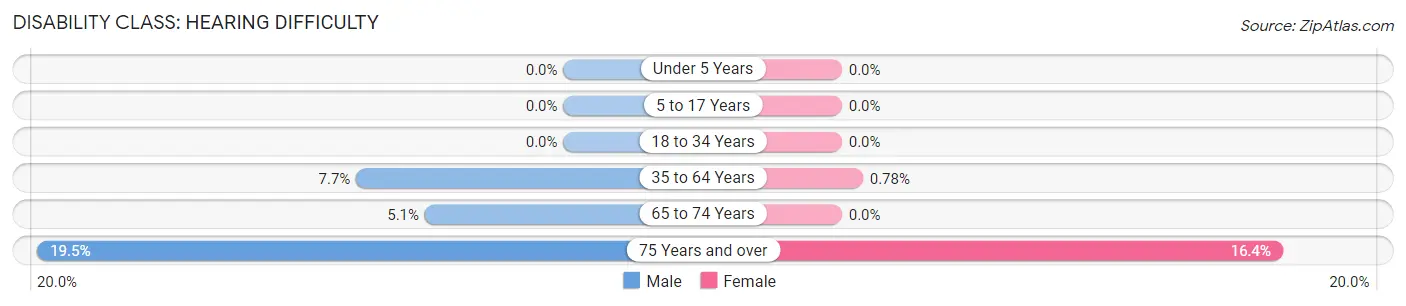
| Age Bracket | Male | Female |
| Under 5 Years | 0 (0.0%) | 0 (0.0%) |
| 5 to 17 Years | 0 (0.0%) | 0 (0.0%) |
| 18 to 34 Years | 0 (0.0%) | 0 (0.0%) |
| 35 to 64 Years | 89 (7.7%) | 8 (0.8%) |
| 65 to 74 Years | 17 (5.1%) | 0 (0.0%) |
| 75 Years and over | 33 (19.5%) | 28 (16.4%) |
Disability Class: Vision Difficulty
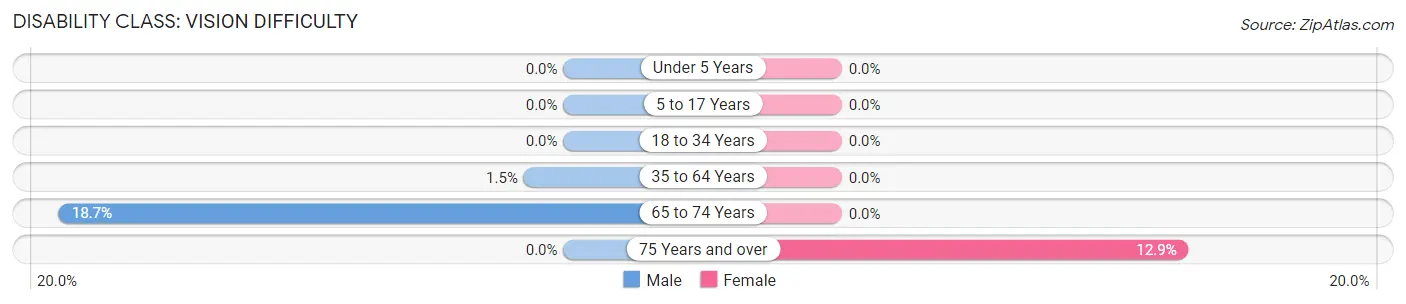
| Age Bracket | Male | Female |
| Under 5 Years | 0 (0.0%) | 0 (0.0%) |
| 5 to 17 Years | 0 (0.0%) | 0 (0.0%) |
| 18 to 34 Years | 0 (0.0%) | 0 (0.0%) |
| 35 to 64 Years | 17 (1.5%) | 0 (0.0%) |
| 65 to 74 Years | 62 (18.7%) | 0 (0.0%) |
| 75 Years and over | 0 (0.0%) | 22 (12.9%) |
Disability Class: Cognitive Difficulty
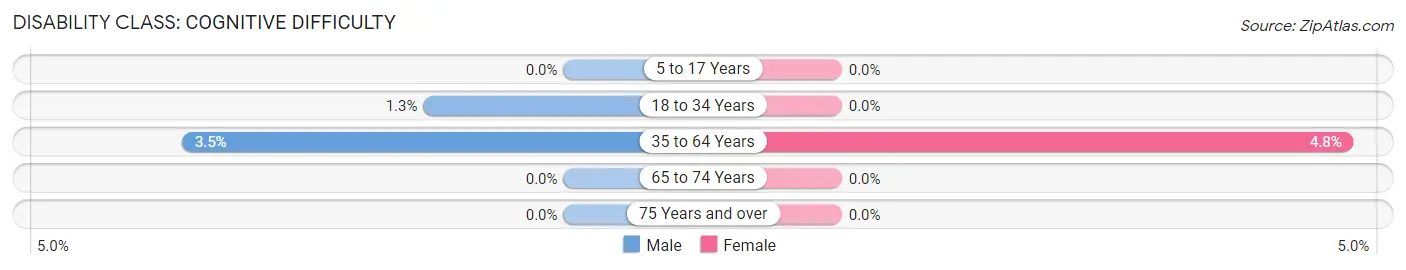
| Age Bracket | Male | Female |
| 5 to 17 Years | 0 (0.0%) | 0 (0.0%) |
| 18 to 34 Years | 5 (1.3%) | 0 (0.0%) |
| 35 to 64 Years | 41 (3.5%) | 49 (4.8%) |
| 65 to 74 Years | 0 (0.0%) | 0 (0.0%) |
| 75 Years and over | 0 (0.0%) | 0 (0.0%) |
Disability Class: Ambulatory Difficulty
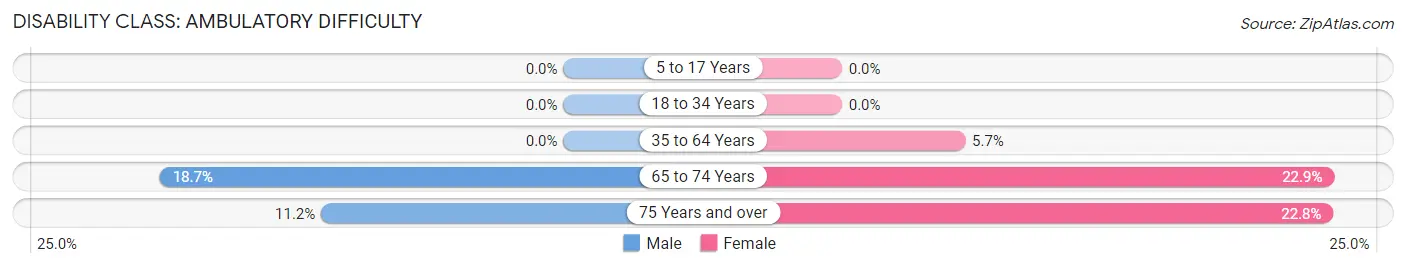
| Age Bracket | Male | Female |
| 5 to 17 Years | 0 (0.0%) | 0 (0.0%) |
| 18 to 34 Years | 0 (0.0%) | 0 (0.0%) |
| 35 to 64 Years | 0 (0.0%) | 59 (5.7%) |
| 65 to 74 Years | 62 (18.7%) | 77 (22.9%) |
| 75 Years and over | 19 (11.2%) | 39 (22.8%) |
Disability Class: Self-Care Difficulty
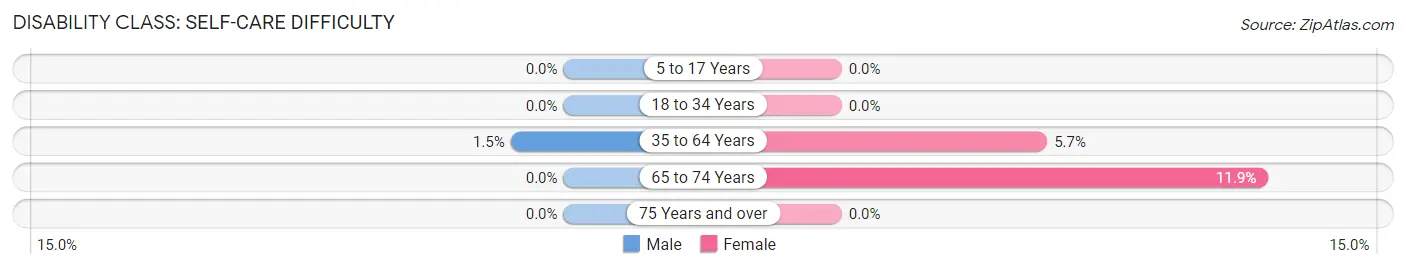
| Age Bracket | Male | Female |
| 5 to 17 Years | 0 (0.0%) | 0 (0.0%) |
| 18 to 34 Years | 0 (0.0%) | 0 (0.0%) |
| 35 to 64 Years | 17 (1.5%) | 59 (5.7%) |
| 65 to 74 Years | 0 (0.0%) | 40 (11.9%) |
| 75 Years and over | 0 (0.0%) | 0 (0.0%) |
Technology Access in Morganville
Computing Device Access in Morganville
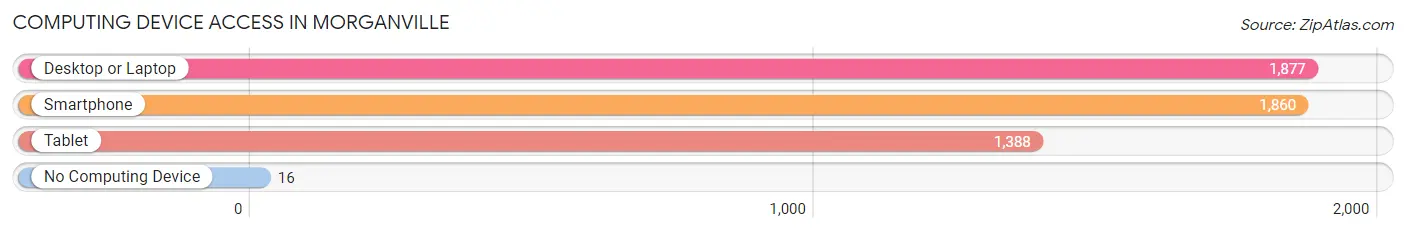
| Device Type | # Households | % Households |
| Desktop or Laptop | 1,877 | 94.9% |
| Smartphone | 1,860 | 94.0% |
| Tablet | 1,388 | 70.1% |
| No Computing Device | 16 | 0.8% |
| Total | 1,979 | 100.0% |
Internet Access in Morganville
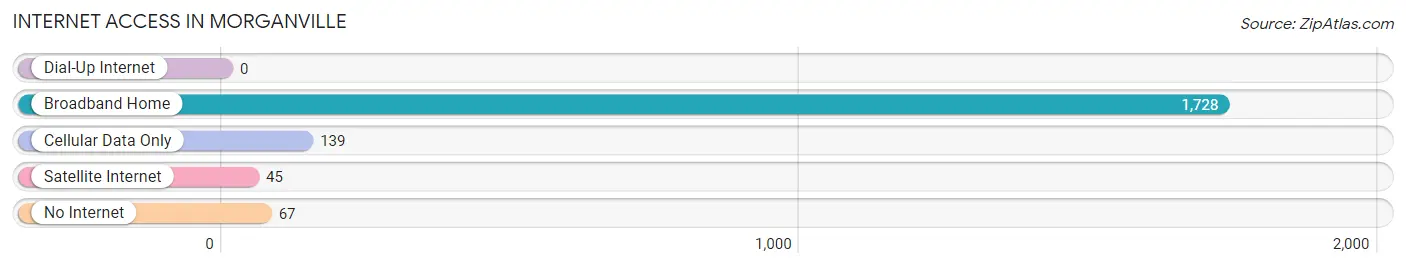
| Internet Type | # Households | % Households |
| Dial-Up Internet | 0 | 0.0% |
| Broadband Home | 1,728 | 87.3% |
| Cellular Data Only | 139 | 7.0% |
| Satellite Internet | 45 | 2.3% |
| No Internet | 67 | 3.4% |
| Total | 1,979 | 100.0% |
Morganville Summary
History
The history of Morganville, New Jersey dates back to the early 1700s when the area was first settled by Dutch and English settlers. The area was originally known as “Morgansville” and was part of the larger Monmouth County. In 1845, the area was officially incorporated as the Township of Morganville.
The town was named after the Morgan family, who were among the first settlers in the area. The Morgan family owned a large amount of land in the area and were influential in the development of the town. The family also owned a large amount of farmland, which was used to grow crops and raise livestock.
The town of Morganville was primarily an agricultural community for many years. The town was home to several farms, which produced a variety of crops such as corn, wheat, and hay. The town also had a number of small businesses, such as a general store, a blacksmith, and a post office.
In the late 1800s, the town began to experience a period of growth and development. The town was connected to the rest of the state by the Central Railroad of New Jersey, which allowed for easier transportation of goods and people. This period of growth also saw the development of several new businesses, such as a hotel, a bank, and a newspaper.
The town continued to grow and develop throughout the 20th century. In the 1950s, the town was home to a number of factories, which provided employment for many of the town’s residents. The town also experienced a period of suburbanization in the 1960s and 1970s, as many of the town’s residents moved to the suburbs.
Today, Morganville is a small, suburban town located in Monmouth County. The town is home to a number of businesses, including a shopping center, a movie theater, and several restaurants. The town is also home to a number of parks and recreational facilities, which provide residents with a variety of activities.
Geography
Morganville is located in Monmouth County, New Jersey. The town is situated in the northern part of the county, near the Raritan Bay. The town is bordered by Marlboro Township to the north, Manalapan Township to the east, Freehold Township to the south, and Old Bridge Township to the west.
The town covers an area of approximately 8.5 square miles and is home to a population of approximately 8,000 people. The town is located approximately 40 miles south of New York City and is easily accessible by car or public transportation.
The town is located in a predominantly flat area, with some rolling hills in the northern part of the town. The town is home to a number of parks and recreational facilities, including a golf course, a swimming pool, and several parks.
Economy
The economy of Morganville is primarily based on the service industry. The town is home to a number of businesses, including restaurants, retail stores, and professional services. The town is also home to a number of manufacturing companies, which produce a variety of products.
The town is also home to a number of corporate headquarters, including the headquarters of the pharmaceutical company, Merck & Co. The town is also home to a number of financial institutions, including banks and investment firms.
Demographics
As of the 2010 census, the population of Morganville was 8,000 people. The town has a population that is predominantly white (83.3%), with a small percentage of African Americans (7.2%), Asians (3.2%), and Hispanics (2.7%). The median household income in the town is $90,000, and the median home value is $400,000.
The town is home to a number of religious institutions, including churches, synagogues, and mosques. The town is also home to a number of educational institutions, including a public school system and a number of private schools.
Conclusion
Morganville, New Jersey is a small, suburban town located in Monmouth County. The town has a long history, dating back to the early 1700s when it was first settled by Dutch and English settlers. The town has experienced a period of growth and development throughout the 20th century, and today is home to a number of businesses, corporate headquarters, and financial institutions. The town is also home to a population that is predominantly white, with a small percentage of African Americans, Asians, and Hispanics. The town is home to a number of religious institutions, educational institutions, and recreational facilities, which provide residents with a variety of activities.
Common Questions
What is Per Capita Income in Morganville?
Per Capita income in Morganville is $71,523.
What is the Median Family Income in Morganville?
Median Family Income in Morganville is $160,304.
What is the Median Household income in Morganville?
Median Household Income in Morganville is $129,521.
What is Income or Wage Gap in Morganville?
Income or Wage Gap in Morganville is 69.6%.
Women in Morganville earn 30.4 cents for every dollar earned by a man.
What is Inequality or Gini Index in Morganville?
Inequality or Gini Index in Morganville is 0.41.
What is the Total Population of Morganville?
Total Population of Morganville is 5,153.
What is the Total Male Population of Morganville?
Total Male Population of Morganville is 2,457.
What is the Total Female Population of Morganville?
Total Female Population of Morganville is 2,696.
What is the Ratio of Males per 100 Females in Morganville?
There are 91.14 Males per 100 Females in Morganville.
What is the Ratio of Females per 100 Males in Morganville?
There are 109.73 Females per 100 Males in Morganville.
What is the Median Population Age in Morganville?
Median Population Age in Morganville is 45.1 Years.
What is the Average Family Size in Morganville
Average Family Size in Morganville is 3.1 People.
What is the Average Household Size in Morganville
Average Household Size in Morganville is 2.6 People.
How Large is the Labor Force in Morganville?
There are 2,723 People in the Labor Forcein in Morganville.
What is the Percentage of People in the Labor Force in Morganville?
63.3% of People are in the Labor Force in Morganville.
What is the Unemployment Rate in Morganville?
Unemployment Rate in Morganville is 1.8%.