Somerville borough, NJ Map & Demographics
Somerville borough Overview
$51,250
PER CAPITA INCOME
$114,946
AVG FAMILY INCOME
$102,423
AVG HOUSEHOLD INCOME
11.8%
WAGE / INCOME GAP [ % ]
88.2¢/ $1
WAGE / INCOME GAP [ $ ]
0.40
INEQUALITY / GINI INDEX
12,467
TOTAL POPULATION
6,569
MALE POPULATION
5,898
FEMALE POPULATION
111.38
MALES / 100 FEMALES
89.79
FEMALES / 100 MALES
35.4
MEDIAN AGE
3.1
AVG FAMILY SIZE
2.4
AVG HOUSEHOLD SIZE
7,621
LABOR FORCE [ PEOPLE ]
73.6%
PERCENT IN LABOR FORCE
3.6%
UNEMPLOYMENT RATE
Income in Somerville borough
Income Overview in Somerville borough
Per Capita Income in Somerville borough is $51,250, while median incomes of families and households are $114,946 and $102,423 respectively.
| Characteristic | Number | Measure |
| Per Capita Income | 12,467 | $51,250 |
| Median Family Income | 2,907 | $114,946 |
| Mean Family Income | 2,907 | $133,963 |
| Median Household Income | 5,135 | $102,423 |
| Mean Household Income | 5,135 | $120,481 |
| Income Deficit | 2,907 | $0 |
| Wage / Income Gap (%) | 12,467 | 11.78% |
| Wage / Income Gap ($) | 12,467 | 88.22¢ per $1 |
| Gini / Inequality Index | 12,467 | 0.40 |
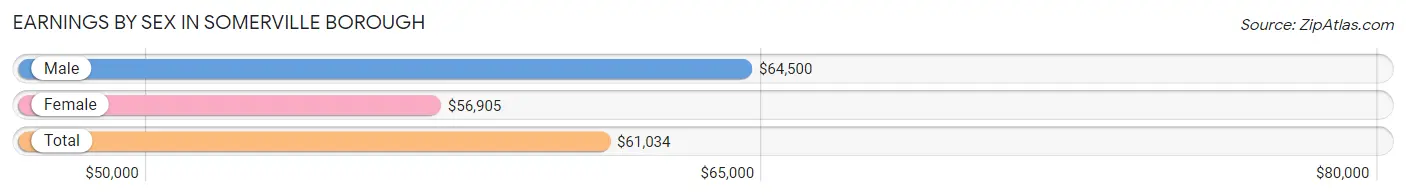
Earnings by Sex in Somerville borough
Average Earnings in Somerville borough are $61,034, $64,500 for men and $56,905 for women, a difference of 11.8%.
| Sex | Number | Average Earnings |
| Male | 4,450 (58.2%) | $64,500 |
| Female | 3,192 (41.8%) | $56,905 |
| Total | 7,642 (100.0%) | $61,034 |
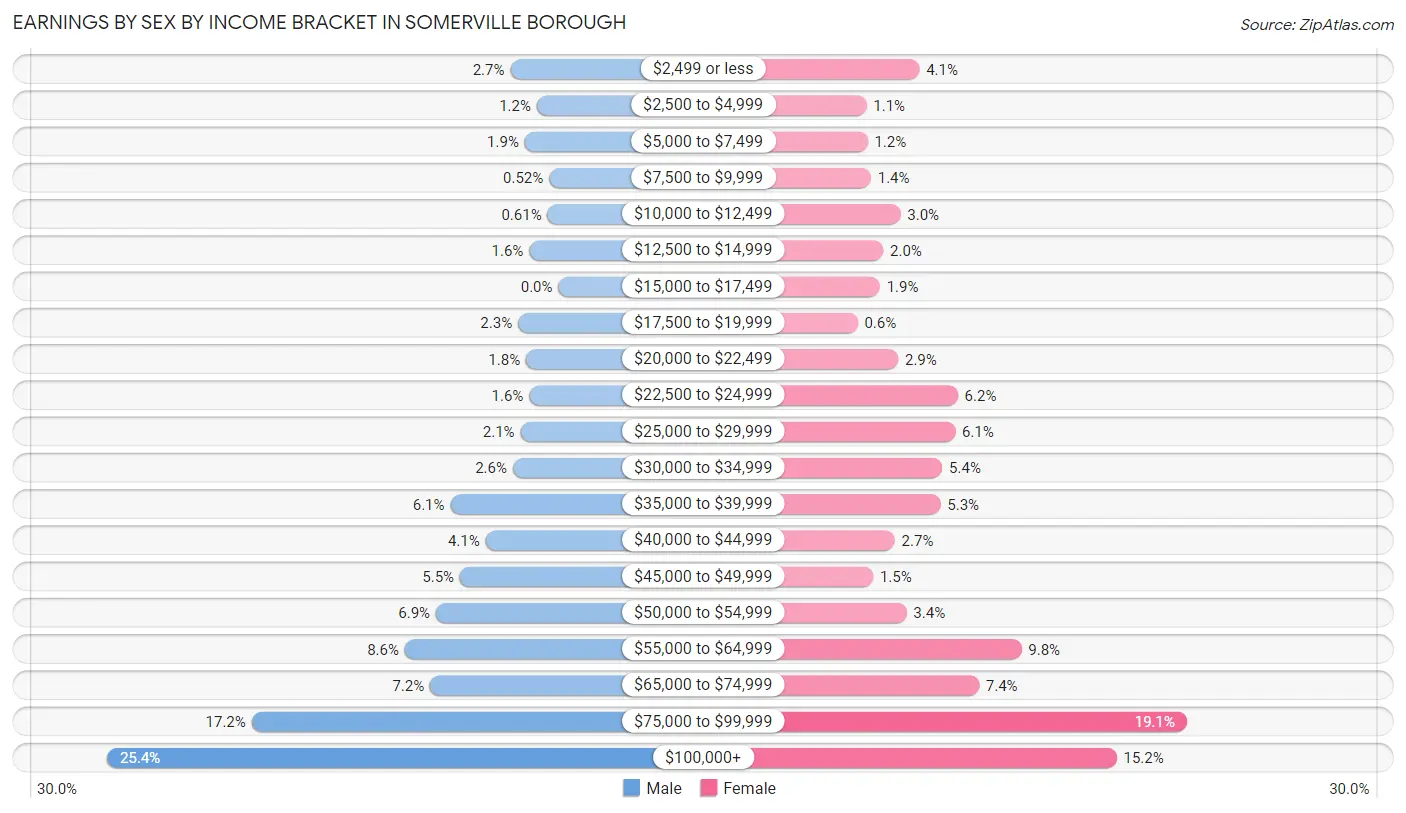
Earnings by Sex by Income Bracket in Somerville borough
The most common earnings brackets in Somerville borough are $100,000+ for men (1,129 | 25.4%) and $75,000 to $99,999 for women (610 | 19.1%).
| Income | Male | Female |
| $2,499 or less | 120 (2.7%) | 130 (4.1%) |
| $2,500 to $4,999 | 54 (1.2%) | 35 (1.1%) |
| $5,000 to $7,499 | 84 (1.9%) | 37 (1.2%) |
| $7,500 to $9,999 | 23 (0.5%) | 43 (1.3%) |
| $10,000 to $12,499 | 27 (0.6%) | 96 (3.0%) |
| $12,500 to $14,999 | 73 (1.6%) | 65 (2.0%) |
| $15,000 to $17,499 | 0 (0.0%) | 59 (1.8%) |
| $17,500 to $19,999 | 101 (2.3%) | 19 (0.6%) |
| $20,000 to $22,499 | 81 (1.8%) | 92 (2.9%) |
| $22,500 to $24,999 | 73 (1.6%) | 199 (6.2%) |
| $25,000 to $29,999 | 95 (2.1%) | 194 (6.1%) |
| $30,000 to $34,999 | 114 (2.6%) | 171 (5.4%) |
| $35,000 to $39,999 | 270 (6.1%) | 168 (5.3%) |
| $40,000 to $44,999 | 182 (4.1%) | 86 (2.7%) |
| $45,000 to $49,999 | 246 (5.5%) | 47 (1.5%) |
| $50,000 to $54,999 | 306 (6.9%) | 107 (3.4%) |
| $55,000 to $64,999 | 384 (8.6%) | 313 (9.8%) |
| $65,000 to $74,999 | 321 (7.2%) | 237 (7.4%) |
| $75,000 to $99,999 | 767 (17.2%) | 610 (19.1%) |
| $100,000+ | 1,129 (25.4%) | 484 (15.2%) |
| Total | 4,450 (100.0%) | 3,192 (100.0%) |
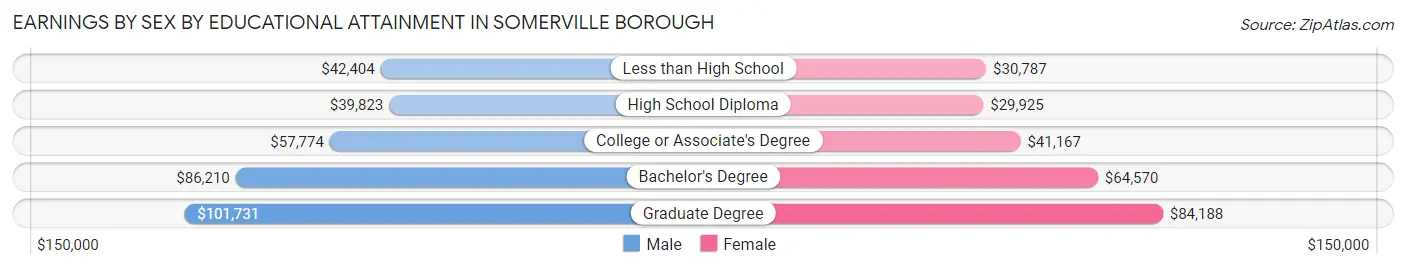
Earnings by Sex by Educational Attainment in Somerville borough
Average earnings in Somerville borough are $71,345 for men and $62,882 for women, a difference of 11.9%. Men with an educational attainment of graduate degree enjoy the highest average annual earnings of $101,731, while those with high school diploma education earn the least with $39,823. Women with an educational attainment of graduate degree earn the most with the average annual earnings of $84,188, while those with high school diploma education have the smallest earnings of $29,925.
| Educational Attainment | Male Income | Female Income |
| Less than High School | $42,404 | $30,787 |
| High School Diploma | $39,823 | $29,925 |
| College or Associate's Degree | $57,774 | $41,167 |
| Bachelor's Degree | $86,210 | $64,570 |
| Graduate Degree | $101,731 | $84,188 |
| Total | $71,345 | $62,882 |
Family Income in Somerville borough
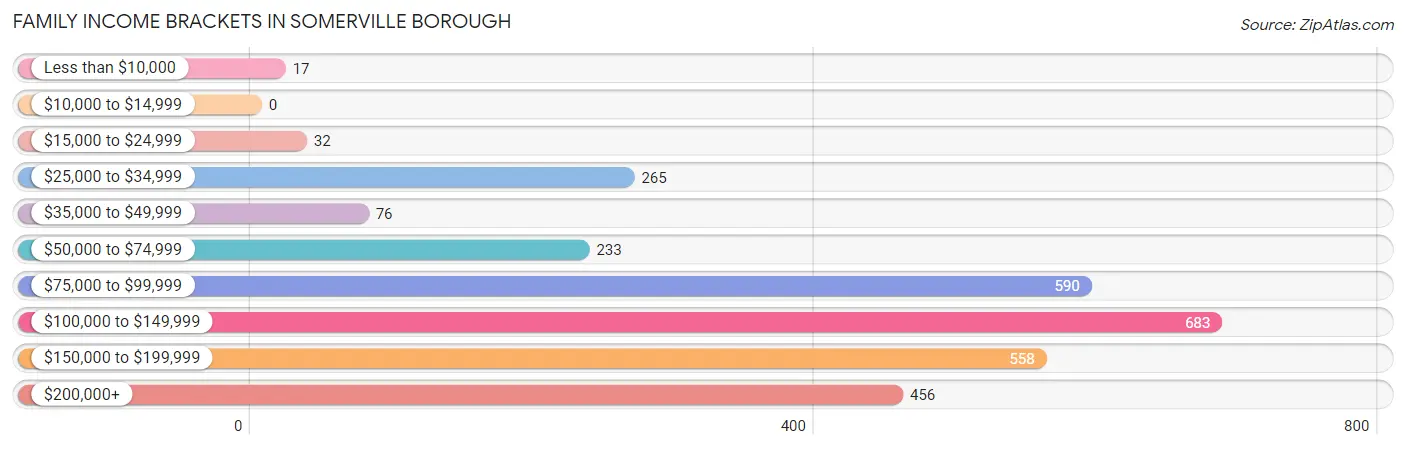
Family Income Brackets in Somerville borough
According to the Somerville borough family income data, there are 683 families falling into the $100,000 to $149,999 income range, which is the most common income bracket and makes up 23.5% of all families.
| Income Bracket | # Families | % Families |
| Less than $10,000 | 17 | 0.6% |
| $10,000 to $14,999 | 0 | 0.0% |
| $15,000 to $24,999 | 32 | 1.1% |
| $25,000 to $34,999 | 265 | 9.1% |
| $35,000 to $49,999 | 76 | 2.6% |
| $50,000 to $74,999 | 233 | 8.0% |
| $75,000 to $99,999 | 590 | 20.3% |
| $100,000 to $149,999 | 683 | 23.5% |
| $150,000 to $199,999 | 558 | 19.2% |
| $200,000+ | 456 | 15.7% |
Family Income by Famaliy Size in Somerville borough
4-person families (525 | 18.1%) account for the highest median family income in Somerville borough with $167,083 per family, while 2-person families (1,352 | 46.5%) have the highest median income of $46,704 per family member.
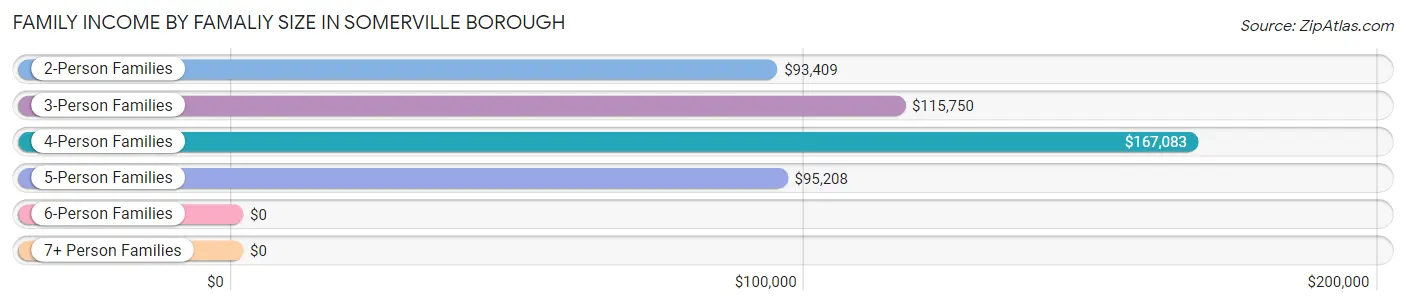
| Income Bracket | # Families | Median Income |
| 2-Person Families | 1,352 (46.5%) | $93,409 |
| 3-Person Families | 724 (24.9%) | $115,750 |
| 4-Person Families | 525 (18.1%) | $167,083 |
| 5-Person Families | 277 (9.5%) | $95,208 |
| 6-Person Families | 19 (0.6%) | $0 |
| 7+ Person Families | 10 (0.3%) | $0 |
| Total | 2,907 (100.0%) | $114,946 |
Family Income by Number of Earners in Somerville borough
The median family income in Somerville borough is $114,946, with families comprising 3+ earners (372) having the highest median family income of $182,273, while families with no earners (330) have the lowest median family income of $34,353, accounting for 12.8% and 11.4% of families, respectively.
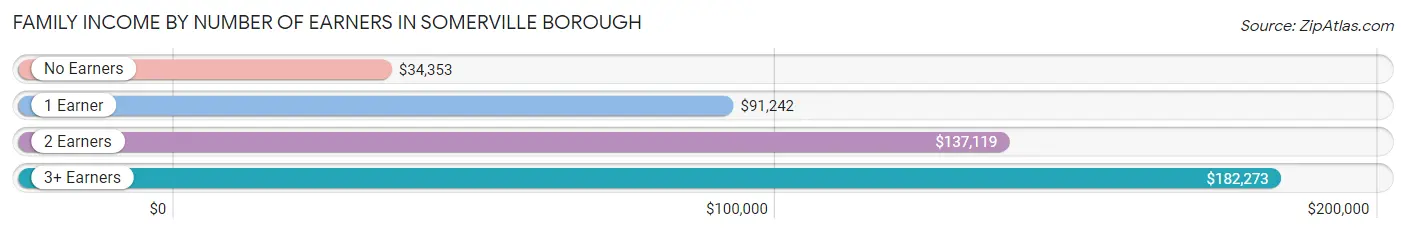
| Number of Earners | # Families | Median Income |
| No Earners | 330 (11.4%) | $34,353 |
| 1 Earner | 861 (29.6%) | $91,242 |
| 2 Earners | 1,344 (46.2%) | $137,119 |
| 3+ Earners | 372 (12.8%) | $182,273 |
| Total | 2,907 (100.0%) | $114,946 |
Household Income in Somerville borough
Household Income Brackets in Somerville borough
With 1,145 households falling in the category, the $100,000 to $149,999 income range is the most frequent in Somerville borough, accounting for 22.3% of all households. In contrast, only 108 households (2.1%) fall into the $10,000 to $14,999 income bracket, making it the least populous group.
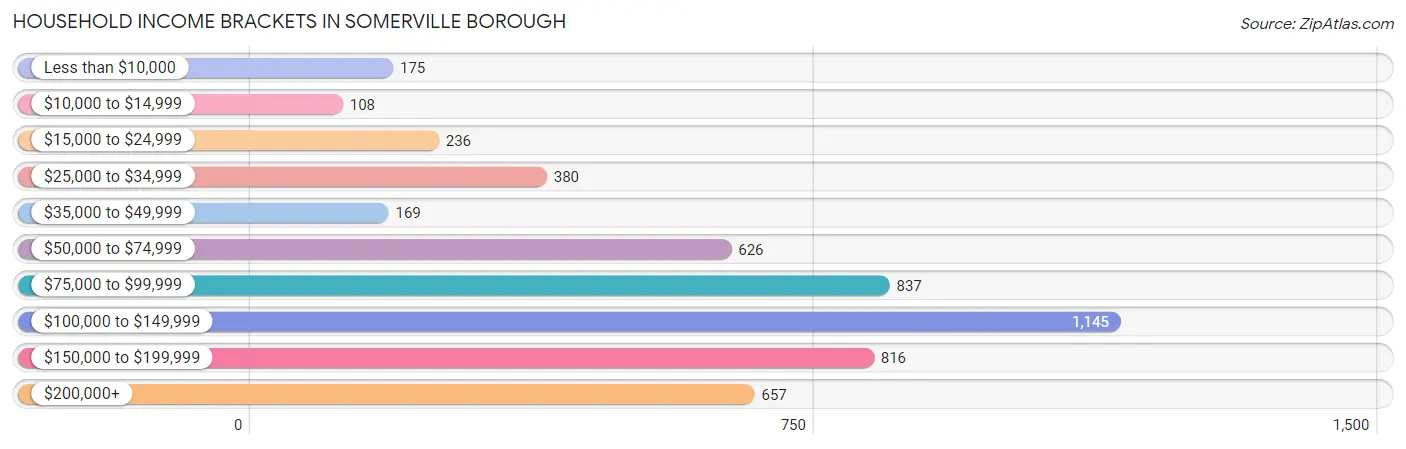
| Income Bracket | # Households | % Households |
| Less than $10,000 | 175 | 3.4% |
| $10,000 to $14,999 | 108 | 2.1% |
| $15,000 to $24,999 | 236 | 4.6% |
| $25,000 to $34,999 | 380 | 7.4% |
| $35,000 to $49,999 | 169 | 3.3% |
| $50,000 to $74,999 | 626 | 12.2% |
| $75,000 to $99,999 | 837 | 16.3% |
| $100,000 to $149,999 | 1,145 | 22.3% |
| $150,000 to $199,999 | 816 | 15.9% |
| $200,000+ | 657 | 12.8% |
Household Income by Householder Age in Somerville borough
The median household income in Somerville borough is $102,423, with the highest median household income of $116,375 found in the 25 to 44 years age bracket for the primary householder. A total of 2,432 households (47.4%) fall into this category. Meanwhile, the 15 to 24 years age bracket for the primary householder has the lowest median household income of $0, with 218 households (4.3%) in this group.
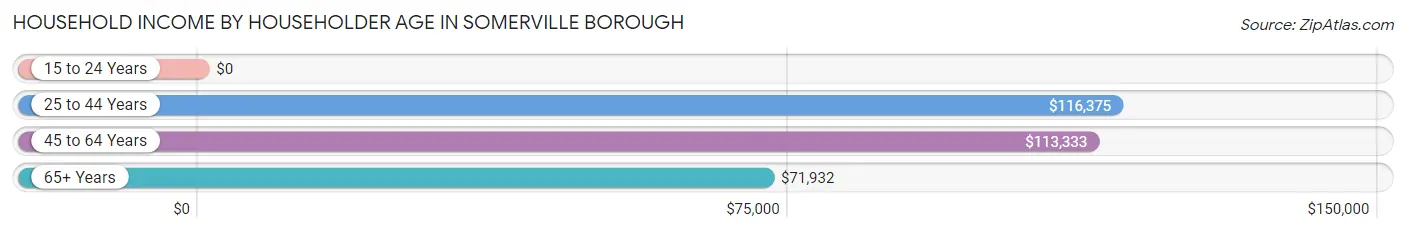
| Income Bracket | # Households | Median Income |
| 15 to 24 Years | 218 (4.3%) | $0 |
| 25 to 44 Years | 2,432 (47.4%) | $116,375 |
| 45 to 64 Years | 1,470 (28.6%) | $113,333 |
| 65+ Years | 1,015 (19.8%) | $71,932 |
| Total | 5,135 (100.0%) | $102,423 |
Poverty in Somerville borough
Income Below Poverty by Sex and Age in Somerville borough
With 2.7% poverty level for males and 6.7% for females among the residents of Somerville borough, 15 year old males and 55 to 64 year old females are the most vulnerable to poverty, with 9 males (13.4%) and 91 females (16.1%) in their respective age groups living below the poverty level.
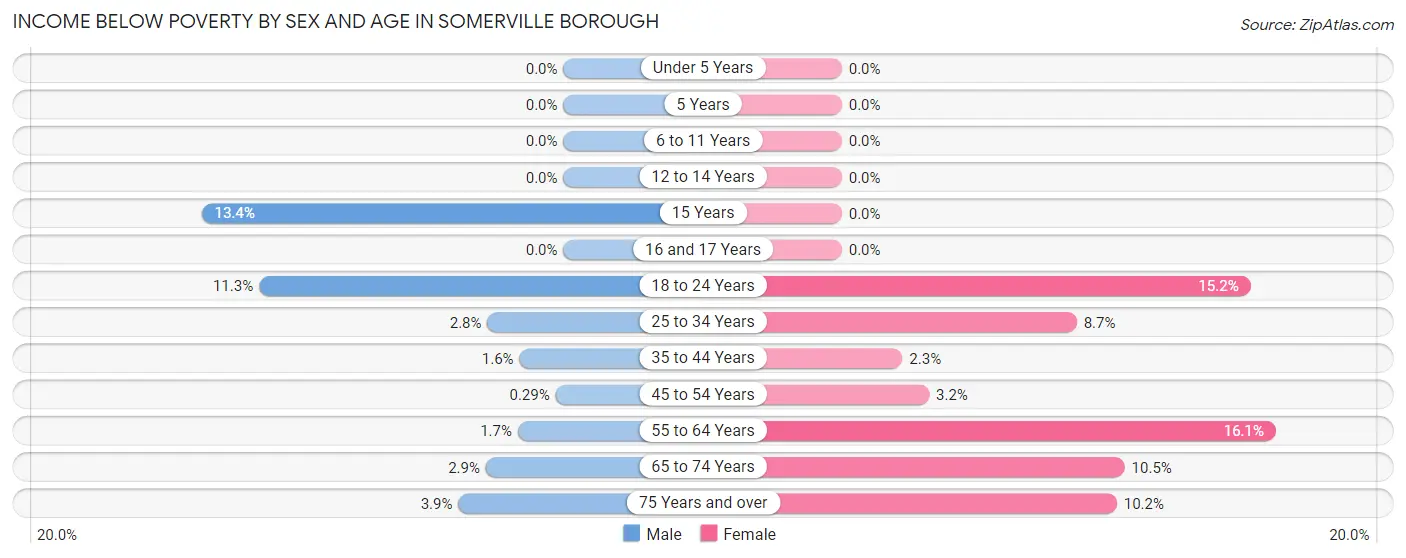
| Age Bracket | Male | Female |
| Under 5 Years | 0 (0.0%) | 0 (0.0%) |
| 5 Years | 0 (0.0%) | 0 (0.0%) |
| 6 to 11 Years | 0 (0.0%) | 0 (0.0%) |
| 12 to 14 Years | 0 (0.0%) | 0 (0.0%) |
| 15 Years | 9 (13.4%) | 0 (0.0%) |
| 16 and 17 Years | 0 (0.0%) | 0 (0.0%) |
| 18 to 24 Years | 68 (11.3%) | 44 (15.2%) |
| 25 to 34 Years | 38 (2.8%) | 123 (8.7%) |
| 35 to 44 Years | 18 (1.6%) | 20 (2.2%) |
| 45 to 54 Years | 2 (0.3%) | 19 (3.2%) |
| 55 to 64 Years | 13 (1.7%) | 91 (16.1%) |
| 65 to 74 Years | 11 (2.9%) | 38 (10.5%) |
| 75 Years and over | 12 (3.9%) | 59 (10.2%) |
| Total | 171 (2.7%) | 394 (6.7%) |
Income Above Poverty by Sex and Age in Somerville borough
According to the poverty statistics in Somerville borough, males aged under 5 years and females aged under 5 years are the age groups that are most secure financially, with 100.0% of males and 100.0% of females in these age groups living above the poverty line.
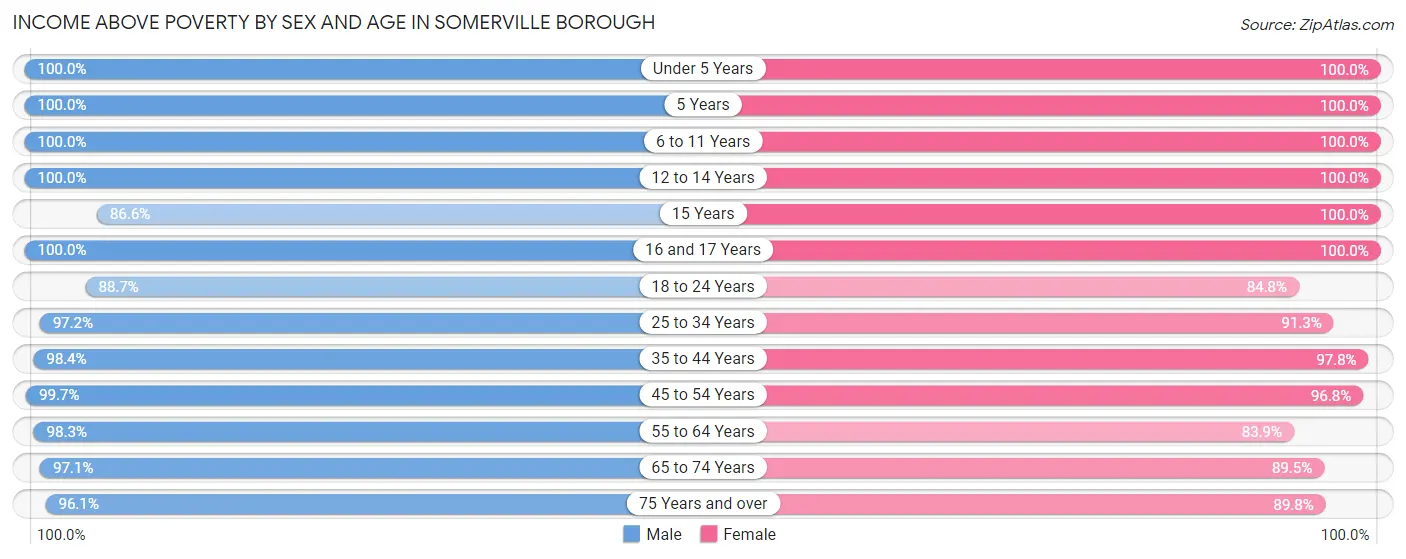
| Age Bracket | Male | Female |
| Under 5 Years | 327 (100.0%) | 534 (100.0%) |
| 5 Years | 65 (100.0%) | 43 (100.0%) |
| 6 to 11 Years | 282 (100.0%) | 258 (100.0%) |
| 12 to 14 Years | 348 (100.0%) | 144 (100.0%) |
| 15 Years | 58 (86.6%) | 36 (100.0%) |
| 16 and 17 Years | 130 (100.0%) | 161 (100.0%) |
| 18 to 24 Years | 534 (88.7%) | 246 (84.8%) |
| 25 to 34 Years | 1,308 (97.2%) | 1,288 (91.3%) |
| 35 to 44 Years | 1,088 (98.4%) | 869 (97.8%) |
| 45 to 54 Years | 694 (99.7%) | 568 (96.8%) |
| 55 to 64 Years | 757 (98.3%) | 474 (83.9%) |
| 65 to 74 Years | 371 (97.1%) | 324 (89.5%) |
| 75 Years and over | 296 (96.1%) | 519 (89.8%) |
| Total | 6,258 (97.3%) | 5,464 (93.3%) |
Income Below Poverty Among Married-Couple Families in Somerville borough
The poverty statistics for married-couple families in Somerville borough show that 0.5% or 11 of the total 2,220 families live below the poverty line. Families with no children have the highest poverty rate of 0.9%, comprising of 11 families. On the other hand, families with 1 or 2 children have the lowest poverty rate of 0.0%, which includes 0 families.
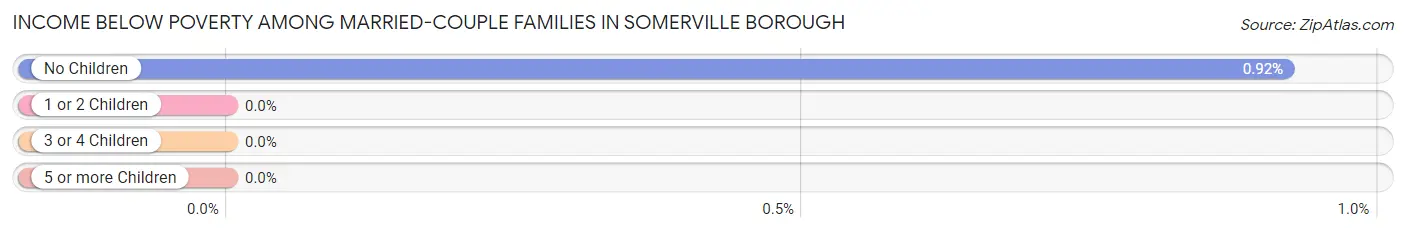
| Children | Above Poverty | Below Poverty |
| No Children | 1,179 (99.1%) | 11 (0.9%) |
| 1 or 2 Children | 875 (100.0%) | 0 (0.0%) |
| 3 or 4 Children | 145 (100.0%) | 0 (0.0%) |
| 5 or more Children | 10 (100.0%) | 0 (0.0%) |
| Total | 2,209 (99.5%) | 11 (0.5%) |
Income Below Poverty Among Single-Parent Households in Somerville borough
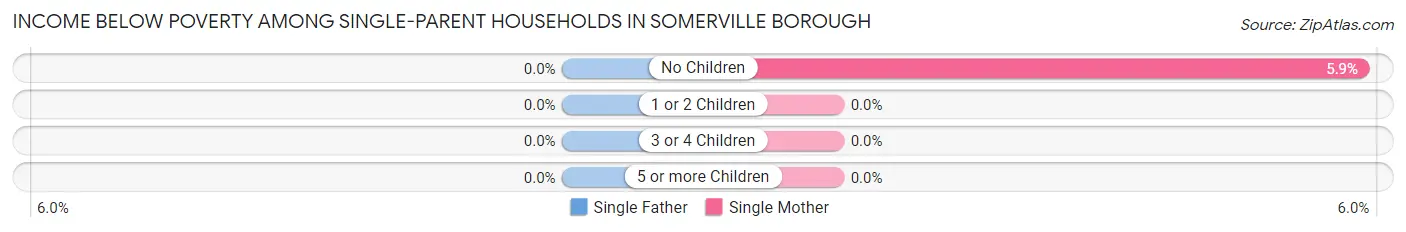
| Children | Single Father | Single Mother |
| No Children | 0 (0.0%) | 17 (5.9%) |
| 1 or 2 Children | 0 (0.0%) | 0 (0.0%) |
| 3 or 4 Children | 0 (0.0%) | 0 (0.0%) |
| 5 or more Children | 0 (0.0%) | 0 (0.0%) |
| Total | 0 (0.0%) | 17 (3.0%) |
Income Below Poverty Among Married-Couple vs Single-Parent Households in Somerville borough
The poverty data for Somerville borough shows that 11 of the married-couple family households (0.5%) and 17 of the single-parent households (2.5%) are living below the poverty level. Within the married-couple family households, those with no children have the highest poverty rate, with 11 households (0.9%) falling below the poverty line. Among the single-parent households, those with no children have the highest poverty rate, with 17 household (5.2%) living below poverty.
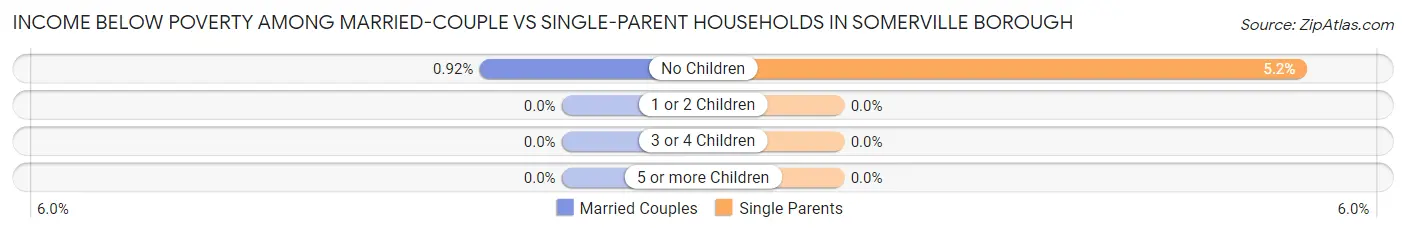
| Children | Married-Couple Families | Single-Parent Households |
| No Children | 11 (0.9%) | 17 (5.2%) |
| 1 or 2 Children | 0 (0.0%) | 0 (0.0%) |
| 3 or 4 Children | 0 (0.0%) | 0 (0.0%) |
| 5 or more Children | 0 (0.0%) | 0 (0.0%) |
| Total | 11 (0.5%) | 17 (2.5%) |
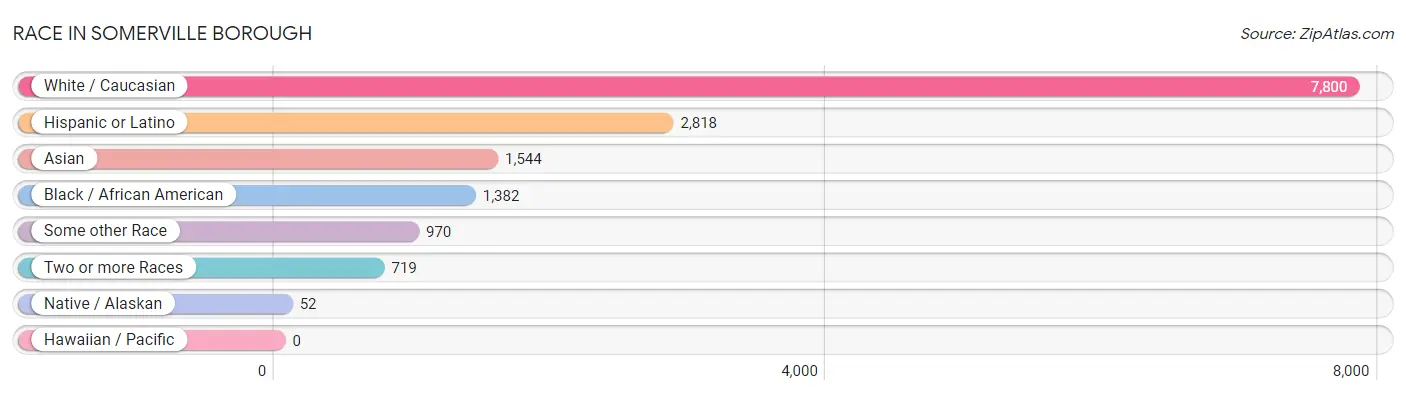
Race in Somerville borough
The most populous races in Somerville borough are White / Caucasian (7,800 | 62.6%), Hispanic or Latino (2,818 | 22.6%), and Asian (1,544 | 12.4%).
| Race | # Population | % Population |
| Asian | 1,544 | 12.4% |
| Black / African American | 1,382 | 11.1% |
| Hawaiian / Pacific | 0 | 0.0% |
| Hispanic or Latino | 2,818 | 22.6% |
| Native / Alaskan | 52 | 0.4% |
| White / Caucasian | 7,800 | 62.6% |
| Two or more Races | 719 | 5.8% |
| Some other Race | 970 | 7.8% |
| Total | 12,467 | 100.0% |
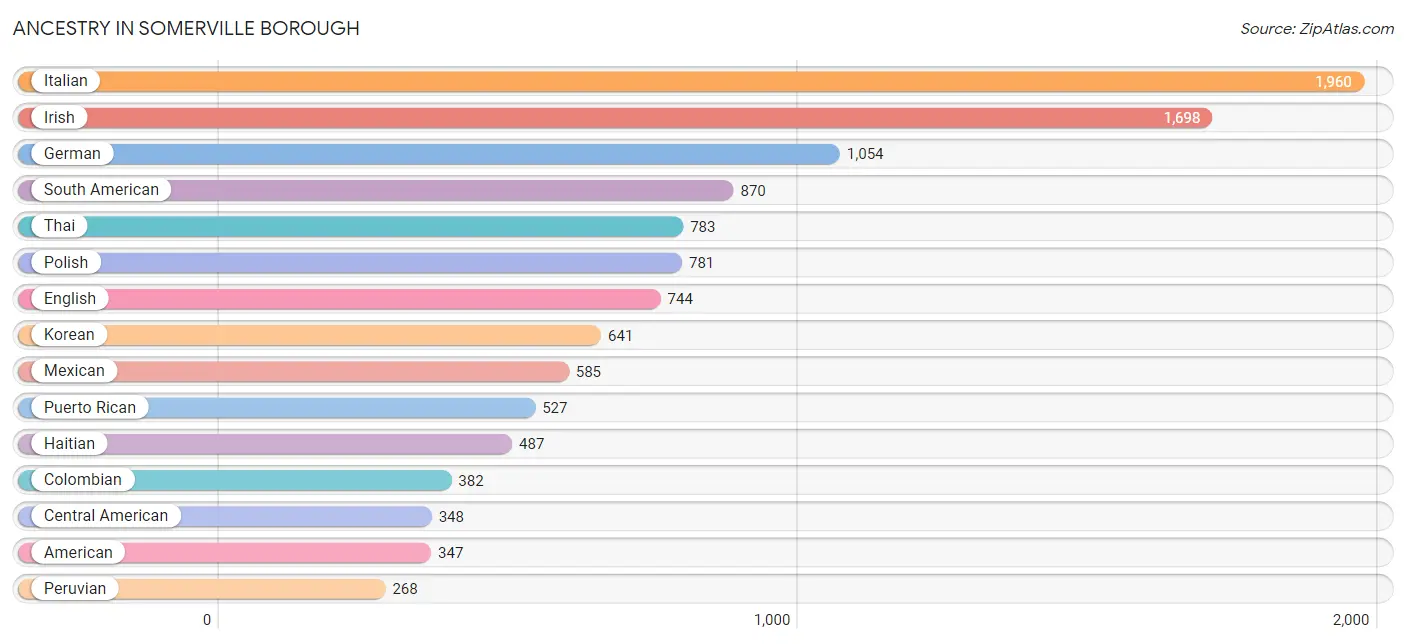
Ancestry in Somerville borough
The most populous ancestries reported in Somerville borough are Italian (1,960 | 15.7%), Irish (1,698 | 13.6%), German (1,054 | 8.5%), South American (870 | 7.0%), and Thai (783 | 6.3%), together accounting for 51.0% of all Somerville borough residents.
| Ancestry | # Population | % Population |
| Alsatian | 11 | 0.1% |
| American | 347 | 2.8% |
| Arab | 62 | 0.5% |
| Argentinean | 21 | 0.2% |
| Armenian | 23 | 0.2% |
| Austrian | 75 | 0.6% |
| Belgian | 13 | 0.1% |
| Bhutanese | 22 | 0.2% |
| Bolivian | 8 | 0.1% |
| Brazilian | 41 | 0.3% |
| British | 91 | 0.7% |
| Burmese | 27 | 0.2% |
| Cambodian | 20 | 0.2% |
| Central American | 348 | 2.8% |
| Central American Indian | 17 | 0.1% |
| Chilean | 17 | 0.1% |
| Choctaw | 13 | 0.1% |
| Colombian | 382 | 3.1% |
| Costa Rican | 168 | 1.3% |
| Cuban | 30 | 0.2% |
| Czech | 15 | 0.1% |
| Czechoslovakian | 20 | 0.2% |
| Danish | 15 | 0.1% |
| Dominican | 48 | 0.4% |
| Dutch | 151 | 1.2% |
| Eastern European | 7 | 0.1% |
| Ecuadorian | 174 | 1.4% |
| English | 744 | 6.0% |
| European | 32 | 0.3% |
| Finnish | 56 | 0.4% |
| French | 91 | 0.7% |
| French Canadian | 88 | 0.7% |
| German | 1,054 | 8.5% |
| Greek | 115 | 0.9% |
| Guatemalan | 61 | 0.5% |
| Guyanese | 82 | 0.7% |
| Haitian | 487 | 3.9% |
| Honduran | 82 | 0.7% |
| Hungarian | 127 | 1.0% |
| Indian (Asian) | 74 | 0.6% |
| Irish | 1,698 | 13.6% |
| Iroquois | 9 | 0.1% |
| Italian | 1,960 | 15.7% |
| Jamaican | 75 | 0.6% |
| Kenyan | 26 | 0.2% |
| Korean | 641 | 5.1% |
| Laotian | 1 | 0.0% |
| Lebanese | 46 | 0.4% |
| Mexican | 585 | 4.7% |
| Nigerian | 51 | 0.4% |
| Northern European | 14 | 0.1% |
| Norwegian | 21 | 0.2% |
| Pakistani | 67 | 0.5% |
| Pennsylvania German | 12 | 0.1% |
| Peruvian | 268 | 2.1% |
| Polish | 781 | 6.3% |
| Portuguese | 88 | 0.7% |
| Puerto Rican | 527 | 4.2% |
| Romanian | 42 | 0.3% |
| Russian | 229 | 1.8% |
| Salvadoran | 37 | 0.3% |
| Scotch-Irish | 16 | 0.1% |
| Scottish | 109 | 0.9% |
| Slovak | 80 | 0.6% |
| South American | 870 | 7.0% |
| South American Indian | 27 | 0.2% |
| Spaniard | 6 | 0.1% |
| Spanish | 138 | 1.1% |
| Sri Lankan | 28 | 0.2% |
| Subsaharan African | 77 | 0.6% |
| Swedish | 118 | 0.9% |
| Swiss | 38 | 0.3% |
| Syrian | 16 | 0.1% |
| Thai | 783 | 6.3% |
| Trinidadian and Tobagonian | 64 | 0.5% |
| Turkish | 32 | 0.3% |
| Ukrainian | 76 | 0.6% |
| Welsh | 10 | 0.1% | View All 78 Rows |
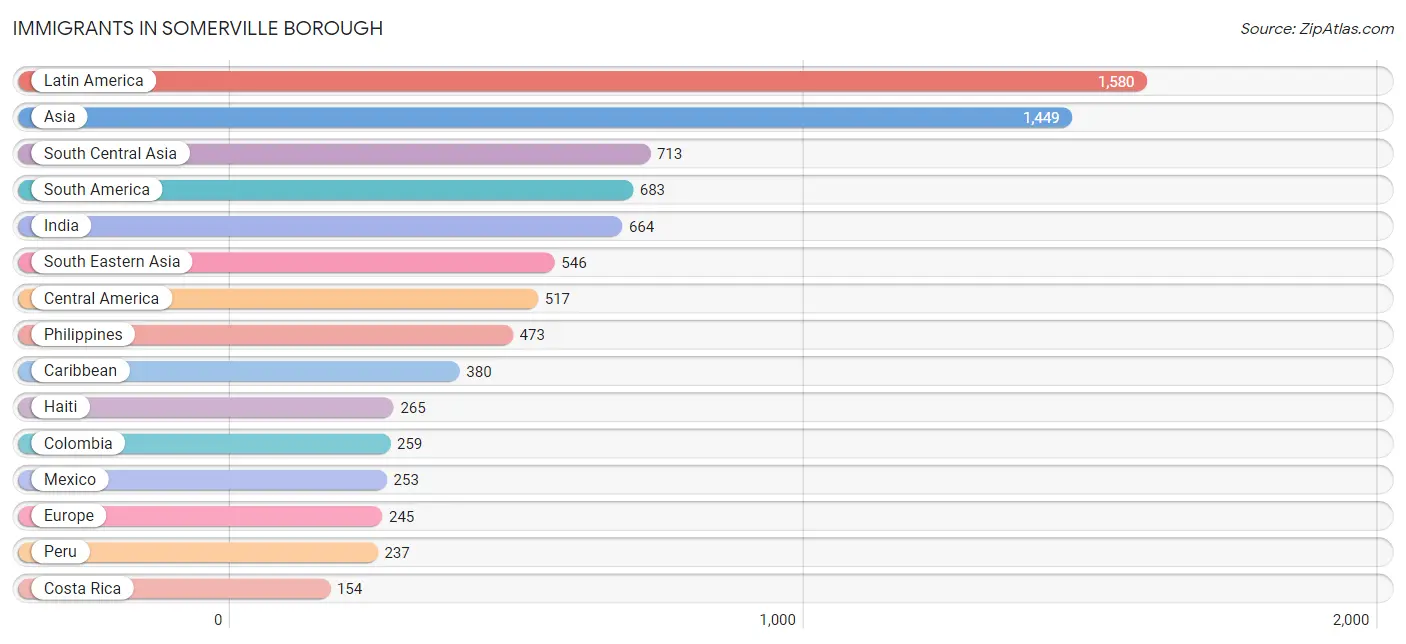
Immigrants in Somerville borough
The most numerous immigrant groups reported in Somerville borough came from Latin America (1,580 | 12.7%), Asia (1,449 | 11.6%), South Central Asia (713 | 5.7%), South America (683 | 5.5%), and India (664 | 5.3%), together accounting for 40.8% of all Somerville borough residents.
| Immigration Origin | # Population | % Population |
| Afghanistan | 18 | 0.1% |
| Africa | 52 | 0.4% |
| Argentina | 16 | 0.1% |
| Armenia | 12 | 0.1% |
| Asia | 1,449 | 11.6% |
| Australia | 23 | 0.2% |
| Bolivia | 8 | 0.1% |
| Brazil | 39 | 0.3% |
| Canada | 45 | 0.4% |
| Caribbean | 380 | 3.0% |
| Central America | 517 | 4.2% |
| Chile | 14 | 0.1% |
| China | 91 | 0.7% |
| Colombia | 259 | 2.1% |
| Costa Rica | 154 | 1.2% |
| Dominican Republic | 29 | 0.2% |
| Eastern Africa | 26 | 0.2% |
| Eastern Asia | 140 | 1.1% |
| Eastern Europe | 48 | 0.4% |
| Ecuador | 41 | 0.3% |
| El Salvador | 65 | 0.5% |
| England | 34 | 0.3% |
| Europe | 245 | 2.0% |
| Greece | 48 | 0.4% |
| Guatemala | 45 | 0.4% |
| Guyana | 25 | 0.2% |
| Haiti | 265 | 2.1% |
| Hong Kong | 21 | 0.2% |
| India | 664 | 5.3% |
| Indonesia | 1 | 0.0% |
| Ireland | 7 | 0.1% |
| Italy | 72 | 0.6% |
| Jamaica | 67 | 0.5% |
| Japan | 22 | 0.2% |
| Kenya | 26 | 0.2% |
| Korea | 27 | 0.2% |
| Latin America | 1,580 | 12.7% |
| Mexico | 253 | 2.0% |
| Netherlands | 21 | 0.2% |
| Nigeria | 26 | 0.2% |
| Northern Europe | 56 | 0.4% |
| Oceania | 23 | 0.2% |
| Peru | 237 | 1.9% |
| Philippines | 473 | 3.8% |
| Poland | 35 | 0.3% |
| Russia | 13 | 0.1% |
| South America | 683 | 5.5% |
| South Central Asia | 713 | 5.7% |
| South Eastern Asia | 546 | 4.4% |
| Southern Europe | 120 | 1.0% |
| Syria | 16 | 0.1% |
| Taiwan | 16 | 0.1% |
| Thailand | 44 | 0.4% |
| Trinidad and Tobago | 19 | 0.2% |
| Turkey | 22 | 0.2% |
| Uzbekistan | 31 | 0.3% |
| Vietnam | 28 | 0.2% |
| Western Africa | 26 | 0.2% |
| Western Asia | 50 | 0.4% |
| Western Europe | 21 | 0.2% | View All 60 Rows |
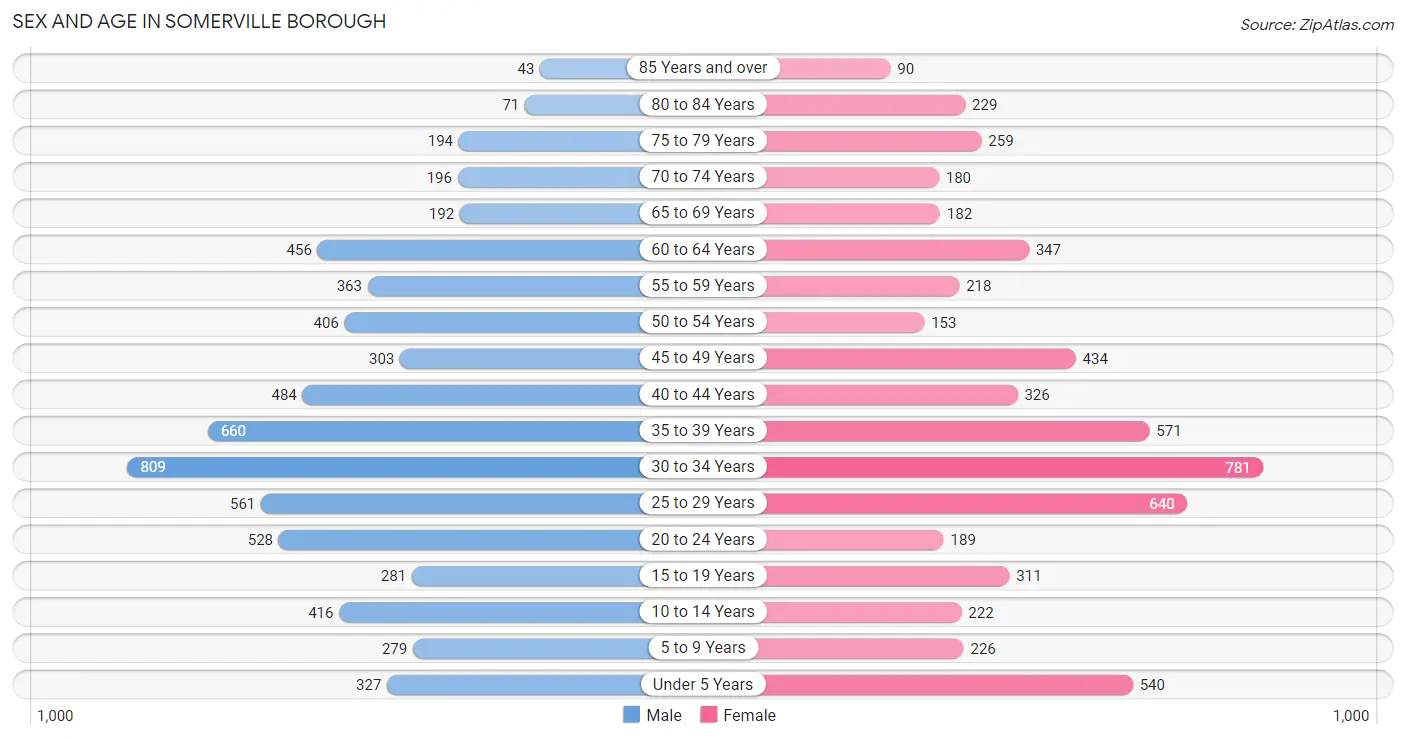
Sex and Age in Somerville borough
Sex and Age in Somerville borough
The most populous age groups in Somerville borough are 30 to 34 Years (809 | 12.3%) for men and 30 to 34 Years (781 | 13.2%) for women.
| Age Bracket | Male | Female |
| Under 5 Years | 327 (5.0%) | 540 (9.2%) |
| 5 to 9 Years | 279 (4.3%) | 226 (3.8%) |
| 10 to 14 Years | 416 (6.3%) | 222 (3.8%) |
| 15 to 19 Years | 281 (4.3%) | 311 (5.3%) |
| 20 to 24 Years | 528 (8.0%) | 189 (3.2%) |
| 25 to 29 Years | 561 (8.5%) | 640 (10.8%) |
| 30 to 34 Years | 809 (12.3%) | 781 (13.2%) |
| 35 to 39 Years | 660 (10.1%) | 571 (9.7%) |
| 40 to 44 Years | 484 (7.4%) | 326 (5.5%) |
| 45 to 49 Years | 303 (4.6%) | 434 (7.4%) |
| 50 to 54 Years | 406 (6.2%) | 153 (2.6%) |
| 55 to 59 Years | 363 (5.5%) | 218 (3.7%) |
| 60 to 64 Years | 456 (6.9%) | 347 (5.9%) |
| 65 to 69 Years | 192 (2.9%) | 182 (3.1%) |
| 70 to 74 Years | 196 (3.0%) | 180 (3.0%) |
| 75 to 79 Years | 194 (2.9%) | 259 (4.4%) |
| 80 to 84 Years | 71 (1.1%) | 229 (3.9%) |
| 85 Years and over | 43 (0.6%) | 90 (1.5%) |
| Total | 6,569 (100.0%) | 5,898 (100.0%) |
Families and Households in Somerville borough
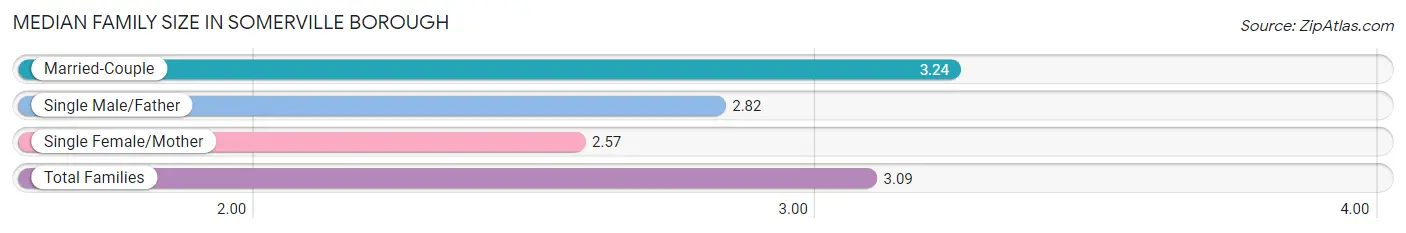
Median Family Size in Somerville borough
The median family size in Somerville borough is 3.09 persons per family, with married-couple families (2,220 | 76.4%) accounting for the largest median family size of 3.24 persons per family. On the other hand, single female/mother families (566 | 19.5%) represent the smallest median family size with 2.57 persons per family.
| Family Type | # Families | Family Size |
| Married-Couple | 2,220 (76.4%) | 3.24 |
| Single Male/Father | 121 (4.2%) | 2.82 |
| Single Female/Mother | 566 (19.5%) | 2.57 |
| Total Families | 2,907 (100.0%) | 3.09 |
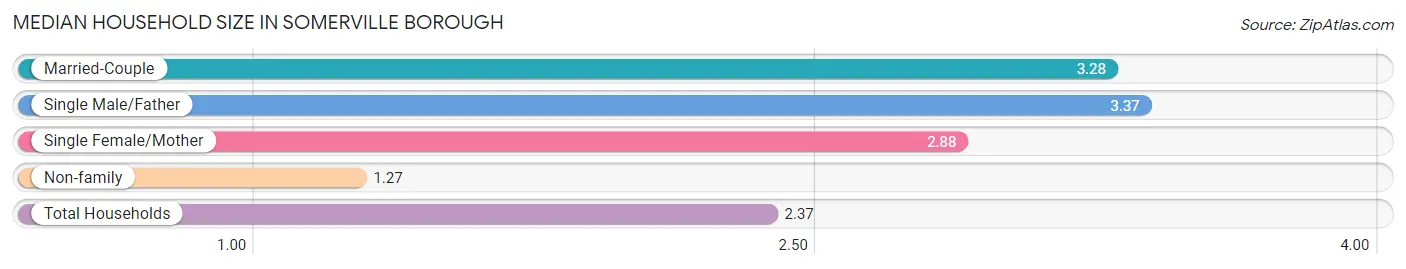
Median Household Size in Somerville borough
The median household size in Somerville borough is 2.37 persons per household, with single male/father households (121 | 2.4%) accounting for the largest median household size of 3.37 persons per household. non-family households (2,228 | 43.4%) represent the smallest median household size with 1.27 persons per household.
| Household Type | # Households | Household Size |
| Married-Couple | 2,220 (43.2%) | 3.28 |
| Single Male/Father | 121 (2.4%) | 3.37 |
| Single Female/Mother | 566 (11.0%) | 2.88 |
| Non-family | 2,228 (43.4%) | 1.27 |
| Total Households | 5,135 (100.0%) | 2.37 |
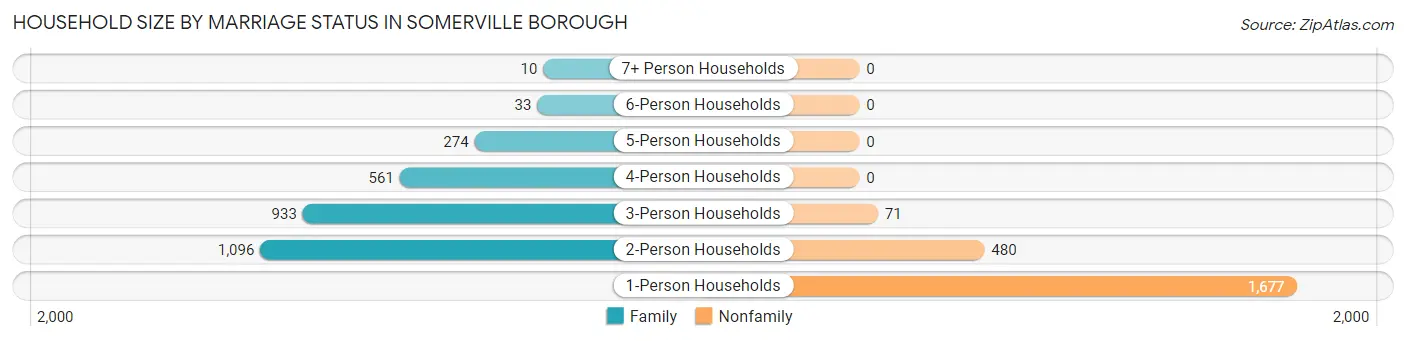
Household Size by Marriage Status in Somerville borough
Out of a total of 5,135 households in Somerville borough, 2,907 (56.6%) are family households, while 2,228 (43.4%) are nonfamily households. The most numerous type of family households are 2-person households, comprising 1,096, and the most common type of nonfamily households are 1-person households, comprising 1,677.
| Household Size | Family Households | Nonfamily Households |
| 1-Person Households | - | 1,677 (32.7%) |
| 2-Person Households | 1,096 (21.3%) | 480 (9.3%) |
| 3-Person Households | 933 (18.2%) | 71 (1.4%) |
| 4-Person Households | 561 (10.9%) | 0 (0.0%) |
| 5-Person Households | 274 (5.3%) | 0 (0.0%) |
| 6-Person Households | 33 (0.6%) | 0 (0.0%) |
| 7+ Person Households | 10 (0.2%) | 0 (0.0%) |
| Total | 2,907 (56.6%) | 2,228 (43.4%) |
Female Fertility in Somerville borough
Fertility by Age in Somerville borough
Average fertility rate in Somerville borough is 32.0 births per 1,000 women. Women in the age bracket of 20 to 34 years have the highest fertility rate with 47.0 births per 1,000 women. Women in the age bracket of 20 to 34 years acount for 72.1% of all women with births.
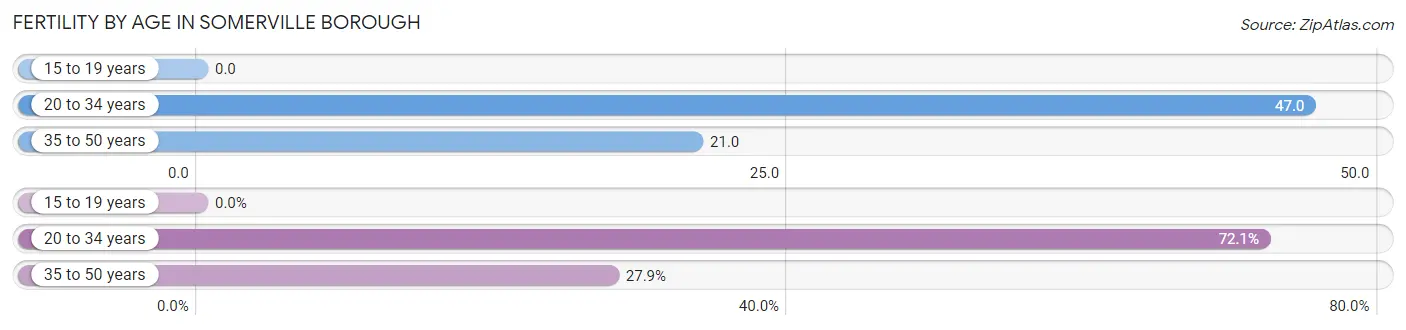
| Age Bracket | Women with Births | Births / 1,000 Women |
| 15 to 19 years | 0 (0.0%) | 0.0 |
| 20 to 34 years | 75 (72.1%) | 47.0 |
| 35 to 50 years | 29 (27.9%) | 21.0 |
| Total | 104 (100.0%) | 32.0 |
Fertility by Age by Marriage Status in Somerville borough
97.1% of women with births (104) in Somerville borough are married. The highest percentage of unmarried women with births falls into 35 to 50 years age bracket with 3.5% of them unmarried at the time of birth, while the lowest percentage of unmarried women with births belong to 20 to 34 years age bracket with 2.7% of them unmarried.
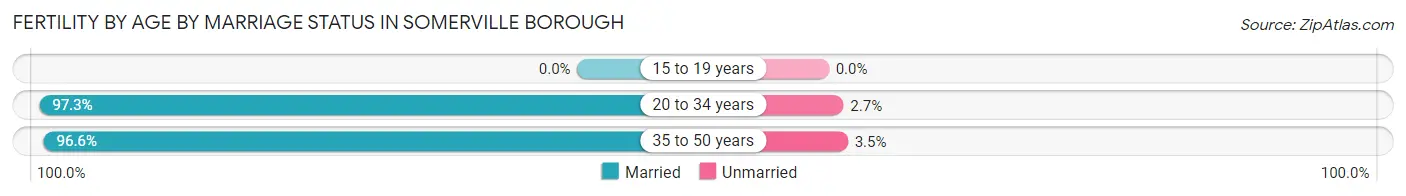
| Age Bracket | Married | Unmarried |
| 15 to 19 years | 0 (0.0%) | 0 (0.0%) |
| 20 to 34 years | 73 (97.3%) | 2 (2.7%) |
| 35 to 50 years | 28 (96.6%) | 1 (3.5%) |
| Total | 101 (97.1%) | 3 (2.9%) |
Fertility by Education in Somerville borough
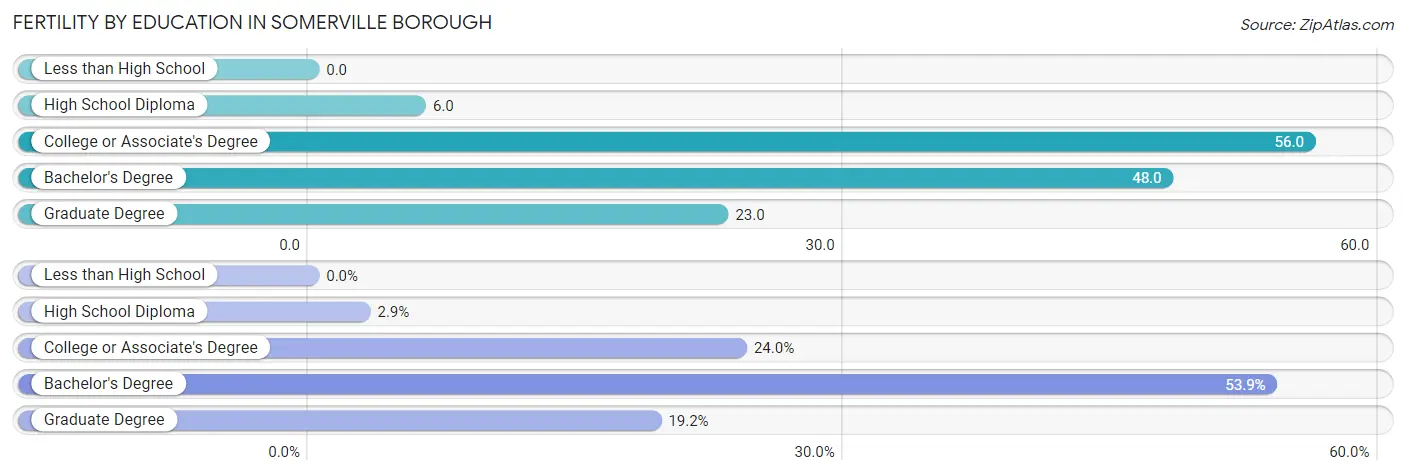
| Educational Attainment | Women with Births | Births / 1,000 Women |
| Less than High School | 0 (0.0%) | 0.0 |
| High School Diploma | 3 (2.9%) | 6.0 |
| College or Associate's Degree | 25 (24.0%) | 56.0 |
| Bachelor's Degree | 56 (53.8%) | 48.0 |
| Graduate Degree | 20 (19.2%) | 23.0 |
| Total | 104 (100.0%) | 32.0 |
Fertility by Education by Marriage Status in Somerville borough
2.9% of women with births in Somerville borough are unmarried. Women with the educational attainment of college or associate's degree are most likely to be married with 100.0% of them married at childbirth, while women with the educational attainment of high school diploma are least likely to be married with 100.0% of them unmarried at childbirth.
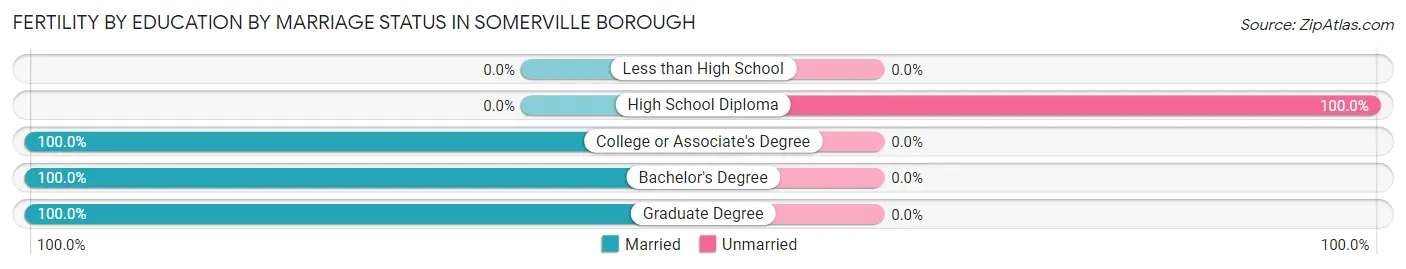
| Educational Attainment | Married | Unmarried |
| Less than High School | 0 (0.0%) | 0 (0.0%) |
| High School Diploma | 0 (0.0%) | 3 (100.0%) |
| College or Associate's Degree | 25 (100.0%) | 0 (0.0%) |
| Bachelor's Degree | 56 (100.0%) | 0 (0.0%) |
| Graduate Degree | 20 (100.0%) | 0 (0.0%) |
| Total | 101 (97.1%) | 3 (2.9%) |
Employment Characteristics in Somerville borough
Employment by Class of Employer in Somerville borough
Among the 7,162 employed individuals in Somerville borough, private company employees (5,042 | 70.4%), not-for-profit organizations (871 | 12.2%), and local government employees (523 | 7.3%) make up the most common classes of employment.
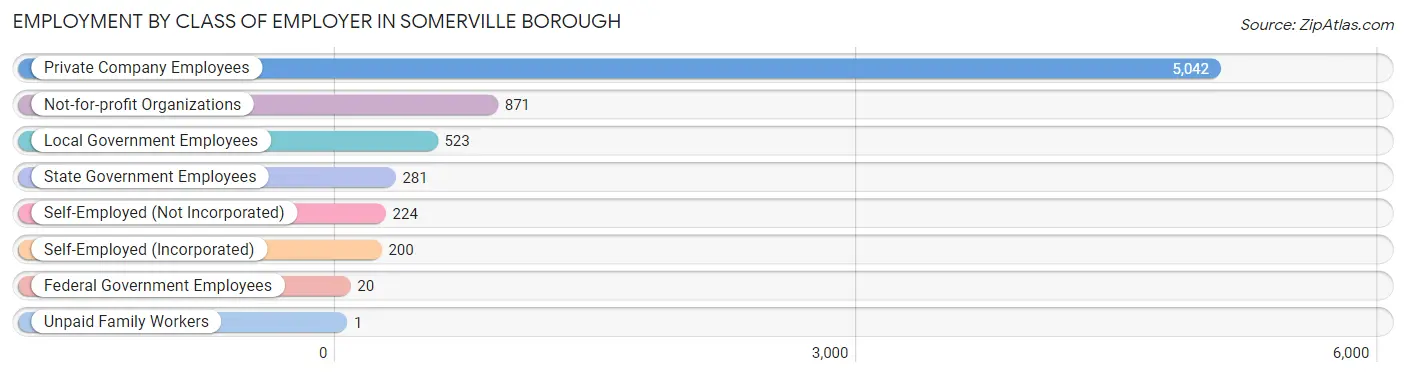
| Employer Class | # Employees | % Employees |
| Private Company Employees | 5,042 | 70.4% |
| Self-Employed (Incorporated) | 200 | 2.8% |
| Self-Employed (Not Incorporated) | 224 | 3.1% |
| Not-for-profit Organizations | 871 | 12.2% |
| Local Government Employees | 523 | 7.3% |
| State Government Employees | 281 | 3.9% |
| Federal Government Employees | 20 | 0.3% |
| Unpaid Family Workers | 1 | 0.0% |
| Total | 7,162 | 100.0% |
Employment Status by Age in Somerville borough
According to the labor force statistics for Somerville borough, out of the total population over 16 years of age (10,354), 73.6% or 7,621 individuals are in the labor force, with 3.6% or 274 of them unemployed. The age group with the highest labor force participation rate is 45 to 54 years, with 91.1% or 1,181 individuals in the labor force. Within the labor force, the 16 to 19 years age range has the highest percentage of unemployed individuals, with 11.1% or 24 of them being unemployed.
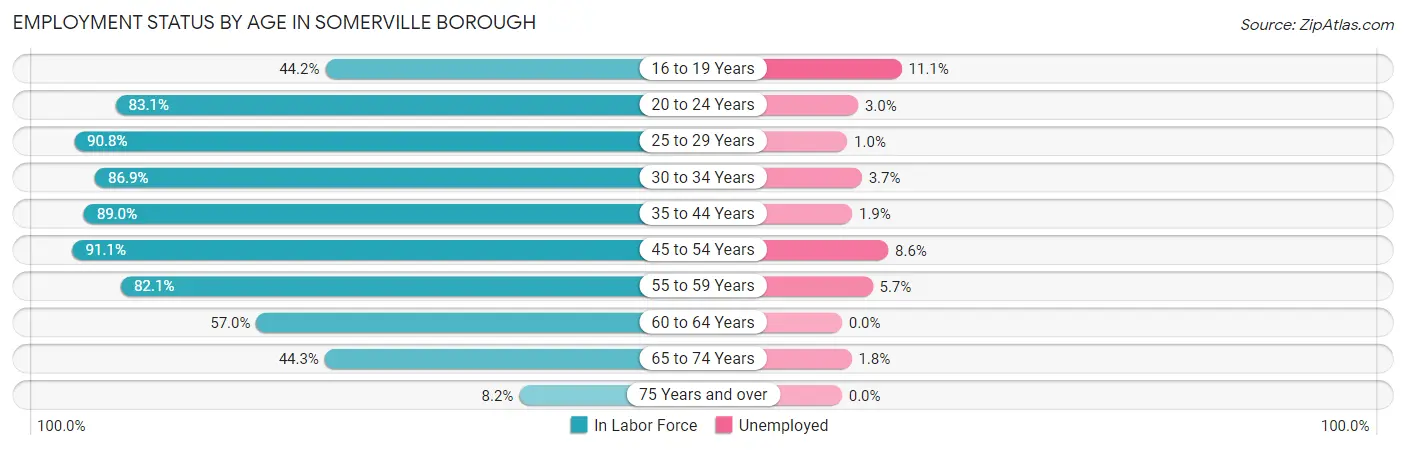
| Age Bracket | In Labor Force | Unemployed |
| 16 to 19 Years | 216 (44.2%) | 24 (11.1%) |
| 20 to 24 Years | 596 (83.1%) | 18 (3.0%) |
| 25 to 29 Years | 1,091 (90.8%) | 11 (1.0%) |
| 30 to 34 Years | 1,382 (86.9%) | 51 (3.7%) |
| 35 to 44 Years | 1,816 (89.0%) | 35 (1.9%) |
| 45 to 54 Years | 1,181 (91.1%) | 102 (8.6%) |
| 55 to 59 Years | 477 (82.1%) | 27 (5.7%) |
| 60 to 64 Years | 458 (57.0%) | 0 (0.0%) |
| 65 to 74 Years | 332 (44.3%) | 6 (1.8%) |
| 75 Years and over | 73 (8.2%) | 0 (0.0%) |
| Total | 7,621 (73.6%) | 274 (3.6%) |
Employment Status by Educational Attainment in Somerville borough
According to labor force statistics for Somerville borough, 85.3% of individuals (6,408) out of the total population between 25 and 64 years of age (7,512) are in the labor force, with 3.5% or 224 of them being unemployed. The group with the highest labor force participation rate are those with the educational attainment of bachelor's degree or higher, with 91.4% or 3,899 individuals in the labor force. Within the labor force, individuals with less than high school education have the highest percentage of unemployment, with 10.7% or 41 of them being unemployed.
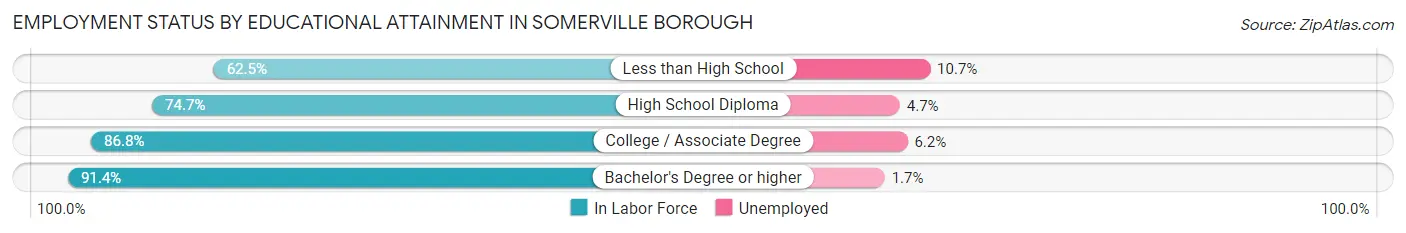
| Educational Attainment | In Labor Force | Unemployed |
| Less than High School | 383 (62.5%) | 66 (10.7%) |
| High School Diploma | 1,017 (74.7%) | 64 (4.7%) |
| College / Associate Degree | 1,104 (86.8%) | 79 (6.2%) |
| Bachelor's Degree or higher | 3,899 (91.4%) | 73 (1.7%) |
| Total | 6,408 (85.3%) | 263 (3.5%) |
Employment Occupations by Sex in Somerville borough
Management, Business, Science and Arts Occupations
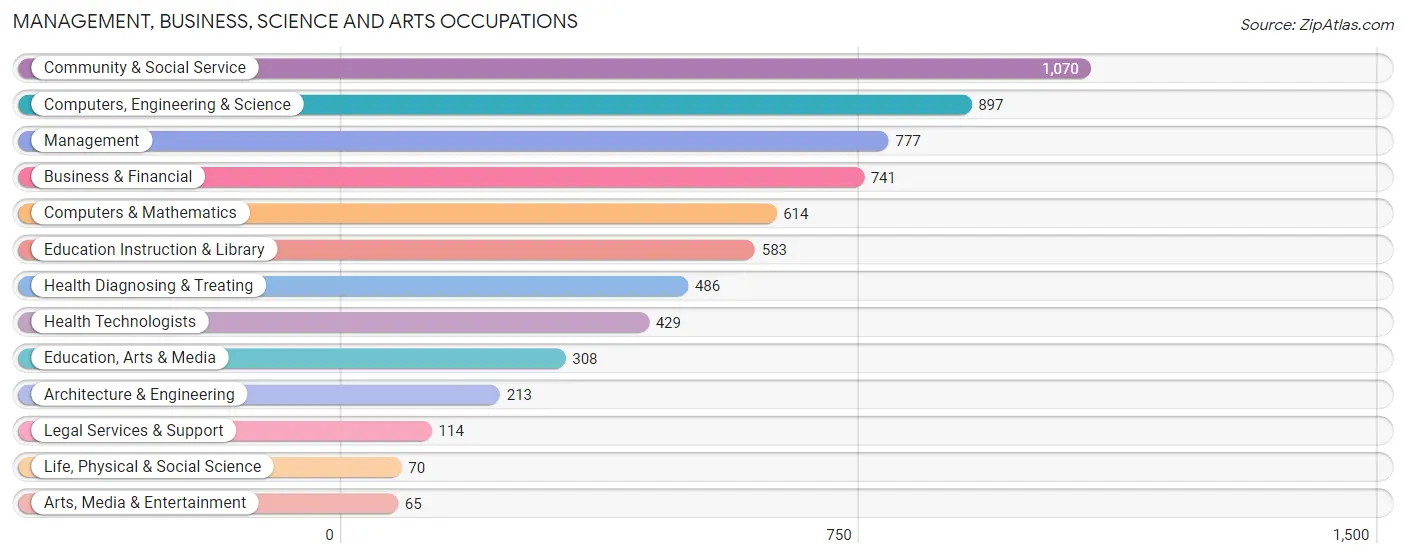
The most common Management, Business, Science and Arts occupations in Somerville borough are Community & Social Service (1,070 | 14.6%), Computers, Engineering & Science (897 | 12.2%), Management (777 | 10.6%), Business & Financial (741 | 10.1%), and Computers & Mathematics (614 | 8.4%).
Management, Business, Science and Arts Occupations by Sex
Within the Management, Business, Science and Arts occupations in Somerville borough, the most male-oriented occupations are Computers & Mathematics (87.0%), Computers, Engineering & Science (78.8%), and Architecture & Engineering (62.9%), while the most female-oriented occupations are Education Instruction & Library (78.2%), Education, Arts & Media (76.6%), and Community & Social Service (74.7%).
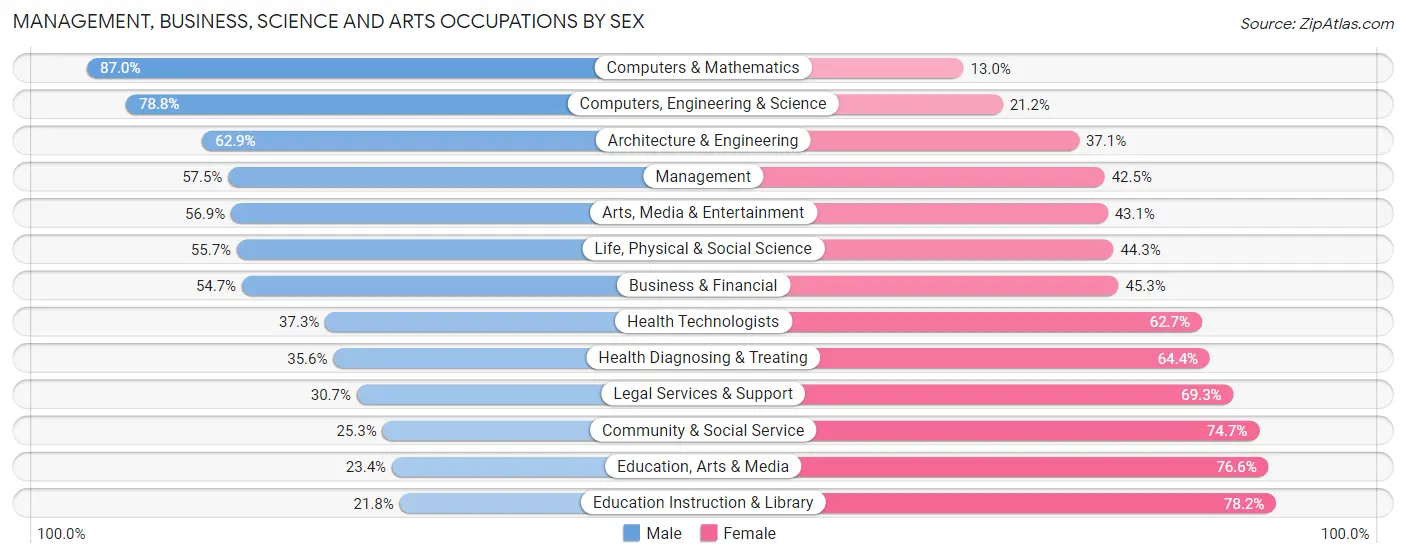
| Occupation | Male | Female |
| Management | 447 (57.5%) | 330 (42.5%) |
| Business & Financial | 405 (54.7%) | 336 (45.3%) |
| Computers, Engineering & Science | 707 (78.8%) | 190 (21.2%) |
| Computers & Mathematics | 534 (87.0%) | 80 (13.0%) |
| Architecture & Engineering | 134 (62.9%) | 79 (37.1%) |
| Life, Physical & Social Science | 39 (55.7%) | 31 (44.3%) |
| Community & Social Service | 271 (25.3%) | 799 (74.7%) |
| Education, Arts & Media | 72 (23.4%) | 236 (76.6%) |
| Legal Services & Support | 35 (30.7%) | 79 (69.3%) |
| Education Instruction & Library | 127 (21.8%) | 456 (78.2%) |
| Arts, Media & Entertainment | 37 (56.9%) | 28 (43.1%) |
| Health Diagnosing & Treating | 173 (35.6%) | 313 (64.4%) |
| Health Technologists | 160 (37.3%) | 269 (62.7%) |
| Total (Category) | 2,003 (50.4%) | 1,968 (49.6%) |
| Total (Overall) | 4,279 (58.2%) | 3,069 (41.8%) |
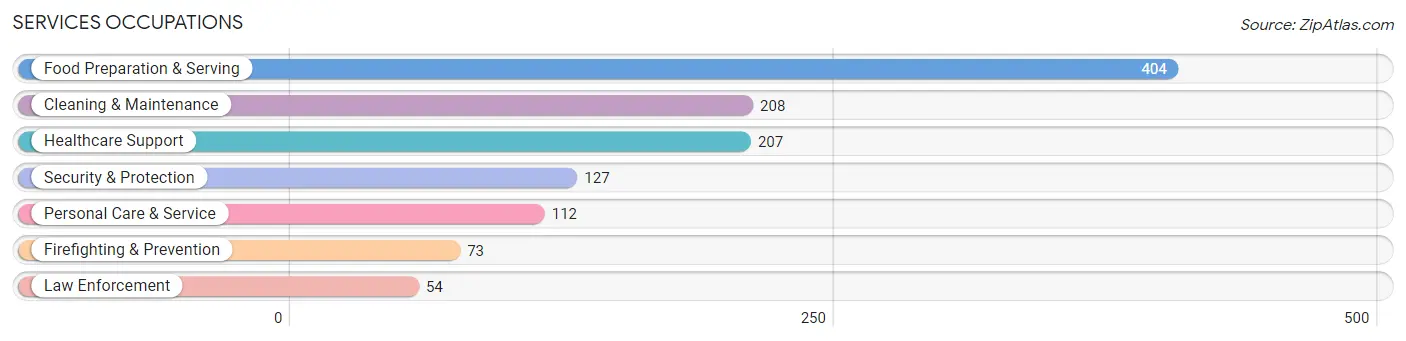
Services Occupations
The most common Services occupations in Somerville borough are Food Preparation & Serving (404 | 5.5%), Cleaning & Maintenance (208 | 2.8%), Healthcare Support (207 | 2.8%), Security & Protection (127 | 1.7%), and Personal Care & Service (112 | 1.5%).
Services Occupations by Sex
Within the Services occupations in Somerville borough, the most male-oriented occupations are Law Enforcement (100.0%), Security & Protection (96.9%), and Firefighting & Prevention (94.5%), while the most female-oriented occupations are Personal Care & Service (75.0%), Food Preparation & Serving (32.9%), and Cleaning & Maintenance (32.2%).
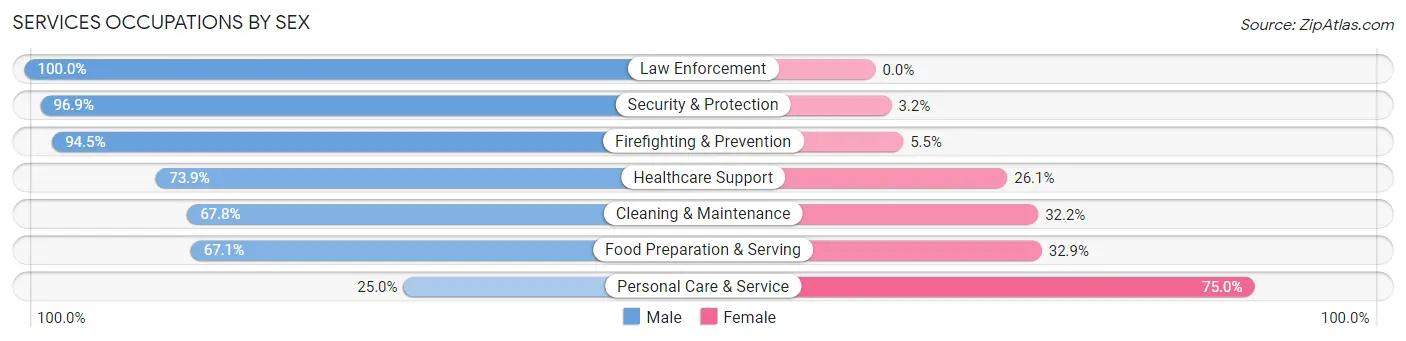
| Occupation | Male | Female |
| Healthcare Support | 153 (73.9%) | 54 (26.1%) |
| Security & Protection | 123 (96.9%) | 4 (3.2%) |
| Firefighting & Prevention | 69 (94.5%) | 4 (5.5%) |
| Law Enforcement | 54 (100.0%) | 0 (0.0%) |
| Food Preparation & Serving | 271 (67.1%) | 133 (32.9%) |
| Cleaning & Maintenance | 141 (67.8%) | 67 (32.2%) |
| Personal Care & Service | 28 (25.0%) | 84 (75.0%) |
| Total (Category) | 716 (67.7%) | 342 (32.3%) |
| Total (Overall) | 4,279 (58.2%) | 3,069 (41.8%) |
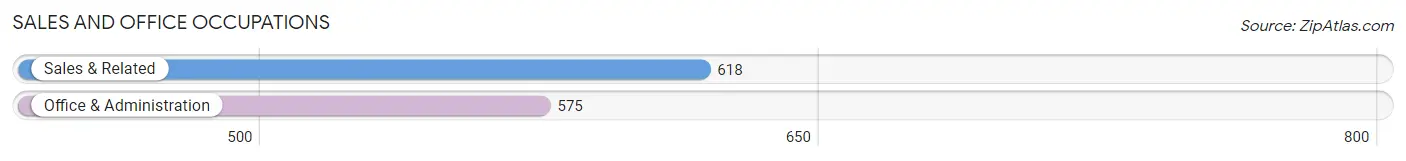
Sales and Office Occupations
The most common Sales and Office occupations in Somerville borough are Sales & Related (618 | 8.4%), and Office & Administration (575 | 7.8%).
Sales and Office Occupations by Sex
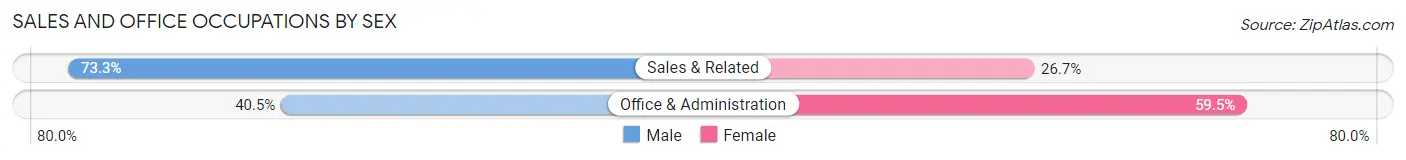
| Occupation | Male | Female |
| Sales & Related | 453 (73.3%) | 165 (26.7%) |
| Office & Administration | 233 (40.5%) | 342 (59.5%) |
| Total (Category) | 686 (57.5%) | 507 (42.5%) |
| Total (Overall) | 4,279 (58.2%) | 3,069 (41.8%) |
Natural Resources, Construction and Maintenance Occupations
The most common Natural Resources, Construction and Maintenance occupations in Somerville borough are Construction & Extraction (346 | 4.7%), and Installation, Maintenance & Repair (84 | 1.1%).
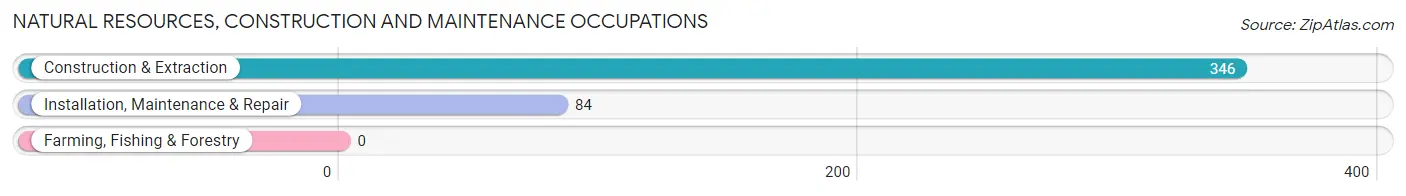
Natural Resources, Construction and Maintenance Occupations by Sex

| Occupation | Male | Female |
| Farming, Fishing & Forestry | 0 (0.0%) | 0 (0.0%) |
| Construction & Extraction | 346 (100.0%) | 0 (0.0%) |
| Installation, Maintenance & Repair | 84 (100.0%) | 0 (0.0%) |
| Total (Category) | 430 (100.0%) | 0 (0.0%) |
| Total (Overall) | 4,279 (58.2%) | 3,069 (41.8%) |
Production, Transportation and Moving Occupations
The most common Production, Transportation and Moving occupations in Somerville borough are Material Moving (262 | 3.6%), Production (240 | 3.3%), and Transportation (194 | 2.6%).
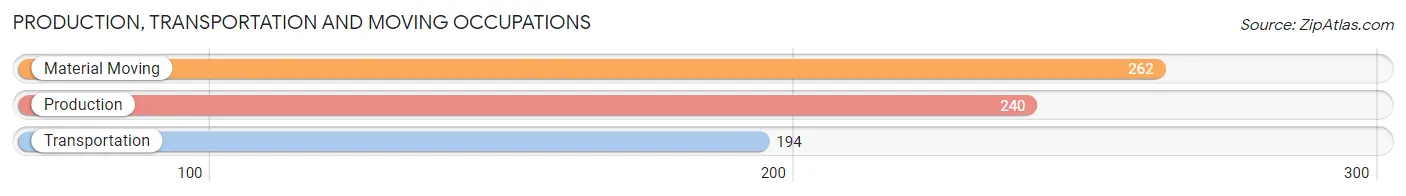
Production, Transportation and Moving Occupations by Sex
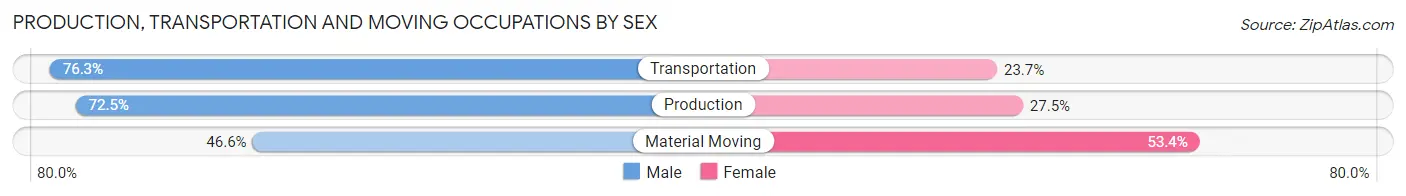
| Occupation | Male | Female |
| Production | 174 (72.5%) | 66 (27.5%) |
| Transportation | 148 (76.3%) | 46 (23.7%) |
| Material Moving | 122 (46.6%) | 140 (53.4%) |
| Total (Category) | 444 (63.8%) | 252 (36.2%) |
| Total (Overall) | 4,279 (58.2%) | 3,069 (41.8%) |
Employment Industries by Sex in Somerville borough
Employment Industries in Somerville borough
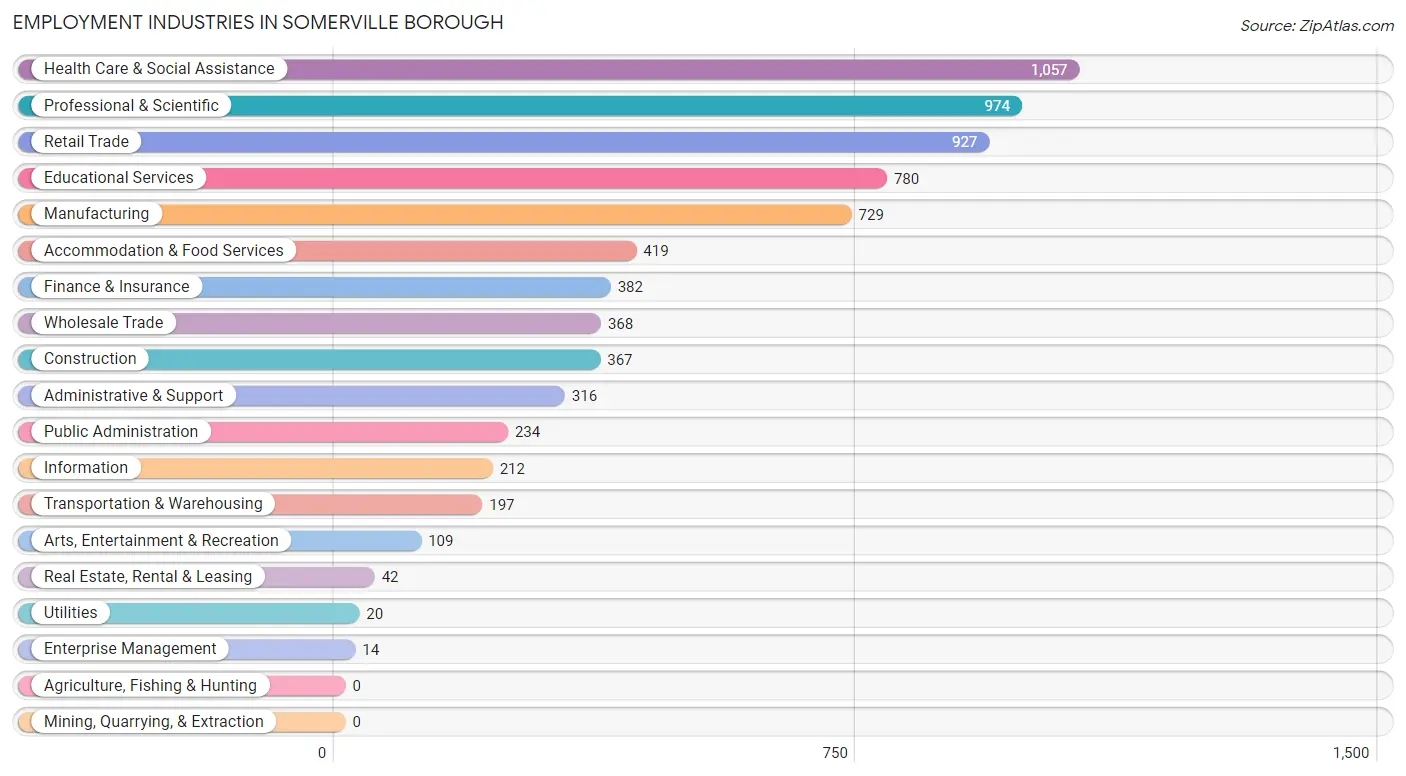
The major employment industries in Somerville borough include Health Care & Social Assistance (1,057 | 14.4%), Professional & Scientific (974 | 13.3%), Retail Trade (927 | 12.6%), Educational Services (780 | 10.6%), and Manufacturing (729 | 9.9%).
Employment Industries by Sex in Somerville borough
The Somerville borough industries that see more men than women are Construction (100.0%), Utilities (100.0%), and Enterprise Management (100.0%), whereas the industries that tend to have a higher number of women are Educational Services (75.0%), Health Care & Social Assistance (61.7%), and Real Estate, Rental & Leasing (57.1%).
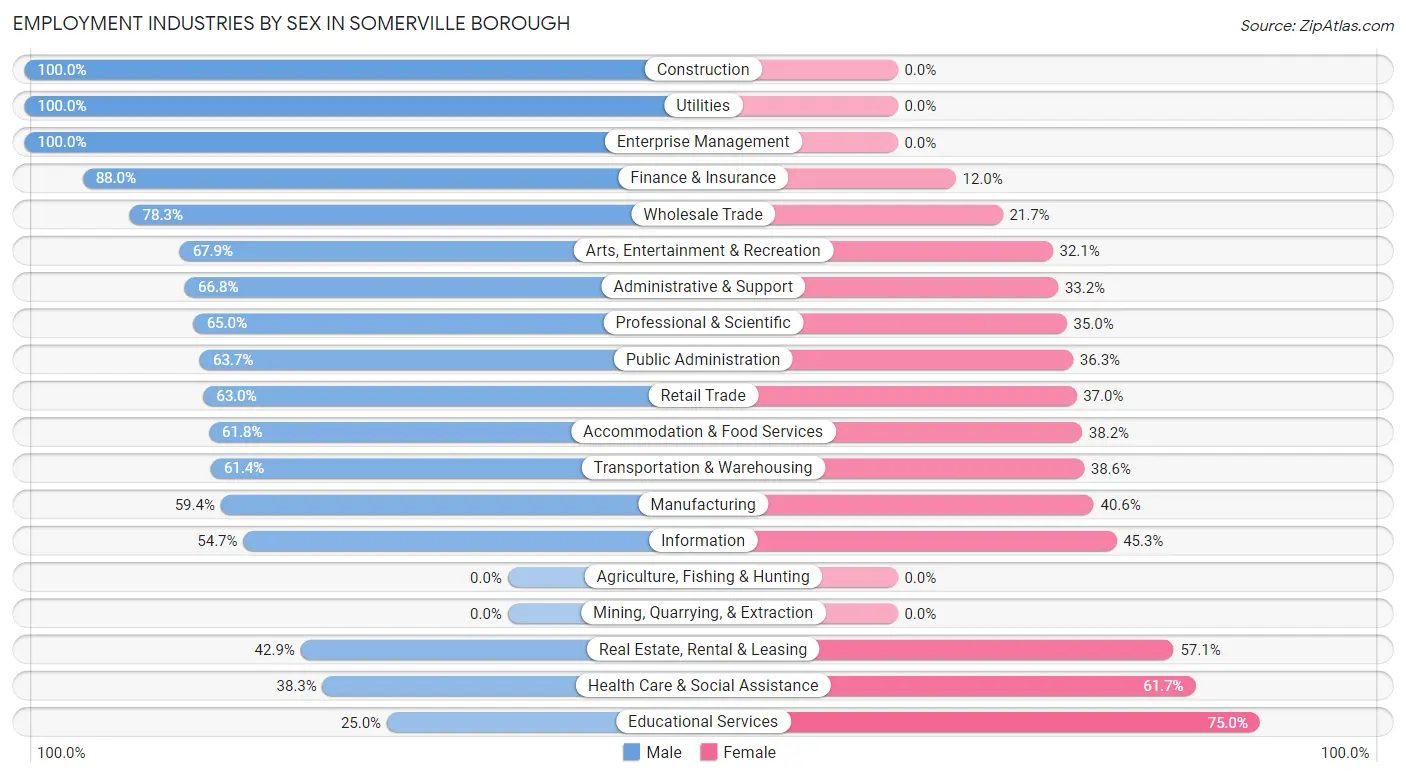
| Industry | Male | Female |
| Agriculture, Fishing & Hunting | 0 (0.0%) | 0 (0.0%) |
| Mining, Quarrying, & Extraction | 0 (0.0%) | 0 (0.0%) |
| Construction | 367 (100.0%) | 0 (0.0%) |
| Manufacturing | 433 (59.4%) | 296 (40.6%) |
| Wholesale Trade | 288 (78.3%) | 80 (21.7%) |
| Retail Trade | 584 (63.0%) | 343 (37.0%) |
| Transportation & Warehousing | 121 (61.4%) | 76 (38.6%) |
| Utilities | 20 (100.0%) | 0 (0.0%) |
| Information | 116 (54.7%) | 96 (45.3%) |
| Finance & Insurance | 336 (88.0%) | 46 (12.0%) |
| Real Estate, Rental & Leasing | 18 (42.9%) | 24 (57.1%) |
| Professional & Scientific | 633 (65.0%) | 341 (35.0%) |
| Enterprise Management | 14 (100.0%) | 0 (0.0%) |
| Administrative & Support | 211 (66.8%) | 105 (33.2%) |
| Educational Services | 195 (25.0%) | 585 (75.0%) |
| Health Care & Social Assistance | 405 (38.3%) | 652 (61.7%) |
| Arts, Entertainment & Recreation | 74 (67.9%) | 35 (32.1%) |
| Accommodation & Food Services | 259 (61.8%) | 160 (38.2%) |
| Public Administration | 149 (63.7%) | 85 (36.3%) |
| Total | 4,279 (58.2%) | 3,069 (41.8%) |
Education in Somerville borough
School Enrollment in Somerville borough
The most common levels of schooling among the 2,441 students in Somerville borough are high school (540 | 22.1%), college / undergraduate (528 | 21.6%), and middle school (382 | 15.7%).
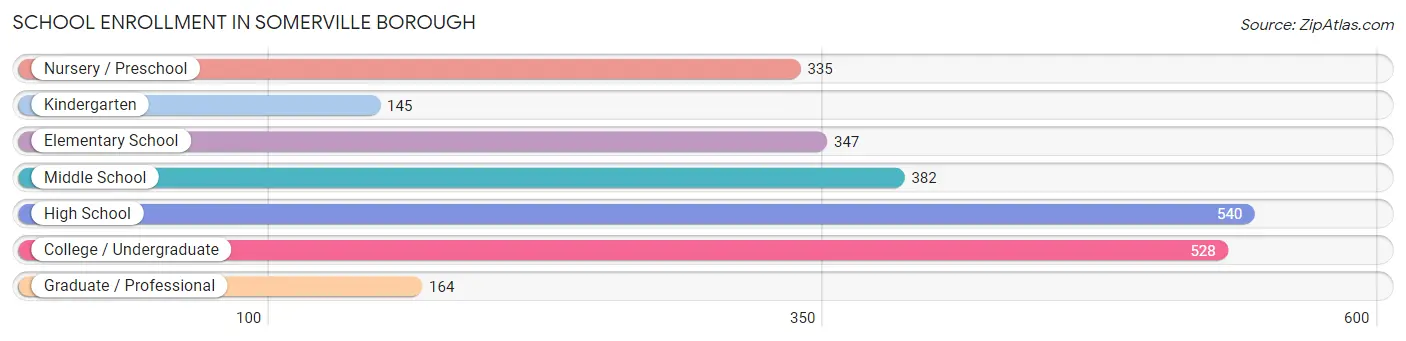
| School Level | # Students | % Students |
| Nursery / Preschool | 335 | 13.7% |
| Kindergarten | 145 | 5.9% |
| Elementary School | 347 | 14.2% |
| Middle School | 382 | 15.7% |
| High School | 540 | 22.1% |
| College / Undergraduate | 528 | 21.6% |
| Graduate / Professional | 164 | 6.7% |
| Total | 2,441 | 100.0% |
School Enrollment by Age by Funding Source in Somerville borough
Out of a total of 2,441 students who are enrolled in schools in Somerville borough, 456 (18.7%) attend a private institution, while the remaining 1,985 (81.3%) are enrolled in public schools. The age group of 3 to 4 year olds has the highest likelihood of being enrolled in private schools, with 180 (57.7% in the age bracket) enrolled. Conversely, the age group of 18 to 19 year olds has the lowest likelihood of being enrolled in a private school, with 188 (98.4% in the age bracket) attending a public institution.
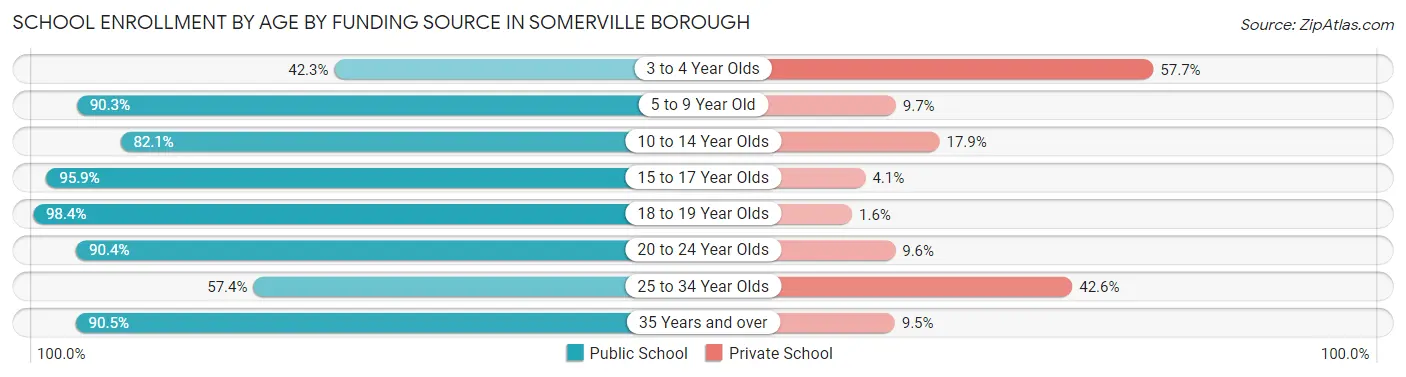
| Age Bracket | Public School | Private School |
| 3 to 4 Year Olds | 132 (42.3%) | 180 (57.7%) |
| 5 to 9 Year Old | 455 (90.3%) | 49 (9.7%) |
| 10 to 14 Year Olds | 368 (82.1%) | 80 (17.9%) |
| 15 to 17 Year Olds | 378 (95.9%) | 16 (4.1%) |
| 18 to 19 Year Olds | 188 (98.4%) | 3 (1.6%) |
| 20 to 24 Year Olds | 207 (90.4%) | 22 (9.6%) |
| 25 to 34 Year Olds | 124 (57.4%) | 92 (42.6%) |
| 35 Years and over | 133 (90.5%) | 14 (9.5%) |
| Total | 1,985 (81.3%) | 456 (18.7%) |
Educational Attainment by Field of Study in Somerville borough
Business (780 | 14.6%), science & technology (666 | 12.4%), education (454 | 8.5%), arts & humanities (444 | 8.3%), and computers & mathematics (440 | 8.2%) are the most common fields of study among 5,357 individuals in Somerville borough who have obtained a bachelor's degree or higher.
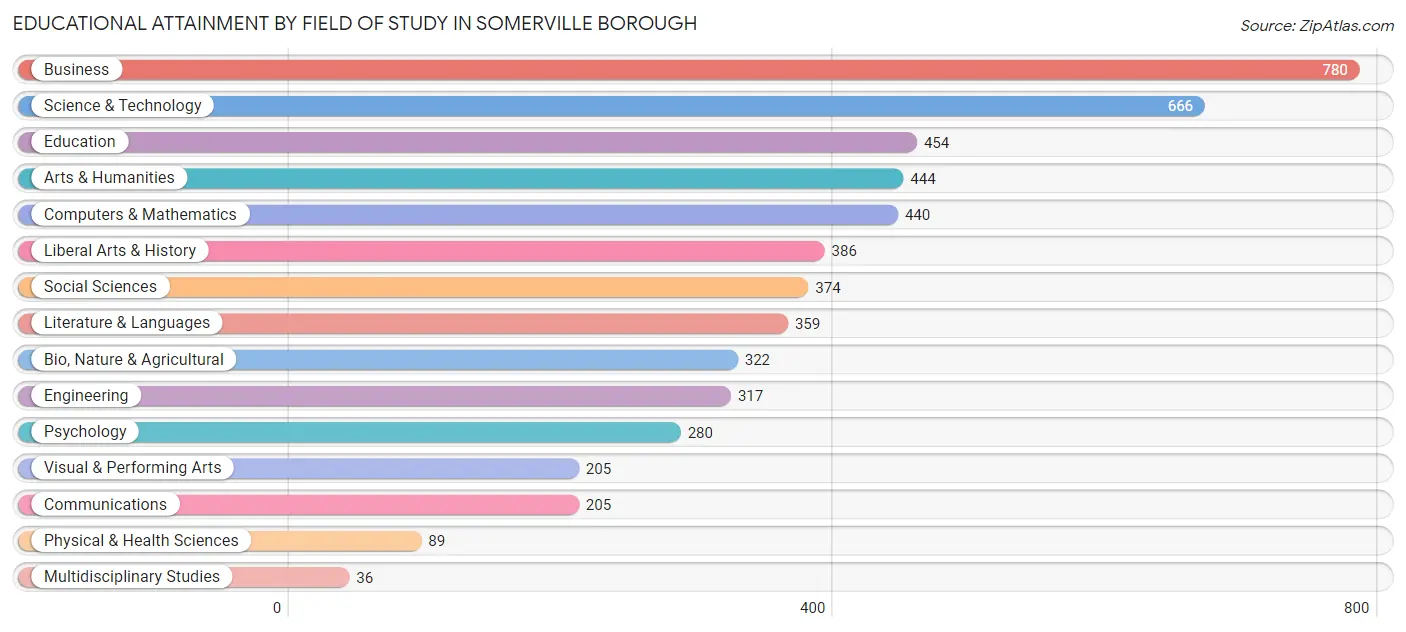
| Field of Study | # Graduates | % Graduates |
| Computers & Mathematics | 440 | 8.2% |
| Bio, Nature & Agricultural | 322 | 6.0% |
| Physical & Health Sciences | 89 | 1.7% |
| Psychology | 280 | 5.2% |
| Social Sciences | 374 | 7.0% |
| Engineering | 317 | 5.9% |
| Multidisciplinary Studies | 36 | 0.7% |
| Science & Technology | 666 | 12.4% |
| Business | 780 | 14.6% |
| Education | 454 | 8.5% |
| Literature & Languages | 359 | 6.7% |
| Liberal Arts & History | 386 | 7.2% |
| Visual & Performing Arts | 205 | 3.8% |
| Communications | 205 | 3.8% |
| Arts & Humanities | 444 | 8.3% |
| Total | 5,357 | 100.0% |
Transportation & Commute in Somerville borough
Vehicle Availability by Sex in Somerville borough
The most prevalent vehicle ownership categories in Somerville borough are males with 2 vehicles (1,892, accounting for 45.5%) and females with 2 vehicles (1,468, making up 63.8%).
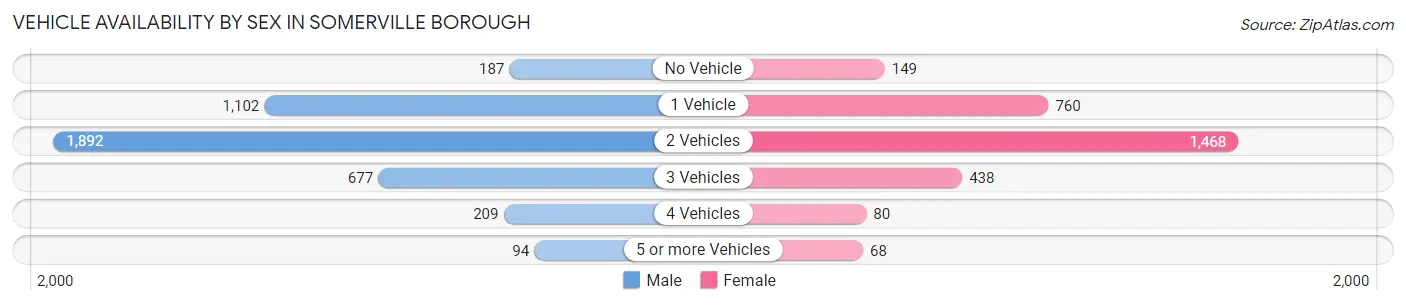
| Vehicles Available | Male | Female |
| No Vehicle | 187 (4.5%) | 149 (5.0%) |
| 1 Vehicle | 1,102 (26.5%) | 760 (25.7%) |
| 2 Vehicles | 1,892 (45.5%) | 1,468 (49.5%) |
| 3 Vehicles | 677 (16.3%) | 438 (14.8%) |
| 4 Vehicles | 209 (5.0%) | 80 (2.7%) |
| 5 or more Vehicles | 94 (2.3%) | 68 (2.3%) |
| Total | 4,161 (100.0%) | 2,963 (100.0%) |
Commute Time in Somerville borough
The most frequently occuring commute durations in Somerville borough are 10 to 14 minutes (1,122 commuters, 17.8%), 15 to 19 minutes (966 commuters, 15.3%), and 30 to 34 minutes (958 commuters, 15.2%).
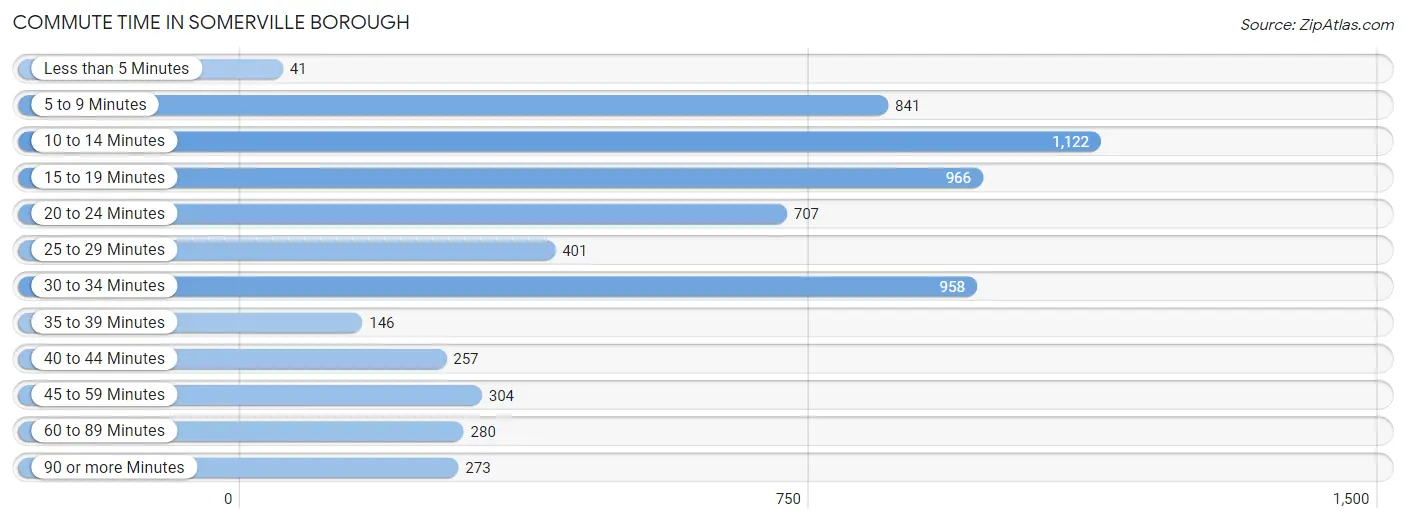
| Commute Time | # Commuters | % Commuters |
| Less than 5 Minutes | 41 | 0.6% |
| 5 to 9 Minutes | 841 | 13.4% |
| 10 to 14 Minutes | 1,122 | 17.8% |
| 15 to 19 Minutes | 966 | 15.3% |
| 20 to 24 Minutes | 707 | 11.2% |
| 25 to 29 Minutes | 401 | 6.4% |
| 30 to 34 Minutes | 958 | 15.2% |
| 35 to 39 Minutes | 146 | 2.3% |
| 40 to 44 Minutes | 257 | 4.1% |
| 45 to 59 Minutes | 304 | 4.8% |
| 60 to 89 Minutes | 280 | 4.4% |
| 90 or more Minutes | 273 | 4.3% |
Commute Time by Sex in Somerville borough
The most common commute times in Somerville borough are 30 to 34 minutes (676 commuters, 18.3%) for males and 10 to 14 minutes (603 commuters, 23.1%) for females.
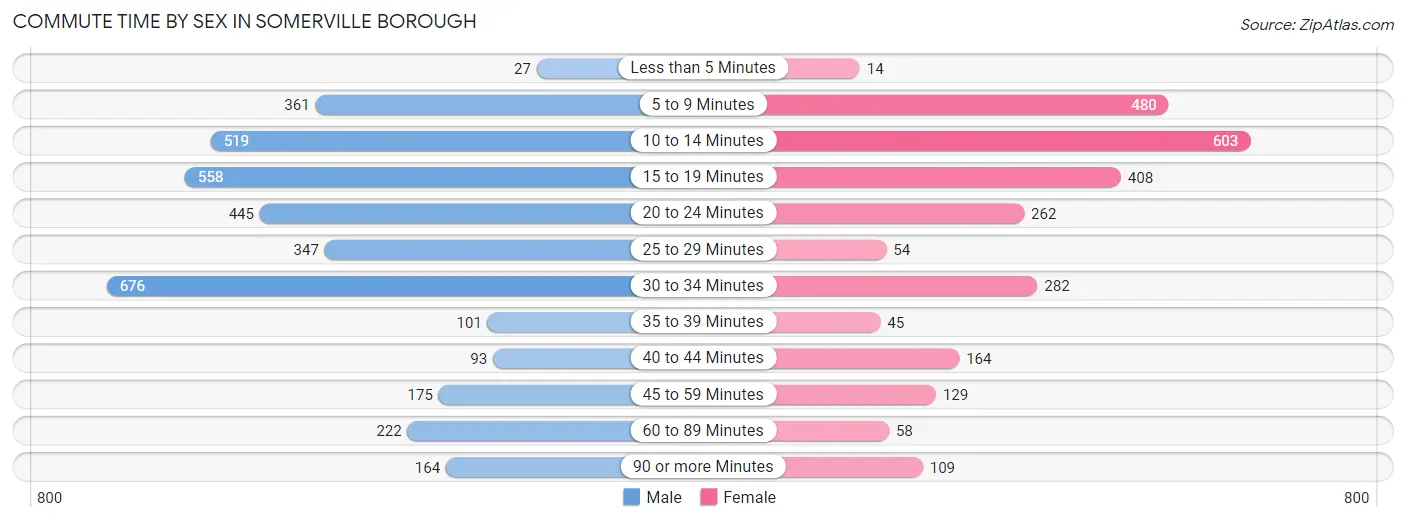
| Commute Time | Male | Female |
| Less than 5 Minutes | 27 (0.7%) | 14 (0.5%) |
| 5 to 9 Minutes | 361 (9.8%) | 480 (18.4%) |
| 10 to 14 Minutes | 519 (14.1%) | 603 (23.1%) |
| 15 to 19 Minutes | 558 (15.1%) | 408 (15.6%) |
| 20 to 24 Minutes | 445 (12.1%) | 262 (10.1%) |
| 25 to 29 Minutes | 347 (9.4%) | 54 (2.1%) |
| 30 to 34 Minutes | 676 (18.3%) | 282 (10.8%) |
| 35 to 39 Minutes | 101 (2.7%) | 45 (1.7%) |
| 40 to 44 Minutes | 93 (2.5%) | 164 (6.3%) |
| 45 to 59 Minutes | 175 (4.8%) | 129 (5.0%) |
| 60 to 89 Minutes | 222 (6.0%) | 58 (2.2%) |
| 90 or more Minutes | 164 (4.4%) | 109 (4.2%) |
Time of Departure to Work by Sex in Somerville borough
The most frequent times of departure to work in Somerville borough are 8:00 AM to 8:29 AM (596, 16.2%) for males and 7:00 AM to 7:29 AM (466, 17.9%) for females.
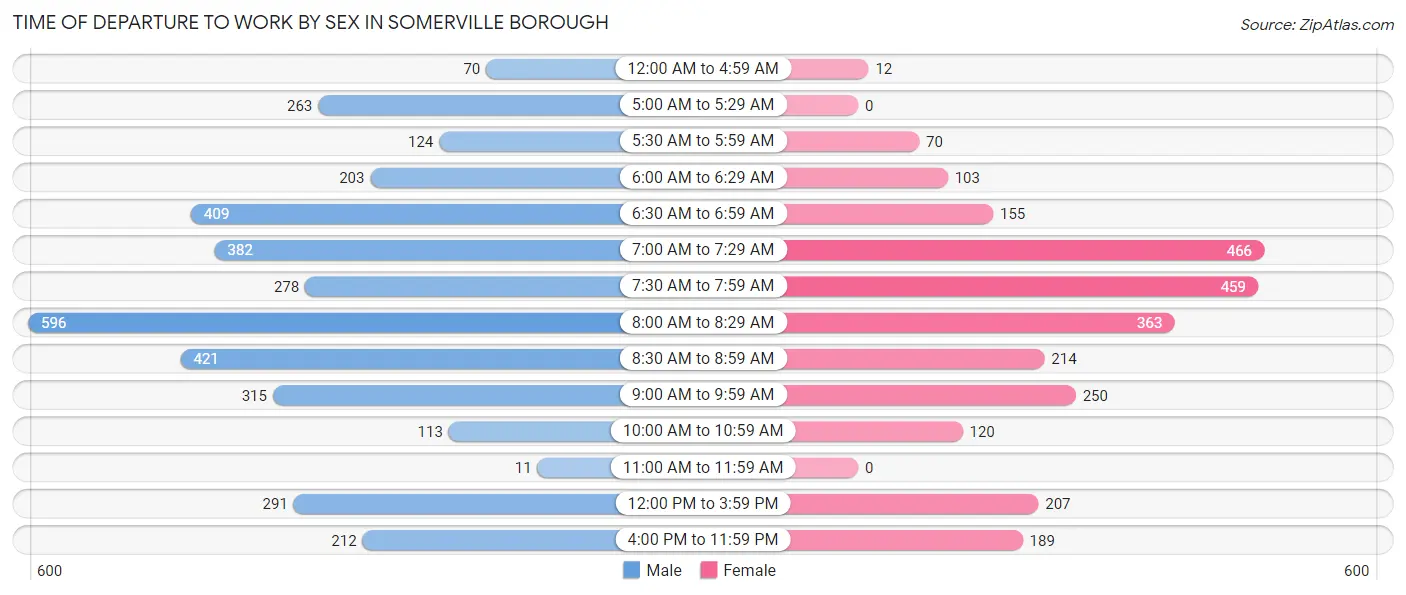
| Time of Departure | Male | Female |
| 12:00 AM to 4:59 AM | 70 (1.9%) | 12 (0.5%) |
| 5:00 AM to 5:29 AM | 263 (7.1%) | 0 (0.0%) |
| 5:30 AM to 5:59 AM | 124 (3.4%) | 70 (2.7%) |
| 6:00 AM to 6:29 AM | 203 (5.5%) | 103 (4.0%) |
| 6:30 AM to 6:59 AM | 409 (11.1%) | 155 (5.9%) |
| 7:00 AM to 7:29 AM | 382 (10.4%) | 466 (17.9%) |
| 7:30 AM to 7:59 AM | 278 (7.5%) | 459 (17.6%) |
| 8:00 AM to 8:29 AM | 596 (16.2%) | 363 (13.9%) |
| 8:30 AM to 8:59 AM | 421 (11.4%) | 214 (8.2%) |
| 9:00 AM to 9:59 AM | 315 (8.5%) | 250 (9.6%) |
| 10:00 AM to 10:59 AM | 113 (3.1%) | 120 (4.6%) |
| 11:00 AM to 11:59 AM | 11 (0.3%) | 0 (0.0%) |
| 12:00 PM to 3:59 PM | 291 (7.9%) | 207 (7.9%) |
| 4:00 PM to 11:59 PM | 212 (5.8%) | 189 (7.2%) |
| Total | 3,688 (100.0%) | 2,608 (100.0%) |
Housing Occupancy in Somerville borough
Occupancy by Ownership in Somerville borough
Of the total 5,135 dwellings in Somerville borough, owner-occupied units account for 2,365 (46.1%), while renter-occupied units make up 2,770 (53.9%).
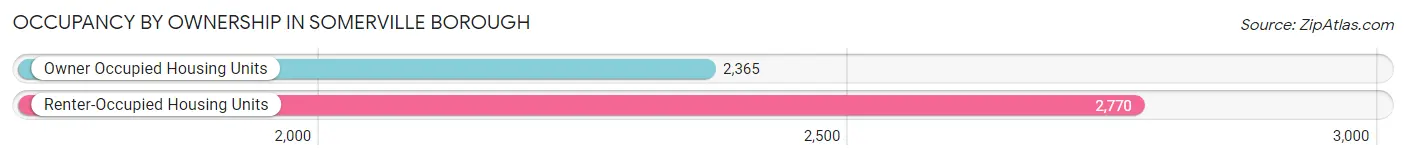
| Occupancy | # Housing Units | % Housing Units |
| Owner Occupied Housing Units | 2,365 | 46.1% |
| Renter-Occupied Housing Units | 2,770 | 53.9% |
| Total Occupied Housing Units | 5,135 | 100.0% |
Occupancy by Household Size in Somerville borough
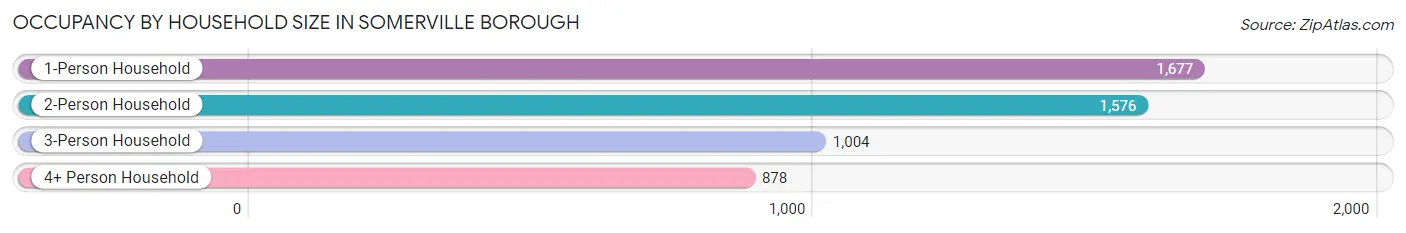
| Household Size | # Housing Units | % Housing Units |
| 1-Person Household | 1,677 | 32.7% |
| 2-Person Household | 1,576 | 30.7% |
| 3-Person Household | 1,004 | 19.6% |
| 4+ Person Household | 878 | 17.1% |
| Total Housing Units | 5,135 | 100.0% |
Occupancy by Ownership by Household Size in Somerville borough
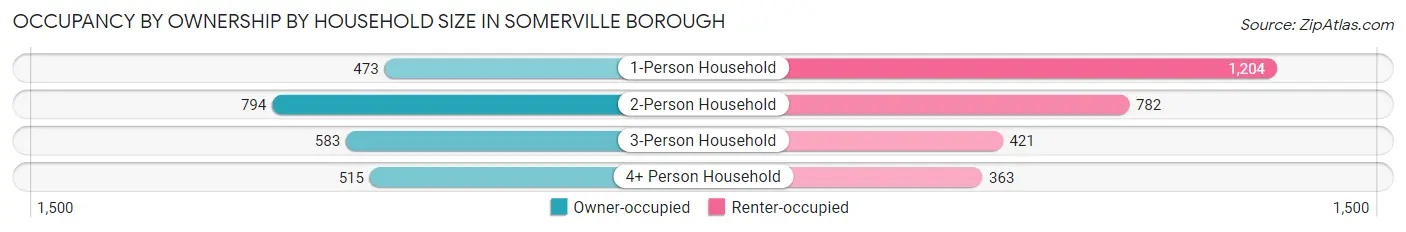
| Household Size | Owner-occupied | Renter-occupied |
| 1-Person Household | 473 (28.2%) | 1,204 (71.8%) |
| 2-Person Household | 794 (50.4%) | 782 (49.6%) |
| 3-Person Household | 583 (58.1%) | 421 (41.9%) |
| 4+ Person Household | 515 (58.7%) | 363 (41.3%) |
| Total Housing Units | 2,365 (46.1%) | 2,770 (53.9%) |
Occupancy by Educational Attainment in Somerville borough
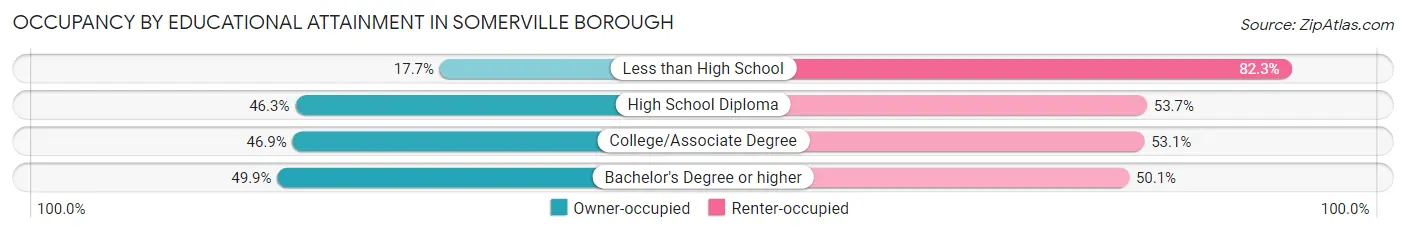
| Household Size | Owner-occupied | Renter-occupied |
| Less than High School | 76 (17.7%) | 354 (82.3%) |
| High School Diploma | 336 (46.3%) | 389 (53.7%) |
| College/Associate Degree | 500 (46.9%) | 567 (53.1%) |
| Bachelor's Degree or higher | 1,453 (49.9%) | 1,460 (50.1%) |
Occupancy by Age of Householder in Somerville borough
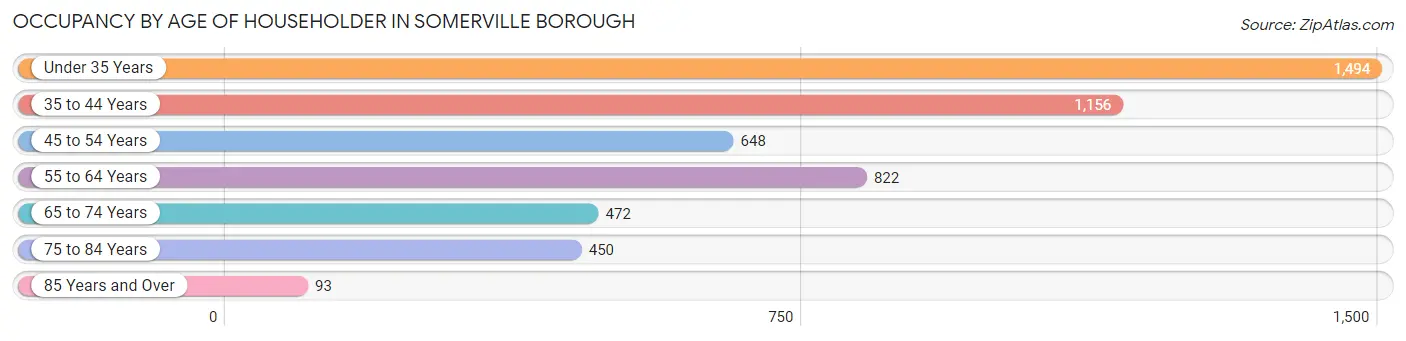
| Age Bracket | # Households | % Households |
| Under 35 Years | 1,494 | 29.1% |
| 35 to 44 Years | 1,156 | 22.5% |
| 45 to 54 Years | 648 | 12.6% |
| 55 to 64 Years | 822 | 16.0% |
| 65 to 74 Years | 472 | 9.2% |
| 75 to 84 Years | 450 | 8.8% |
| 85 Years and Over | 93 | 1.8% |
| Total | 5,135 | 100.0% |
Housing Finances in Somerville borough
Median Income by Occupancy in Somerville borough
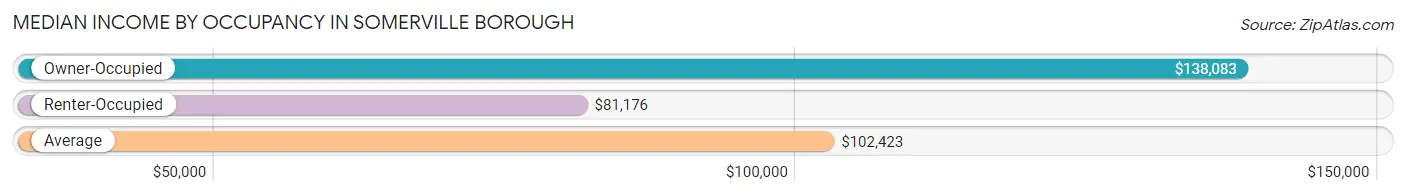
| Occupancy Type | # Households | Median Income |
| Owner-Occupied | 2,365 (46.1%) | $138,083 |
| Renter-Occupied | 2,770 (53.9%) | $81,176 |
| Average | 5,135 (100.0%) | $102,423 |
Occupancy by Householder Income Bracket in Somerville borough
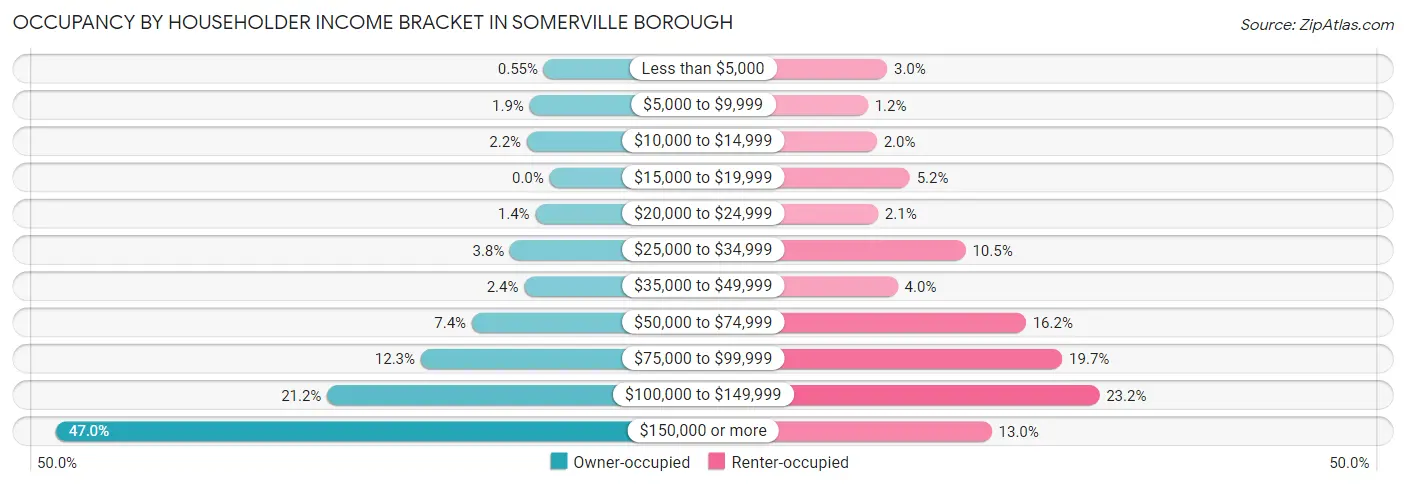
| Income Bracket | Owner-occupied | Renter-occupied |
| Less than $5,000 | 13 (0.5%) | 83 (3.0%) |
| $5,000 to $9,999 | 45 (1.9%) | 32 (1.2%) |
| $10,000 to $14,999 | 51 (2.2%) | 56 (2.0%) |
| $15,000 to $19,999 | 0 (0.0%) | 143 (5.2%) |
| $20,000 to $24,999 | 32 (1.3%) | 59 (2.1%) |
| $25,000 to $34,999 | 89 (3.8%) | 290 (10.5%) |
| $35,000 to $49,999 | 57 (2.4%) | 111 (4.0%) |
| $50,000 to $74,999 | 175 (7.4%) | 449 (16.2%) |
| $75,000 to $99,999 | 290 (12.3%) | 545 (19.7%) |
| $100,000 to $149,999 | 501 (21.2%) | 643 (23.2%) |
| $150,000 or more | 1,112 (47.0%) | 359 (13.0%) |
| Total | 2,365 (100.0%) | 2,770 (100.0%) |
Monthly Housing Cost Tiers in Somerville borough
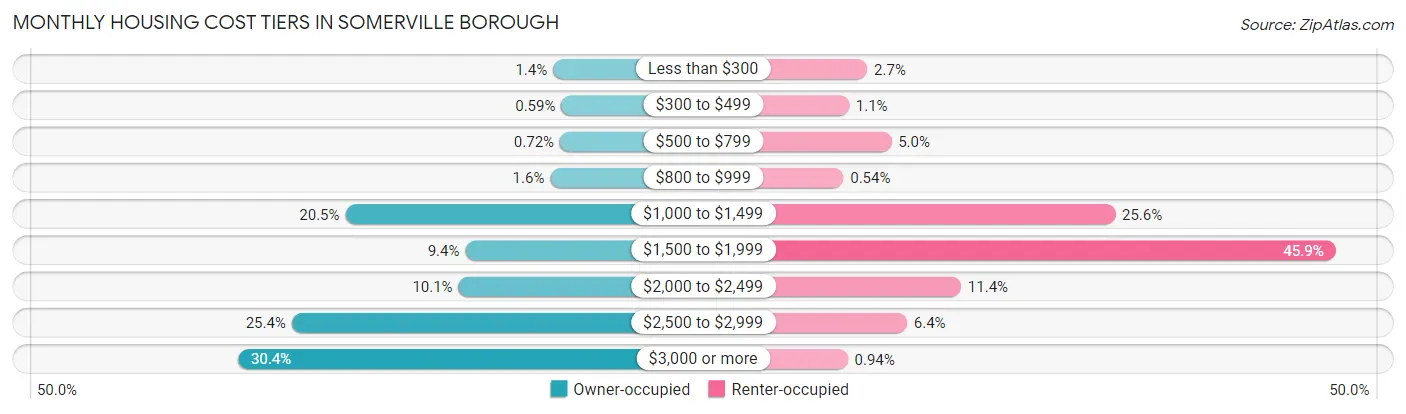
| Monthly Cost | Owner-occupied | Renter-occupied |
| Less than $300 | 32 (1.3%) | 76 (2.7%) |
| $300 to $499 | 14 (0.6%) | 29 (1.1%) |
| $500 to $799 | 17 (0.7%) | 137 (5.0%) |
| $800 to $999 | 38 (1.6%) | 15 (0.5%) |
| $1,000 to $1,499 | 484 (20.5%) | 708 (25.6%) |
| $1,500 to $1,999 | 223 (9.4%) | 1,270 (45.9%) |
| $2,000 to $2,499 | 238 (10.1%) | 315 (11.4%) |
| $2,500 to $2,999 | 601 (25.4%) | 177 (6.4%) |
| $3,000 or more | 718 (30.4%) | 26 (0.9%) |
| Total | 2,365 (100.0%) | 2,770 (100.0%) |
Physical Housing Characteristics in Somerville borough
Housing Structures in Somerville borough
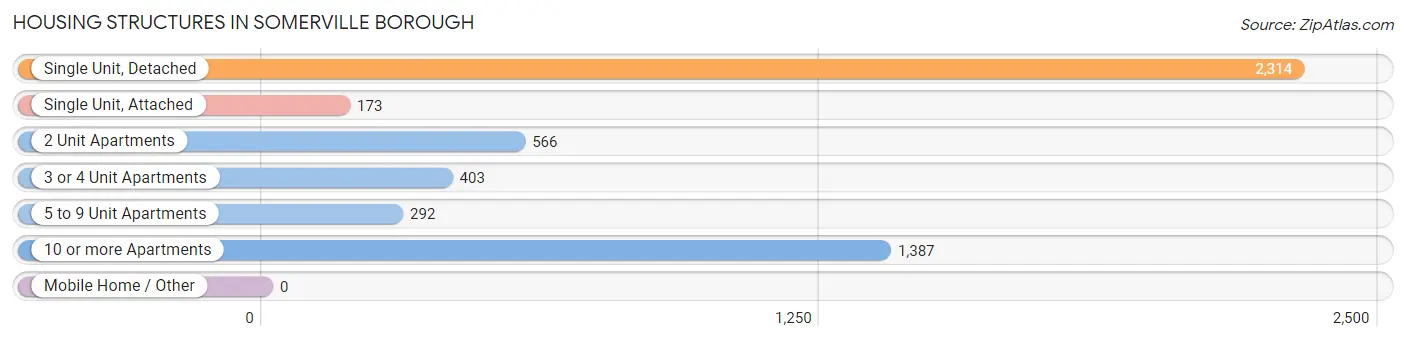
| Structure Type | # Housing Units | % Housing Units |
| Single Unit, Detached | 2,314 | 45.1% |
| Single Unit, Attached | 173 | 3.4% |
| 2 Unit Apartments | 566 | 11.0% |
| 3 or 4 Unit Apartments | 403 | 7.9% |
| 5 to 9 Unit Apartments | 292 | 5.7% |
| 10 or more Apartments | 1,387 | 27.0% |
| Mobile Home / Other | 0 | 0.0% |
| Total | 5,135 | 100.0% |
Housing Structures by Occupancy in Somerville borough
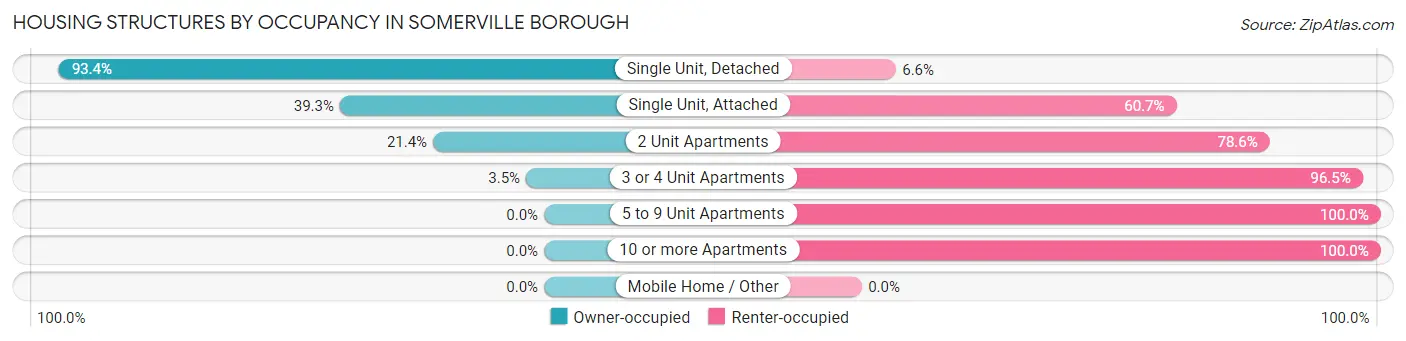
| Structure Type | Owner-occupied | Renter-occupied |
| Single Unit, Detached | 2,162 (93.4%) | 152 (6.6%) |
| Single Unit, Attached | 68 (39.3%) | 105 (60.7%) |
| 2 Unit Apartments | 121 (21.4%) | 445 (78.6%) |
| 3 or 4 Unit Apartments | 14 (3.5%) | 389 (96.5%) |
| 5 to 9 Unit Apartments | 0 (0.0%) | 292 (100.0%) |
| 10 or more Apartments | 0 (0.0%) | 1,387 (100.0%) |
| Mobile Home / Other | 0 (0.0%) | 0 (0.0%) |
| Total | 2,365 (46.1%) | 2,770 (53.9%) |
Housing Structures by Number of Rooms in Somerville borough
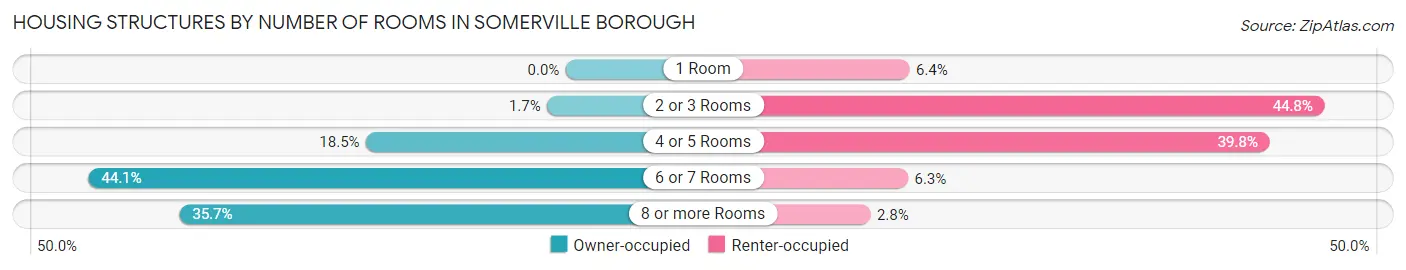
| Number of Rooms | Owner-occupied | Renter-occupied |
| 1 Room | 0 (0.0%) | 177 (6.4%) |
| 2 or 3 Rooms | 41 (1.7%) | 1,242 (44.8%) |
| 4 or 5 Rooms | 437 (18.5%) | 1,101 (39.8%) |
| 6 or 7 Rooms | 1,043 (44.1%) | 173 (6.2%) |
| 8 or more Rooms | 844 (35.7%) | 77 (2.8%) |
| Total | 2,365 (100.0%) | 2,770 (100.0%) |
Housing Structure by Heating Type in Somerville borough
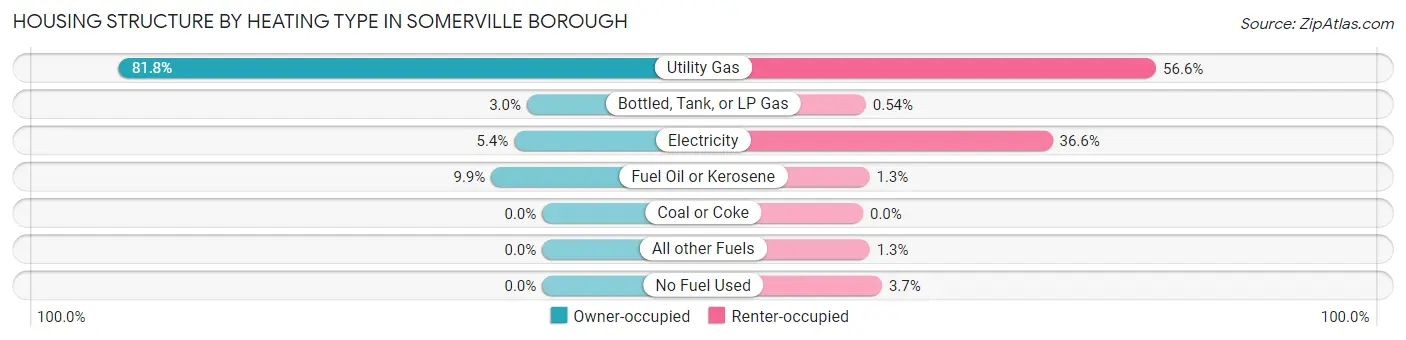
| Heating Type | Owner-occupied | Renter-occupied |
| Utility Gas | 1,934 (81.8%) | 1,569 (56.6%) |
| Bottled, Tank, or LP Gas | 70 (3.0%) | 15 (0.5%) |
| Electricity | 128 (5.4%) | 1,014 (36.6%) |
| Fuel Oil or Kerosene | 233 (9.9%) | 35 (1.3%) |
| Coal or Coke | 0 (0.0%) | 0 (0.0%) |
| All other Fuels | 0 (0.0%) | 36 (1.3%) |
| No Fuel Used | 0 (0.0%) | 101 (3.6%) |
| Total | 2,365 (100.0%) | 2,770 (100.0%) |
Household Vehicle Usage in Somerville borough
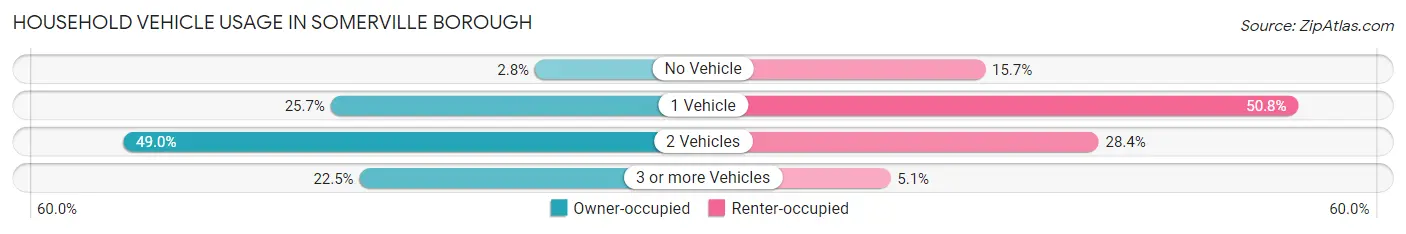
| Vehicles per Household | Owner-occupied | Renter-occupied |
| No Vehicle | 67 (2.8%) | 435 (15.7%) |
| 1 Vehicle | 608 (25.7%) | 1,407 (50.8%) |
| 2 Vehicles | 1,158 (49.0%) | 787 (28.4%) |
| 3 or more Vehicles | 532 (22.5%) | 141 (5.1%) |
| Total | 2,365 (100.0%) | 2,770 (100.0%) |
Real Estate & Mortgages in Somerville borough
Real Estate and Mortgage Overview in Somerville borough
| Characteristic | Without Mortgage | With Mortgage |
| Housing Units | 650 | 1,715 |
| Median Property Value | $357,400 | $384,500 |
| Median Household Income | $88,790 | $935 |
| Monthly Housing Costs | $1,257 | $718 |
| Real Estate Taxes | $10,001 | $8 |
Property Value by Mortgage Status in Somerville borough
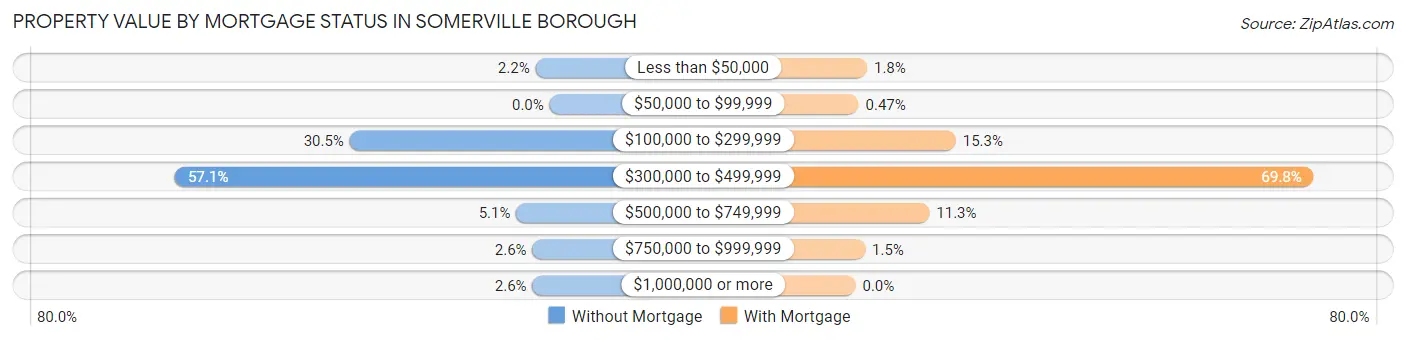
| Property Value | Without Mortgage | With Mortgage |
| Less than $50,000 | 14 (2.1%) | 30 (1.8%) |
| $50,000 to $99,999 | 0 (0.0%) | 8 (0.5%) |
| $100,000 to $299,999 | 198 (30.5%) | 262 (15.3%) |
| $300,000 to $499,999 | 371 (57.1%) | 1,197 (69.8%) |
| $500,000 to $749,999 | 33 (5.1%) | 193 (11.3%) |
| $750,000 to $999,999 | 17 (2.6%) | 25 (1.5%) |
| $1,000,000 or more | 17 (2.6%) | 0 (0.0%) |
| Total | 650 (100.0%) | 1,715 (100.0%) |
Household Income by Mortgage Status in Somerville borough
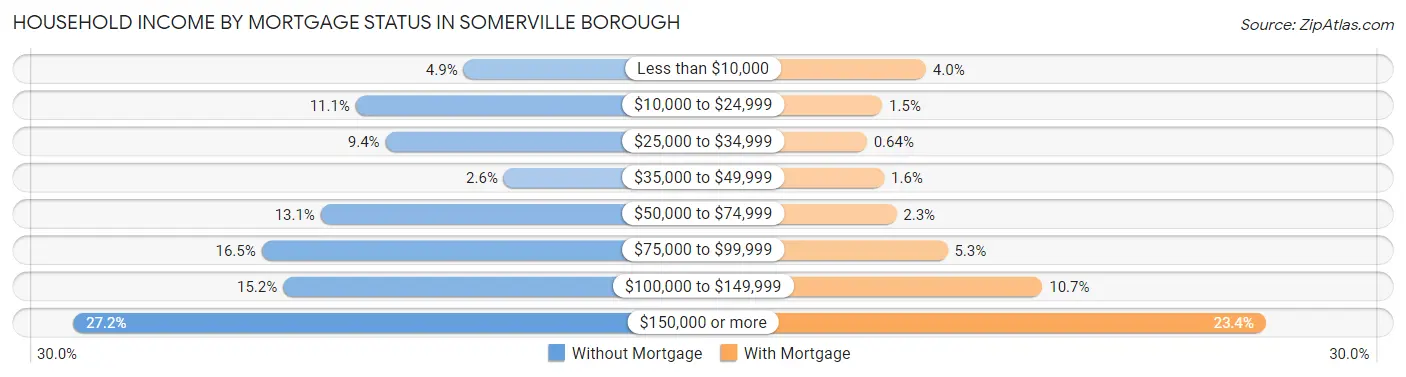
| Household Income | Without Mortgage | With Mortgage |
| Less than $10,000 | 32 (4.9%) | 69 (4.0%) |
| $10,000 to $24,999 | 72 (11.1%) | 26 (1.5%) |
| $25,000 to $34,999 | 61 (9.4%) | 11 (0.6%) |
| $35,000 to $49,999 | 17 (2.6%) | 28 (1.6%) |
| $50,000 to $74,999 | 85 (13.1%) | 40 (2.3%) |
| $75,000 to $99,999 | 107 (16.5%) | 90 (5.2%) |
| $100,000 to $149,999 | 99 (15.2%) | 183 (10.7%) |
| $150,000 or more | 177 (27.2%) | 402 (23.4%) |
| Total | 650 (100.0%) | 1,715 (100.0%) |
Property Value to Household Income Ratio in Somerville borough
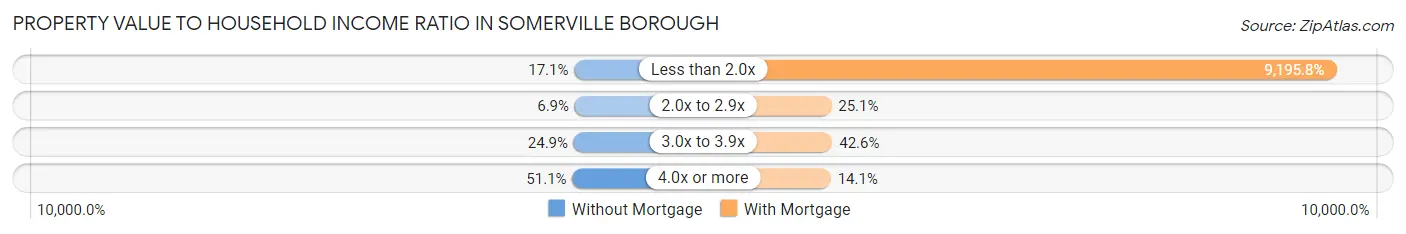
| Value-to-Income Ratio | Without Mortgage | With Mortgage |
| Less than 2.0x | 111 (17.1%) | 157,708 (9,195.8%) |
| 2.0x to 2.9x | 45 (6.9%) | 430 (25.1%) |
| 3.0x to 3.9x | 162 (24.9%) | 730 (42.6%) |
| 4.0x or more | 332 (51.1%) | 241 (14.1%) |
| Total | 650 (100.0%) | 1,715 (100.0%) |
Real Estate Taxes by Mortgage Status in Somerville borough
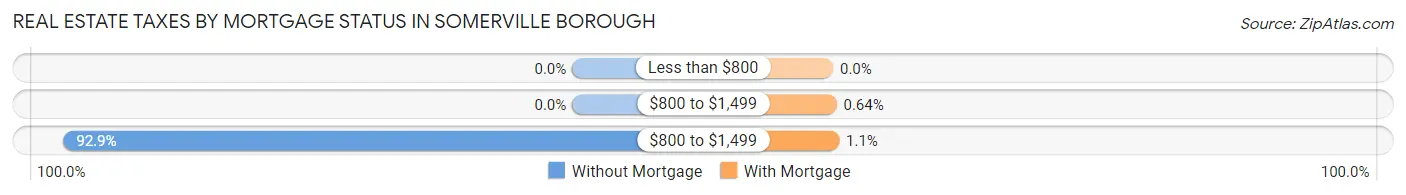
| Property Taxes | Without Mortgage | With Mortgage |
| Less than $800 | 0 (0.0%) | 0 (0.0%) |
| $800 to $1,499 | 0 (0.0%) | 11 (0.6%) |
| $800 to $1,499 | 604 (92.9%) | 19 (1.1%) |
| Total | 650 (100.0%) | 1,715 (100.0%) |
Health & Disability in Somerville borough
Health Insurance Coverage by Age in Somerville borough
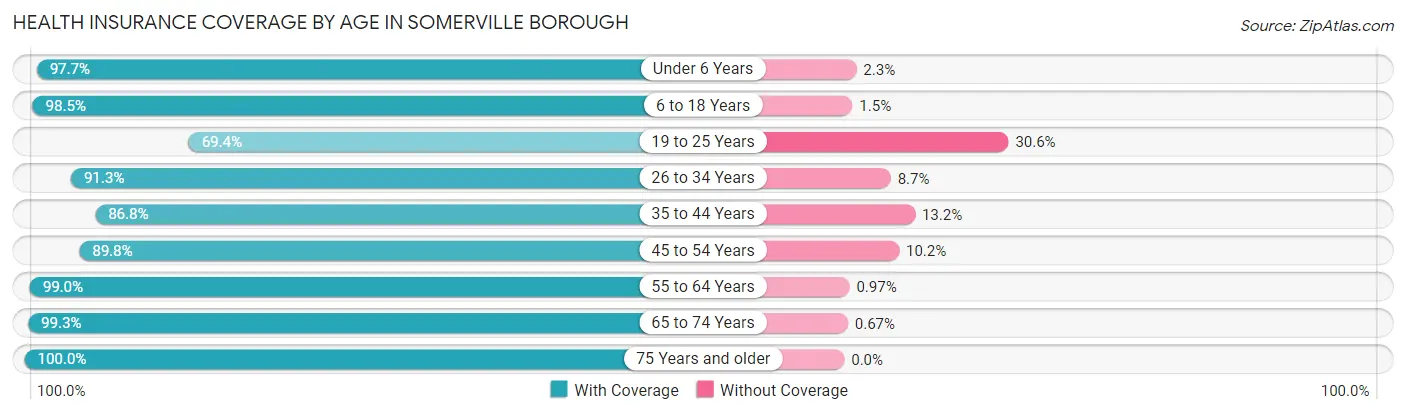
| Age Bracket | With Coverage | Without Coverage |
| Under 6 Years | 953 (97.7%) | 22 (2.3%) |
| 6 to 18 Years | 1,562 (98.5%) | 24 (1.5%) |
| 19 to 25 Years | 621 (69.4%) | 274 (30.6%) |
| 26 to 34 Years | 2,372 (91.3%) | 225 (8.7%) |
| 35 to 44 Years | 1,732 (86.8%) | 263 (13.2%) |
| 45 to 54 Years | 1,152 (89.8%) | 131 (10.2%) |
| 55 to 64 Years | 1,322 (99.0%) | 13 (1.0%) |
| 65 to 74 Years | 739 (99.3%) | 5 (0.7%) |
| 75 Years and older | 886 (100.0%) | 0 (0.0%) |
| Total | 11,339 (92.2%) | 957 (7.8%) |
Health Insurance Coverage by Citizenship Status in Somerville borough
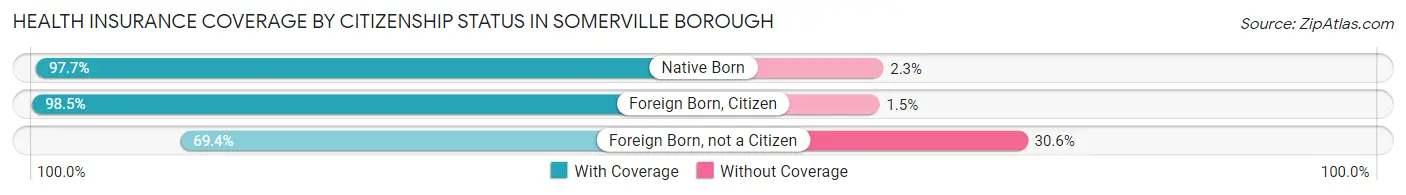
| Citizenship Status | With Coverage | Without Coverage |
| Native Born | 953 (97.7%) | 22 (2.3%) |
| Foreign Born, Citizen | 1,562 (98.5%) | 24 (1.5%) |
| Foreign Born, not a Citizen | 621 (69.4%) | 274 (30.6%) |
Health Insurance Coverage by Household Income in Somerville borough
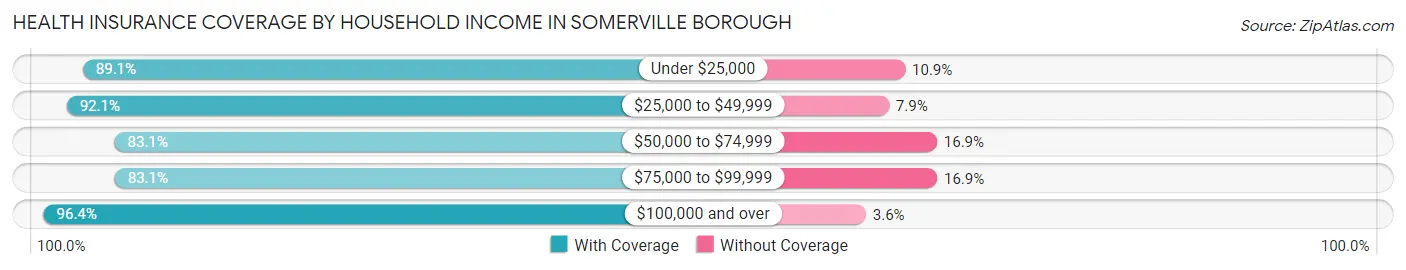
| Household Income | With Coverage | Without Coverage |
| Under $25,000 | 522 (89.1%) | 64 (10.9%) |
| $25,000 to $49,999 | 899 (92.1%) | 77 (7.9%) |
| $50,000 to $74,999 | 838 (83.1%) | 170 (16.9%) |
| $75,000 to $99,999 | 1,828 (83.1%) | 372 (16.9%) |
| $100,000 and over | 7,112 (96.4%) | 263 (3.6%) |
Public vs Private Health Insurance Coverage by Age in Somerville borough
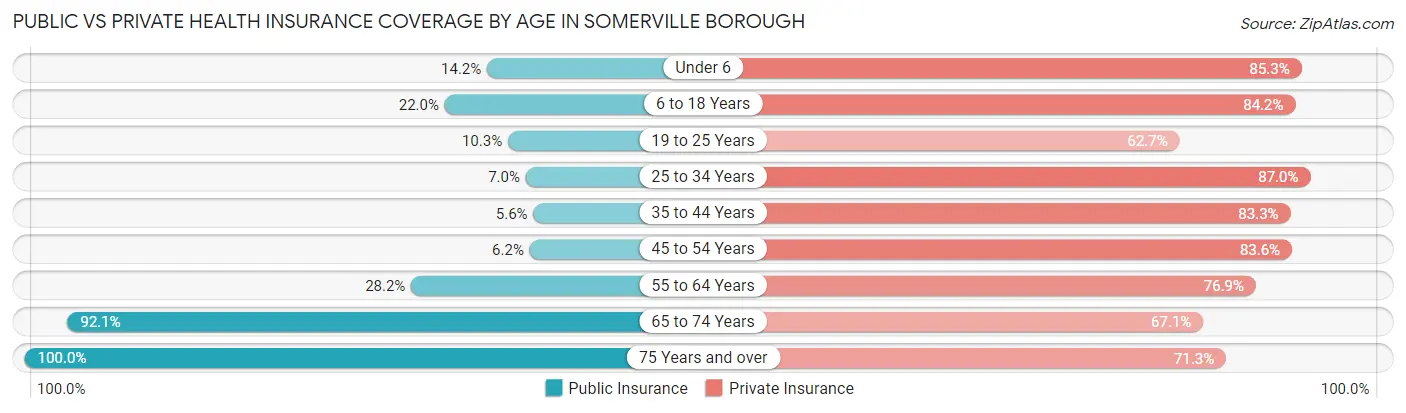
| Age Bracket | Public Insurance | Private Insurance |
| Under 6 | 138 (14.1%) | 832 (85.3%) |
| 6 to 18 Years | 349 (22.0%) | 1,335 (84.2%) |
| 19 to 25 Years | 92 (10.3%) | 561 (62.7%) |
| 25 to 34 Years | 181 (7.0%) | 2,258 (87.0%) |
| 35 to 44 Years | 111 (5.6%) | 1,661 (83.3%) |
| 45 to 54 Years | 80 (6.2%) | 1,072 (83.6%) |
| 55 to 64 Years | 377 (28.2%) | 1,026 (76.8%) |
| 65 to 74 Years | 685 (92.1%) | 499 (67.1%) |
| 75 Years and over | 886 (100.0%) | 632 (71.3%) |
| Total | 2,899 (23.6%) | 9,876 (80.3%) |
Disability Status by Sex by Age in Somerville borough
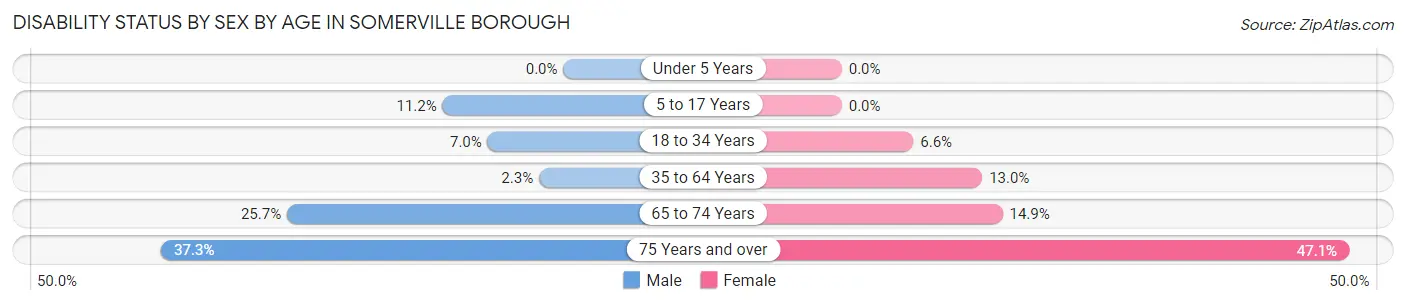
| Age Bracket | Male | Female |
| Under 5 Years | 0 (0.0%) | 0 (0.0%) |
| 5 to 17 Years | 100 (11.2%) | 0 (0.0%) |
| 18 to 34 Years | 137 (7.0%) | 113 (6.6%) |
| 35 to 64 Years | 58 (2.3%) | 266 (13.0%) |
| 65 to 74 Years | 98 (25.7%) | 54 (14.9%) |
| 75 Years and over | 115 (37.3%) | 272 (47.1%) |
Disability Class by Sex by Age in Somerville borough
Disability Class: Hearing Difficulty
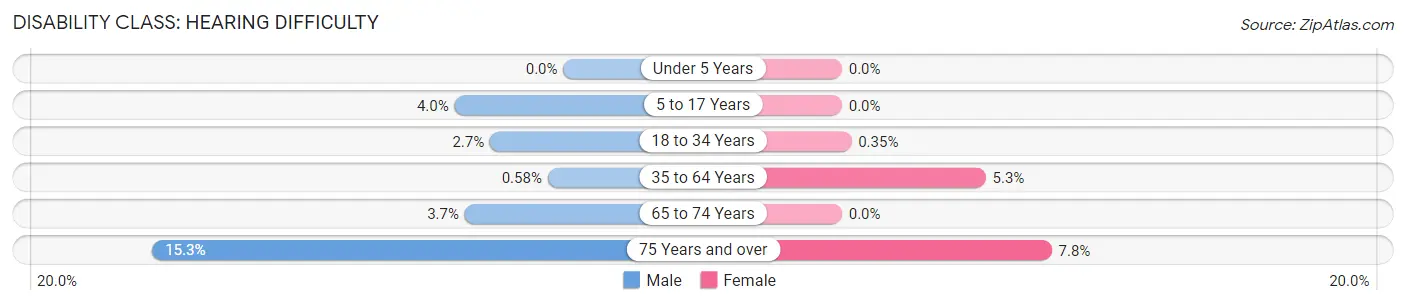
| Age Bracket | Male | Female |
| Under 5 Years | 0 (0.0%) | 0 (0.0%) |
| 5 to 17 Years | 36 (4.0%) | 0 (0.0%) |
| 18 to 34 Years | 53 (2.7%) | 6 (0.4%) |
| 35 to 64 Years | 15 (0.6%) | 109 (5.3%) |
| 65 to 74 Years | 14 (3.7%) | 0 (0.0%) |
| 75 Years and over | 47 (15.3%) | 45 (7.8%) |
Disability Class: Vision Difficulty
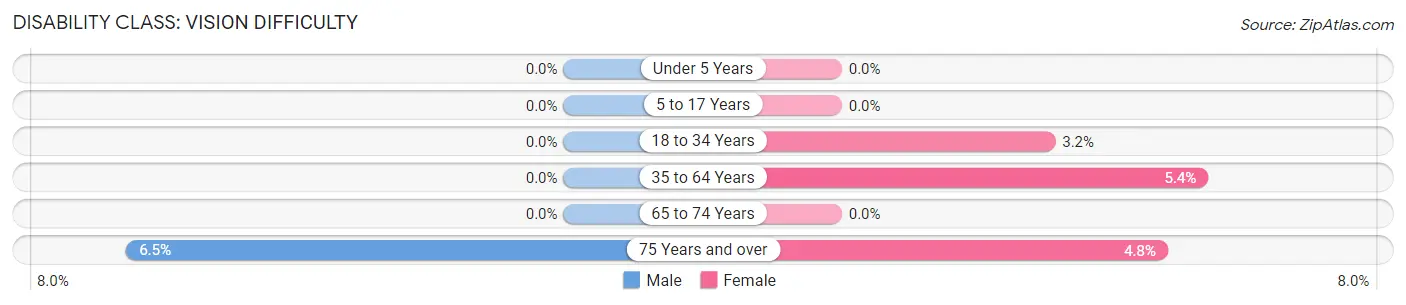
| Age Bracket | Male | Female |
| Under 5 Years | 0 (0.0%) | 0 (0.0%) |
| 5 to 17 Years | 0 (0.0%) | 0 (0.0%) |
| 18 to 34 Years | 0 (0.0%) | 54 (3.2%) |
| 35 to 64 Years | 0 (0.0%) | 111 (5.4%) |
| 65 to 74 Years | 0 (0.0%) | 0 (0.0%) |
| 75 Years and over | 20 (6.5%) | 28 (4.8%) |
Disability Class: Cognitive Difficulty
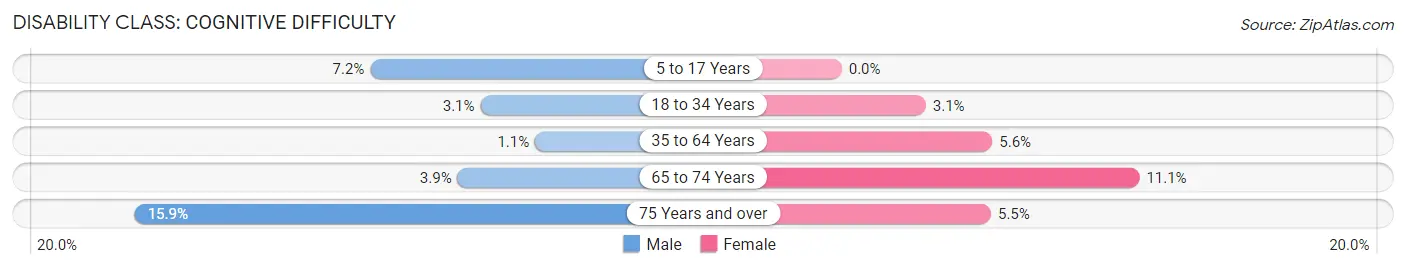
| Age Bracket | Male | Female |
| 5 to 17 Years | 64 (7.2%) | 0 (0.0%) |
| 18 to 34 Years | 60 (3.1%) | 53 (3.1%) |
| 35 to 64 Years | 27 (1.1%) | 114 (5.6%) |
| 65 to 74 Years | 15 (3.9%) | 40 (11.1%) |
| 75 Years and over | 49 (15.9%) | 32 (5.5%) |
Disability Class: Ambulatory Difficulty
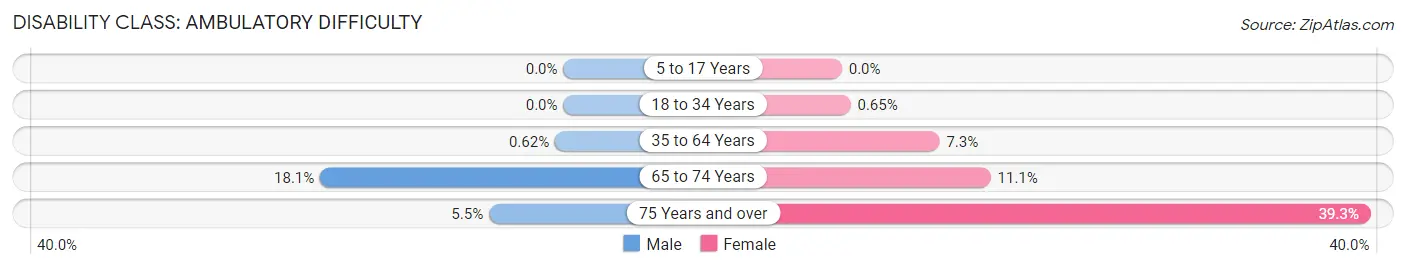
| Age Bracket | Male | Female |
| 5 to 17 Years | 0 (0.0%) | 0 (0.0%) |
| 18 to 34 Years | 0 (0.0%) | 11 (0.6%) |
| 35 to 64 Years | 16 (0.6%) | 148 (7.2%) |
| 65 to 74 Years | 69 (18.1%) | 40 (11.1%) |
| 75 Years and over | 17 (5.5%) | 227 (39.3%) |
Disability Class: Self-Care Difficulty
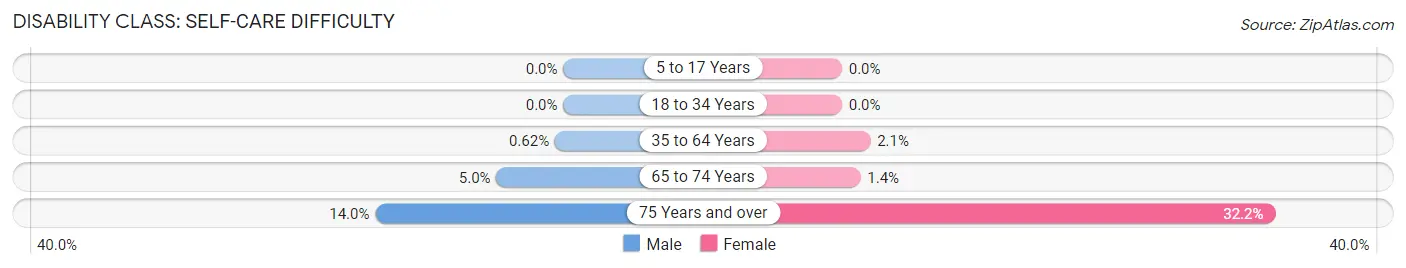
| Age Bracket | Male | Female |
| 5 to 17 Years | 0 (0.0%) | 0 (0.0%) |
| 18 to 34 Years | 0 (0.0%) | 0 (0.0%) |
| 35 to 64 Years | 16 (0.6%) | 43 (2.1%) |
| 65 to 74 Years | 19 (5.0%) | 5 (1.4%) |
| 75 Years and over | 43 (14.0%) | 186 (32.2%) |
Technology Access in Somerville borough
Computing Device Access in Somerville borough
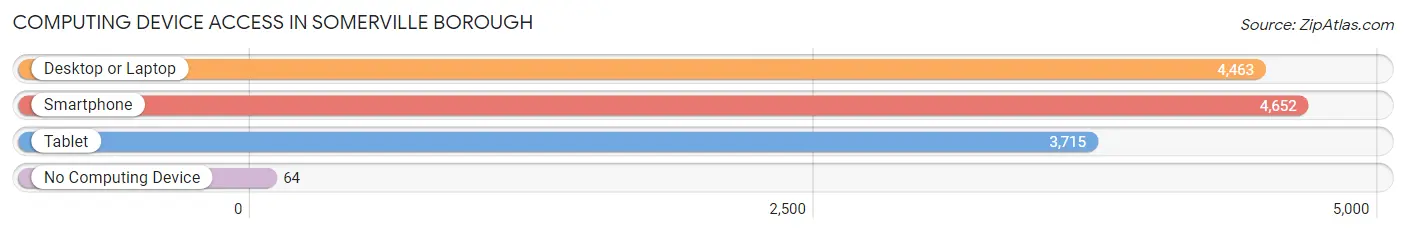
| Device Type | # Households | % Households |
| Desktop or Laptop | 4,463 | 86.9% |
| Smartphone | 4,652 | 90.6% |
| Tablet | 3,715 | 72.4% |
| No Computing Device | 64 | 1.3% |
| Total | 5,135 | 100.0% |
Internet Access in Somerville borough
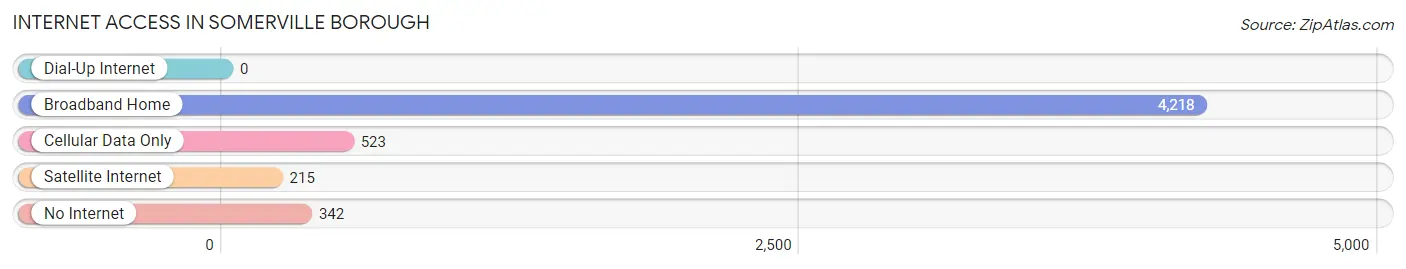
| Internet Type | # Households | % Households |
| Dial-Up Internet | 0 | 0.0% |
| Broadband Home | 4,218 | 82.1% |
| Cellular Data Only | 523 | 10.2% |
| Satellite Internet | 215 | 4.2% |
| No Internet | 342 | 6.7% |
| Total | 5,135 | 100.0% |
Somerville borough Summary
Somerville Borough is a small borough located in Somerset County, New Jersey. It is situated in the Raritan Valley region of Central New Jersey, and is part of the larger New York metropolitan area. The borough is home to a population of 12,098 people, as of the 2010 United States Census.
History
Somerville was first settled in 1701 by Dutch and English settlers. The town was originally known as Vlissingen, after the Dutch city of the same name. The town was renamed Somerville in 1809, after the English statesman and soldier, Lord Somerville. The town was officially incorporated as a borough in 1863.
In the late 19th century, Somerville was a major center of industry, with several factories and mills located in the area. The town was also home to a large number of immigrants, particularly from Italy and Eastern Europe. The town's population grew rapidly during this period, and by the early 20th century, Somerville had become a bustling small city.
In the mid-20th century, Somerville began to decline economically, as many of its factories and mills closed down. The town's population also began to decline, as many of its residents moved away in search of better economic opportunities. In recent years, however, Somerville has seen a resurgence in its economy, as new businesses have moved into the area.
Geography
Somerville is located in central New Jersey, in the Raritan Valley region. The borough is situated on the banks of the Raritan River, and is bordered by Bridgewater Township to the north, Hillsborough Township to the east, Manville Borough to the south, and Branchburg Township to the west.
The borough covers an area of 2.7 square miles, and is home to a population of 12,098 people, as of the 2010 United States Census. The town is located approximately 25 miles southwest of Newark, and 40 miles southwest of New York City.
Economy
Somerville's economy is largely based on the service industry, with many of its residents employed in retail, healthcare, and education. The borough is also home to several small businesses, including restaurants, shops, and professional services.
The borough is also home to several large employers, including Johnson & Johnson, Robert Wood Johnson University Hospital, and the Somerset County government.
Demographics
As of the 2010 United States Census, Somerville had a population of 12,098 people. The racial makeup of the borough was 79.2% White, 8.3% African American, 0.3% Native American, 5.2% Asian, and 6.9% from other races. Hispanic or Latino of any race were 15.2% of the population.
The median household income in Somerville was $68,945, and the median family income was $80,945. The per capita income was $32,945. About 5.2% of families and 7.2% of the population were below the poverty line.
Common Questions
What is Per Capita Income in Somerville borough?
Per Capita income in Somerville borough is $51,250.
What is the Median Family Income in Somerville borough?
Median Family Income in Somerville borough is $114,946.
What is the Median Household income in Somerville borough?
Median Household Income in Somerville borough is $102,423.
What is Income or Wage Gap in Somerville borough?
Income or Wage Gap in Somerville borough is 11.8%.
Women in Somerville borough earn 88.2 cents for every dollar earned by a man.
What is Inequality or Gini Index in Somerville borough?
Inequality or Gini Index in Somerville borough is 0.40.
What is the Total Population of Somerville borough?
Total Population of Somerville borough is 12,467.
What is the Total Male Population of Somerville borough?
Total Male Population of Somerville borough is 6,569.
What is the Total Female Population of Somerville borough?
Total Female Population of Somerville borough is 5,898.
What is the Ratio of Males per 100 Females in Somerville borough?
There are 111.38 Males per 100 Females in Somerville borough.
What is the Ratio of Females per 100 Males in Somerville borough?
There are 89.79 Females per 100 Males in Somerville borough.
What is the Median Population Age in Somerville borough?
Median Population Age in Somerville borough is 35.4 Years.
What is the Average Family Size in Somerville borough
Average Family Size in Somerville borough is 3.1 People.
What is the Average Household Size in Somerville borough
Average Household Size in Somerville borough is 2.4 People.
How Large is the Labor Force in Somerville borough?
There are 7,621 People in the Labor Forcein in Somerville borough.
What is the Percentage of People in the Labor Force in Somerville borough?
73.6% of People are in the Labor Force in Somerville borough.
What is the Unemployment Rate in Somerville borough?
Unemployment Rate in Somerville borough is 3.6%.