Hope, NJ Map & Demographics
Hope Map
Hope Overview
$40,773
PER CAPITA INCOME
$77,361
AVG HOUSEHOLD INCOME
0.30
INEQUALITY / GINI INDEX
219
TOTAL POPULATION
120
MALE POPULATION
99
FEMALE POPULATION
121.21
MALES / 100 FEMALES
82.50
FEMALES / 100 MALES
54.9
MEDIAN AGE
2.7
AVG FAMILY SIZE
2.2
AVG HOUSEHOLD SIZE
163
LABOR FORCE [ PEOPLE ]
76.2%
PERCENT IN LABOR FORCE
Hope Zip Codes
Hope Area Codes
Income in Hope
Income Overview in Hope
| Characteristic | Number | Measure |
| Per Capita Income | 219 | $40,773 |
| Median Family Income | 58 | $0 |
| Mean Family Income | 58 | $102,083 |
| Median Household Income | 98 | $77,361 |
| Mean Household Income | 98 | $97,460 |
| Income Deficit | 58 | $0 |
| Wage / Income Gap (%) | 219 | 0.00% |
| Wage / Income Gap ($) | 219 | 100.00¢ per $1 |
| Gini / Inequality Index | 219 | 0.30 |
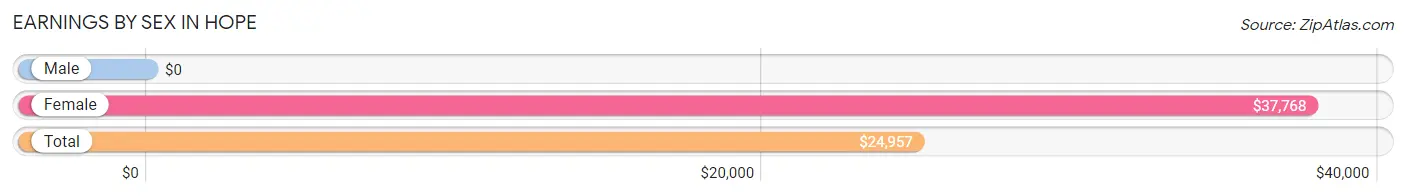
Earnings by Sex in Hope
| Sex | Number | Average Earnings |
| Male | 114 (63.7%) | $0 |
| Female | 65 (36.3%) | $37,768 |
| Total | 179 (100.0%) | $24,957 |
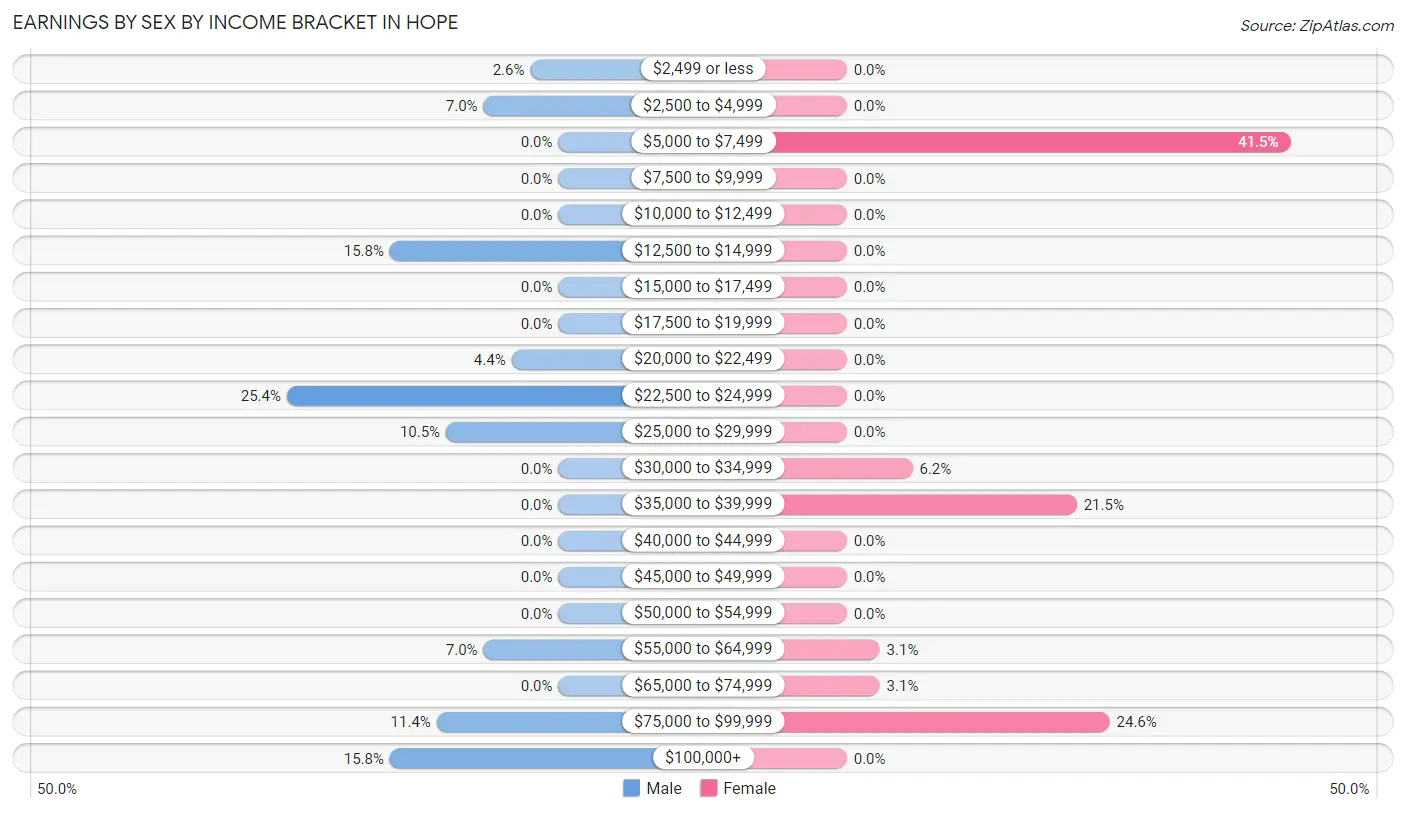
Earnings by Sex by Income Bracket in Hope
The most common earnings brackets in Hope are $22,500 to $24,999 for men (29 | 25.4%) and $5,000 to $7,499 for women (27 | 41.5%).
| Income | Male | Female |
| $2,499 or less | 3 (2.6%) | 0 (0.0%) |
| $2,500 to $4,999 | 8 (7.0%) | 0 (0.0%) |
| $5,000 to $7,499 | 0 (0.0%) | 27 (41.5%) |
| $7,500 to $9,999 | 0 (0.0%) | 0 (0.0%) |
| $10,000 to $12,499 | 0 (0.0%) | 0 (0.0%) |
| $12,500 to $14,999 | 18 (15.8%) | 0 (0.0%) |
| $15,000 to $17,499 | 0 (0.0%) | 0 (0.0%) |
| $17,500 to $19,999 | 0 (0.0%) | 0 (0.0%) |
| $20,000 to $22,499 | 5 (4.4%) | 0 (0.0%) |
| $22,500 to $24,999 | 29 (25.4%) | 0 (0.0%) |
| $25,000 to $29,999 | 12 (10.5%) | 0 (0.0%) |
| $30,000 to $34,999 | 0 (0.0%) | 4 (6.1%) |
| $35,000 to $39,999 | 0 (0.0%) | 14 (21.5%) |
| $40,000 to $44,999 | 0 (0.0%) | 0 (0.0%) |
| $45,000 to $49,999 | 0 (0.0%) | 0 (0.0%) |
| $50,000 to $54,999 | 0 (0.0%) | 0 (0.0%) |
| $55,000 to $64,999 | 8 (7.0%) | 2 (3.1%) |
| $65,000 to $74,999 | 0 (0.0%) | 2 (3.1%) |
| $75,000 to $99,999 | 13 (11.4%) | 16 (24.6%) |
| $100,000+ | 18 (15.8%) | 0 (0.0%) |
| Total | 114 (100.0%) | 65 (100.0%) |
Earnings by Sex by Educational Attainment in Hope
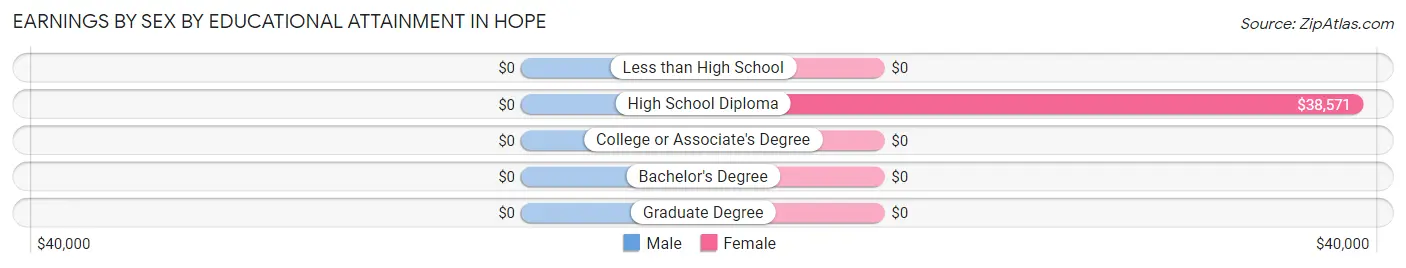
| Educational Attainment | Male Income | Female Income |
| Less than High School | - | - |
| High School Diploma | - | - |
| College or Associate's Degree | - | - |
| Bachelor's Degree | - | - |
| Graduate Degree | - | - |
| Total | - | - |
Family Income in Hope
Family Income Brackets in Hope
According to the Hope family income data, there are 17 families falling into the $50,000 to $74,999 income range, which is the most common income bracket and makes up 29.3% of all families.
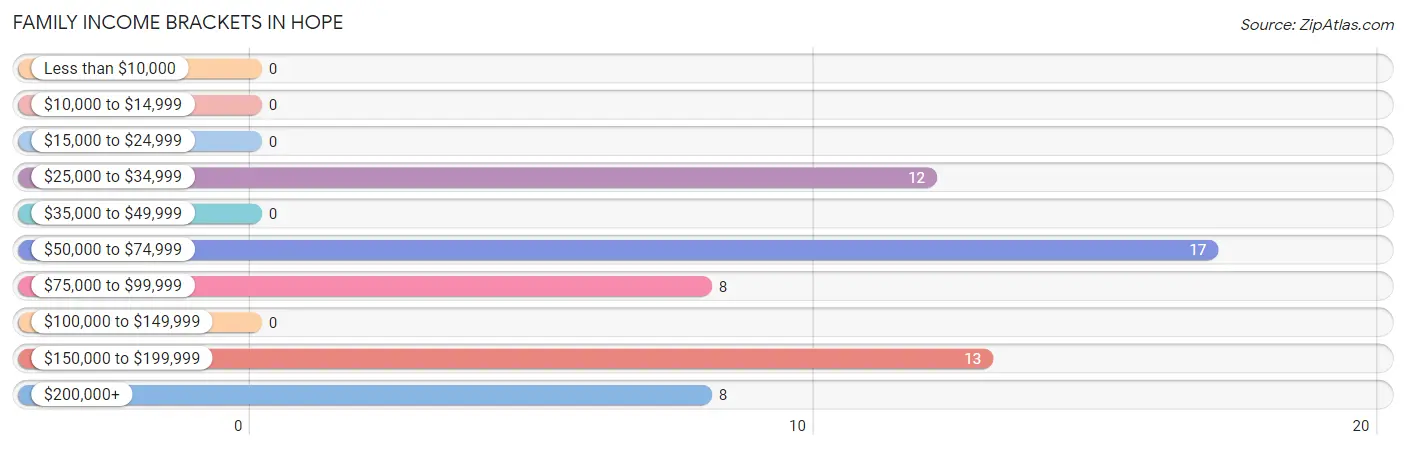
| Income Bracket | # Families | % Families |
| Less than $10,000 | 0 | 0.0% |
| $10,000 to $14,999 | 0 | 0.0% |
| $15,000 to $24,999 | 0 | 0.0% |
| $25,000 to $34,999 | 12 | 20.7% |
| $35,000 to $49,999 | 0 | 0.0% |
| $50,000 to $74,999 | 17 | 29.3% |
| $75,000 to $99,999 | 8 | 13.8% |
| $100,000 to $149,999 | 0 | 0.0% |
| $150,000 to $199,999 | 13 | 22.4% |
| $200,000+ | 8 | 13.8% |
Family Income by Famaliy Size in Hope
4-person families (18 | 31.0%) account for the highest median family income in Hope with $161,250 per family, while 4-person families (18 | 31.0%) have the highest median income of $40,312 per family member.
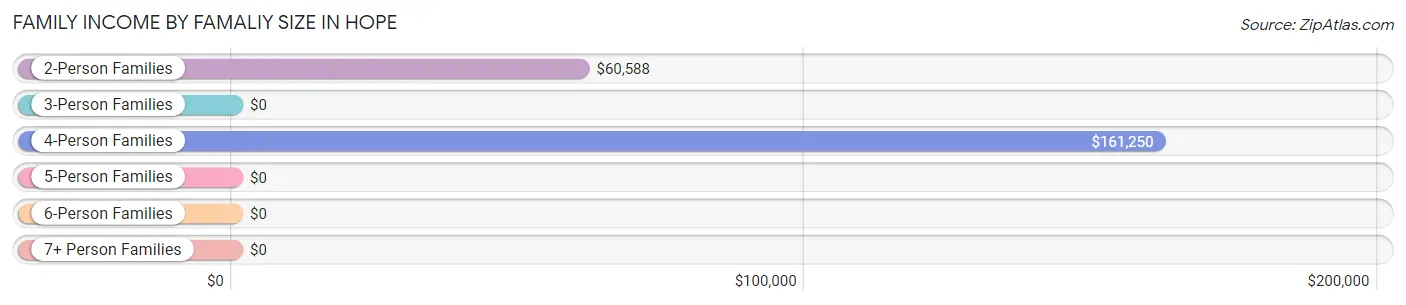
| Income Bracket | # Families | Median Income |
| 2-Person Families | 32 (55.2%) | $60,588 |
| 3-Person Families | 8 (13.8%) | $0 |
| 4-Person Families | 18 (31.0%) | $161,250 |
| 5-Person Families | 0 (0.0%) | $0 |
| 6-Person Families | 0 (0.0%) | $0 |
| 7+ Person Families | 0 (0.0%) | $0 |
| Total | 58 (100.0%) | $0 |
Family Income by Number of Earners in Hope
| Number of Earners | # Families | Median Income |
| No Earners | 3 (5.2%) | $0 |
| 1 Earner | 12 (20.7%) | $0 |
| 2 Earners | 30 (51.7%) | $0 |
| 3+ Earners | 13 (22.4%) | $0 |
| Total | 58 (100.0%) | $0 |
Household Income in Hope
Household Income Brackets in Hope
With 35 households falling in the category, the $75,000 to $99,999 income range is the most frequent in Hope, accounting for 35.7% of all households.
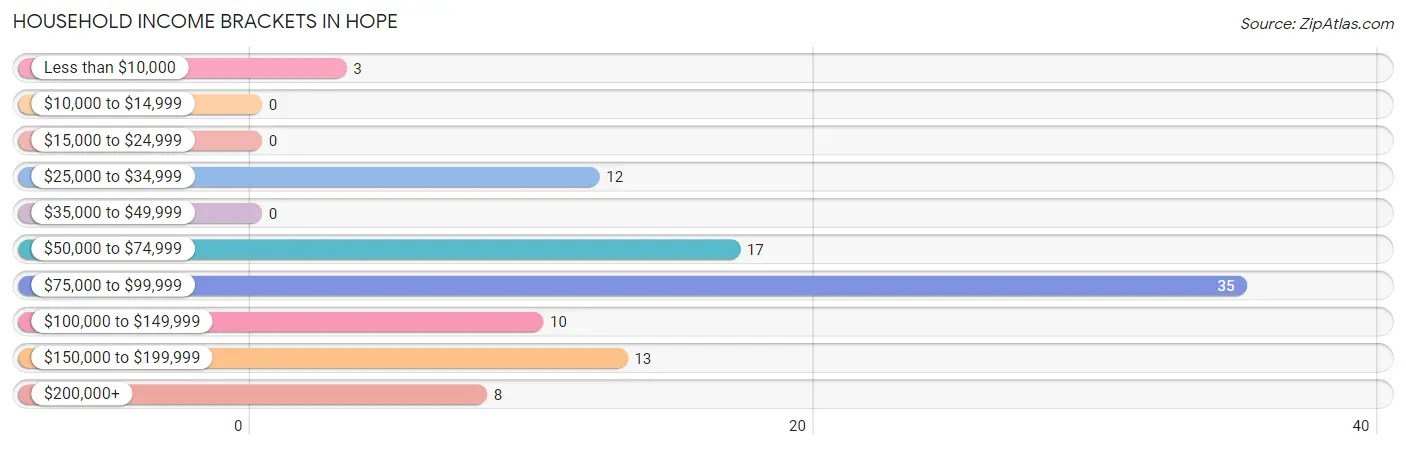
| Income Bracket | # Households | % Households |
| Less than $10,000 | 3 | 3.1% |
| $10,000 to $14,999 | 0 | 0.0% |
| $15,000 to $24,999 | 0 | 0.0% |
| $25,000 to $34,999 | 12 | 12.2% |
| $35,000 to $49,999 | 0 | 0.0% |
| $50,000 to $74,999 | 17 | 17.3% |
| $75,000 to $99,999 | 35 | 35.7% |
| $100,000 to $149,999 | 10 | 10.2% |
| $150,000 to $199,999 | 13 | 13.3% |
| $200,000+ | 8 | 8.2% |
Household Income by Householder Age in Hope
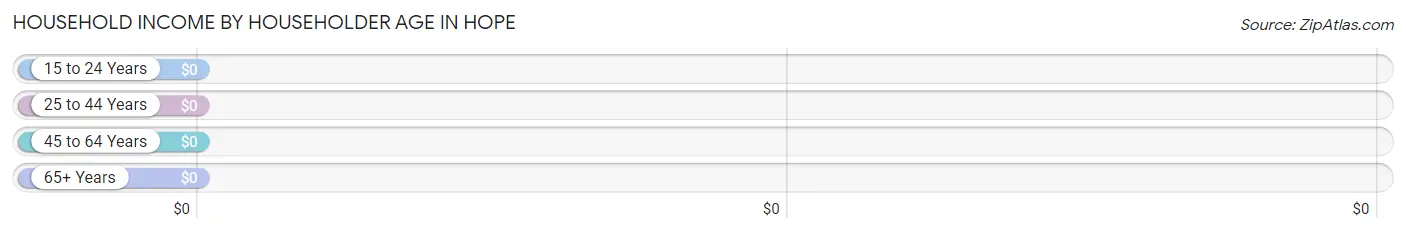
| Income Bracket | # Households | Median Income |
| 15 to 24 Years | 18 (18.4%) | $0 |
| 25 to 44 Years | 0 (0.0%) | $0 |
| 45 to 64 Years | 49 (50.0%) | $0 |
| 65+ Years | 31 (31.6%) | $0 |
| Total | 98 (100.0%) | $77,361 |
Poverty in Hope
Income Below Poverty by Sex and Age in Hope
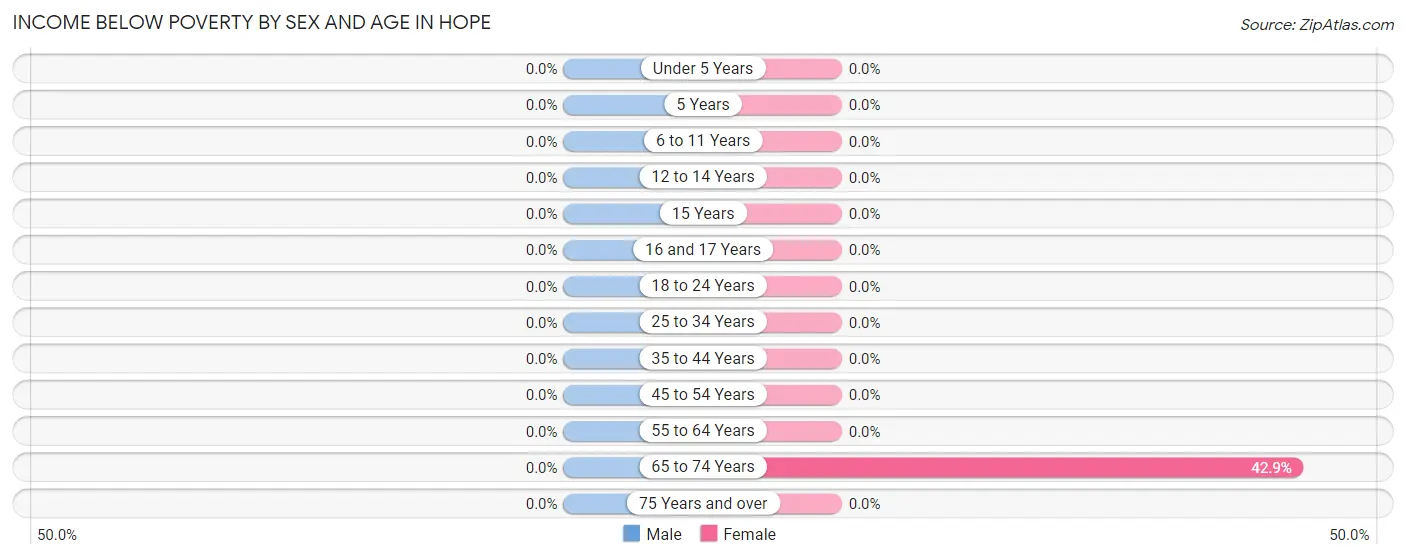
| Age Bracket | Male | Female |
| Under 5 Years | 0 (0.0%) | 0 (0.0%) |
| 5 Years | 0 (0.0%) | 0 (0.0%) |
| 6 to 11 Years | 0 (0.0%) | 0 (0.0%) |
| 12 to 14 Years | 0 (0.0%) | 0 (0.0%) |
| 15 Years | 0 (0.0%) | 0 (0.0%) |
| 16 and 17 Years | 0 (0.0%) | 0 (0.0%) |
| 18 to 24 Years | 0 (0.0%) | 0 (0.0%) |
| 25 to 34 Years | 0 (0.0%) | 0 (0.0%) |
| 35 to 44 Years | 0 (0.0%) | 0 (0.0%) |
| 45 to 54 Years | 0 (0.0%) | 0 (0.0%) |
| 55 to 64 Years | 0 (0.0%) | 0 (0.0%) |
| 65 to 74 Years | 0 (0.0%) | 3 (42.9%) |
| 75 Years and over | 0 (0.0%) | 0 (0.0%) |
| Total | 0 (0.0%) | 3 (3.0%) |
Income Above Poverty by Sex and Age in Hope
According to the poverty statistics in Hope, males aged 18 to 24 years and females aged 12 to 14 years are the age groups that are most secure financially, with 100.0% of males and 100.0% of females in these age groups living above the poverty line.
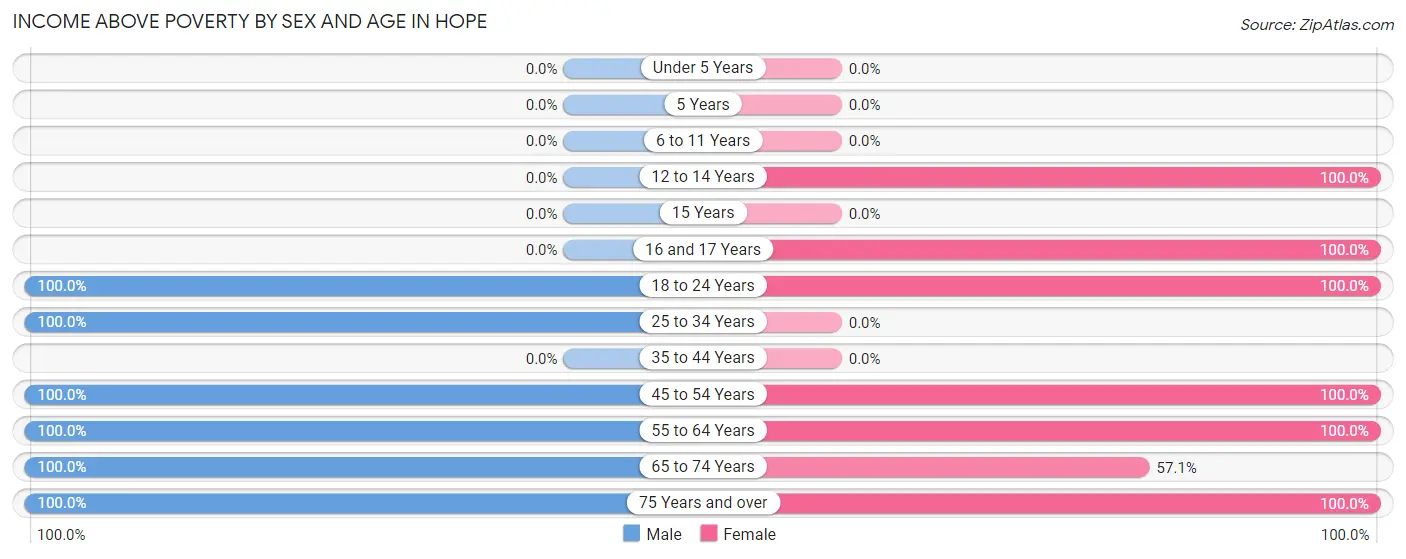
| Age Bracket | Male | Female |
| Under 5 Years | 0 (0.0%) | 0 (0.0%) |
| 5 Years | 0 (0.0%) | 0 (0.0%) |
| 6 to 11 Years | 0 (0.0%) | 0 (0.0%) |
| 12 to 14 Years | 0 (0.0%) | 5 (100.0%) |
| 15 Years | 0 (0.0%) | 0 (0.0%) |
| 16 and 17 Years | 0 (0.0%) | 5 (100.0%) |
| 18 to 24 Years | 50 (100.0%) | 10 (100.0%) |
| 25 to 34 Years | 8 (100.0%) | 0 (0.0%) |
| 35 to 44 Years | 0 (0.0%) | 0 (0.0%) |
| 45 to 54 Years | 8 (100.0%) | 25 (100.0%) |
| 55 to 64 Years | 38 (100.0%) | 23 (100.0%) |
| 65 to 74 Years | 13 (100.0%) | 4 (57.1%) |
| 75 Years and over | 3 (100.0%) | 24 (100.0%) |
| Total | 120 (100.0%) | 96 (97.0%) |
Income Below Poverty Among Married-Couple Families in Hope
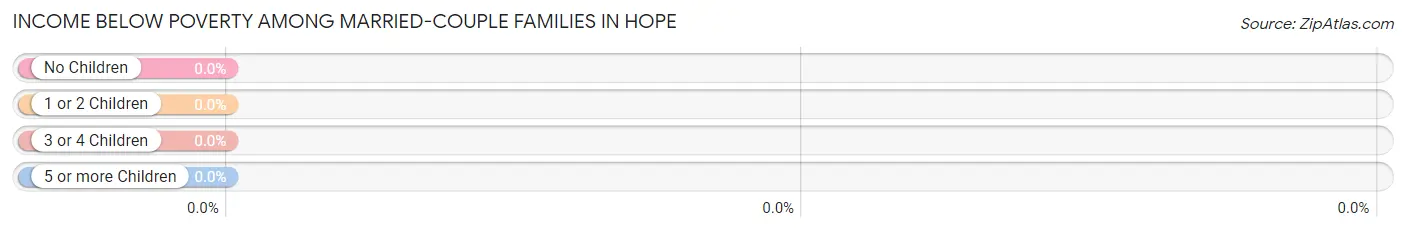
| Children | Above Poverty | Below Poverty |
| No Children | 18 (100.0%) | 0 (0.0%) |
| 1 or 2 Children | 14 (100.0%) | 0 (0.0%) |
| 3 or 4 Children | 0 (0.0%) | 0 (0.0%) |
| 5 or more Children | 0 (0.0%) | 0 (0.0%) |
| Total | 32 (100.0%) | 0 (0.0%) |
Income Below Poverty Among Single-Parent Households in Hope
| Children | Single Father | Single Mother |
| No Children | 0 (0.0%) | 0 (0.0%) |
| 1 or 2 Children | 0 (0.0%) | 0 (0.0%) |
| 3 or 4 Children | 0 (0.0%) | 0 (0.0%) |
| 5 or more Children | 0 (0.0%) | 0 (0.0%) |
| Total | 0 (0.0%) | 0 (0.0%) |
Income Below Poverty Among Married-Couple vs Single-Parent Households in Hope
| Children | Married-Couple Families | Single-Parent Households |
| No Children | 0 (0.0%) | 0 (0.0%) |
| 1 or 2 Children | 0 (0.0%) | 0 (0.0%) |
| 3 or 4 Children | 0 (0.0%) | 0 (0.0%) |
| 5 or more Children | 0 (0.0%) | 0 (0.0%) |
| Total | 0 (0.0%) | 0 (0.0%) |
Race in Hope
The most populous races in Hope are White / Caucasian (162 | 74.0%), Asian (41 | 18.7%), and Hispanic or Latino (38 | 17.3%).
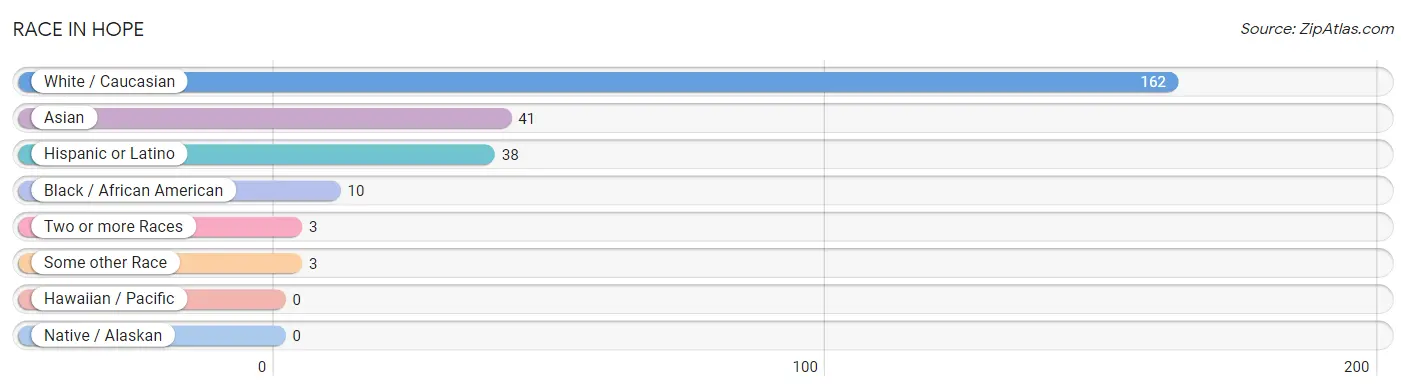
| Race | # Population | % Population |
| Asian | 41 | 18.7% |
| Black / African American | 10 | 4.6% |
| Hawaiian / Pacific | 0 | 0.0% |
| Hispanic or Latino | 38 | 17.3% |
| Native / Alaskan | 0 | 0.0% |
| White / Caucasian | 162 | 74.0% |
| Two or more Races | 3 | 1.4% |
| Some other Race | 3 | 1.4% |
| Total | 219 | 100.0% |
Ancestry in Hope
The most populous ancestries reported in Hope are English (65 | 29.7%), Thai (41 | 18.7%), German (38 | 17.3%), Irish (38 | 17.3%), and Cuban (24 | 11.0%), together accounting for 94.1% of all Hope residents.
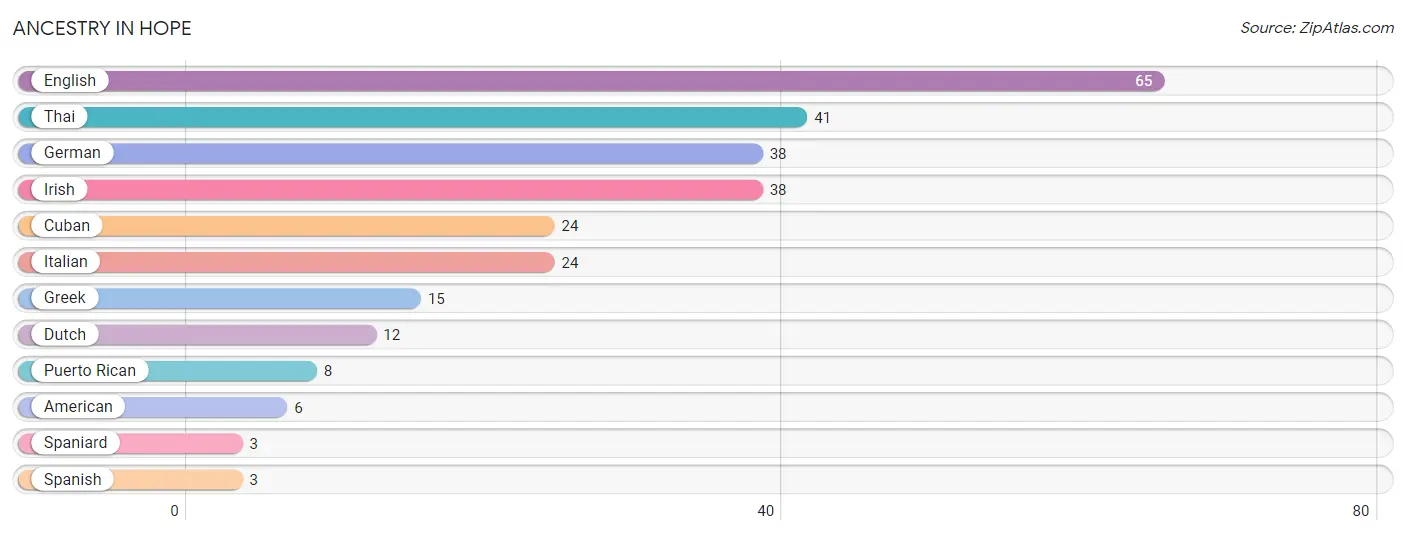
| Ancestry | # Population | % Population |
| American | 6 | 2.7% |
| Cuban | 24 | 11.0% |
| Dutch | 12 | 5.5% |
| English | 65 | 29.7% |
| German | 38 | 17.3% |
| Greek | 15 | 6.9% |
| Irish | 38 | 17.3% |
| Italian | 24 | 11.0% |
| Puerto Rican | 8 | 3.6% |
| Spaniard | 3 | 1.4% |
| Spanish | 3 | 1.4% |
| Thai | 41 | 18.7% | View All 12 Rows |
Immigrants in Hope
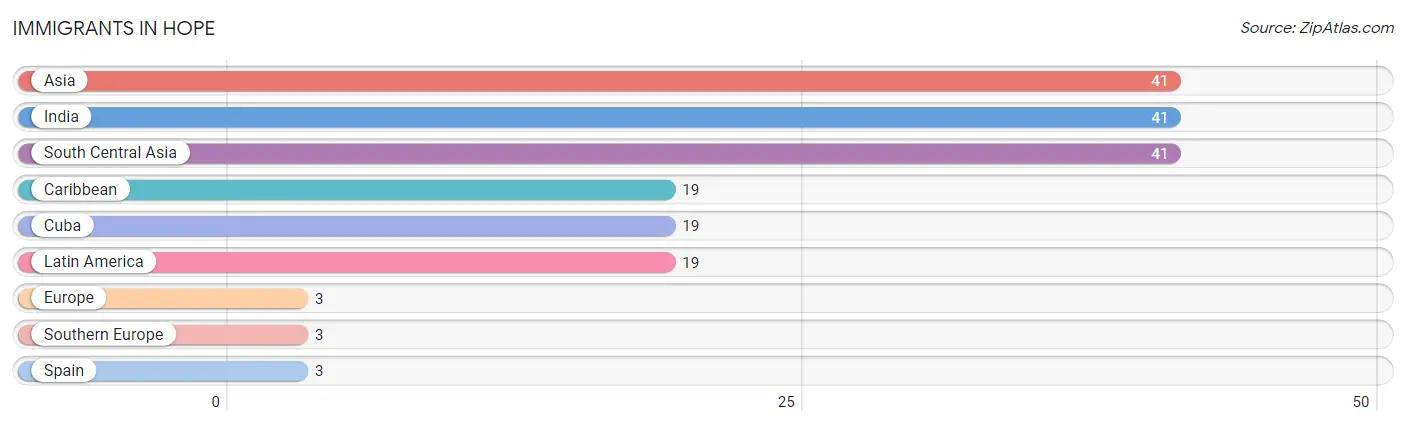
The most numerous immigrant groups reported in Hope came from Asia (41 | 18.7%), India (41 | 18.7%), South Central Asia (41 | 18.7%), Caribbean (19 | 8.7%), and Cuba (19 | 8.7%), together accounting for 73.5% of all Hope residents.
| Immigration Origin | # Population | % Population |
| Asia | 41 | 18.7% |
| Caribbean | 19 | 8.7% |
| Cuba | 19 | 8.7% |
| Europe | 3 | 1.4% |
| India | 41 | 18.7% |
| Latin America | 19 | 8.7% |
| South Central Asia | 41 | 18.7% |
| Southern Europe | 3 | 1.4% |
| Spain | 3 | 1.4% | View All 9 Rows |
Sex and Age in Hope
Sex and Age in Hope
The most populous age groups in Hope are 20 to 24 Years (32 | 26.7%) for men and 50 to 54 Years (23 | 23.2%) for women.
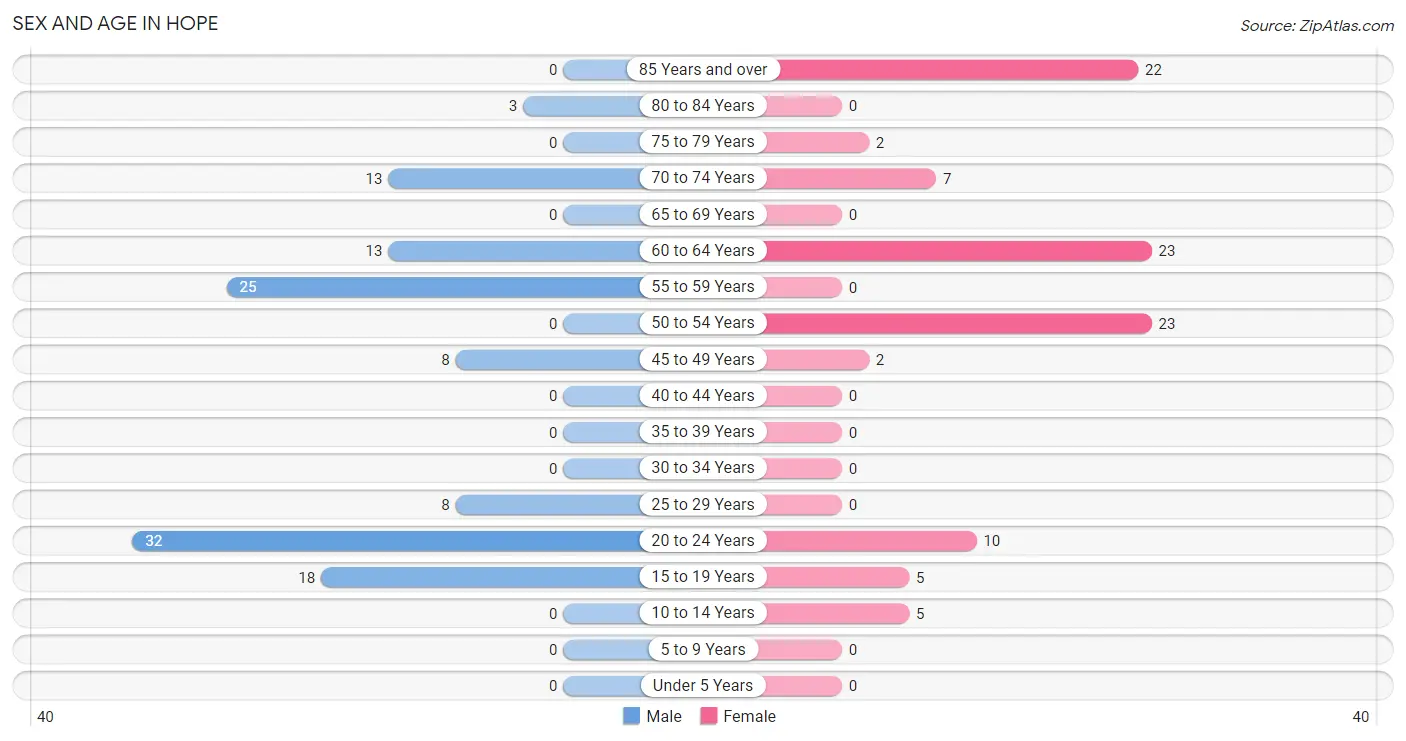
| Age Bracket | Male | Female |
| Under 5 Years | 0 (0.0%) | 0 (0.0%) |
| 5 to 9 Years | 0 (0.0%) | 0 (0.0%) |
| 10 to 14 Years | 0 (0.0%) | 5 (5.1%) |
| 15 to 19 Years | 18 (15.0%) | 5 (5.1%) |
| 20 to 24 Years | 32 (26.7%) | 10 (10.1%) |
| 25 to 29 Years | 8 (6.7%) | 0 (0.0%) |
| 30 to 34 Years | 0 (0.0%) | 0 (0.0%) |
| 35 to 39 Years | 0 (0.0%) | 0 (0.0%) |
| 40 to 44 Years | 0 (0.0%) | 0 (0.0%) |
| 45 to 49 Years | 8 (6.7%) | 2 (2.0%) |
| 50 to 54 Years | 0 (0.0%) | 23 (23.2%) |
| 55 to 59 Years | 25 (20.8%) | 0 (0.0%) |
| 60 to 64 Years | 13 (10.8%) | 23 (23.2%) |
| 65 to 69 Years | 0 (0.0%) | 0 (0.0%) |
| 70 to 74 Years | 13 (10.8%) | 7 (7.1%) |
| 75 to 79 Years | 0 (0.0%) | 2 (2.0%) |
| 80 to 84 Years | 3 (2.5%) | 0 (0.0%) |
| 85 Years and over | 0 (0.0%) | 22 (22.2%) |
| Total | 120 (100.0%) | 99 (100.0%) |
Families and Households in Hope
Median Family Size in Hope
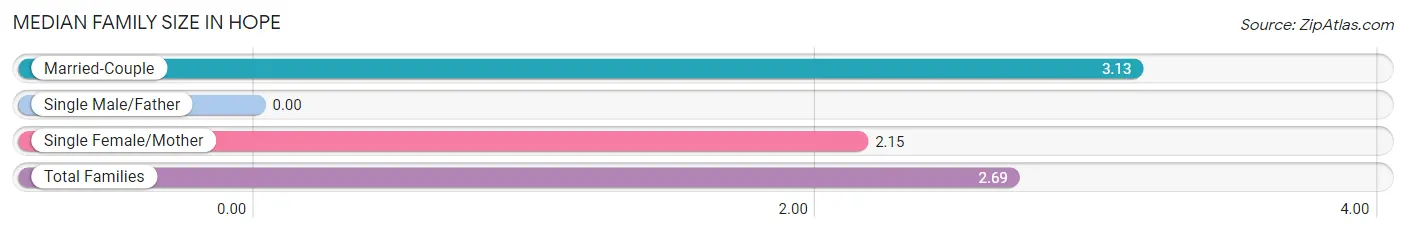
| Family Type | # Families | Family Size |
| Married-Couple | 32 (55.2%) | 3.13 |
| Single Male/Father | 0 (0.0%) | - |
| Single Female/Mother | 26 (44.8%) | 2.15 |
| Total Families | 58 (100.0%) | 2.69 |
Median Household Size in Hope
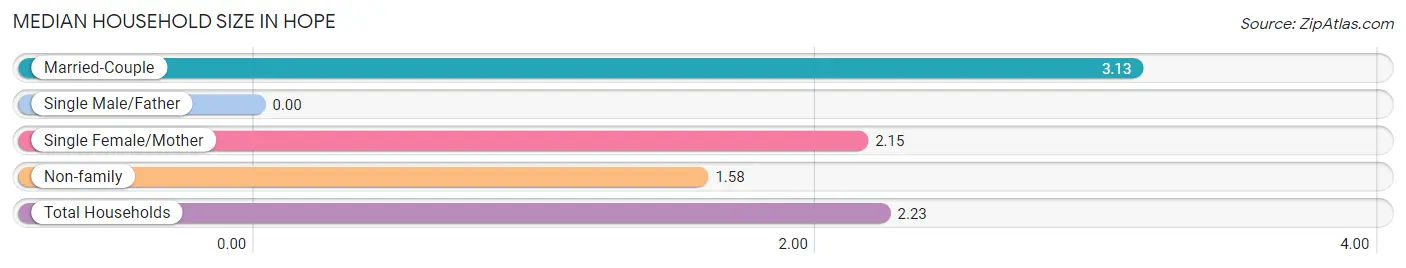
| Household Type | # Households | Household Size |
| Married-Couple | 32 (32.7%) | 3.13 |
| Single Male/Father | 0 (0.0%) | - |
| Single Female/Mother | 26 (26.5%) | 2.15 |
| Non-family | 40 (40.8%) | 1.58 |
| Total Households | 98 (100.0%) | 2.23 |
Household Size by Marriage Status in Hope
Out of a total of 98 households in Hope, 58 (59.2%) are family households, while 40 (40.8%) are nonfamily households. The most numerous type of family households are 2-person households, comprising 32, and the most common type of nonfamily households are 1-person households, comprising 22.
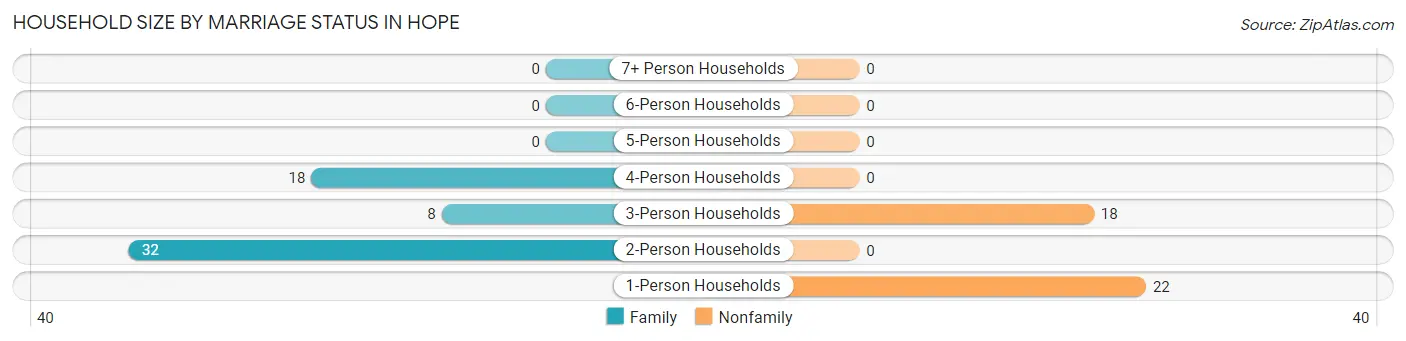
| Household Size | Family Households | Nonfamily Households |
| 1-Person Households | - | 22 (22.5%) |
| 2-Person Households | 32 (32.7%) | 0 (0.0%) |
| 3-Person Households | 8 (8.2%) | 18 (18.4%) |
| 4-Person Households | 18 (18.4%) | 0 (0.0%) |
| 5-Person Households | 0 (0.0%) | 0 (0.0%) |
| 6-Person Households | 0 (0.0%) | 0 (0.0%) |
| 7+ Person Households | 0 (0.0%) | 0 (0.0%) |
| Total | 58 (59.2%) | 40 (40.8%) |
Female Fertility in Hope
Fertility by Age in Hope
| Age Bracket | Women with Births | Births / 1,000 Women |
| 15 to 19 years | 0 (0.0%) | 0.0 |
| 20 to 34 years | 0 (0.0%) | 0.0 |
| 35 to 50 years | 0 (0.0%) | 0.0 |
| Total | 0 (0.0%) | 0.0 |
Fertility by Age by Marriage Status in Hope
| Age Bracket | Married | Unmarried |
| 15 to 19 years | 0 (0.0%) | 0 (0.0%) |
| 20 to 34 years | 0 (0.0%) | 0 (0.0%) |
| 35 to 50 years | 0 (0.0%) | 0 (0.0%) |
| Total | 0 (0.0%) | 0 (0.0%) |
Fertility by Education in Hope
| Educational Attainment | Women with Births | Births / 1,000 Women |
| Less than High School | 0 (0.0%) | 0.0 |
| High School Diploma | 0 (0.0%) | 0.0 |
| College or Associate's Degree | 0 (0.0%) | 0.0 |
| Bachelor's Degree | 0 (0.0%) | 0.0 |
| Graduate Degree | 0 (0.0%) | 0.0 |
| Total | 0 (0.0%) | 0.0 |
Fertility by Education by Marriage Status in Hope
| Educational Attainment | Married | Unmarried |
| Less than High School | 0 (0.0%) | 0 (0.0%) |
| High School Diploma | 0 (0.0%) | 0 (0.0%) |
| College or Associate's Degree | 0 (0.0%) | 0 (0.0%) |
| Bachelor's Degree | 0 (0.0%) | 0 (0.0%) |
| Graduate Degree | 0 (0.0%) | 0 (0.0%) |
| Total | 0 (0.0%) | 0 (0.0%) |
Employment Characteristics in Hope
Employment by Class of Employer in Hope
Among the 163 employed individuals in Hope, private company employees (115 | 70.6%), self-employed (incorporated) (27 | 16.6%), and not-for-profit organizations (9 | 5.5%) make up the most common classes of employment.
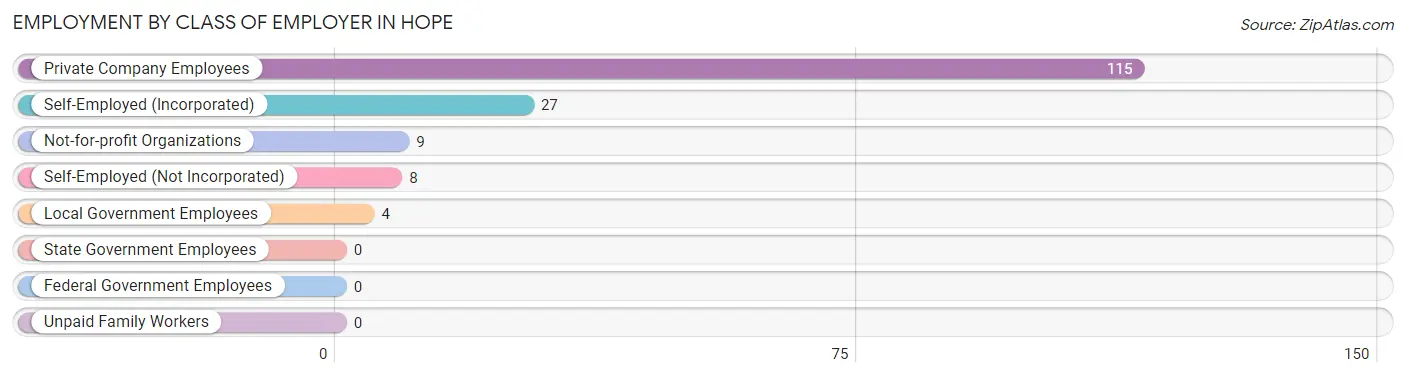
| Employer Class | # Employees | % Employees |
| Private Company Employees | 115 | 70.6% |
| Self-Employed (Incorporated) | 27 | 16.6% |
| Self-Employed (Not Incorporated) | 8 | 4.9% |
| Not-for-profit Organizations | 9 | 5.5% |
| Local Government Employees | 4 | 2.5% |
| State Government Employees | 0 | 0.0% |
| Federal Government Employees | 0 | 0.0% |
| Unpaid Family Workers | 0 | 0.0% |
| Total | 163 | 100.0% |
Employment Status by Age in Hope
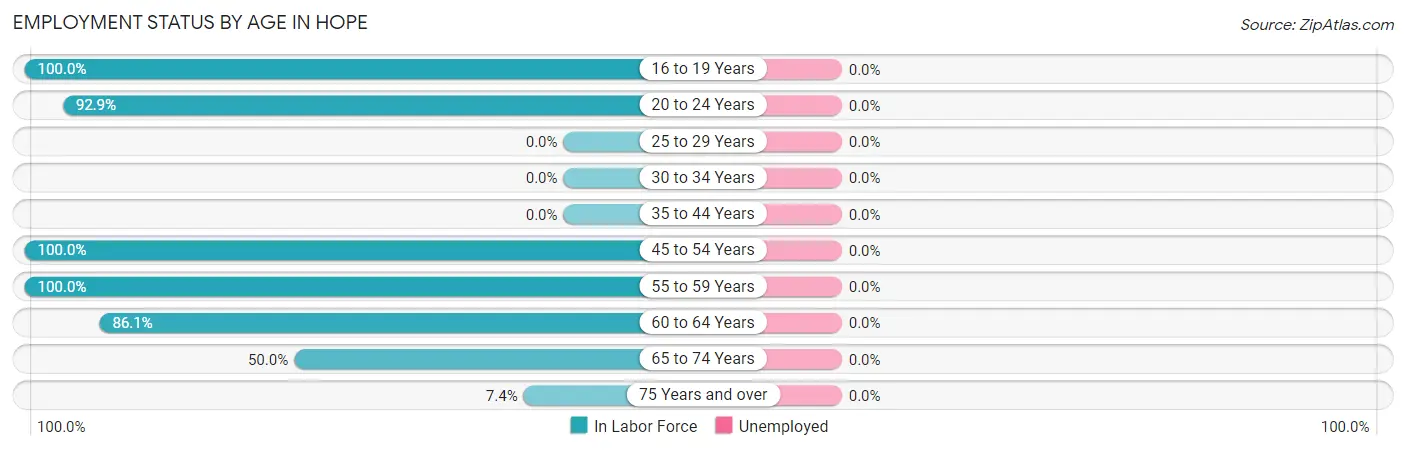
| Age Bracket | In Labor Force | Unemployed |
| 16 to 19 Years | 23 (100.0%) | 0 (0.0%) |
| 20 to 24 Years | 39 (92.9%) | 0 (0.0%) |
| 25 to 29 Years | 0 (0.0%) | 0 (0.0%) |
| 30 to 34 Years | 0 (0.0%) | 0 (0.0%) |
| 35 to 44 Years | 0 (0.0%) | 0 (0.0%) |
| 45 to 54 Years | 33 (100.0%) | 0 (0.0%) |
| 55 to 59 Years | 25 (100.0%) | 0 (0.0%) |
| 60 to 64 Years | 31 (86.1%) | 0 (0.0%) |
| 65 to 74 Years | 10 (50.0%) | 0 (0.0%) |
| 75 Years and over | 2 (7.4%) | 0 (0.0%) |
| Total | 163 (76.2%) | 0 (0.0%) |
Employment Status by Educational Attainment in Hope
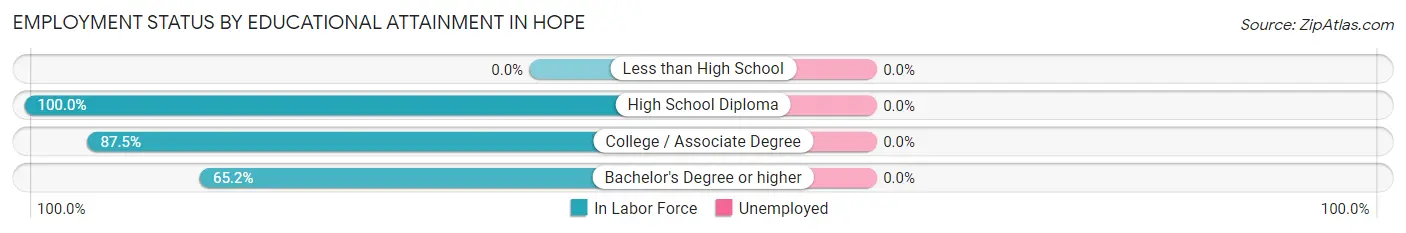
| Educational Attainment | In Labor Force | Unemployed |
| Less than High School | 0 (0.0%) | 0 (0.0%) |
| High School Diploma | 39 (100.0%) | 0 (0.0%) |
| College / Associate Degree | 35 (87.5%) | 0 (0.0%) |
| Bachelor's Degree or higher | 15 (65.2%) | 0 (0.0%) |
| Total | 89 (87.3%) | 0 (0.0%) |
Employment Occupations by Sex in Hope
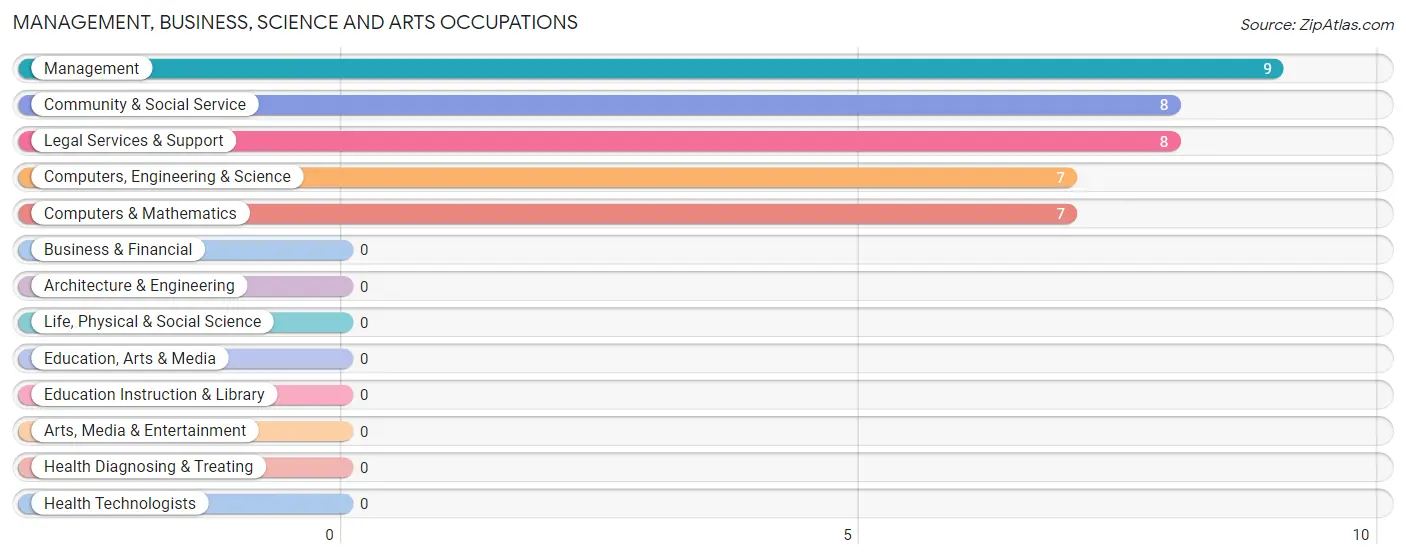
Management, Business, Science and Arts Occupations
The most common Management, Business, Science and Arts occupations in Hope are Management (9 | 5.5%), Community & Social Service (8 | 4.9%), Legal Services & Support (8 | 4.9%), Computers, Engineering & Science (7 | 4.3%), and Computers & Mathematics (7 | 4.3%).
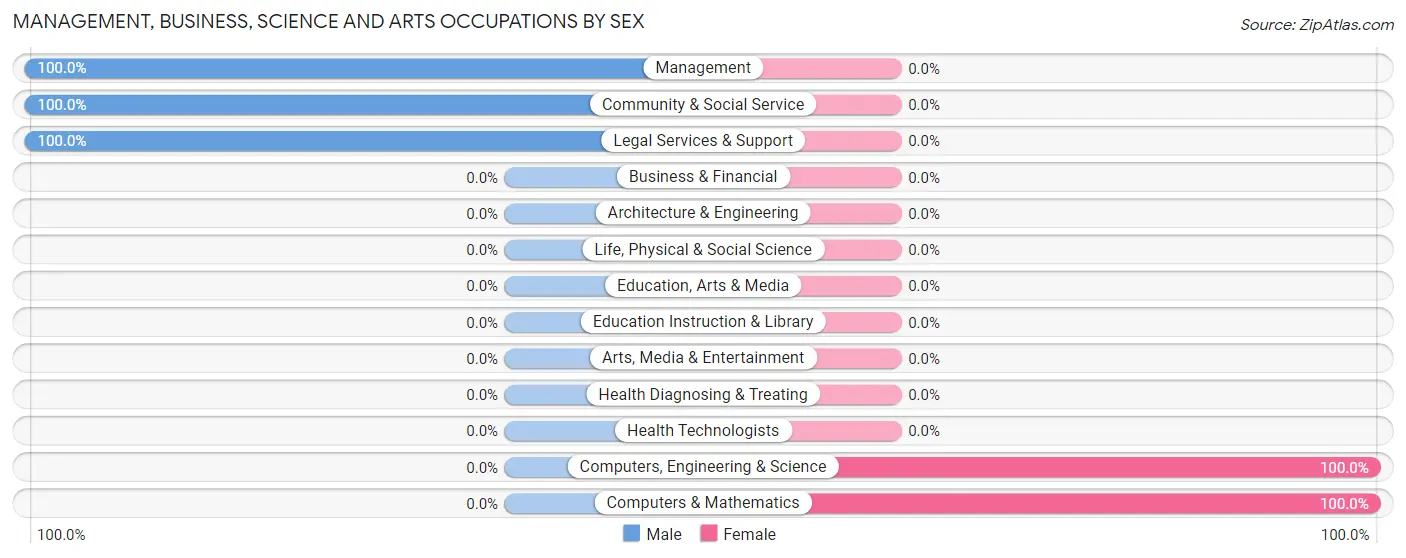
Management, Business, Science and Arts Occupations by Sex
Within the Management, Business, Science and Arts occupations in Hope, the most male-oriented occupations are Management (100.0%), Community & Social Service (100.0%), and Legal Services & Support (100.0%), while the most female-oriented occupations are Computers, Engineering & Science (100.0%), and Computers & Mathematics (100.0%).
| Occupation | Male | Female |
| Management | 9 (100.0%) | 0 (0.0%) |
| Business & Financial | 0 (0.0%) | 0 (0.0%) |
| Computers, Engineering & Science | 0 (0.0%) | 7 (100.0%) |
| Computers & Mathematics | 0 (0.0%) | 7 (100.0%) |
| Architecture & Engineering | 0 (0.0%) | 0 (0.0%) |
| Life, Physical & Social Science | 0 (0.0%) | 0 (0.0%) |
| Community & Social Service | 8 (100.0%) | 0 (0.0%) |
| Education, Arts & Media | 0 (0.0%) | 0 (0.0%) |
| Legal Services & Support | 8 (100.0%) | 0 (0.0%) |
| Education Instruction & Library | 0 (0.0%) | 0 (0.0%) |
| Arts, Media & Entertainment | 0 (0.0%) | 0 (0.0%) |
| Health Diagnosing & Treating | 0 (0.0%) | 0 (0.0%) |
| Health Technologists | 0 (0.0%) | 0 (0.0%) |
| Total (Category) | 17 (70.8%) | 7 (29.2%) |
| Total (Overall) | 98 (60.1%) | 65 (39.9%) |
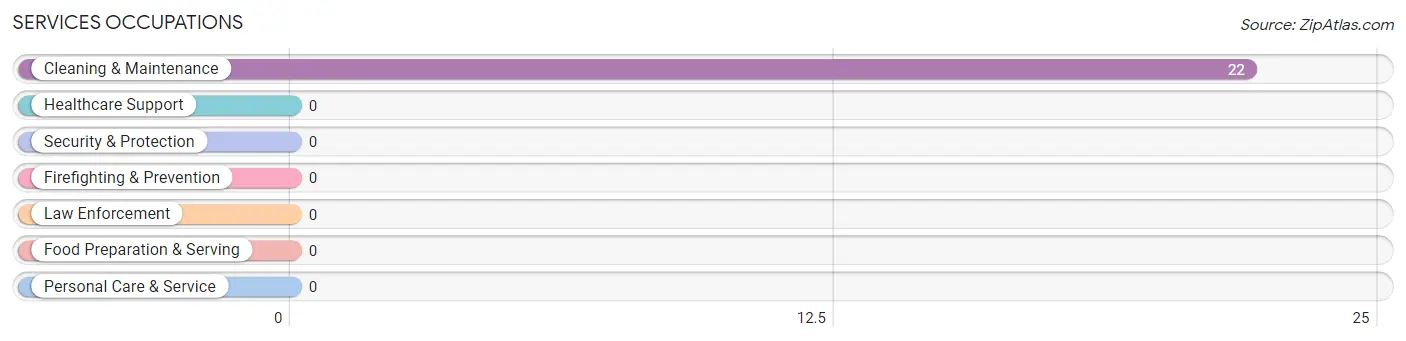
Services Occupations
The most common Services occupations in Hope are , and Cleaning & Maintenance (22 | 13.5%).
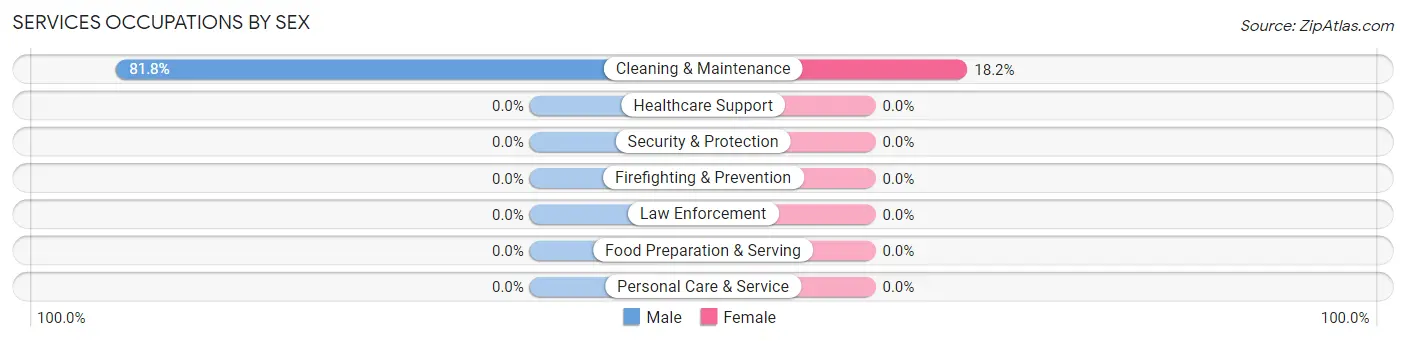
Services Occupations by Sex
| Occupation | Male | Female |
| Healthcare Support | 0 (0.0%) | 0 (0.0%) |
| Security & Protection | 0 (0.0%) | 0 (0.0%) |
| Firefighting & Prevention | 0 (0.0%) | 0 (0.0%) |
| Law Enforcement | 0 (0.0%) | 0 (0.0%) |
| Food Preparation & Serving | 0 (0.0%) | 0 (0.0%) |
| Cleaning & Maintenance | 18 (81.8%) | 4 (18.2%) |
| Personal Care & Service | 0 (0.0%) | 0 (0.0%) |
| Total (Category) | 18 (81.8%) | 4 (18.2%) |
| Total (Overall) | 98 (60.1%) | 65 (39.9%) |
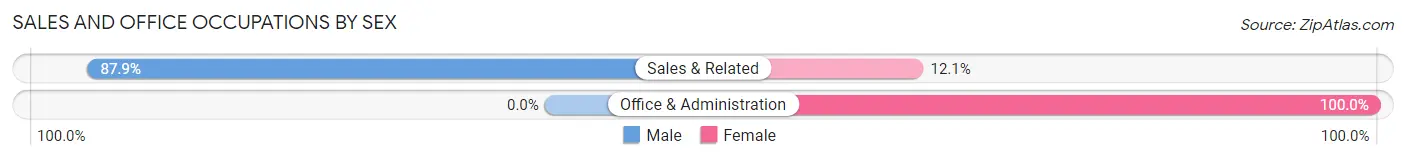
Sales and Office Occupations
The most common Sales and Office occupations in Hope are Office & Administration (38 | 23.3%), and Sales & Related (33 | 20.3%).
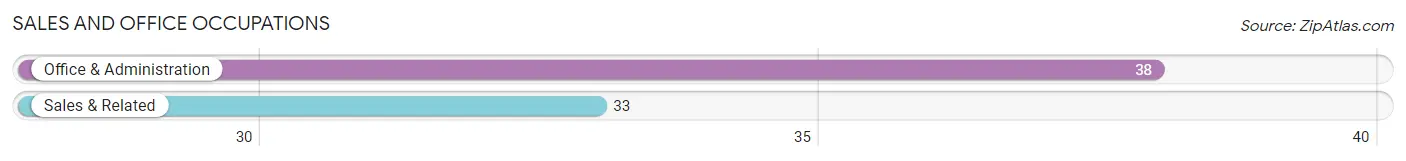
Sales and Office Occupations by Sex
| Occupation | Male | Female |
| Sales & Related | 29 (87.9%) | 4 (12.1%) |
| Office & Administration | 0 (0.0%) | 38 (100.0%) |
| Total (Category) | 29 (40.8%) | 42 (59.2%) |
| Total (Overall) | 98 (60.1%) | 65 (39.9%) |
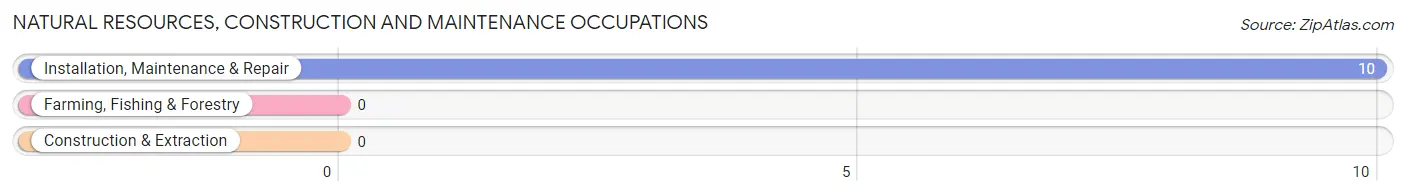
Natural Resources, Construction and Maintenance Occupations
The most common Natural Resources, Construction and Maintenance occupations in Hope are , and Installation, Maintenance & Repair (10 | 6.1%).
Natural Resources, Construction and Maintenance Occupations by Sex
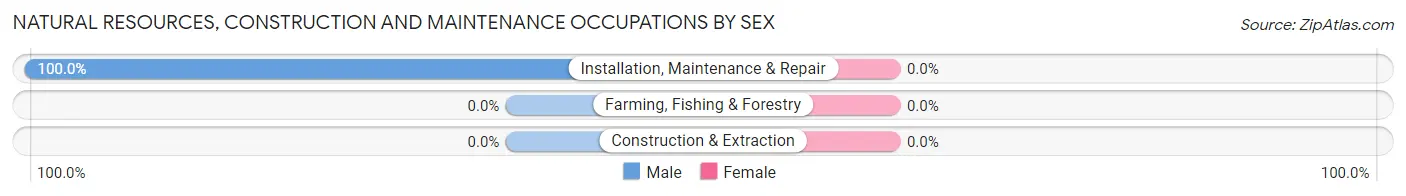
| Occupation | Male | Female |
| Farming, Fishing & Forestry | 0 (0.0%) | 0 (0.0%) |
| Construction & Extraction | 0 (0.0%) | 0 (0.0%) |
| Installation, Maintenance & Repair | 10 (100.0%) | 0 (0.0%) |
| Total (Category) | 10 (100.0%) | 0 (0.0%) |
| Total (Overall) | 98 (60.1%) | 65 (39.9%) |
Production, Transportation and Moving Occupations
The most common Production, Transportation and Moving occupations in Hope are Production (12 | 7.4%), Transportation (12 | 7.4%), and Material Moving (12 | 7.4%).
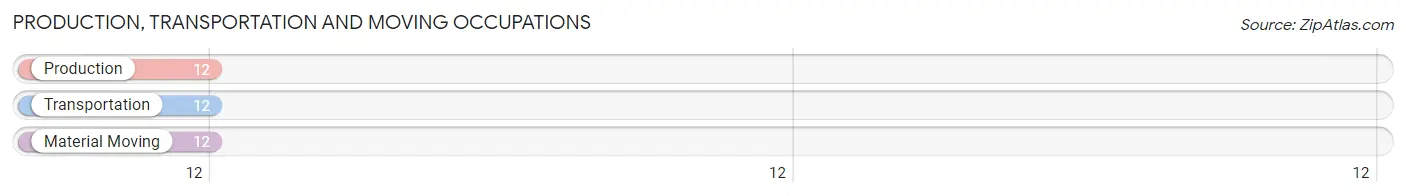
Production, Transportation and Moving Occupations by Sex
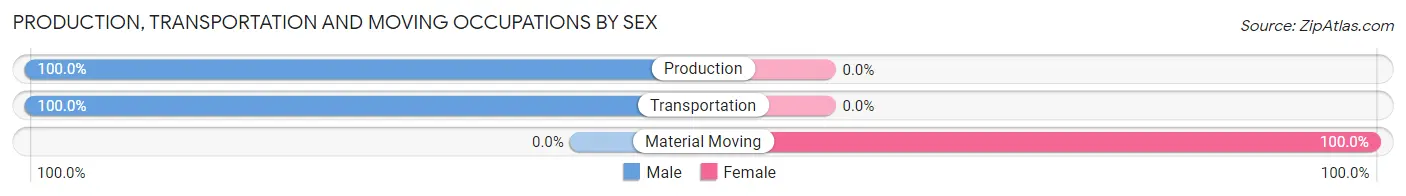
| Occupation | Male | Female |
| Production | 12 (100.0%) | 0 (0.0%) |
| Transportation | 12 (100.0%) | 0 (0.0%) |
| Material Moving | 0 (0.0%) | 12 (100.0%) |
| Total (Category) | 24 (66.7%) | 12 (33.3%) |
| Total (Overall) | 98 (60.1%) | 65 (39.9%) |
Employment Industries by Sex in Hope
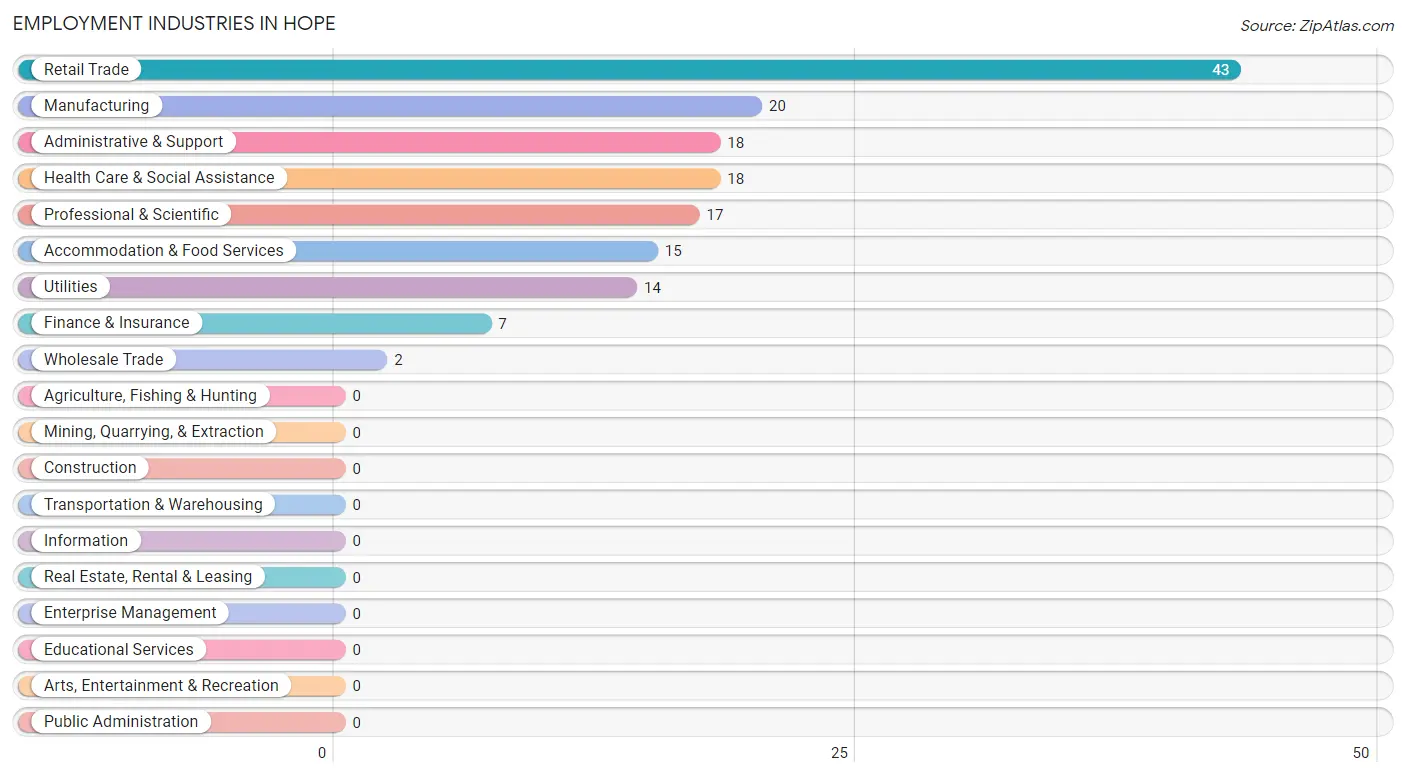
Employment Industries in Hope
The major employment industries in Hope include Retail Trade (43 | 26.4%), Manufacturing (20 | 12.3%), Administrative & Support (18 | 11.0%), Health Care & Social Assistance (18 | 11.0%), and Professional & Scientific (17 | 10.4%).
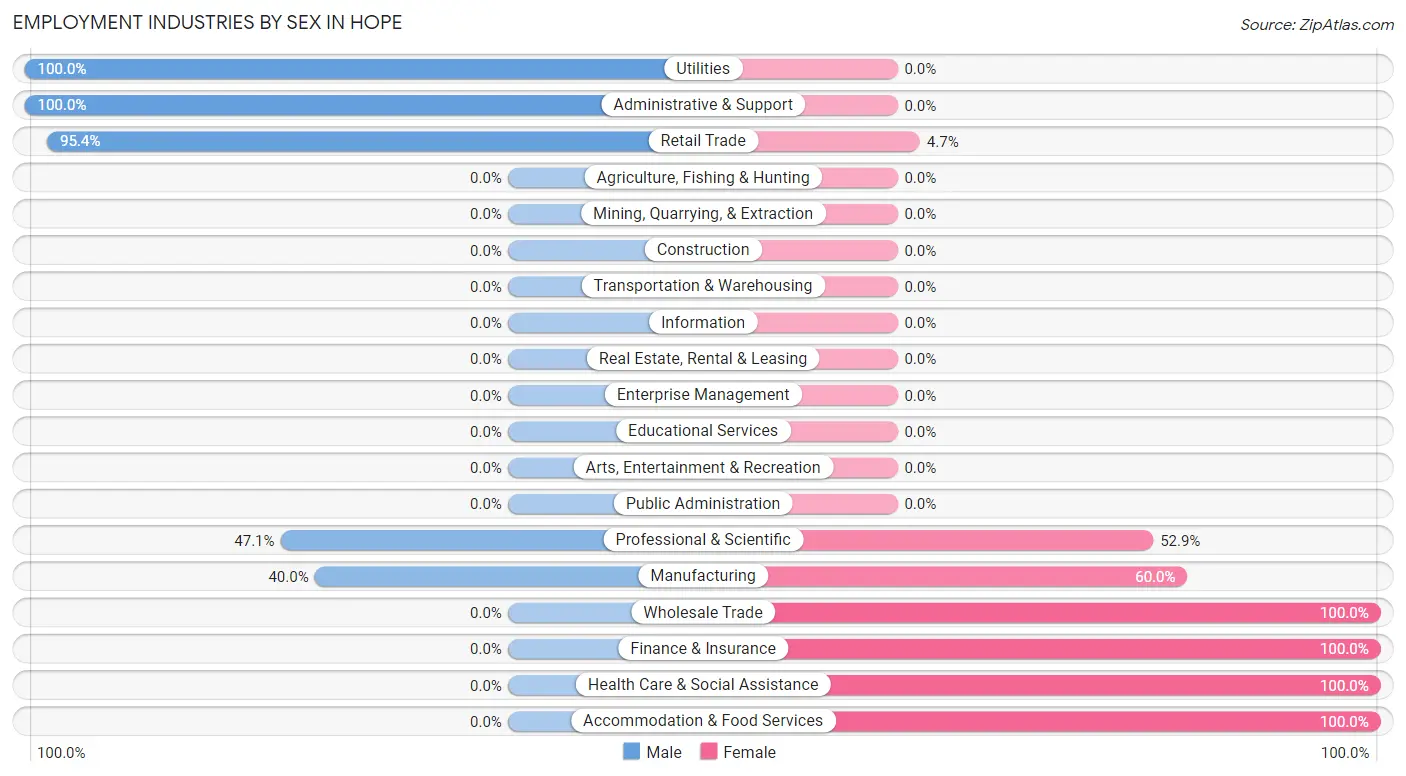
Employment Industries by Sex in Hope
The Hope industries that see more men than women are Utilities (100.0%), Administrative & Support (100.0%), and Retail Trade (95.4%), whereas the industries that tend to have a higher number of women are Wholesale Trade (100.0%), Finance & Insurance (100.0%), and Health Care & Social Assistance (100.0%).
| Industry | Male | Female |
| Agriculture, Fishing & Hunting | 0 (0.0%) | 0 (0.0%) |
| Mining, Quarrying, & Extraction | 0 (0.0%) | 0 (0.0%) |
| Construction | 0 (0.0%) | 0 (0.0%) |
| Manufacturing | 8 (40.0%) | 12 (60.0%) |
| Wholesale Trade | 0 (0.0%) | 2 (100.0%) |
| Retail Trade | 41 (95.4%) | 2 (4.6%) |
| Transportation & Warehousing | 0 (0.0%) | 0 (0.0%) |
| Utilities | 14 (100.0%) | 0 (0.0%) |
| Information | 0 (0.0%) | 0 (0.0%) |
| Finance & Insurance | 0 (0.0%) | 7 (100.0%) |
| Real Estate, Rental & Leasing | 0 (0.0%) | 0 (0.0%) |
| Professional & Scientific | 8 (47.1%) | 9 (52.9%) |
| Enterprise Management | 0 (0.0%) | 0 (0.0%) |
| Administrative & Support | 18 (100.0%) | 0 (0.0%) |
| Educational Services | 0 (0.0%) | 0 (0.0%) |
| Health Care & Social Assistance | 0 (0.0%) | 18 (100.0%) |
| Arts, Entertainment & Recreation | 0 (0.0%) | 0 (0.0%) |
| Accommodation & Food Services | 0 (0.0%) | 15 (100.0%) |
| Public Administration | 0 (0.0%) | 0 (0.0%) |
| Total | 98 (60.1%) | 65 (39.9%) |
Education in Hope
School Enrollment in Hope
The most common levels of schooling among the 49 students in Hope are college / undergraduate (31 | 63.3%), graduate / professional (8 | 16.3%), and middle school (5 | 10.2%).
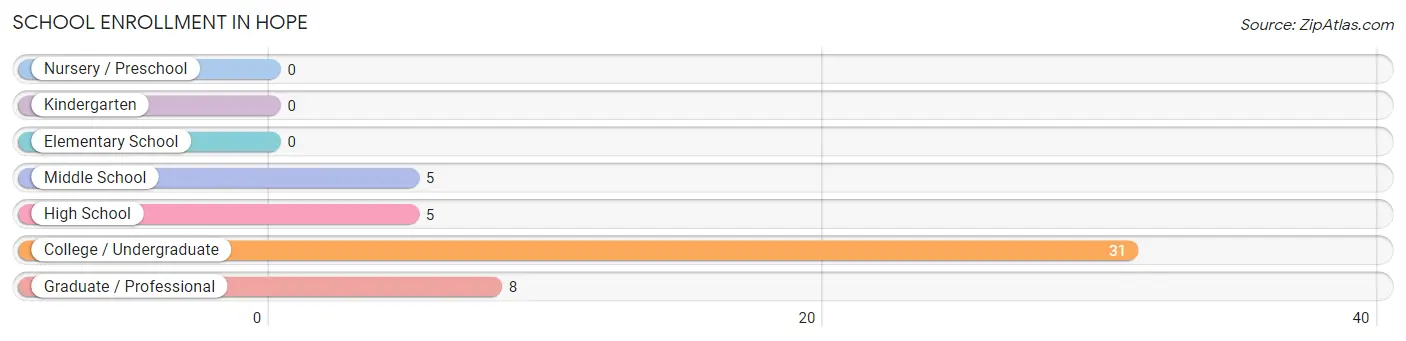
| School Level | # Students | % Students |
| Nursery / Preschool | 0 | 0.0% |
| Kindergarten | 0 | 0.0% |
| Elementary School | 0 | 0.0% |
| Middle School | 5 | 10.2% |
| High School | 5 | 10.2% |
| College / Undergraduate | 31 | 63.3% |
| Graduate / Professional | 8 | 16.3% |
| Total | 49 | 100.0% |
School Enrollment by Age by Funding Source in Hope
Out of a total of 49 students who are enrolled in schools in Hope, 8 (16.3%) attend a private institution, while the remaining 41 (83.7%) are enrolled in public schools. The age group of 10 to 14 year olds has the highest likelihood of being enrolled in private schools, with 5 (100.0% in the age bracket) enrolled. Conversely, the age group of 15 to 17 year olds has the lowest likelihood of being enrolled in a private school, with 5 (100.0% in the age bracket) attending a public institution.
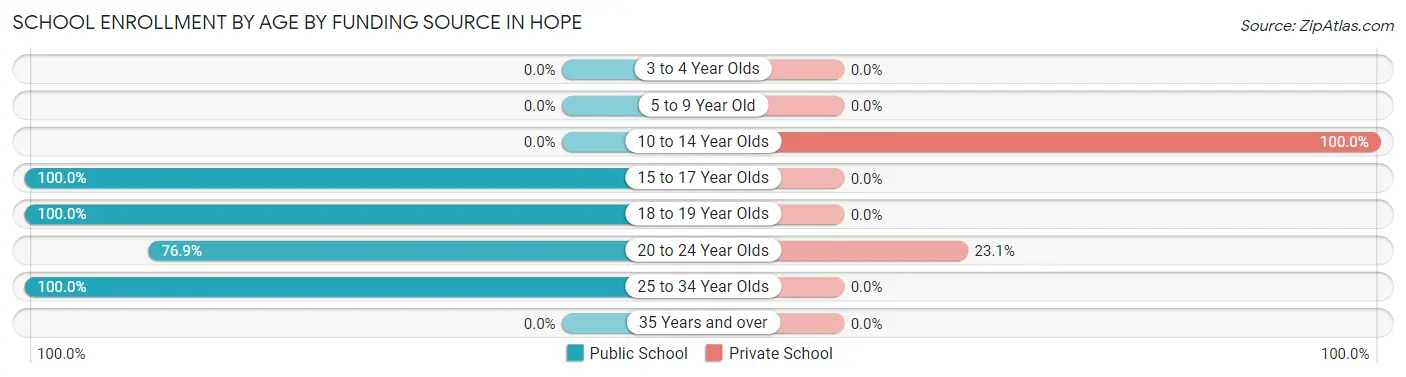
| Age Bracket | Public School | Private School |
| 3 to 4 Year Olds | 0 (0.0%) | 0 (0.0%) |
| 5 to 9 Year Old | 0 (0.0%) | 0 (0.0%) |
| 10 to 14 Year Olds | 0 (0.0%) | 5 (100.0%) |
| 15 to 17 Year Olds | 5 (100.0%) | 0 (0.0%) |
| 18 to 19 Year Olds | 18 (100.0%) | 0 (0.0%) |
| 20 to 24 Year Olds | 10 (76.9%) | 3 (23.1%) |
| 25 to 34 Year Olds | 8 (100.0%) | 0 (0.0%) |
| 35 Years and over | 0 (0.0%) | 0 (0.0%) |
| Total | 41 (83.7%) | 8 (16.3%) |
Educational Attainment by Field of Study in Hope
Business (11 | 42.3%), social sciences (8 | 30.8%), and arts & humanities (7 | 26.9%) are the most common fields of study among 26 individuals in Hope who have obtained a bachelor's degree or higher.
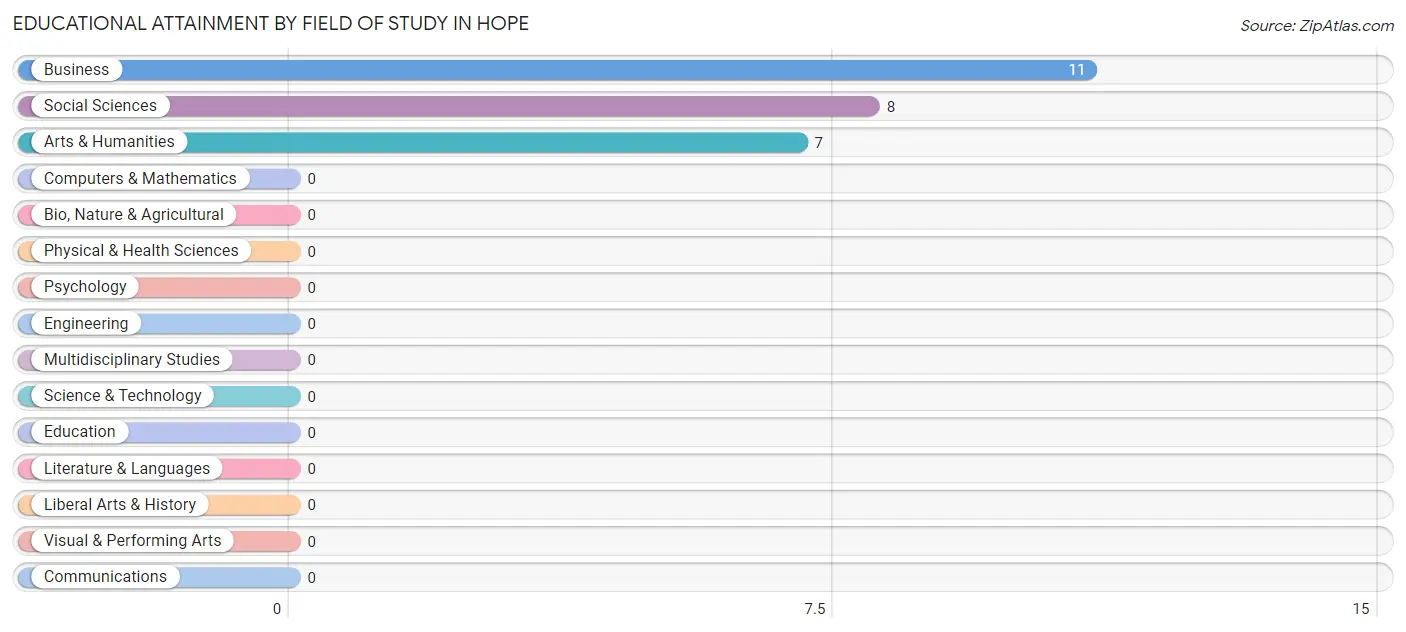
| Field of Study | # Graduates | % Graduates |
| Computers & Mathematics | 0 | 0.0% |
| Bio, Nature & Agricultural | 0 | 0.0% |
| Physical & Health Sciences | 0 | 0.0% |
| Psychology | 0 | 0.0% |
| Social Sciences | 8 | 30.8% |
| Engineering | 0 | 0.0% |
| Multidisciplinary Studies | 0 | 0.0% |
| Science & Technology | 0 | 0.0% |
| Business | 11 | 42.3% |
| Education | 0 | 0.0% |
| Literature & Languages | 0 | 0.0% |
| Liberal Arts & History | 0 | 0.0% |
| Visual & Performing Arts | 0 | 0.0% |
| Communications | 0 | 0.0% |
| Arts & Humanities | 7 | 26.9% |
| Total | 26 | 100.0% |
Transportation & Commute in Hope
Vehicle Availability by Sex in Hope
The most prevalent vehicle ownership categories in Hope are males with 2 vehicles (45, accounting for 45.9%) and females with 2 vehicles (25, making up 69.2%).
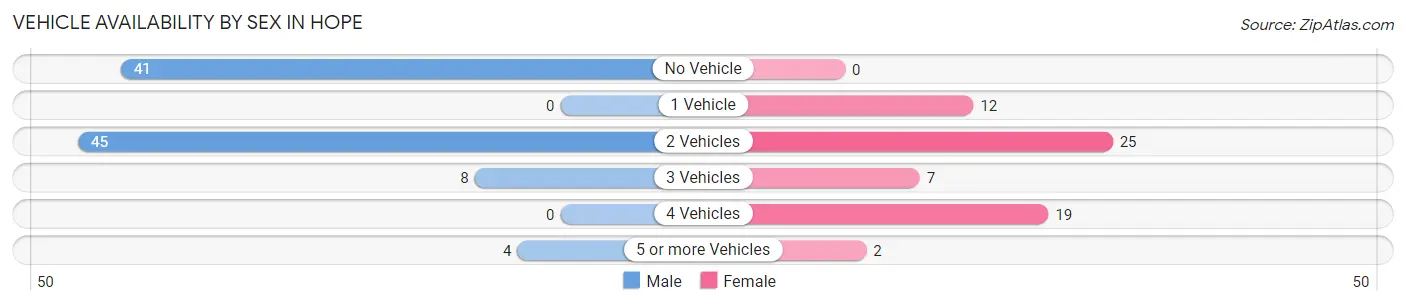
| Vehicles Available | Male | Female |
| No Vehicle | 41 (41.8%) | 0 (0.0%) |
| 1 Vehicle | 0 (0.0%) | 12 (18.5%) |
| 2 Vehicles | 45 (45.9%) | 25 (38.5%) |
| 3 Vehicles | 8 (8.2%) | 7 (10.8%) |
| 4 Vehicles | 0 (0.0%) | 19 (29.2%) |
| 5 or more Vehicles | 4 (4.1%) | 2 (3.1%) |
| Total | 98 (100.0%) | 65 (100.0%) |
Commute Time in Hope
The most frequently occuring commute durations in Hope are less than 5 minutes (41 commuters, 25.2%), 5 to 9 minutes (33 commuters, 20.3%), and 45 to 59 minutes (23 commuters, 14.1%).
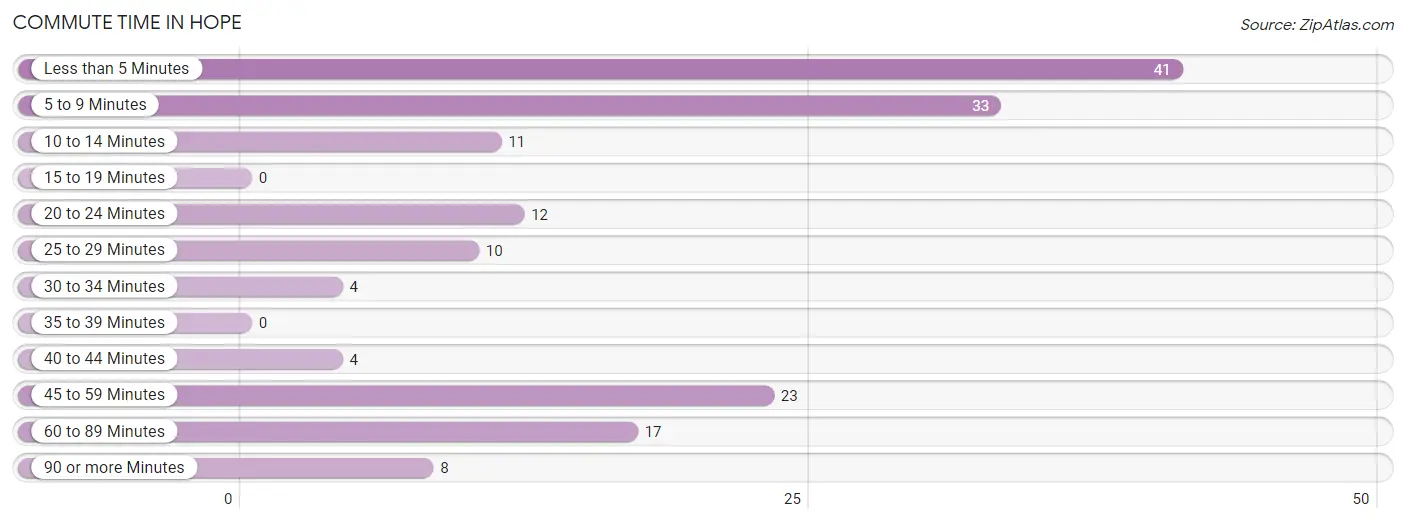
| Commute Time | # Commuters | % Commuters |
| Less than 5 Minutes | 41 | 25.2% |
| 5 to 9 Minutes | 33 | 20.3% |
| 10 to 14 Minutes | 11 | 6.8% |
| 15 to 19 Minutes | 0 | 0.0% |
| 20 to 24 Minutes | 12 | 7.4% |
| 25 to 29 Minutes | 10 | 6.1% |
| 30 to 34 Minutes | 4 | 2.5% |
| 35 to 39 Minutes | 0 | 0.0% |
| 40 to 44 Minutes | 4 | 2.5% |
| 45 to 59 Minutes | 23 | 14.1% |
| 60 to 89 Minutes | 17 | 10.4% |
| 90 or more Minutes | 8 | 4.9% |
Commute Time by Sex in Hope
The most common commute times in Hope are less than 5 minutes (41 commuters, 41.8%) for males and 45 to 59 minutes (23 commuters, 35.4%) for females.
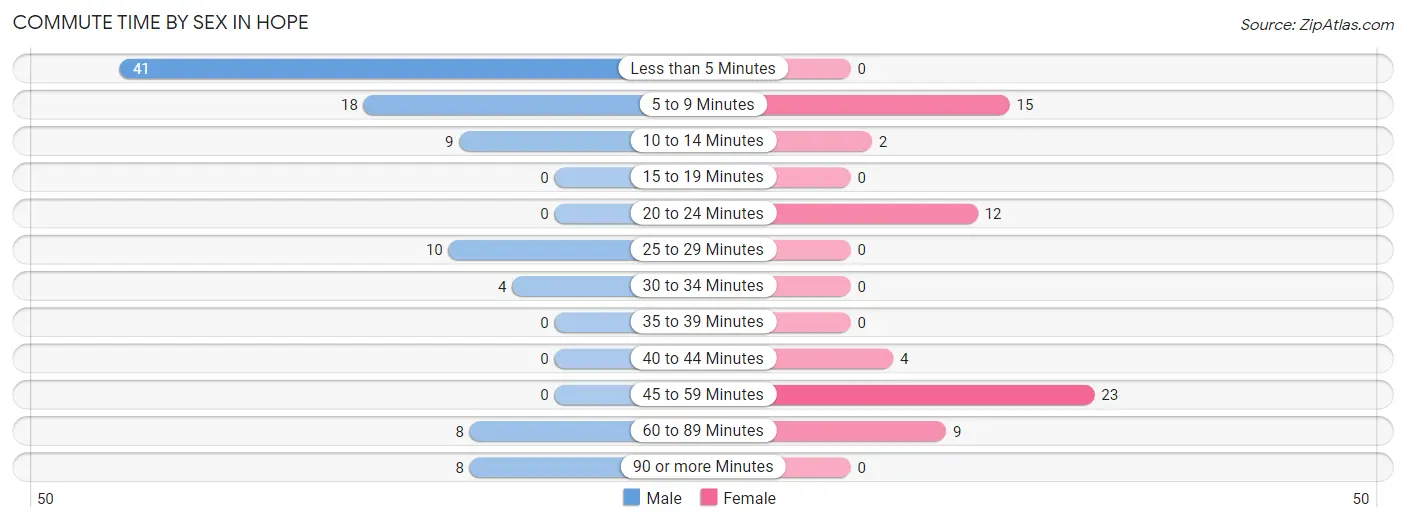
| Commute Time | Male | Female |
| Less than 5 Minutes | 41 (41.8%) | 0 (0.0%) |
| 5 to 9 Minutes | 18 (18.4%) | 15 (23.1%) |
| 10 to 14 Minutes | 9 (9.2%) | 2 (3.1%) |
| 15 to 19 Minutes | 0 (0.0%) | 0 (0.0%) |
| 20 to 24 Minutes | 0 (0.0%) | 12 (18.5%) |
| 25 to 29 Minutes | 10 (10.2%) | 0 (0.0%) |
| 30 to 34 Minutes | 4 (4.1%) | 0 (0.0%) |
| 35 to 39 Minutes | 0 (0.0%) | 0 (0.0%) |
| 40 to 44 Minutes | 0 (0.0%) | 4 (6.1%) |
| 45 to 59 Minutes | 0 (0.0%) | 23 (35.4%) |
| 60 to 89 Minutes | 8 (8.2%) | 9 (13.9%) |
| 90 or more Minutes | 8 (8.2%) | 0 (0.0%) |
Time of Departure to Work by Sex in Hope
The most frequent times of departure to work in Hope are 12:00 PM to 3:59 PM (30, 30.6%) for males and 7:30 AM to 7:59 AM (38, 58.5%) for females.
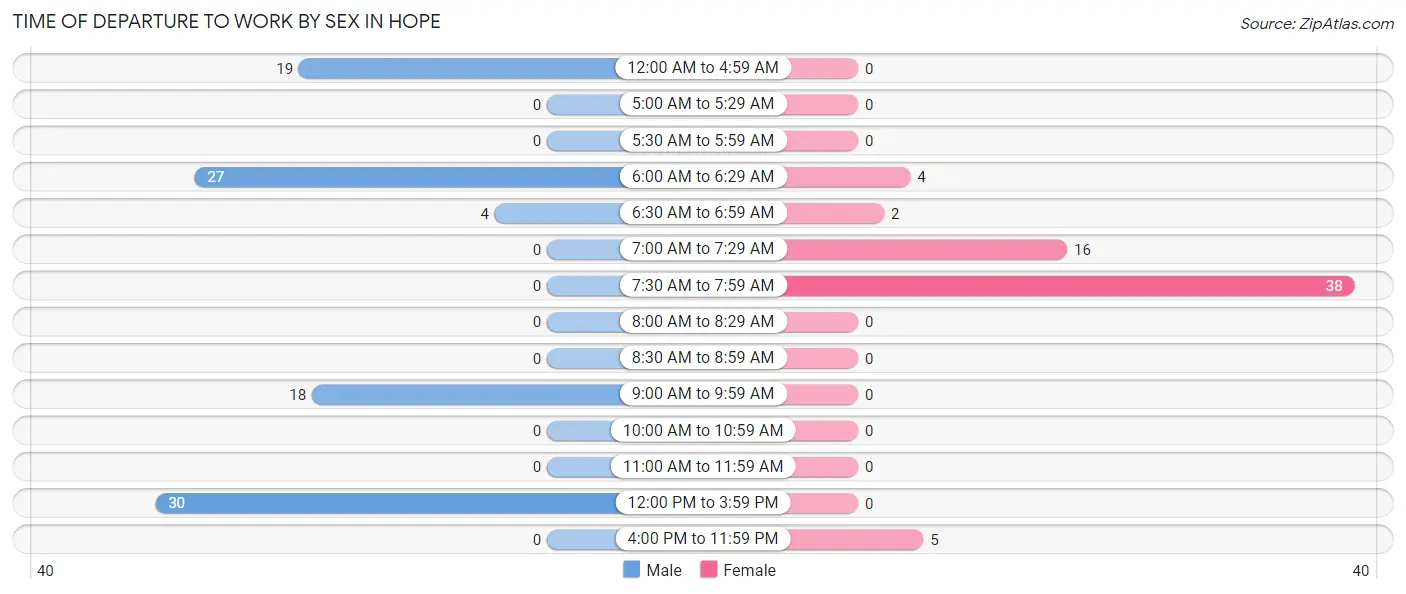
| Time of Departure | Male | Female |
| 12:00 AM to 4:59 AM | 19 (19.4%) | 0 (0.0%) |
| 5:00 AM to 5:29 AM | 0 (0.0%) | 0 (0.0%) |
| 5:30 AM to 5:59 AM | 0 (0.0%) | 0 (0.0%) |
| 6:00 AM to 6:29 AM | 27 (27.6%) | 4 (6.1%) |
| 6:30 AM to 6:59 AM | 4 (4.1%) | 2 (3.1%) |
| 7:00 AM to 7:29 AM | 0 (0.0%) | 16 (24.6%) |
| 7:30 AM to 7:59 AM | 0 (0.0%) | 38 (58.5%) |
| 8:00 AM to 8:29 AM | 0 (0.0%) | 0 (0.0%) |
| 8:30 AM to 8:59 AM | 0 (0.0%) | 0 (0.0%) |
| 9:00 AM to 9:59 AM | 18 (18.4%) | 0 (0.0%) |
| 10:00 AM to 10:59 AM | 0 (0.0%) | 0 (0.0%) |
| 11:00 AM to 11:59 AM | 0 (0.0%) | 0 (0.0%) |
| 12:00 PM to 3:59 PM | 30 (30.6%) | 0 (0.0%) |
| 4:00 PM to 11:59 PM | 0 (0.0%) | 5 (7.7%) |
| Total | 98 (100.0%) | 65 (100.0%) |
Housing Occupancy in Hope
Occupancy by Ownership in Hope
Of the total 98 dwellings in Hope, owner-occupied units account for 54 (55.1%), while renter-occupied units make up 44 (44.9%).
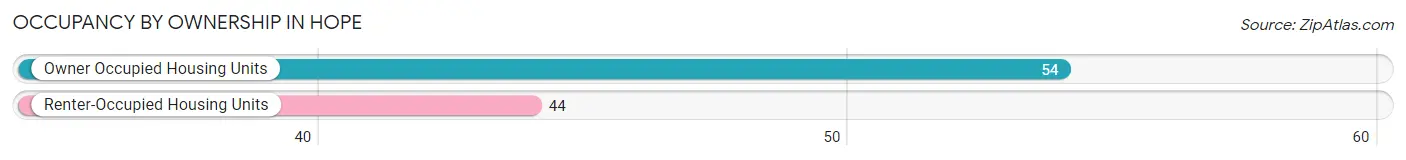
| Occupancy | # Housing Units | % Housing Units |
| Owner Occupied Housing Units | 54 | 55.1% |
| Renter-Occupied Housing Units | 44 | 44.9% |
| Total Occupied Housing Units | 98 | 100.0% |
Occupancy by Household Size in Hope
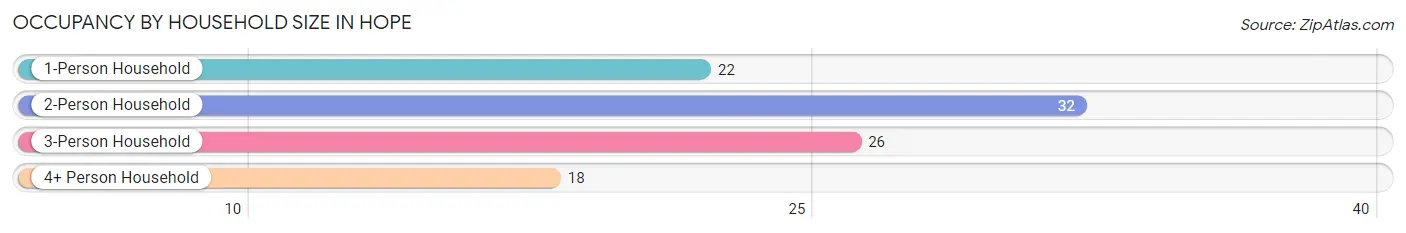
| Household Size | # Housing Units | % Housing Units |
| 1-Person Household | 22 | 22.5% |
| 2-Person Household | 32 | 32.7% |
| 3-Person Household | 26 | 26.5% |
| 4+ Person Household | 18 | 18.4% |
| Total Housing Units | 98 | 100.0% |
Occupancy by Ownership by Household Size in Hope
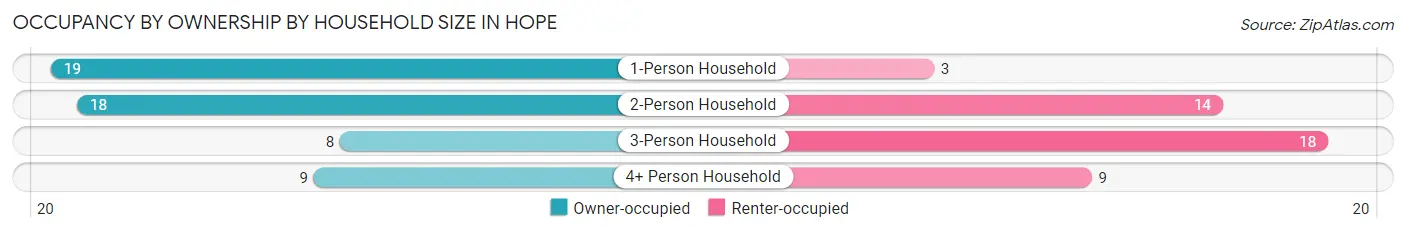
| Household Size | Owner-occupied | Renter-occupied |
| 1-Person Household | 19 (86.4%) | 3 (13.6%) |
| 2-Person Household | 18 (56.2%) | 14 (43.8%) |
| 3-Person Household | 8 (30.8%) | 18 (69.2%) |
| 4+ Person Household | 9 (50.0%) | 9 (50.0%) |
| Total Housing Units | 54 (55.1%) | 44 (44.9%) |
Occupancy by Educational Attainment in Hope
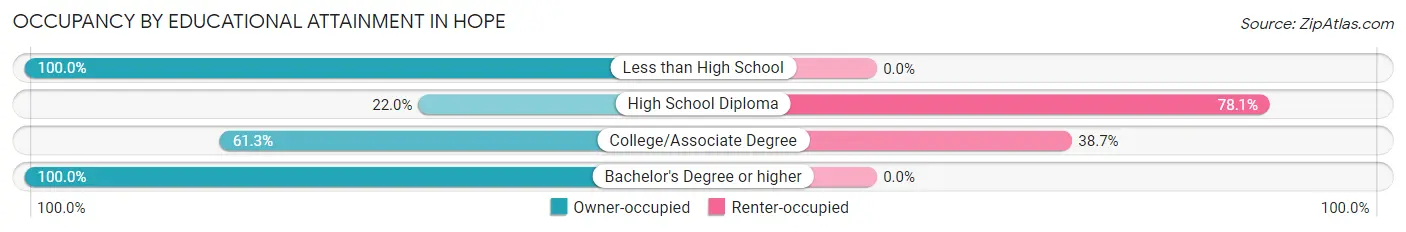
| Household Size | Owner-occupied | Renter-occupied |
| Less than High School | 15 (100.0%) | 0 (0.0%) |
| High School Diploma | 9 (22.0%) | 32 (78.0%) |
| College/Associate Degree | 19 (61.3%) | 12 (38.7%) |
| Bachelor's Degree or higher | 11 (100.0%) | 0 (0.0%) |
Occupancy by Age of Householder in Hope
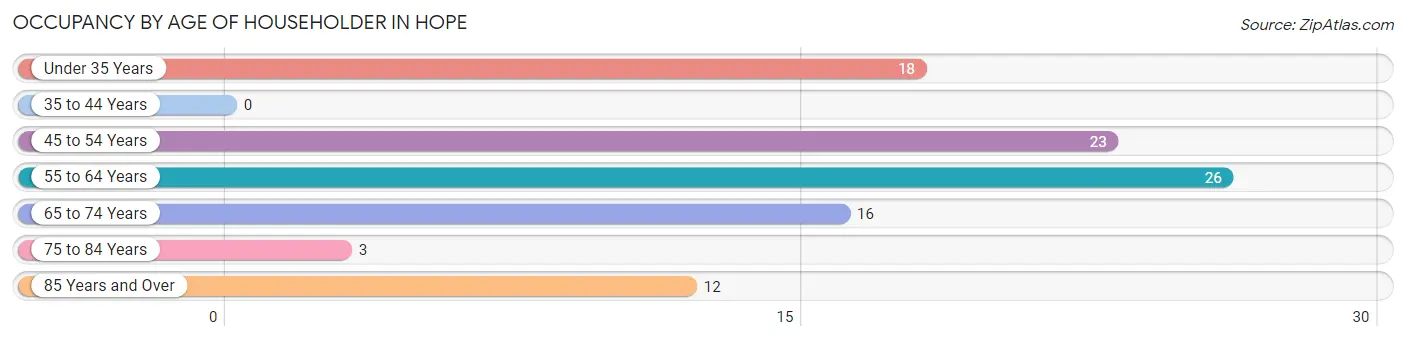
| Age Bracket | # Households | % Households |
| Under 35 Years | 18 | 18.4% |
| 35 to 44 Years | 0 | 0.0% |
| 45 to 54 Years | 23 | 23.5% |
| 55 to 64 Years | 26 | 26.5% |
| 65 to 74 Years | 16 | 16.3% |
| 75 to 84 Years | 3 | 3.1% |
| 85 Years and Over | 12 | 12.2% |
| Total | 98 | 100.0% |
Housing Finances in Hope
Median Income by Occupancy in Hope
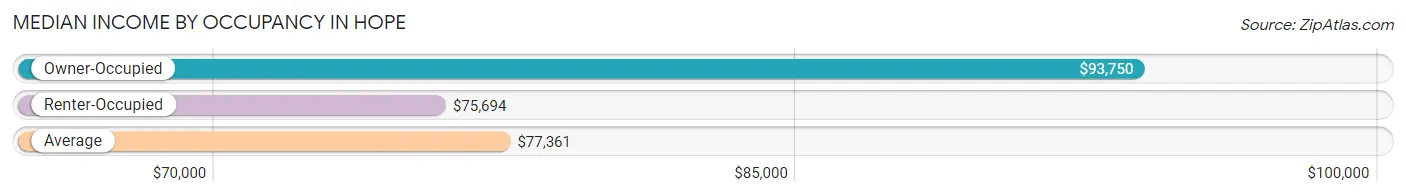
| Occupancy Type | # Households | Median Income |
| Owner-Occupied | 54 (55.1%) | $93,750 |
| Renter-Occupied | 44 (44.9%) | $75,694 |
| Average | 98 (100.0%) | $77,361 |
Occupancy by Householder Income Bracket in Hope
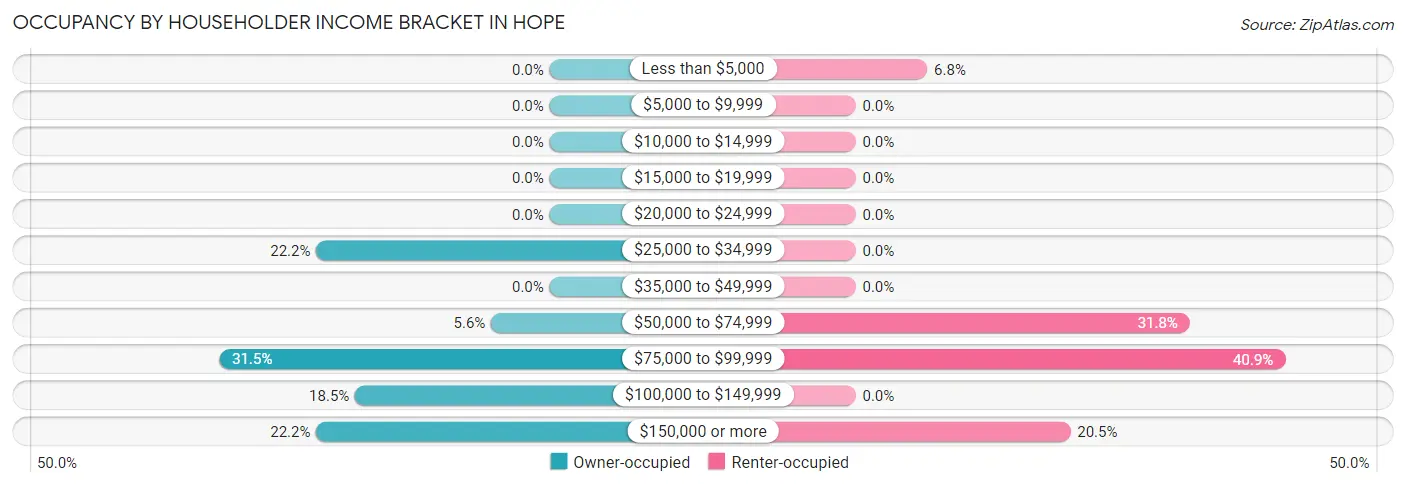
| Income Bracket | Owner-occupied | Renter-occupied |
| Less than $5,000 | 0 (0.0%) | 3 (6.8%) |
| $5,000 to $9,999 | 0 (0.0%) | 0 (0.0%) |
| $10,000 to $14,999 | 0 (0.0%) | 0 (0.0%) |
| $15,000 to $19,999 | 0 (0.0%) | 0 (0.0%) |
| $20,000 to $24,999 | 0 (0.0%) | 0 (0.0%) |
| $25,000 to $34,999 | 12 (22.2%) | 0 (0.0%) |
| $35,000 to $49,999 | 0 (0.0%) | 0 (0.0%) |
| $50,000 to $74,999 | 3 (5.6%) | 14 (31.8%) |
| $75,000 to $99,999 | 17 (31.5%) | 18 (40.9%) |
| $100,000 to $149,999 | 10 (18.5%) | 0 (0.0%) |
| $150,000 or more | 12 (22.2%) | 9 (20.4%) |
| Total | 54 (100.0%) | 44 (100.0%) |
Monthly Housing Cost Tiers in Hope
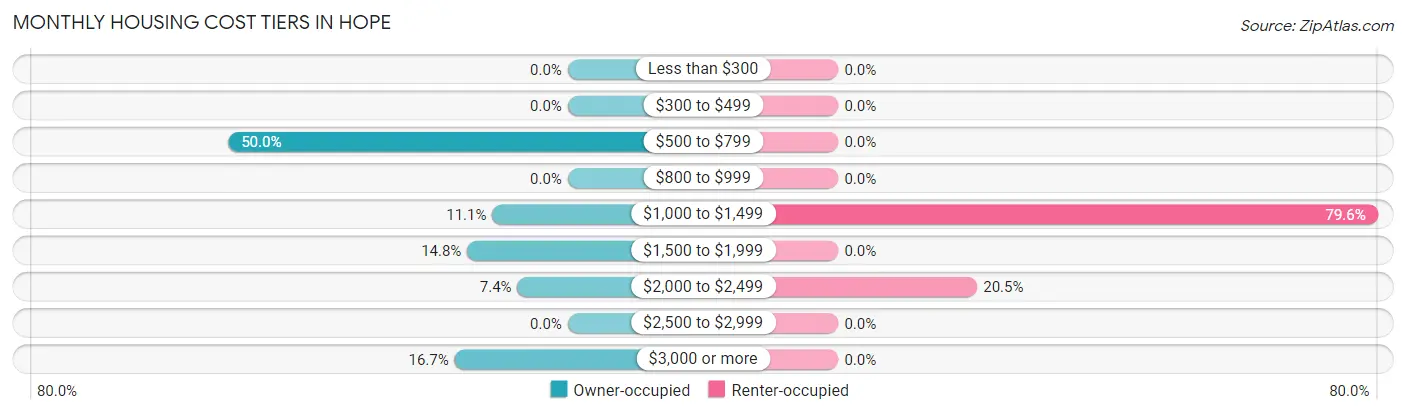
| Monthly Cost | Owner-occupied | Renter-occupied |
| Less than $300 | 0 (0.0%) | 0 (0.0%) |
| $300 to $499 | 0 (0.0%) | 0 (0.0%) |
| $500 to $799 | 27 (50.0%) | 0 (0.0%) |
| $800 to $999 | 0 (0.0%) | 0 (0.0%) |
| $1,000 to $1,499 | 6 (11.1%) | 35 (79.5%) |
| $1,500 to $1,999 | 8 (14.8%) | 0 (0.0%) |
| $2,000 to $2,499 | 4 (7.4%) | 9 (20.4%) |
| $2,500 to $2,999 | 0 (0.0%) | 0 (0.0%) |
| $3,000 or more | 9 (16.7%) | 0 (0.0%) |
| Total | 54 (100.0%) | 44 (100.0%) |
Physical Housing Characteristics in Hope
Housing Structures in Hope
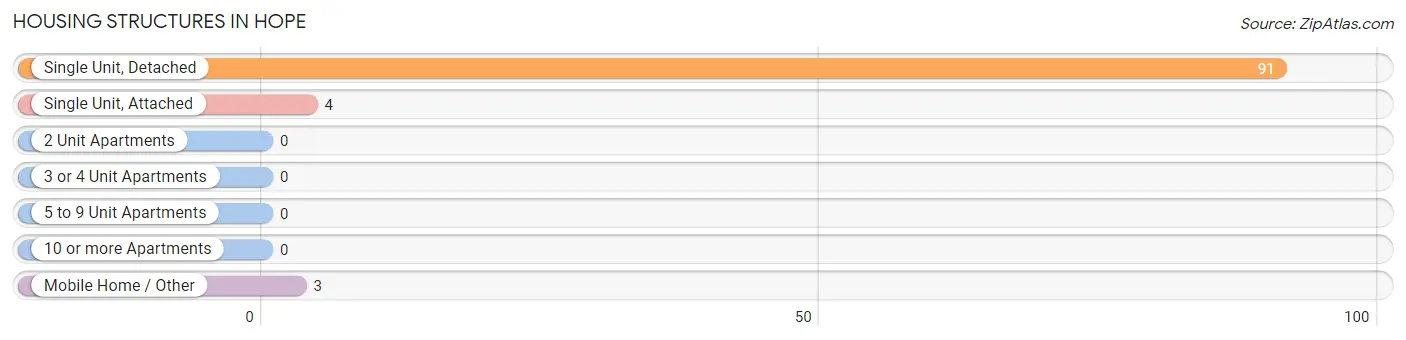
| Structure Type | # Housing Units | % Housing Units |
| Single Unit, Detached | 91 | 92.9% |
| Single Unit, Attached | 4 | 4.1% |
| 2 Unit Apartments | 0 | 0.0% |
| 3 or 4 Unit Apartments | 0 | 0.0% |
| 5 to 9 Unit Apartments | 0 | 0.0% |
| 10 or more Apartments | 0 | 0.0% |
| Mobile Home / Other | 3 | 3.1% |
| Total | 98 | 100.0% |
Housing Structures by Occupancy in Hope
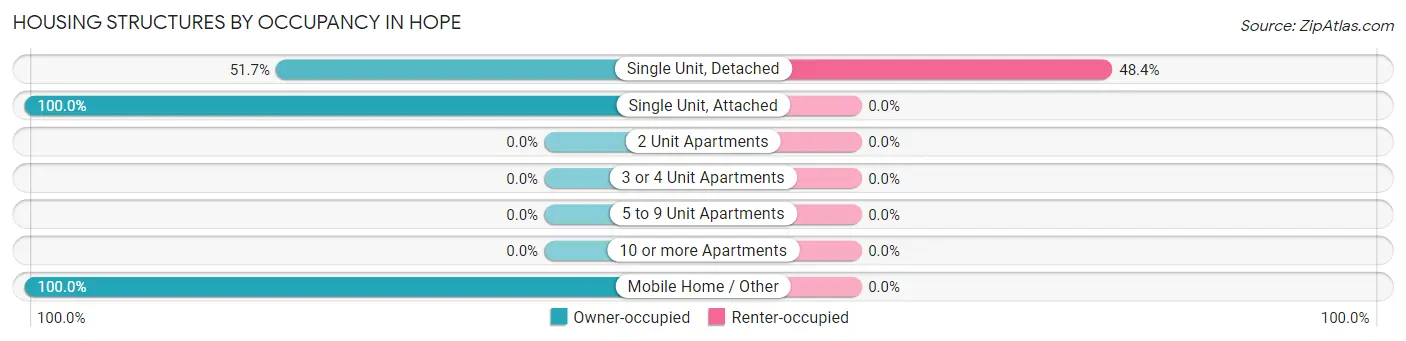
| Structure Type | Owner-occupied | Renter-occupied |
| Single Unit, Detached | 47 (51.6%) | 44 (48.3%) |
| Single Unit, Attached | 4 (100.0%) | 0 (0.0%) |
| 2 Unit Apartments | 0 (0.0%) | 0 (0.0%) |
| 3 or 4 Unit Apartments | 0 (0.0%) | 0 (0.0%) |
| 5 to 9 Unit Apartments | 0 (0.0%) | 0 (0.0%) |
| 10 or more Apartments | 0 (0.0%) | 0 (0.0%) |
| Mobile Home / Other | 3 (100.0%) | 0 (0.0%) |
| Total | 54 (55.1%) | 44 (44.9%) |
Housing Structures by Number of Rooms in Hope
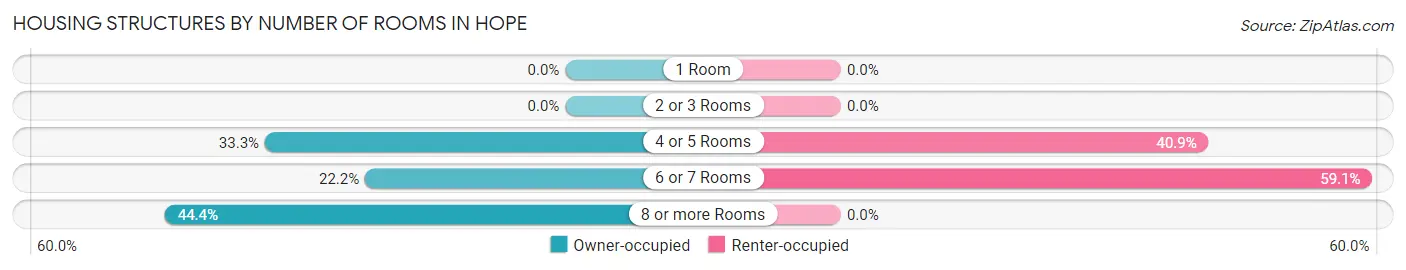
| Number of Rooms | Owner-occupied | Renter-occupied |
| 1 Room | 0 (0.0%) | 0 (0.0%) |
| 2 or 3 Rooms | 0 (0.0%) | 0 (0.0%) |
| 4 or 5 Rooms | 18 (33.3%) | 18 (40.9%) |
| 6 or 7 Rooms | 12 (22.2%) | 26 (59.1%) |
| 8 or more Rooms | 24 (44.4%) | 0 (0.0%) |
| Total | 54 (100.0%) | 44 (100.0%) |
Housing Structure by Heating Type in Hope
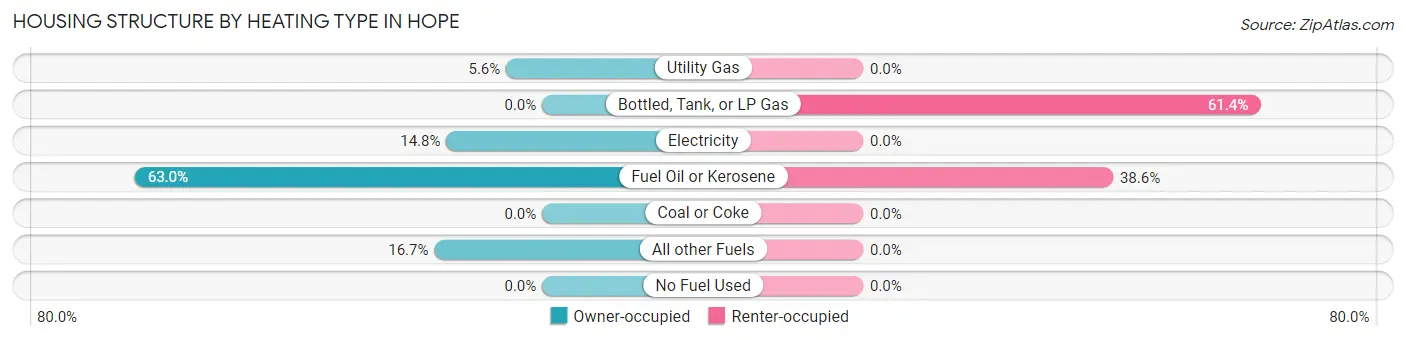
| Heating Type | Owner-occupied | Renter-occupied |
| Utility Gas | 3 (5.6%) | 0 (0.0%) |
| Bottled, Tank, or LP Gas | 0 (0.0%) | 27 (61.4%) |
| Electricity | 8 (14.8%) | 0 (0.0%) |
| Fuel Oil or Kerosene | 34 (63.0%) | 17 (38.6%) |
| Coal or Coke | 0 (0.0%) | 0 (0.0%) |
| All other Fuels | 9 (16.7%) | 0 (0.0%) |
| No Fuel Used | 0 (0.0%) | 0 (0.0%) |
| Total | 54 (100.0%) | 44 (100.0%) |
Household Vehicle Usage in Hope
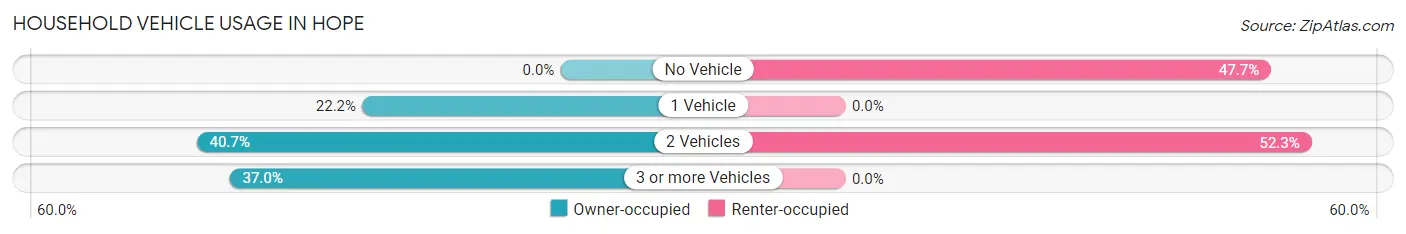
| Vehicles per Household | Owner-occupied | Renter-occupied |
| No Vehicle | 0 (0.0%) | 21 (47.7%) |
| 1 Vehicle | 12 (22.2%) | 0 (0.0%) |
| 2 Vehicles | 22 (40.7%) | 23 (52.3%) |
| 3 or more Vehicles | 20 (37.0%) | 0 (0.0%) |
| Total | 54 (100.0%) | 44 (100.0%) |
Real Estate & Mortgages in Hope
Real Estate and Mortgage Overview in Hope
| Characteristic | Without Mortgage | With Mortgage |
| Housing Units | 25 | 29 |
| Median Property Value | $228,400 | $354,200 |
| Median Household Income | - | - |
| Monthly Housing Costs | $757 | $9 |
| Real Estate Taxes | $5,521 | $0 |
Property Value by Mortgage Status in Hope
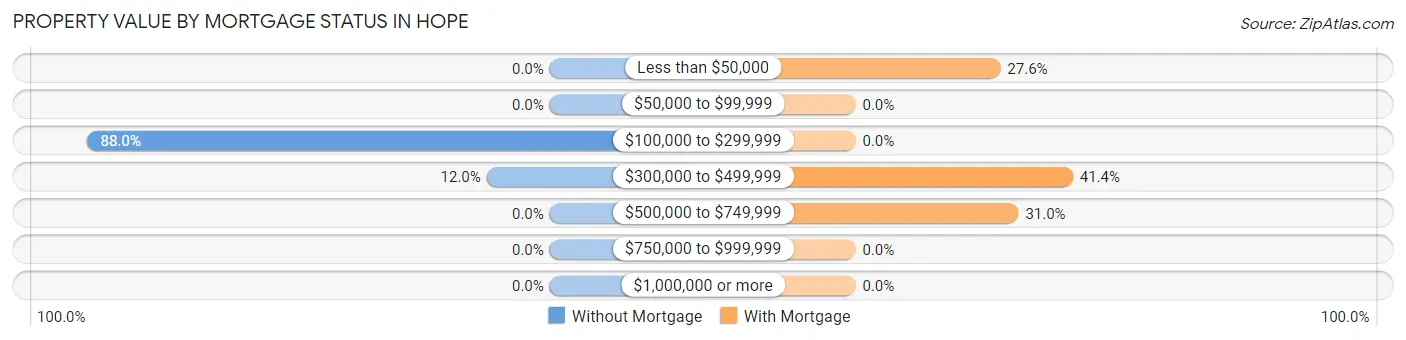
| Property Value | Without Mortgage | With Mortgage |
| Less than $50,000 | 0 (0.0%) | 8 (27.6%) |
| $50,000 to $99,999 | 0 (0.0%) | 0 (0.0%) |
| $100,000 to $299,999 | 22 (88.0%) | 0 (0.0%) |
| $300,000 to $499,999 | 3 (12.0%) | 12 (41.4%) |
| $500,000 to $749,999 | 0 (0.0%) | 9 (31.0%) |
| $750,000 to $999,999 | 0 (0.0%) | 0 (0.0%) |
| $1,000,000 or more | 0 (0.0%) | 0 (0.0%) |
| Total | 25 (100.0%) | 29 (100.0%) |
Household Income by Mortgage Status in Hope
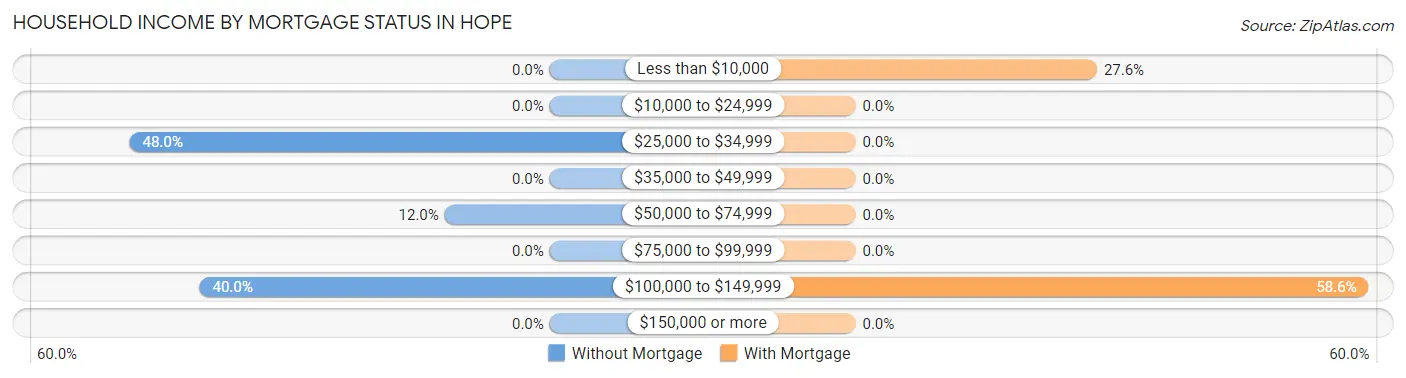
| Household Income | Without Mortgage | With Mortgage |
| Less than $10,000 | 0 (0.0%) | 8 (27.6%) |
| $10,000 to $24,999 | 0 (0.0%) | 0 (0.0%) |
| $25,000 to $34,999 | 12 (48.0%) | 0 (0.0%) |
| $35,000 to $49,999 | 0 (0.0%) | 0 (0.0%) |
| $50,000 to $74,999 | 3 (12.0%) | 0 (0.0%) |
| $75,000 to $99,999 | 0 (0.0%) | 0 (0.0%) |
| $100,000 to $149,999 | 10 (40.0%) | 17 (58.6%) |
| $150,000 or more | 0 (0.0%) | 0 (0.0%) |
| Total | 25 (100.0%) | 29 (100.0%) |
Property Value to Household Income Ratio in Hope
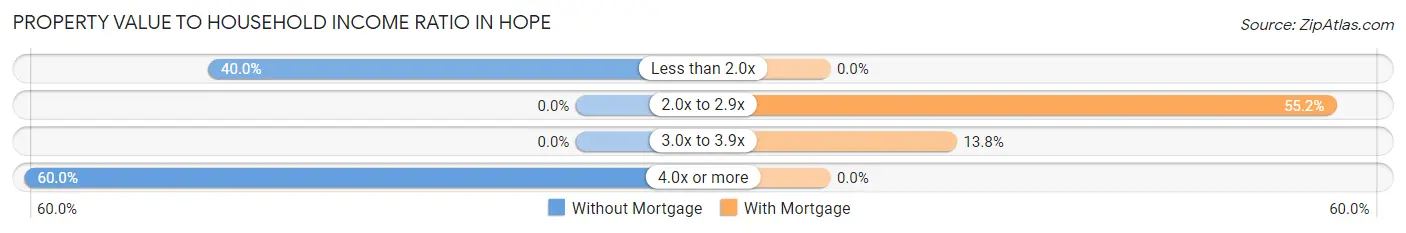
| Value-to-Income Ratio | Without Mortgage | With Mortgage |
| Less than 2.0x | 10 (40.0%) | 0 (0.0%) |
| 2.0x to 2.9x | 0 (0.0%) | 16 (55.2%) |
| 3.0x to 3.9x | 0 (0.0%) | 4 (13.8%) |
| 4.0x or more | 15 (60.0%) | 0 (0.0%) |
| Total | 25 (100.0%) | 29 (100.0%) |
Real Estate Taxes by Mortgage Status in Hope
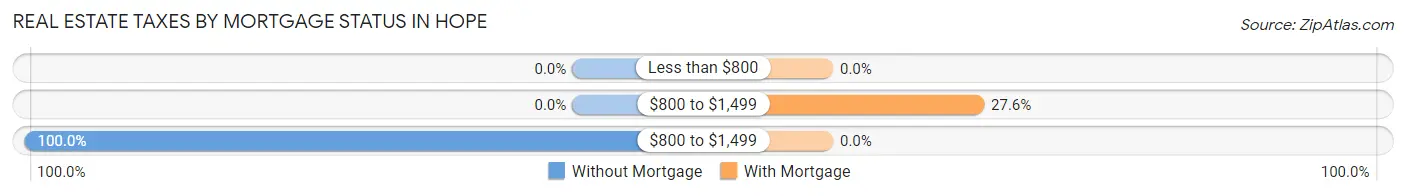
| Property Taxes | Without Mortgage | With Mortgage |
| Less than $800 | 0 (0.0%) | 0 (0.0%) |
| $800 to $1,499 | 0 (0.0%) | 8 (27.6%) |
| $800 to $1,499 | 25 (100.0%) | 0 (0.0%) |
| Total | 25 (100.0%) | 29 (100.0%) |
Health & Disability in Hope
Health Insurance Coverage by Age in Hope
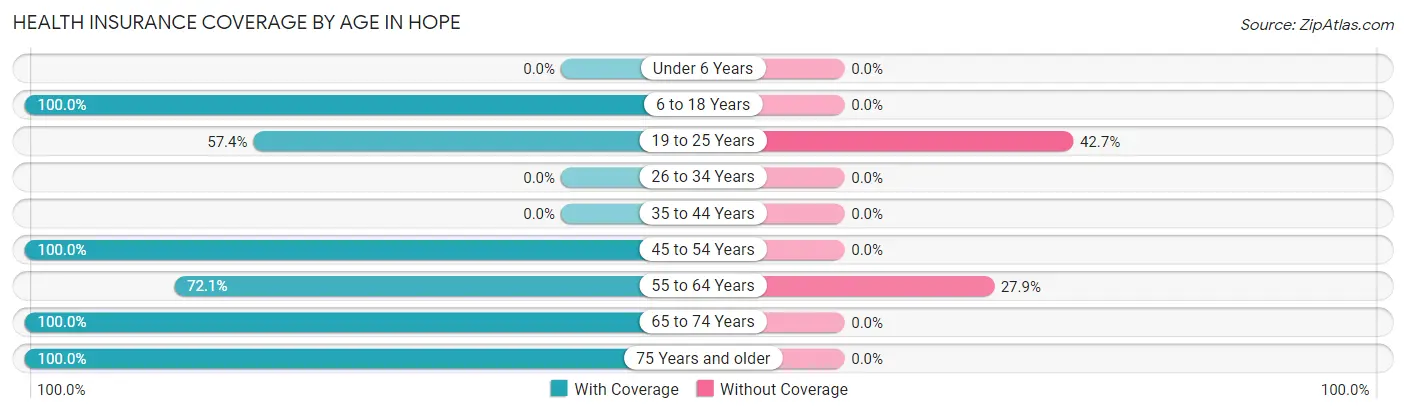
| Age Bracket | With Coverage | Without Coverage |
| Under 6 Years | 0 (0.0%) | 0 (0.0%) |
| 6 to 18 Years | 10 (100.0%) | 0 (0.0%) |
| 19 to 25 Years | 39 (57.4%) | 29 (42.6%) |
| 26 to 34 Years | 0 (0.0%) | 0 (0.0%) |
| 35 to 44 Years | 0 (0.0%) | 0 (0.0%) |
| 45 to 54 Years | 33 (100.0%) | 0 (0.0%) |
| 55 to 64 Years | 44 (72.1%) | 17 (27.9%) |
| 65 to 74 Years | 20 (100.0%) | 0 (0.0%) |
| 75 Years and older | 27 (100.0%) | 0 (0.0%) |
| Total | 173 (79.0%) | 46 (21.0%) |
Health Insurance Coverage by Citizenship Status in Hope
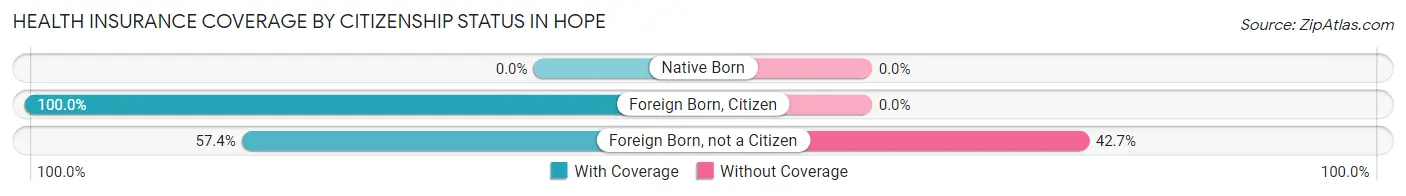
| Citizenship Status | With Coverage | Without Coverage |
| Native Born | 0 (0.0%) | 0 (0.0%) |
| Foreign Born, Citizen | 10 (100.0%) | 0 (0.0%) |
| Foreign Born, not a Citizen | 39 (57.4%) | 29 (42.6%) |
Health Insurance Coverage by Household Income in Hope
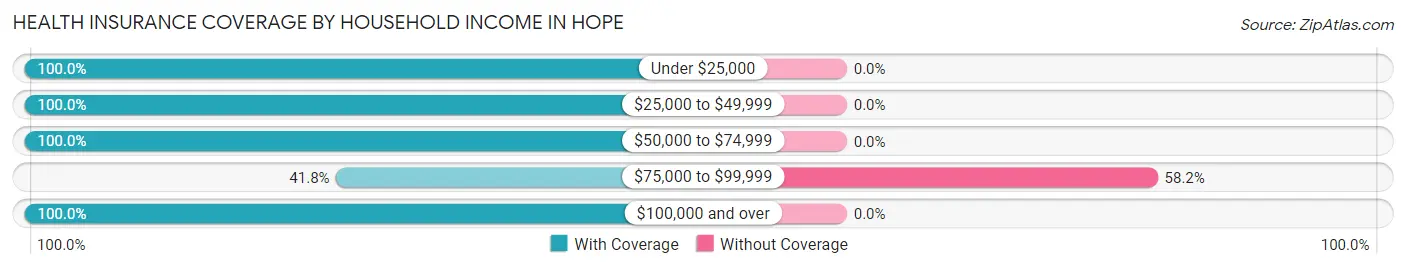
| Household Income | With Coverage | Without Coverage |
| Under $25,000 | 3 (100.0%) | 0 (0.0%) |
| $25,000 to $49,999 | 24 (100.0%) | 0 (0.0%) |
| $50,000 to $74,999 | 38 (100.0%) | 0 (0.0%) |
| $75,000 to $99,999 | 33 (41.8%) | 46 (58.2%) |
| $100,000 and over | 75 (100.0%) | 0 (0.0%) |
Public vs Private Health Insurance Coverage by Age in Hope
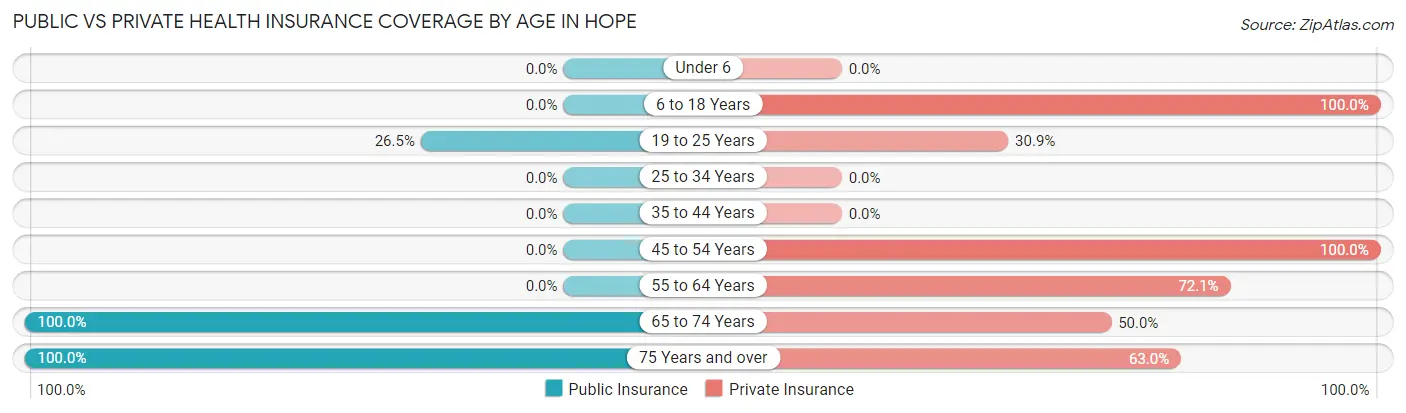
| Age Bracket | Public Insurance | Private Insurance |
| Under 6 | 0 (0.0%) | 0 (0.0%) |
| 6 to 18 Years | 0 (0.0%) | 10 (100.0%) |
| 19 to 25 Years | 18 (26.5%) | 21 (30.9%) |
| 25 to 34 Years | 0 (0.0%) | 0 (0.0%) |
| 35 to 44 Years | 0 (0.0%) | 0 (0.0%) |
| 45 to 54 Years | 0 (0.0%) | 33 (100.0%) |
| 55 to 64 Years | 0 (0.0%) | 44 (72.1%) |
| 65 to 74 Years | 20 (100.0%) | 10 (50.0%) |
| 75 Years and over | 27 (100.0%) | 17 (63.0%) |
| Total | 65 (29.7%) | 135 (61.6%) |
Disability Status by Sex by Age in Hope
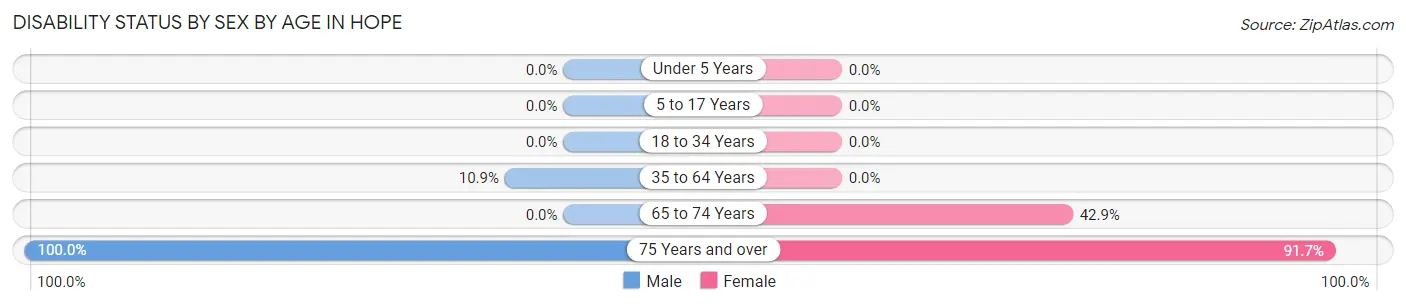
| Age Bracket | Male | Female |
| Under 5 Years | 0 (0.0%) | 0 (0.0%) |
| 5 to 17 Years | 0 (0.0%) | 0 (0.0%) |
| 18 to 34 Years | 0 (0.0%) | 0 (0.0%) |
| 35 to 64 Years | 5 (10.9%) | 0 (0.0%) |
| 65 to 74 Years | 0 (0.0%) | 3 (42.9%) |
| 75 Years and over | 3 (100.0%) | 22 (91.7%) |
Disability Class by Sex by Age in Hope
Disability Class: Hearing Difficulty
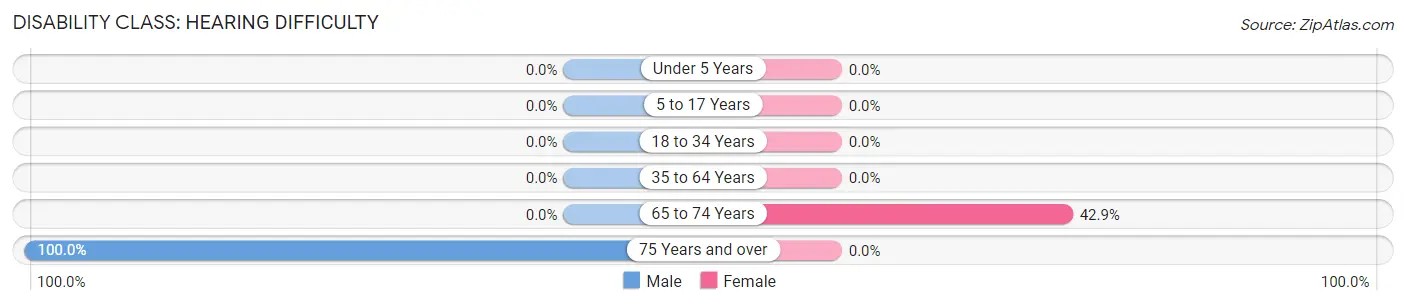
| Age Bracket | Male | Female |
| Under 5 Years | 0 (0.0%) | 0 (0.0%) |
| 5 to 17 Years | 0 (0.0%) | 0 (0.0%) |
| 18 to 34 Years | 0 (0.0%) | 0 (0.0%) |
| 35 to 64 Years | 0 (0.0%) | 0 (0.0%) |
| 65 to 74 Years | 0 (0.0%) | 3 (42.9%) |
| 75 Years and over | 3 (100.0%) | 0 (0.0%) |
Disability Class: Vision Difficulty
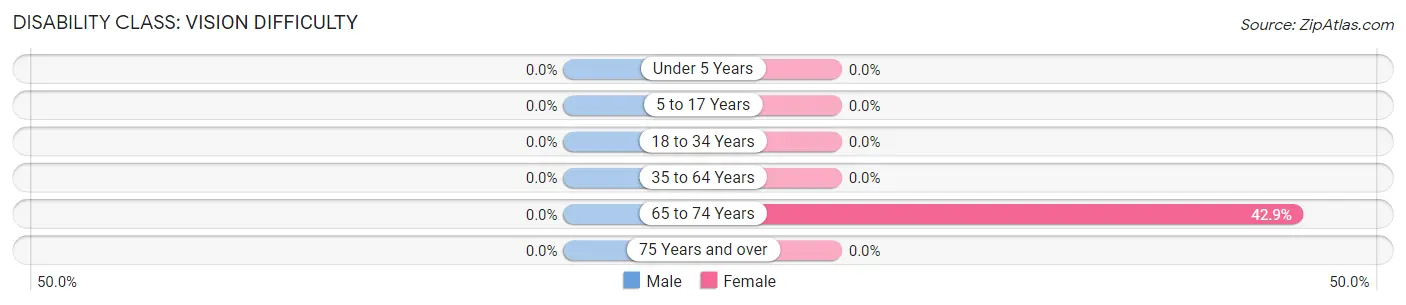
| Age Bracket | Male | Female |
| Under 5 Years | 0 (0.0%) | 0 (0.0%) |
| 5 to 17 Years | 0 (0.0%) | 0 (0.0%) |
| 18 to 34 Years | 0 (0.0%) | 0 (0.0%) |
| 35 to 64 Years | 0 (0.0%) | 0 (0.0%) |
| 65 to 74 Years | 0 (0.0%) | 3 (42.9%) |
| 75 Years and over | 0 (0.0%) | 0 (0.0%) |
Disability Class: Cognitive Difficulty
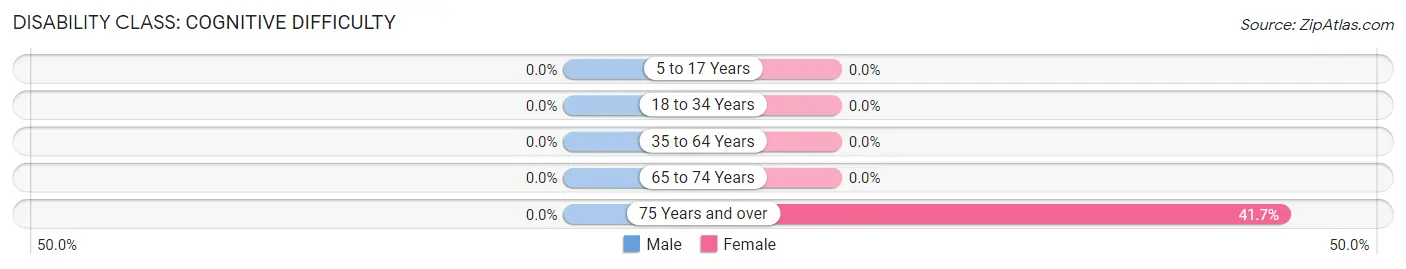
| Age Bracket | Male | Female |
| 5 to 17 Years | 0 (0.0%) | 0 (0.0%) |
| 18 to 34 Years | 0 (0.0%) | 0 (0.0%) |
| 35 to 64 Years | 0 (0.0%) | 0 (0.0%) |
| 65 to 74 Years | 0 (0.0%) | 0 (0.0%) |
| 75 Years and over | 0 (0.0%) | 10 (41.7%) |
Disability Class: Ambulatory Difficulty
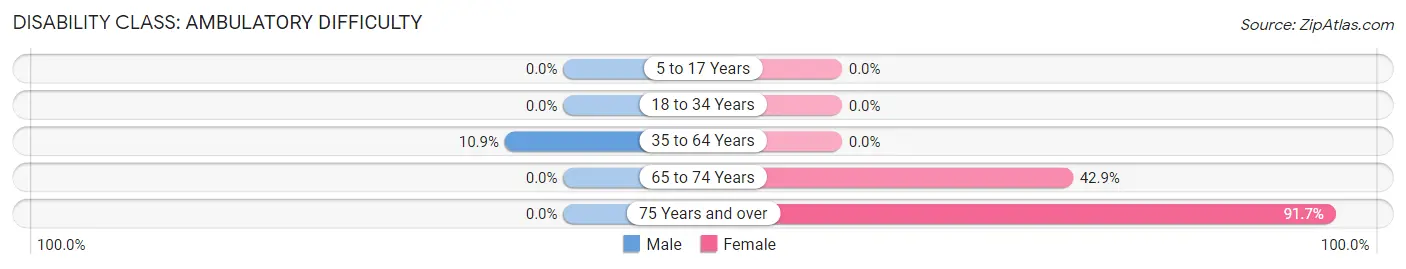
| Age Bracket | Male | Female |
| 5 to 17 Years | 0 (0.0%) | 0 (0.0%) |
| 18 to 34 Years | 0 (0.0%) | 0 (0.0%) |
| 35 to 64 Years | 5 (10.9%) | 0 (0.0%) |
| 65 to 74 Years | 0 (0.0%) | 3 (42.9%) |
| 75 Years and over | 0 (0.0%) | 22 (91.7%) |
Disability Class: Self-Care Difficulty
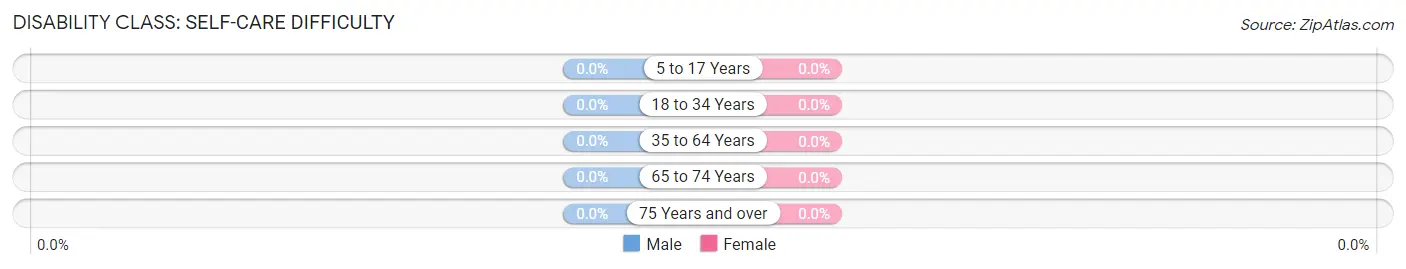
| Age Bracket | Male | Female |
| 5 to 17 Years | 0 (0.0%) | 0 (0.0%) |
| 18 to 34 Years | 0 (0.0%) | 0 (0.0%) |
| 35 to 64 Years | 0 (0.0%) | 0 (0.0%) |
| 65 to 74 Years | 0 (0.0%) | 0 (0.0%) |
| 75 Years and over | 0 (0.0%) | 0 (0.0%) |
Technology Access in Hope
Computing Device Access in Hope
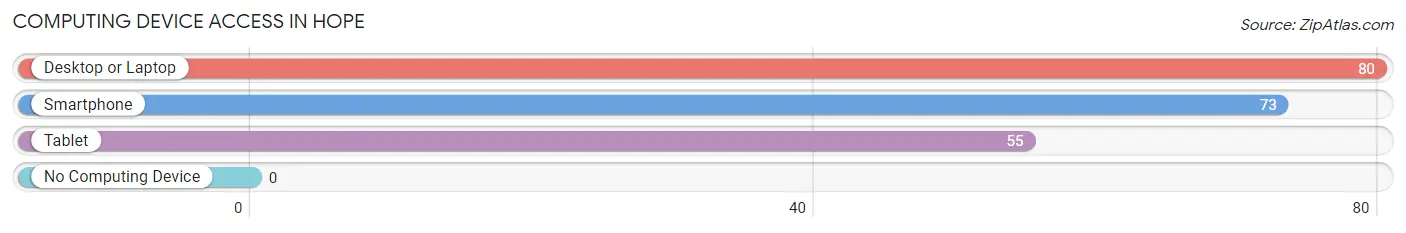
| Device Type | # Households | % Households |
| Desktop or Laptop | 80 | 81.6% |
| Smartphone | 73 | 74.5% |
| Tablet | 55 | 56.1% |
| No Computing Device | 0 | 0.0% |
| Total | 98 | 100.0% |
Internet Access in Hope
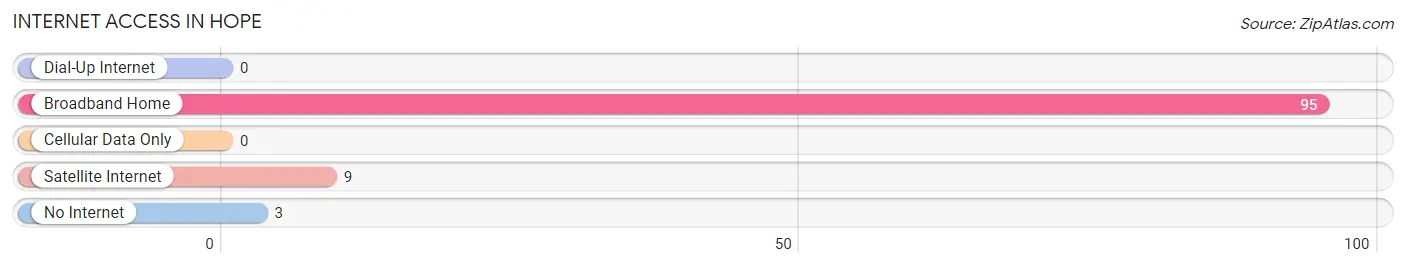
| Internet Type | # Households | % Households |
| Dial-Up Internet | 0 | 0.0% |
| Broadband Home | 95 | 96.9% |
| Cellular Data Only | 0 | 0.0% |
| Satellite Internet | 9 | 9.2% |
| No Internet | 3 | 3.1% |
| Total | 98 | 100.0% |
Hope Summary
Hope is a small borough located in Warren County, New Jersey. It is situated in the northwest corner of the state, near the Delaware River. The borough was incorporated in 1891 and is home to a population of 1,952 people, according to the 2010 United States Census.
Geography
Hope is located at 40°51'25" North, 75°10'45" West (40.856944, -75.179167). It is situated in the northwest corner of Warren County, near the Delaware River. The borough is bordered by Blairstown Township to the north, White Township to the east, and Knowlton Township to the south. The total area of Hope is 4.2 square miles, of which 0.02 square miles is water.
The terrain of Hope is mostly hilly, with some flat areas near the Delaware River. The highest point in the borough is 890 feet above sea level, located near the intersection of County Route 519 and County Route 619. The climate in Hope is humid continental, with cold winters and hot, humid summers.
Economy
The economy of Hope is largely based on agriculture and tourism. The borough is home to several farms, which produce a variety of crops, including corn, soybeans, and hay. The area is also popular with tourists, who come to enjoy the scenic views of the Delaware River and the surrounding countryside.
In addition to agriculture and tourism, Hope is home to several small businesses, including a hardware store, a gas station, and a few restaurants. The borough also has a post office and a library.
Demographics
As of the 2010 United States Census, there were 1,952 people living in Hope. The racial makeup of the borough was 94.3% White, 2.2% African American, 0.2% Native American, 0.7% Asian, 0.1% Pacific Islander, 1.2% from other races, and 1.4% from two or more races. Hispanic or Latino of any race were 4.2% of the population.
The median household income in Hope was $63,750, and the median family income was $76,250. The per capita income for the borough was $30,945. About 4.3% of families and 5.7% of the population were below the poverty line, including 8.2% of those under age 18 and 4.2% of those age 65 or over.
Education
Hope is served by the Hope Township School District, which operates two schools: Hope Township Elementary School and Hope Township Middle School. The district also operates a preschool program. The nearest high school is located in Blairstown Township.
Conclusion
Hope is a small borough located in Warren County, New Jersey. It is situated in the northwest corner of the state, near the Delaware River. The borough was incorporated in 1891 and is home to a population of 1,952 people, according to the 2010 United States Census. The economy of Hope is largely based on agriculture and tourism, and the borough is served by the Hope Township School District. Hope is a peaceful and scenic place to live, with a rich history and a diverse population.
Common Questions
What is Per Capita Income in Hope?
Per Capita income in Hope is $40,773.
What is the Median Household income in Hope?
Median Household Income in Hope is $77,361.
What is Inequality or Gini Index in Hope?
Inequality or Gini Index in Hope is 0.30.
What is the Total Population of Hope?
Total Population of Hope is 219.
What is the Total Male Population of Hope?
Total Male Population of Hope is 120.
What is the Total Female Population of Hope?
Total Female Population of Hope is 99.
What is the Ratio of Males per 100 Females in Hope?
There are 121.21 Males per 100 Females in Hope.
What is the Ratio of Females per 100 Males in Hope?
There are 82.50 Females per 100 Males in Hope.
What is the Median Population Age in Hope?
Median Population Age in Hope is 54.9 Years.
What is the Average Family Size in Hope
Average Family Size in Hope is 2.7 People.
What is the Average Household Size in Hope
Average Household Size in Hope is 2.2 People.
How Large is the Labor Force in Hope?
There are 163 People in the Labor Forcein in Hope.
What is the Percentage of People in the Labor Force in Hope?
76.2% of People are in the Labor Force in Hope.