Cities with the Highest Percentage of Asian Population in Tennessee
RELATED REPORTS & OPTIONS
Asian
Tennessee
Compare Cities
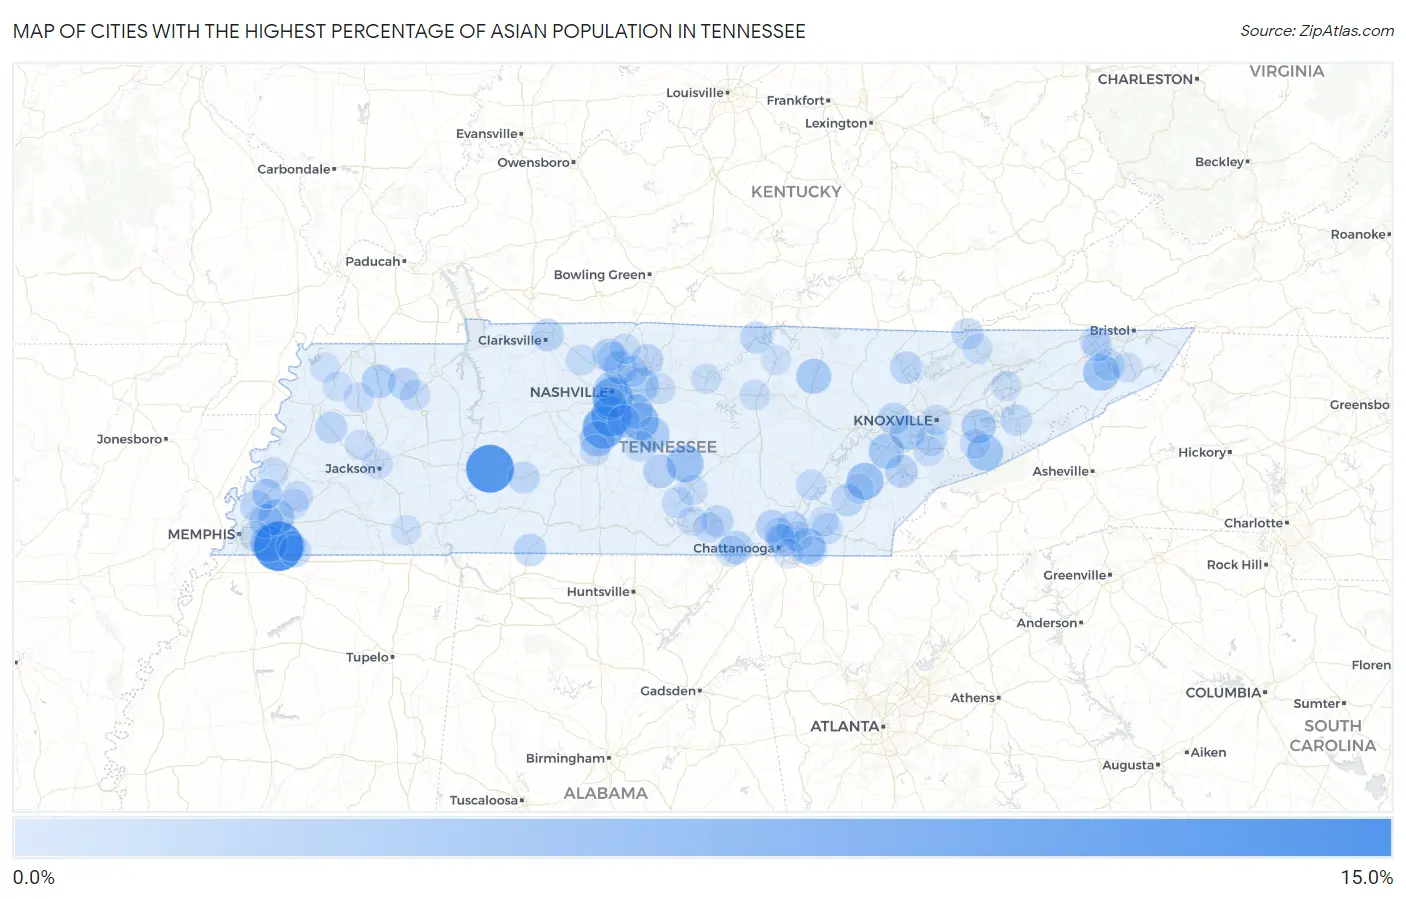
Map of Cities with the Highest Percentage of Asian Population in Tennessee
0.0%
15.0%
Cities with the Highest Percentage of Asian Population in Tennessee
| City | Asian | vs State | vs National | |
| 1. | Collierville | 13.8% | 1.9%(+11.9)#1 | 5.8%(+8.02)#920 |
| 2. | Linden | 12.7% | 1.9%(+10.8)#2 | 5.8%(+6.89)#1,038 |
| 3. | Franklin | 8.8% | 1.9%(+6.96)#3 | 5.8%(+3.04)#1,644 |
| 4. | Brentwood | 7.9% | 1.9%(+6.00)#4 | 5.8%(+2.08)#1,845 |
| 5. | Blanche | 7.7% | 1.9%(+5.81)#5 | 5.8%(+1.89)#1,893 |
| 6. | Berry Hill | 7.6% | 1.9%(+5.76)#6 | 5.8%(+1.85)#1,907 |
| 7. | Smyrna | 6.0% | 1.9%(+4.18)#7 | 5.8%(+0.269)#2,451 |
| 8. | Niota | 5.5% | 1.9%(+3.67)#8 | 5.8%(-0.241)#2,698 |
| 9. | Lakewood Park | 5.5% | 1.9%(+3.66)#9 | 5.8%(-0.259)#2,712 |
| 10. | Germantown | 5.4% | 1.9%(+3.53)#10 | 5.8%(-0.383)#2,769 |
| 11. | Jonesborough | 5.1% | 1.9%(+3.23)#11 | 5.8%(-0.680)#2,944 |
| 12. | Gatlinburg | 5.0% | 1.9%(+3.09)#12 | 5.8%(-0.822)#3,012 |
| 13. | Lakeland | 4.8% | 1.9%(+2.94)#13 | 5.8%(-0.979)#3,099 |
| 14. | Collegedale | 4.6% | 1.9%(+2.76)#14 | 5.8%(-1.15)#3,215 |
| 15. | Thompson S Station | 4.5% | 1.9%(+2.61)#15 | 5.8%(-1.30)#3,330 |
| 16. | Loudon | 4.3% | 1.9%(+2.43)#16 | 5.8%(-1.49)#3,461 |
| 17. | Grimsley | 4.3% | 1.9%(+2.42)#17 | 5.8%(-1.50)#3,467 |
| 18. | Mount Juliet | 4.2% | 1.9%(+2.32)#18 | 5.8%(-1.59)#3,551 |
| 19. | Mcdonald | 4.1% | 1.9%(+2.22)#19 | 5.8%(-1.70)#3,631 |
| 20. | Farragut | 3.8% | 1.9%(+1.99)#20 | 5.8%(-1.92)#3,827 |
| 21. | Sevierville | 3.8% | 1.9%(+1.92)#21 | 5.8%(-2.00)#3,880 |
| 22. | La Vergne | 3.6% | 1.9%(+1.79)#22 | 5.8%(-2.13)#3,995 |
| 23. | Nashville | 3.6% | 1.9%(+1.77)#23 | 5.8%(-2.14)#4,016 |
| 24. | Murfreesboro | 3.6% | 1.9%(+1.71)#24 | 5.8%(-2.21)#4,075 |
| 25. | Bartlett | 3.5% | 1.9%(+1.66)#25 | 5.8%(-2.26)#4,118 |
| 26. | Sharon | 3.5% | 1.9%(+1.65)#26 | 5.8%(-2.26)#4,127 |
| 27. | Goodlettsville | 3.3% | 1.9%(+1.44)#27 | 5.8%(-2.48)#4,365 |
| 28. | Bell Buckle | 3.2% | 1.9%(+1.36)#28 | 5.8%(-2.55)#4,458 |
| 29. | Rocky Top | 3.1% | 1.9%(+1.29)#29 | 5.8%(-2.63)#4,551 |
| 30. | Oak Hill | 3.0% | 1.9%(+1.16)#30 | 5.8%(-2.75)#4,716 |
| 31. | Kimball | 3.0% | 1.9%(+1.13)#31 | 5.8%(-2.78)#4,750 |
| 32. | Greenbrier | 2.8% | 1.9%(+0.975)#32 | 5.8%(-2.94)#4,967 |
| 33. | Vonore | 2.8% | 1.9%(+0.975)#33 | 5.8%(-2.94)#4,969 |
| 34. | Lone Oak | 2.8% | 1.9%(+0.920)#34 | 5.8%(-2.99)#5,055 |
| 35. | Nolensville | 2.8% | 1.9%(+0.912)#35 | 5.8%(-3.00)#5,064 |
| 36. | Clarksville | 2.7% | 1.9%(+0.840)#36 | 5.8%(-3.07)#5,151 |
| 37. | Riceville | 2.7% | 1.9%(+0.839)#37 | 5.8%(-3.08)#5,152 |
| 38. | St Joseph | 2.7% | 1.9%(+0.817)#38 | 5.8%(-3.10)#5,186 |
| 39. | Middle Valley | 2.7% | 1.9%(+0.802)#39 | 5.8%(-3.11)#5,212 |
| 40. | Jacksboro | 2.6% | 1.9%(+0.701)#40 | 5.8%(-3.21)#5,351 |
| 41. | Rossville | 2.4% | 1.9%(+0.589)#41 | 5.8%(-3.33)#5,507 |
| 42. | Celina | 2.4% | 1.9%(+0.576)#42 | 5.8%(-3.34)#5,535 |
| 43. | Gleason | 2.4% | 1.9%(+0.567)#43 | 5.8%(-3.35)#5,553 |
| 44. | Oak Ridge | 2.4% | 1.9%(+0.555)#44 | 5.8%(-3.36)#5,571 |
| 45. | Chattanooga | 2.4% | 1.9%(+0.552)#45 | 5.8%(-3.36)#5,582 |
| 46. | Millington | 2.4% | 1.9%(+0.548)#46 | 5.8%(-3.37)#5,585 |
| 47. | Friendship | 2.4% | 1.9%(+0.523)#47 | 5.8%(-3.39)#5,621 |
| 48. | Gallatin | 2.4% | 1.9%(+0.514)#48 | 5.8%(-3.40)#5,639 |
| 49. | Monteagle | 2.3% | 1.9%(+0.440)#49 | 5.8%(-3.47)#5,777 |
| 50. | Hohenwald | 2.3% | 1.9%(+0.419)#50 | 5.8%(-3.50)#5,812 |
| 51. | Johnson City | 2.2% | 1.9%(+0.372)#51 | 5.8%(-3.54)#5,904 |
| 52. | Harrogate | 2.2% | 1.9%(+0.338)#52 | 5.8%(-3.58)#5,968 |
| 53. | Ridgetop | 2.1% | 1.9%(+0.204)#53 | 5.8%(-3.71)#6,254 |
| 54. | Newport | 2.0% | 1.9%(+0.157)#54 | 5.8%(-3.76)#6,339 |
| 55. | Alcoa | 2.0% | 1.9%(+0.125)#55 | 5.8%(-3.79)#6,417 |
| 56. | Hendersonville | 2.0% | 1.9%(+0.125)#56 | 5.8%(-3.79)#6,419 |
| 57. | Tullahoma | 1.8% | 1.9%(-0.024)#57 | 5.8%(-3.94)#6,733 |
| 58. | Cleveland | 1.8% | 1.9%(-0.037)#58 | 5.8%(-3.95)#6,764 |
| 59. | Rockvale | 1.8% | 1.9%(-0.080)#59 | 5.8%(-3.99)#6,871 |
| 60. | Dayton | 1.8% | 1.9%(-0.093)#60 | 5.8%(-4.01)#6,903 |
| 61. | South Pittsburg | 1.7% | 1.9%(-0.130)#61 | 5.8%(-4.05)#6,991 |
| 62. | Harrison | 1.7% | 1.9%(-0.150)#62 | 5.8%(-4.06)#7,044 |
| 63. | Pleasant View | 1.7% | 1.9%(-0.179)#63 | 5.8%(-4.09)#7,131 |
| 64. | Memphis | 1.6% | 1.9%(-0.212)#64 | 5.8%(-4.13)#7,210 |
| 65. | Lebanon | 1.6% | 1.9%(-0.215)#65 | 5.8%(-4.13)#7,219 |
| 66. | Mason | 1.6% | 1.9%(-0.220)#66 | 5.8%(-4.13)#7,237 |
| 67. | Sewanee | 1.6% | 1.9%(-0.284)#67 | 5.8%(-4.20)#7,412 |
| 68. | Knoxville | 1.6% | 1.9%(-0.299)#68 | 5.8%(-4.21)#7,464 |
| 69. | Mckenzie | 1.6% | 1.9%(-0.306)#69 | 5.8%(-4.22)#7,479 |
| 70. | Manchester | 1.5% | 1.9%(-0.324)#70 | 5.8%(-4.24)#7,531 |
| 71. | White House | 1.5% | 1.9%(-0.347)#71 | 5.8%(-4.26)#7,600 |
| 72. | Cookeville | 1.5% | 1.9%(-0.376)#72 | 5.8%(-4.29)#7,695 |
| 73. | Walden | 1.4% | 1.9%(-0.415)#73 | 5.8%(-4.33)#7,813 |
| 74. | Maryville | 1.4% | 1.9%(-0.440)#74 | 5.8%(-4.35)#7,891 |
| 75. | Garland | 1.4% | 1.9%(-0.449)#75 | 5.8%(-4.36)#7,918 |
| 76. | Jackson | 1.4% | 1.9%(-0.455)#76 | 5.8%(-4.37)#7,933 |
| 77. | Gadsden | 1.4% | 1.9%(-0.465)#77 | 5.8%(-4.38)#7,967 |
| 78. | Colonial Heights | 1.4% | 1.9%(-0.470)#78 | 5.8%(-4.39)#7,979 |
| 79. | Pigeon Forge | 1.4% | 1.9%(-0.471)#79 | 5.8%(-4.39)#7,981 |
| 80. | Braden | 1.4% | 1.9%(-0.493)#80 | 5.8%(-4.41)#8,039 |
| 81. | Spring Hill | 1.4% | 1.9%(-0.500)#81 | 5.8%(-4.41)#8,069 |
| 82. | Munford | 1.4% | 1.9%(-0.505)#82 | 5.8%(-4.42)#8,085 |
| 83. | Decherd | 1.3% | 1.9%(-0.508)#83 | 5.8%(-4.42)#8,097 |
| 84. | Apison | 1.3% | 1.9%(-0.524)#84 | 5.8%(-4.44)#8,149 |
| 85. | Piperton | 1.3% | 1.9%(-0.539)#85 | 5.8%(-4.45)#8,198 |
| 86. | Rutherford | 1.3% | 1.9%(-0.547)#86 | 5.8%(-4.46)#8,228 |
| 87. | Hopewell | 1.3% | 1.9%(-0.560)#87 | 5.8%(-4.47)#8,280 |
| 88. | Kingsport | 1.3% | 1.9%(-0.566)#88 | 5.8%(-4.48)#8,304 |
| 89. | Red Bank | 1.3% | 1.9%(-0.574)#89 | 5.8%(-4.49)#8,341 |
| 90. | Tazewell | 1.3% | 1.9%(-0.589)#90 | 5.8%(-4.50)#8,400 |
| 91. | Carthage | 1.3% | 1.9%(-0.595)#91 | 5.8%(-4.51)#8,426 |
| 92. | Morristown | 1.2% | 1.9%(-0.612)#92 | 5.8%(-4.53)#8,473 |
| 93. | Hornbeak | 1.2% | 1.9%(-0.663)#93 | 5.8%(-4.58)#8,632 |
| 94. | Atoka | 1.2% | 1.9%(-0.666)#94 | 5.8%(-4.58)#8,643 |
| 95. | Elizabethton | 1.2% | 1.9%(-0.703)#95 | 5.8%(-4.62)#8,776 |
| 96. | East Ridge | 1.2% | 1.9%(-0.705)#96 | 5.8%(-4.62)#8,782 |
| 97. | Livingston | 1.1% | 1.9%(-0.710)#97 | 5.8%(-4.62)#8,797 |
| 98. | Trimble | 1.1% | 1.9%(-0.710)#98 | 5.8%(-4.63)#8,798 |
| 99. | Athens | 1.1% | 1.9%(-0.722)#99 | 5.8%(-4.64)#8,842 |
| 100. | Selmer | 1.1% | 1.9%(-0.733)#100 | 5.8%(-4.65)#8,876 |
Common Questions
What are the Top 10 Cities with the Highest Percentage of Asian Population in Tennessee?
Top 10 Cities with the Highest Percentage of Asian Population in Tennessee are:
#1
13.8%
#2
12.7%
#3
8.8%
#4
7.9%
#5
7.6%
#6
6.0%
#7
5.5%
#8
5.5%
#9
5.4%
#10
5.1%
What city has the Highest Percentage of Asian Population in Tennessee?
Collierville has the Highest Percentage of Asian Population in Tennessee with 13.8%.
What is the Percentage of Asian Population in the State of Tennessee?
Percentage of Asian Population in Tennessee is 1.9%.
What is the Percentage of Asian Population in the United States?
Percentage of Asian Population in the United States is 5.8%.