Cities with the Highest Percentage of Asian Population in Maryland
RELATED REPORTS & OPTIONS
Asian
Maryland
Compare Cities
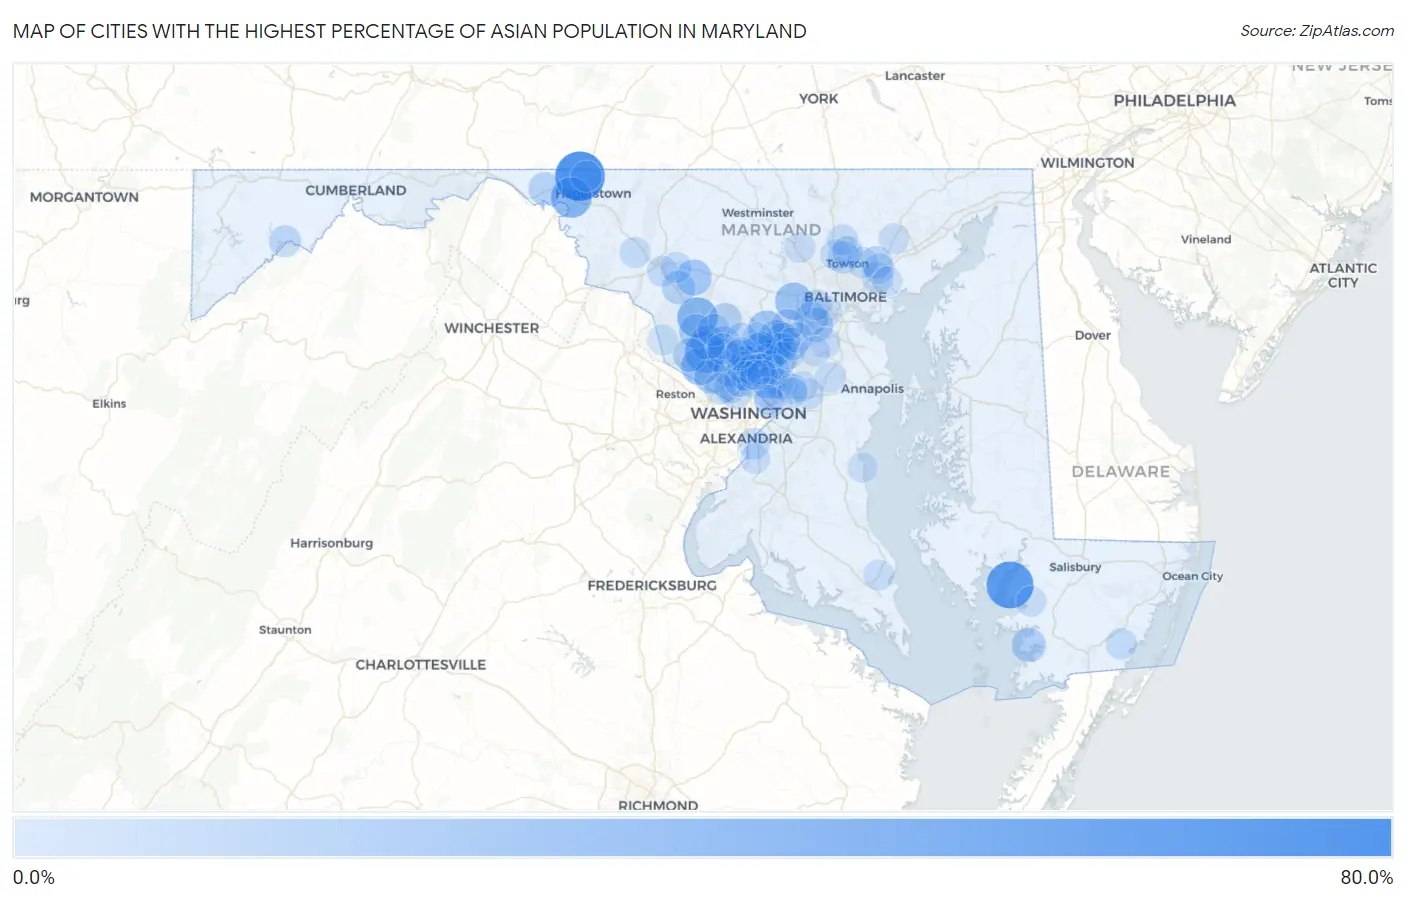
Map of Cities with the Highest Percentage of Asian Population in Maryland
0.0%
80.0%
Cities with the Highest Percentage of Asian Population in Maryland
| City | Asian | vs State | vs National | |
| 1. | Cearfoss | 70.7% | 6.5%(+64.3)#1 | 5.8%(+65.0)#9 |
| 2. | Bivalve | 62.3% | 6.5%(+55.8)#2 | 5.8%(+56.5)#29 |
| 3. | Kemps Mill | 40.7% | 6.5%(+34.3)#3 | 5.8%(+35.0)#135 |
| 4. | North Potomac | 40.7% | 6.5%(+34.2)#4 | 5.8%(+34.9)#136 |
| 5. | Clarksburg | 40.0% | 6.5%(+33.5)#5 | 5.8%(+34.2)#144 |
| 6. | Travilah | 31.2% | 6.5%(+24.7)#6 | 5.8%(+25.4)#251 |
| 7. | Ellicott City | 30.1% | 6.5%(+23.6)#7 | 5.8%(+24.3)#270 |
| 8. | Highland | 26.6% | 6.5%(+20.2)#8 | 5.8%(+20.9)#334 |
| 9. | Burtonsville | 25.6% | 6.5%(+19.1)#9 | 5.8%(+19.8)#363 |
| 10. | Monrovia | 25.3% | 6.5%(+18.8)#10 | 5.8%(+19.5)#375 |
| 11. | Rockville | 22.6% | 6.5%(+16.1)#11 | 5.8%(+16.8)#440 |
| 12. | Fulton | 22.4% | 6.5%(+16.0)#12 | 5.8%(+16.7)#445 |
| 13. | Scaggsville | 21.1% | 6.5%(+14.6)#13 | 5.8%(+15.4)#486 |
| 14. | Gaithersburg | 21.1% | 6.5%(+14.6)#14 | 5.8%(+15.3)#489 |
| 15. | Potomac | 20.6% | 6.5%(+14.1)#15 | 5.8%(+14.8)#506 |
| 16. | Germantown | 20.4% | 6.5%(+13.9)#16 | 5.8%(+14.6)#514 |
| 17. | Fairmount | 19.8% | 6.5%(+13.3)#17 | 5.8%(+14.0)#543 |
| 18. | Elkridge | 19.5% | 6.5%(+13.0)#18 | 5.8%(+13.7)#558 |
| 19. | Ilchester | 19.3% | 6.5%(+12.8)#19 | 5.8%(+13.5)#567 |
| 20. | Darnestown | 19.0% | 6.5%(+12.5)#20 | 5.8%(+13.2)#585 |
| 21. | Cloverly | 17.9% | 6.5%(+11.5)#21 | 5.8%(+12.2)#637 |
| 22. | Urbana | 17.6% | 6.5%(+11.1)#22 | 5.8%(+11.9)#659 |
| 23. | Konterra | 17.5% | 6.5%(+11.0)#23 | 5.8%(+11.7)#673 |
| 24. | Laytonsville | 17.3% | 6.5%(+10.8)#24 | 5.8%(+11.5)#687 |
| 25. | Clear Spring | 16.3% | 6.5%(+9.81)#25 | 5.8%(+10.5)#742 |
| 26. | North Bethesda | 15.9% | 6.5%(+9.38)#26 | 5.8%(+10.1)#774 |
| 27. | Redland | 15.7% | 6.5%(+9.17)#27 | 5.8%(+9.88)#790 |
| 28. | Layhill | 15.6% | 6.5%(+9.16)#28 | 5.8%(+9.88)#791 |
| 29. | Woodlawn Cdp Baltimore County | 15.2% | 6.5%(+8.69)#29 | 5.8%(+9.41)#823 |
| 30. | Flower Hill | 15.0% | 6.5%(+8.54)#30 | 5.8%(+9.26)#834 |
| 31. | Perry Hall | 14.5% | 6.5%(+8.01)#31 | 5.8%(+8.72)#859 |
| 32. | North Laurel | 14.2% | 6.5%(+7.75)#32 | 5.8%(+8.47)#880 |
| 33. | Lutherville | 14.1% | 6.5%(+7.66)#33 | 5.8%(+8.37)#884 |
| 34. | Kensington | 14.1% | 6.5%(+7.66)#34 | 5.8%(+8.37)#885 |
| 35. | College Park | 14.0% | 6.5%(+7.55)#35 | 5.8%(+8.26)#896 |
| 36. | Friendship Heights Village | 13.6% | 6.5%(+7.14)#36 | 5.8%(+7.85)#940 |
| 37. | Honeygo | 13.5% | 6.5%(+7.05)#37 | 5.8%(+7.77)#950 |
| 38. | Colesville | 13.2% | 6.5%(+6.74)#38 | 5.8%(+7.46)#992 |
| 39. | Montgomery Village | 13.2% | 6.5%(+6.73)#39 | 5.8%(+7.45)#993 |
| 40. | Columbia | 13.0% | 6.5%(+6.53)#40 | 5.8%(+7.25)#1,014 |
| 41. | Olney | 13.0% | 6.5%(+6.47)#41 | 5.8%(+7.19)#1,016 |
| 42. | Bloomington | 12.8% | 6.5%(+6.29)#42 | 5.8%(+7.01)#1,026 |
| 43. | Calverton | 12.1% | 6.5%(+5.66)#43 | 5.8%(+6.37)#1,106 |
| 44. | Fairland | 11.9% | 6.5%(+5.38)#44 | 5.8%(+6.09)#1,139 |
| 45. | Greenbelt | 11.7% | 6.5%(+5.20)#45 | 5.8%(+5.92)#1,159 |
| 46. | Bethesda | 11.7% | 6.5%(+5.17)#46 | 5.8%(+5.89)#1,165 |
| 47. | Cabin John | 11.6% | 6.5%(+5.08)#47 | 5.8%(+5.79)#1,178 |
| 48. | National Harbor | 11.5% | 6.5%(+5.04)#48 | 5.8%(+5.76)#1,186 |
| 49. | Rossville | 11.5% | 6.5%(+5.00)#49 | 5.8%(+5.72)#1,198 |
| 50. | North Chevy Chase | 11.5% | 6.5%(+4.97)#50 | 5.8%(+5.68)#1,202 |
| 51. | West Laurel | 11.2% | 6.5%(+4.73)#51 | 5.8%(+5.45)#1,237 |
| 52. | Spencerville | 11.0% | 6.5%(+4.55)#52 | 5.8%(+5.27)#1,260 |
| 53. | Wheaton | 11.0% | 6.5%(+4.48)#53 | 5.8%(+5.19)#1,273 |
| 54. | Girdletree | 10.7% | 6.5%(+4.17)#54 | 5.8%(+4.88)#1,320 |
| 55. | Glenmont | 10.3% | 6.5%(+3.85)#55 | 5.8%(+4.56)#1,360 |
| 56. | Derwood | 10.3% | 6.5%(+3.78)#56 | 5.8%(+4.50)#1,373 |
| 57. | Mays Chapel | 10.1% | 6.5%(+3.57)#57 | 5.8%(+4.29)#1,405 |
| 58. | Carney | 10.0% | 6.5%(+3.49)#58 | 5.8%(+4.21)#1,414 |
| 59. | Bartonsville | 9.9% | 6.5%(+3.42)#59 | 5.8%(+4.13)#1,430 |
| 60. | Aspen Hill | 9.8% | 6.5%(+3.30)#60 | 5.8%(+4.02)#1,453 |
| 61. | Maugansville | 9.7% | 6.5%(+3.19)#61 | 5.8%(+3.90)#1,481 |
| 62. | Middletown | 9.6% | 6.5%(+3.16)#62 | 5.8%(+3.87)#1,488 |
| 63. | Laurel | 9.5% | 6.5%(+3.06)#63 | 5.8%(+3.77)#1,501 |
| 64. | Cockeysville | 9.5% | 6.5%(+3.05)#64 | 5.8%(+3.77)#1,502 |
| 65. | White Marsh | 9.4% | 6.5%(+2.95)#65 | 5.8%(+3.67)#1,517 |
| 66. | Ballenger Creek | 9.4% | 6.5%(+2.95)#66 | 5.8%(+3.66)#1,518 |
| 67. | Burnt Mills | 9.4% | 6.5%(+2.94)#67 | 5.8%(+3.65)#1,520 |
| 68. | Poolesville | 9.2% | 6.5%(+2.68)#68 | 5.8%(+3.39)#1,565 |
| 69. | Leisure World | 9.1% | 6.5%(+2.60)#69 | 5.8%(+3.32)#1,580 |
| 70. | Crofton | 8.9% | 6.5%(+2.46)#70 | 5.8%(+3.18)#1,616 |
| 71. | Pleasant Hills | 8.9% | 6.5%(+2.46)#71 | 5.8%(+3.17)#1,619 |
| 72. | Timonium | 8.8% | 6.5%(+2.34)#72 | 5.8%(+3.06)#1,643 |
| 73. | Fairwood | 8.7% | 6.5%(+2.22)#73 | 5.8%(+2.93)#1,664 |
| 74. | Mount Vernon | 8.6% | 6.5%(+2.13)#74 | 5.8%(+2.84)#1,675 |
| 75. | Catonsville | 8.6% | 6.5%(+2.07)#75 | 5.8%(+2.79)#1,690 |
| 76. | Silver Spring | 8.5% | 6.5%(+1.98)#76 | 5.8%(+2.69)#1,708 |
| 77. | Severn | 8.4% | 6.5%(+1.88)#77 | 5.8%(+2.60)#1,726 |
| 78. | Kemp Mill | 8.3% | 6.5%(+1.83)#78 | 5.8%(+2.54)#1,741 |
| 79. | Solomons | 8.3% | 6.5%(+1.81)#79 | 5.8%(+2.52)#1,744 |
| 80. | Reisterstown | 8.1% | 6.5%(+1.66)#80 | 5.8%(+2.37)#1,778 |
| 81. | Glenn Dale | 8.1% | 6.5%(+1.65)#81 | 5.8%(+2.37)#1,780 |
| 82. | Adelphi | 8.1% | 6.5%(+1.58)#82 | 5.8%(+2.30)#1,794 |
| 83. | White Oak | 7.9% | 6.5%(+1.46)#83 | 5.8%(+2.17)#1,822 |
| 84. | Savage | 7.8% | 6.5%(+1.28)#84 | 5.8%(+2.00)#1,864 |
| 85. | Fort Meade | 7.8% | 6.5%(+1.27)#85 | 5.8%(+1.99)#1,869 |
| 86. | Ashton Sandy Spring | 7.7% | 6.5%(+1.24)#86 | 5.8%(+1.95)#1,874 |
| 87. | Forest Glen | 7.7% | 6.5%(+1.21)#87 | 5.8%(+1.93)#1,886 |
| 88. | Berwyn Heights | 7.7% | 6.5%(+1.18)#88 | 5.8%(+1.90)#1,891 |
| 89. | Colmar Manor | 7.7% | 6.5%(+1.16)#89 | 5.8%(+1.88)#1,897 |
| 90. | Fort Washington | 7.6% | 6.5%(+1.11)#90 | 5.8%(+1.82)#1,912 |
| 91. | Seabrook | 7.4% | 6.5%(+0.947)#91 | 5.8%(+1.66)#1,953 |
| 92. | Arbutus | 7.3% | 6.5%(+0.818)#92 | 5.8%(+1.53)#1,990 |
| 93. | North Beach | 7.0% | 6.5%(+0.504)#93 | 5.8%(+1.22)#2,093 |
| 94. | Beltsville | 6.8% | 6.5%(+0.318)#94 | 5.8%(+1.03)#2,167 |
| 95. | Hillandale | 6.8% | 6.5%(+0.310)#95 | 5.8%(+1.02)#2,168 |
| 96. | Hyattsville | 6.7% | 6.5%(+0.236)#96 | 5.8%(+0.951)#2,187 |
| 97. | Middle River | 6.7% | 6.5%(+0.189)#97 | 5.8%(+0.904)#2,207 |
| 98. | Lanham | 6.7% | 6.5%(+0.184)#98 | 5.8%(+0.899)#2,210 |
| 99. | Cottage City | 6.5% | 6.5%(+0.060)#99 | 5.8%(+0.774)#2,251 |
| 100. | Four Corners | 6.5% | 6.5%(+0.028)#100 | 5.8%(+0.743)#2,262 |
Common Questions
What are the Top 10 Cities with the Highest Percentage of Asian Population in Maryland?
Top 10 Cities with the Highest Percentage of Asian Population in Maryland are:
#1
70.7%
#2
62.3%
#3
40.7%
#4
40.7%
#5
40.0%
#6
31.2%
#7
30.1%
#8
26.6%
#9
25.6%
#10
25.3%
What city has the Highest Percentage of Asian Population in Maryland?
Cearfoss has the Highest Percentage of Asian Population in Maryland with 70.7%.
What is the Percentage of Asian Population in the State of Maryland?
Percentage of Asian Population in Maryland is 6.5%.
What is the Percentage of Asian Population in the United States?
Percentage of Asian Population in the United States is 5.8%.