Closter borough, NJ Map & Demographics
Closter borough Overview
$69,763
PER CAPITA INCOME
$193,148
AVG FAMILY INCOME
$181,652
AVG HOUSEHOLD INCOME
41.3%
WAGE / INCOME GAP [ % ]
58.7¢/ $1
WAGE / INCOME GAP [ $ ]
$11,585
FAMILY INCOME DEFICIT
0.43
INEQUALITY / GINI INDEX
8,555
TOTAL POPULATION
4,474
MALE POPULATION
4,081
FEMALE POPULATION
109.63
MALES / 100 FEMALES
91.22
FEMALES / 100 MALES
40.4
MEDIAN AGE
3.4
AVG FAMILY SIZE
3.1
AVG HOUSEHOLD SIZE
4,621
LABOR FORCE [ PEOPLE ]
70.8%
PERCENT IN LABOR FORCE
3.8%
UNEMPLOYMENT RATE
Income in Closter borough
Income Overview in Closter borough
Per Capita Income in Closter borough is $69,763, while median incomes of families and households are $193,148 and $181,652 respectively.
| Characteristic | Number | Measure |
| Per Capita Income | 8,555 | $69,763 |
| Median Family Income | 2,344 | $193,148 |
| Mean Family Income | 2,344 | $231,911 |
| Median Household Income | 2,721 | $181,652 |
| Mean Household Income | 2,721 | $223,247 |
| Income Deficit | 2,344 | $11,585 |
| Wage / Income Gap (%) | 8,555 | 41.29% |
| Wage / Income Gap ($) | 8,555 | 58.71¢ per $1 |
| Gini / Inequality Index | 8,555 | 0.43 |
Earnings by Sex in Closter borough
Average Earnings in Closter borough are $68,782, $89,306 for men and $52,436 for women, a difference of 41.3%.
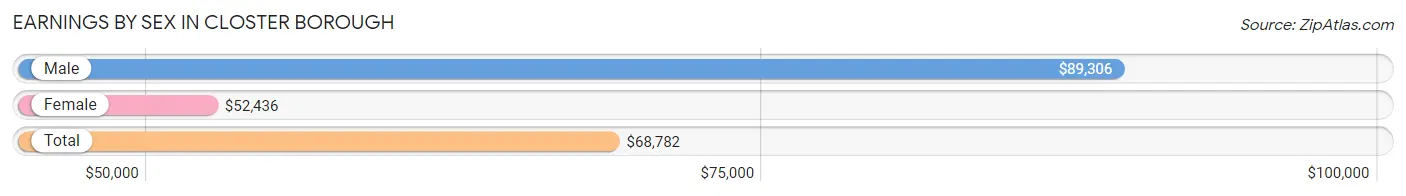
| Sex | Number | Average Earnings |
| Male | 2,408 (50.6%) | $89,306 |
| Female | 2,350 (49.4%) | $52,436 |
| Total | 4,758 (100.0%) | $68,782 |
Earnings by Sex by Income Bracket in Closter borough
The most common earnings brackets in Closter borough are $100,000+ for men (1,091 | 45.3%) and $100,000+ for women (640 | 27.2%).
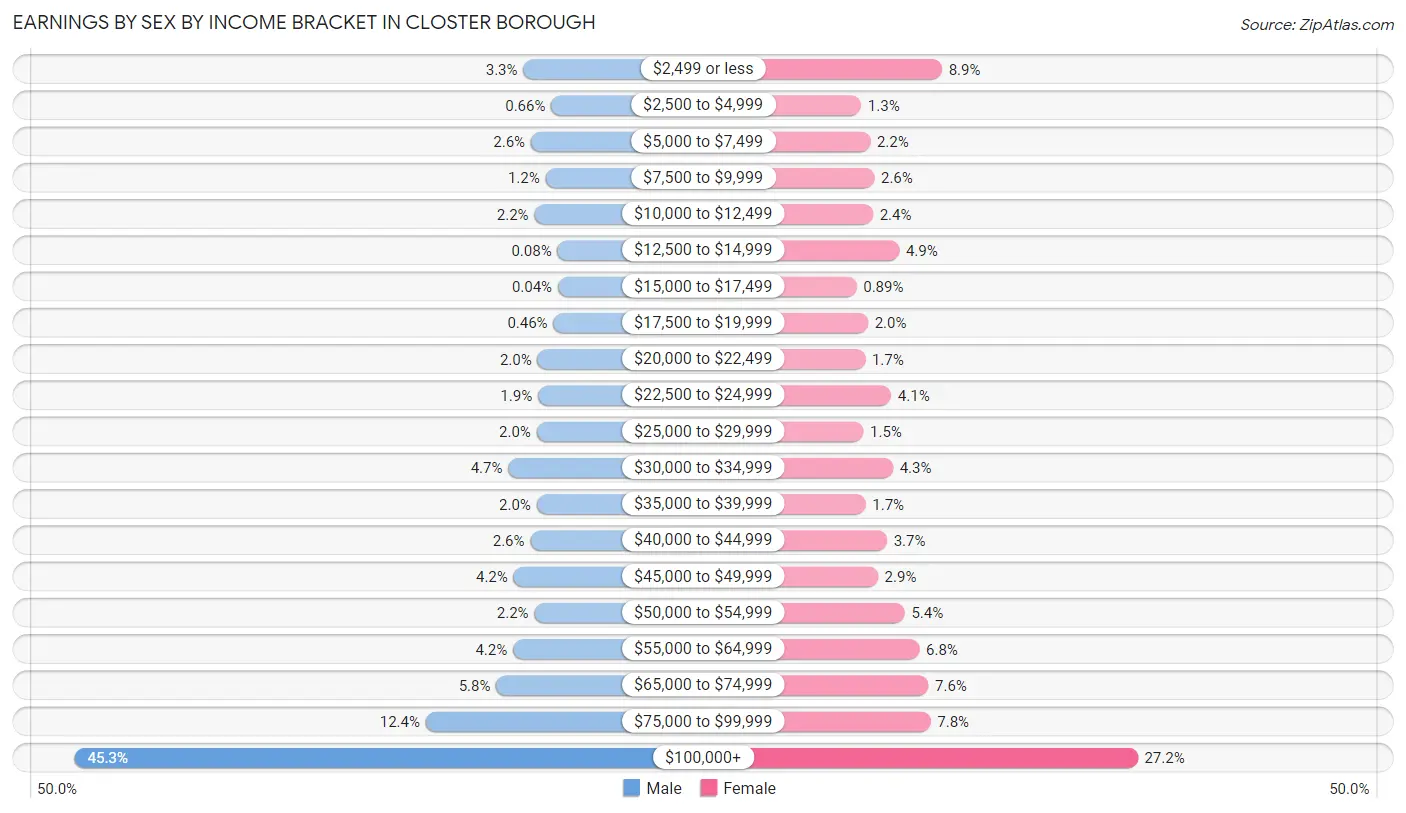
| Income | Male | Female |
| $2,499 or less | 79 (3.3%) | 209 (8.9%) |
| $2,500 to $4,999 | 16 (0.7%) | 31 (1.3%) |
| $5,000 to $7,499 | 62 (2.6%) | 51 (2.2%) |
| $7,500 to $9,999 | 29 (1.2%) | 60 (2.5%) |
| $10,000 to $12,499 | 54 (2.2%) | 57 (2.4%) |
| $12,500 to $14,999 | 2 (0.1%) | 115 (4.9%) |
| $15,000 to $17,499 | 1 (0.0%) | 21 (0.9%) |
| $17,500 to $19,999 | 11 (0.5%) | 46 (2.0%) |
| $20,000 to $22,499 | 47 (1.9%) | 40 (1.7%) |
| $22,500 to $24,999 | 46 (1.9%) | 97 (4.1%) |
| $25,000 to $29,999 | 49 (2.0%) | 36 (1.5%) |
| $30,000 to $34,999 | 113 (4.7%) | 101 (4.3%) |
| $35,000 to $39,999 | 49 (2.0%) | 41 (1.7%) |
| $40,000 to $44,999 | 63 (2.6%) | 88 (3.7%) |
| $45,000 to $49,999 | 101 (4.2%) | 68 (2.9%) |
| $50,000 to $54,999 | 54 (2.2%) | 127 (5.4%) |
| $55,000 to $64,999 | 102 (4.2%) | 159 (6.8%) |
| $65,000 to $74,999 | 140 (5.8%) | 179 (7.6%) |
| $75,000 to $99,999 | 299 (12.4%) | 184 (7.8%) |
| $100,000+ | 1,091 (45.3%) | 640 (27.2%) |
| Total | 2,408 (100.0%) | 2,350 (100.0%) |
Earnings by Sex by Educational Attainment in Closter borough
Average earnings in Closter borough are $97,727 for men and $60,781 for women, a difference of 37.8%. Men with an educational attainment of graduate degree enjoy the highest average annual earnings of $175,964, while those with college or associate's degree education earn the least with $61,250. Women with an educational attainment of graduate degree earn the most with the average annual earnings of $97,976, while those with high school diploma education have the smallest earnings of $14,744.
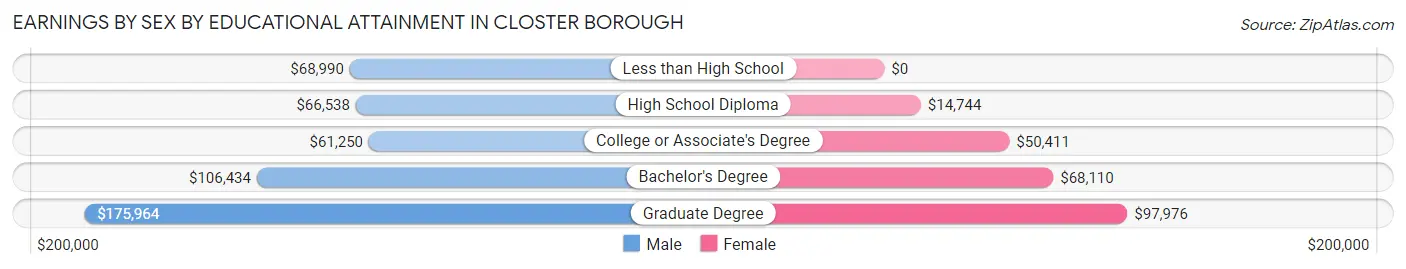
| Educational Attainment | Male Income | Female Income |
| Less than High School | $68,990 | $0 |
| High School Diploma | $66,538 | $14,744 |
| College or Associate's Degree | $61,250 | $50,411 |
| Bachelor's Degree | $106,434 | $68,110 |
| Graduate Degree | $175,964 | $97,976 |
| Total | $97,727 | $60,781 |
Family Income in Closter borough
Family Income Brackets in Closter borough
According to the Closter borough family income data, there are 1,099 families falling into the $200,000+ income range, which is the most common income bracket and makes up 46.9% of all families. Conversely, the $25,000 to $34,999 income bracket is the least frequent group with only 7 families (0.3%) belonging to this category.
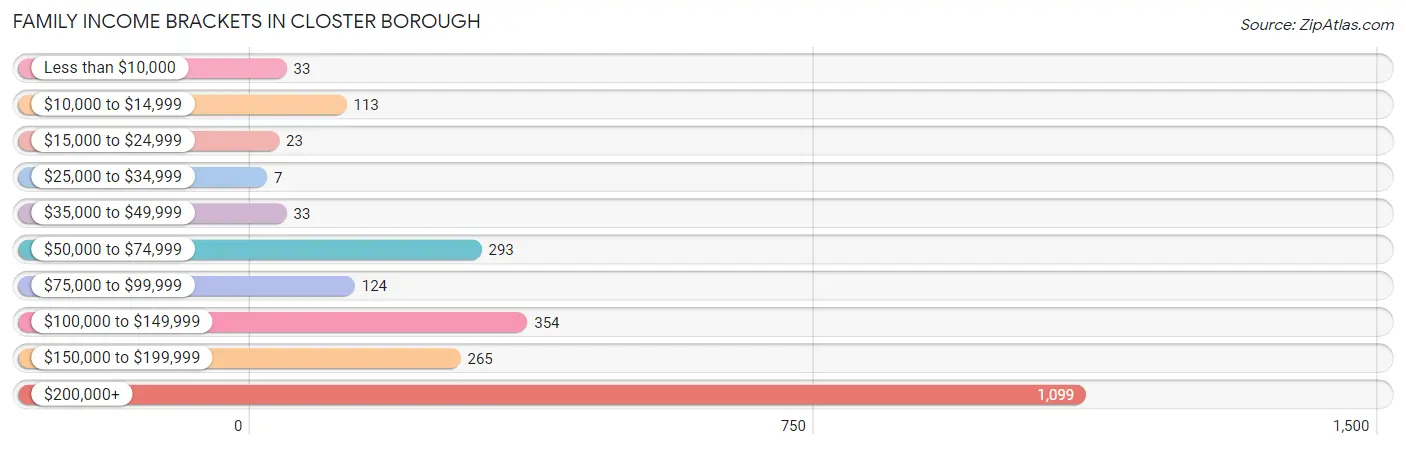
| Income Bracket | # Families | % Families |
| Less than $10,000 | 33 | 1.4% |
| $10,000 to $14,999 | 113 | 4.8% |
| $15,000 to $24,999 | 23 | 1.0% |
| $25,000 to $34,999 | 7 | 0.3% |
| $35,000 to $49,999 | 33 | 1.4% |
| $50,000 to $74,999 | 293 | 12.5% |
| $75,000 to $99,999 | 124 | 5.3% |
| $100,000 to $149,999 | 354 | 15.1% |
| $150,000 to $199,999 | 265 | 11.3% |
| $200,000+ | 1,099 | 46.9% |
Family Income by Famaliy Size in Closter borough
5-person families (244 | 10.4%) account for the highest median family income in Closter borough with $250,001 per family, while 2-person families (644 | 27.5%) have the highest median income of $78,572 per family member.
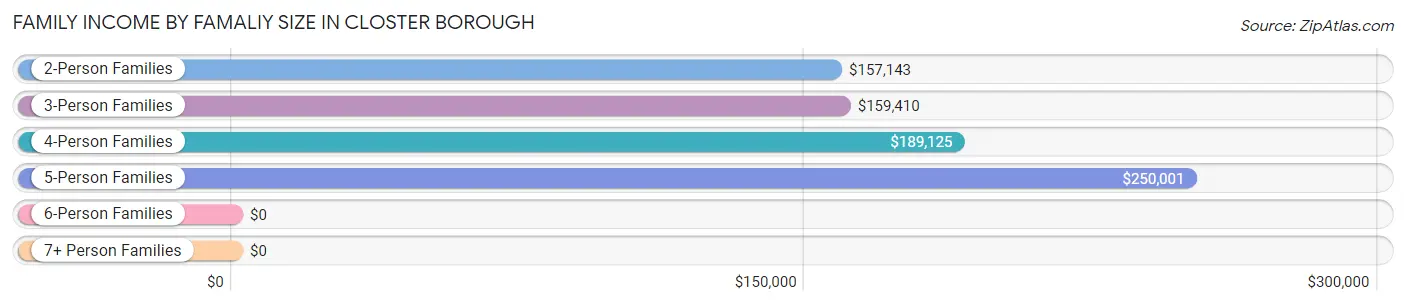
| Income Bracket | # Families | Median Income |
| 2-Person Families | 644 (27.5%) | $157,143 |
| 3-Person Families | 705 (30.1%) | $159,410 |
| 4-Person Families | 709 (30.2%) | $189,125 |
| 5-Person Families | 244 (10.4%) | $250,001 |
| 6-Person Families | 42 (1.8%) | $0 |
| 7+ Person Families | 0 (0.0%) | $0 |
| Total | 2,344 (100.0%) | $193,148 |
Family Income by Number of Earners in Closter borough
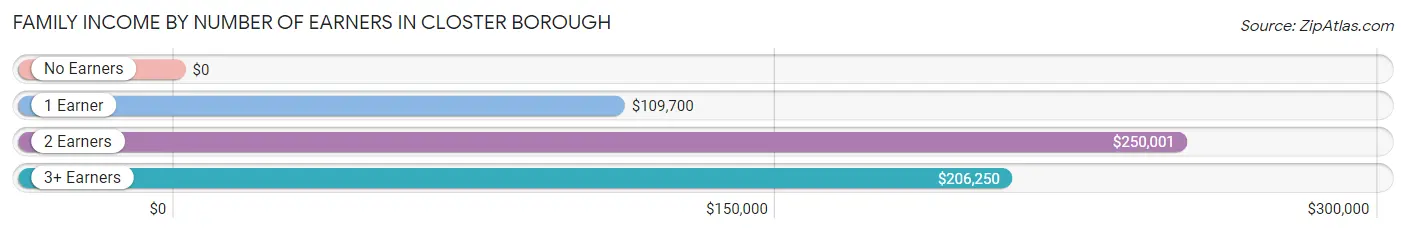
| Number of Earners | # Families | Median Income |
| No Earners | 133 (5.7%) | $0 |
| 1 Earner | 746 (31.8%) | $109,700 |
| 2 Earners | 966 (41.2%) | $250,001 |
| 3+ Earners | 499 (21.3%) | $206,250 |
| Total | 2,344 (100.0%) | $193,148 |
Household Income in Closter borough
Household Income Brackets in Closter borough
With 1,227 households falling in the category, the $200,000+ income range is the most frequent in Closter borough, accounting for 45.1% of all households. In contrast, only 46 households (1.7%) fall into the $25,000 to $34,999 income bracket, making it the least populous group.
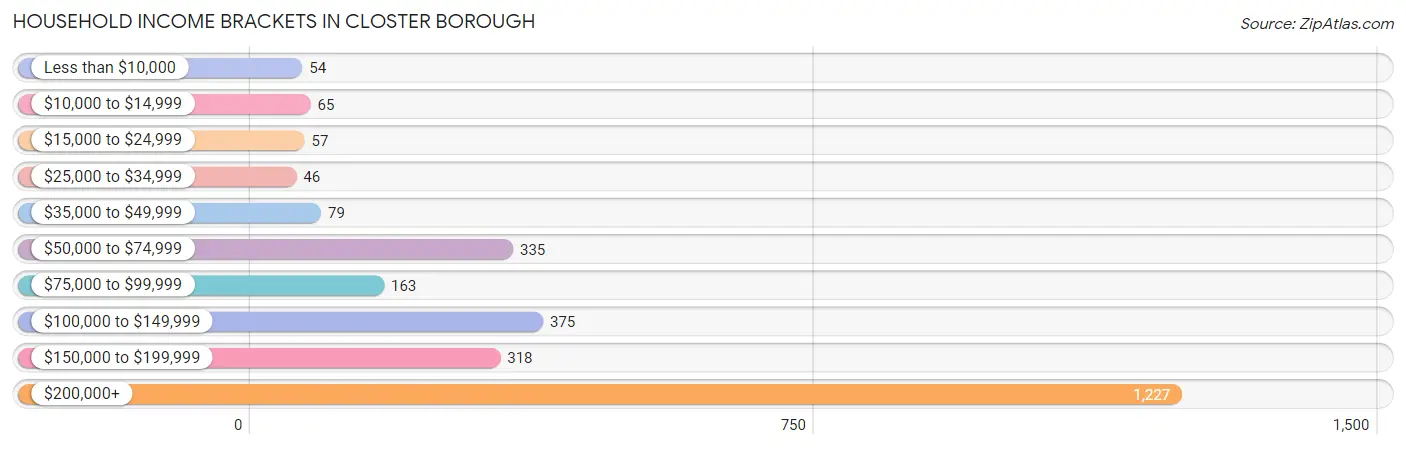
| Income Bracket | # Households | % Households |
| Less than $10,000 | 54 | 2.0% |
| $10,000 to $14,999 | 65 | 2.4% |
| $15,000 to $24,999 | 57 | 2.1% |
| $25,000 to $34,999 | 46 | 1.7% |
| $35,000 to $49,999 | 79 | 2.9% |
| $50,000 to $74,999 | 335 | 12.3% |
| $75,000 to $99,999 | 163 | 6.0% |
| $100,000 to $149,999 | 375 | 13.8% |
| $150,000 to $199,999 | 318 | 11.7% |
| $200,000+ | 1,227 | 45.1% |
Household Income by Householder Age in Closter borough
The median household income in Closter borough is $181,652, with the highest median household income of $250,001 found in the 25 to 44 years age bracket for the primary householder. A total of 731 households (26.9%) fall into this category. Meanwhile, the 15 to 24 years age bracket for the primary householder has the lowest median household income of $0, with 10 households (0.4%) in this group.
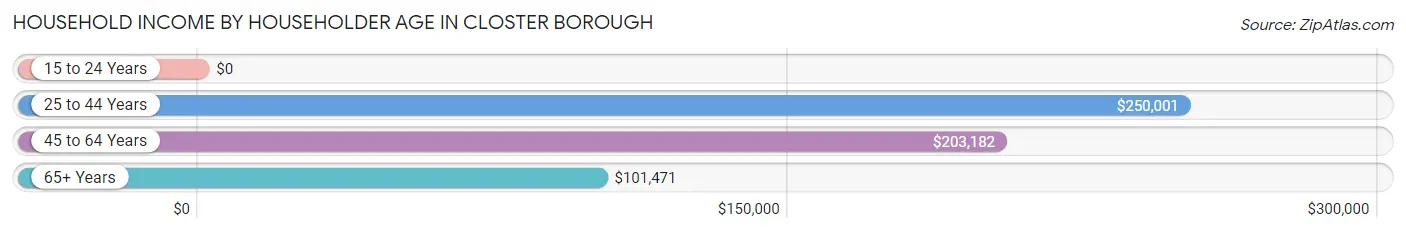
| Income Bracket | # Households | Median Income |
| 15 to 24 Years | 10 (0.4%) | $0 |
| 25 to 44 Years | 731 (26.9%) | $250,001 |
| 45 to 64 Years | 1,364 (50.1%) | $203,182 |
| 65+ Years | 616 (22.6%) | $101,471 |
| Total | 2,721 (100.0%) | $181,652 |
Poverty in Closter borough
Income Below Poverty by Sex and Age in Closter borough
With 8.5% poverty level for males and 6.5% for females among the residents of Closter borough, 6 to 11 year old males and 25 to 34 year old females are the most vulnerable to poverty, with 266 males (39.8%) and 127 females (23.9%) in their respective age groups living below the poverty level.
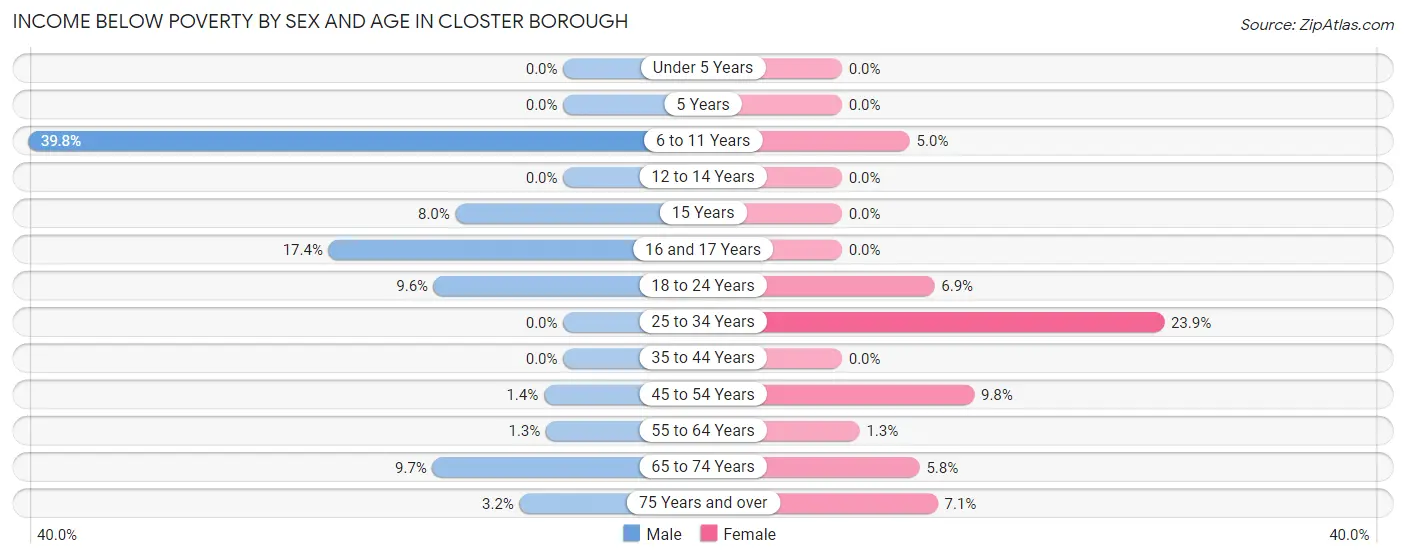
| Age Bracket | Male | Female |
| Under 5 Years | 0 (0.0%) | 0 (0.0%) |
| 5 Years | 0 (0.0%) | 0 (0.0%) |
| 6 to 11 Years | 266 (39.8%) | 14 (5.0%) |
| 12 to 14 Years | 0 (0.0%) | 0 (0.0%) |
| 15 Years | 4 (8.0%) | 0 (0.0%) |
| 16 and 17 Years | 27 (17.4%) | 0 (0.0%) |
| 18 to 24 Years | 27 (9.6%) | 20 (6.9%) |
| 25 to 34 Years | 0 (0.0%) | 127 (23.9%) |
| 35 to 44 Years | 0 (0.0%) | 0 (0.0%) |
| 45 to 54 Years | 9 (1.4%) | 55 (9.8%) |
| 55 to 64 Years | 8 (1.3%) | 9 (1.3%) |
| 65 to 74 Years | 29 (9.7%) | 21 (5.8%) |
| 75 Years and over | 7 (3.2%) | 18 (7.1%) |
| Total | 377 (8.5%) | 264 (6.5%) |
Income Above Poverty by Sex and Age in Closter borough
According to the poverty statistics in Closter borough, males aged under 5 years and females aged under 5 years are the age groups that are most secure financially, with 100.0% of males and 100.0% of females in these age groups living above the poverty line.
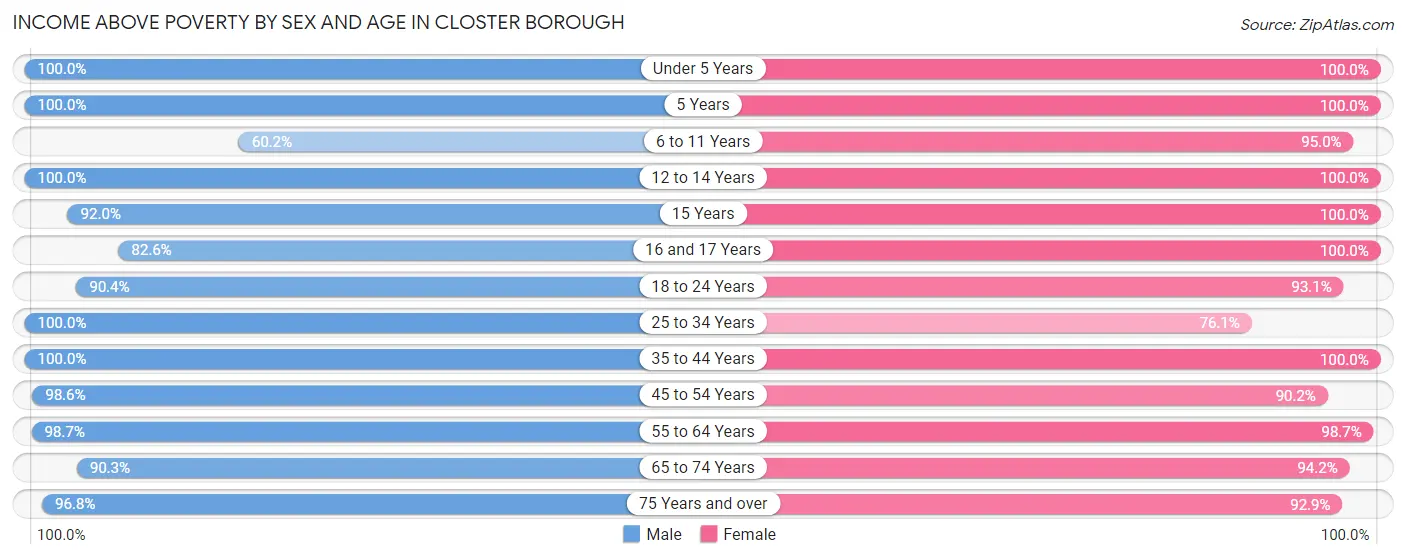
| Age Bracket | Male | Female |
| Under 5 Years | 329 (100.0%) | 198 (100.0%) |
| 5 Years | 26 (100.0%) | 35 (100.0%) |
| 6 to 11 Years | 403 (60.2%) | 264 (95.0%) |
| 12 to 14 Years | 234 (100.0%) | 112 (100.0%) |
| 15 Years | 46 (92.0%) | 75 (100.0%) |
| 16 and 17 Years | 128 (82.6%) | 134 (100.0%) |
| 18 to 24 Years | 254 (90.4%) | 271 (93.1%) |
| 25 to 34 Years | 422 (100.0%) | 404 (76.1%) |
| 35 to 44 Years | 489 (100.0%) | 541 (100.0%) |
| 45 to 54 Years | 620 (98.6%) | 505 (90.2%) |
| 55 to 64 Years | 616 (98.7%) | 679 (98.7%) |
| 65 to 74 Years | 270 (90.3%) | 343 (94.2%) |
| 75 Years and over | 209 (96.8%) | 235 (92.9%) |
| Total | 4,046 (91.5%) | 3,796 (93.5%) |
Income Below Poverty Among Married-Couple Families in Closter borough
The poverty statistics for married-couple families in Closter borough show that 2.2% or 41 of the total 1,881 families live below the poverty line. Families with no children have the highest poverty rate of 3.1%, comprising of 29 families. On the other hand, families with 3 or 4 children have the lowest poverty rate of 0.0%, which includes 0 families.
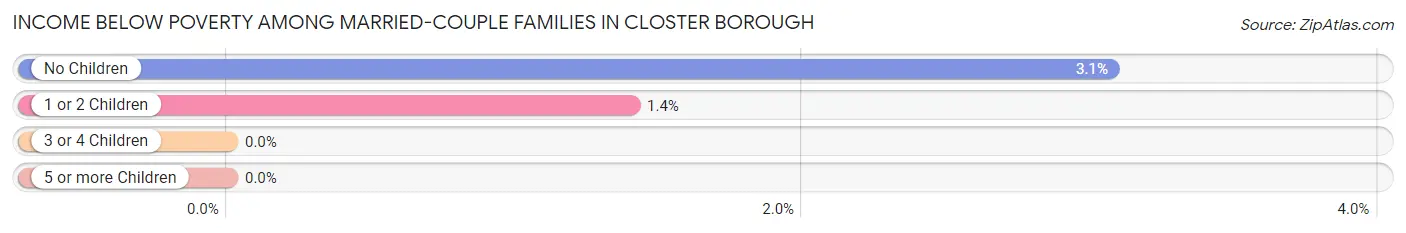
| Children | Above Poverty | Below Poverty |
| No Children | 917 (96.9%) | 29 (3.1%) |
| 1 or 2 Children | 847 (98.6%) | 12 (1.4%) |
| 3 or 4 Children | 76 (100.0%) | 0 (0.0%) |
| 5 or more Children | 0 (0.0%) | 0 (0.0%) |
| Total | 1,840 (97.8%) | 41 (2.2%) |
Income Below Poverty Among Single-Parent Households in Closter borough
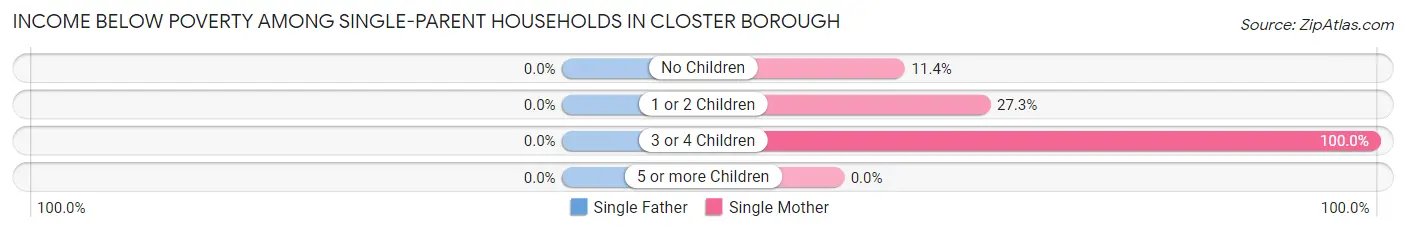
| Children | Single Father | Single Mother |
| No Children | 0 (0.0%) | 10 (11.4%) |
| 1 or 2 Children | 0 (0.0%) | 33 (27.3%) |
| 3 or 4 Children | 0 (0.0%) | 83 (100.0%) |
| 5 or more Children | 0 (0.0%) | 0 (0.0%) |
| Total | 0 (0.0%) | 126 (43.1%) |
Income Below Poverty Among Married-Couple vs Single-Parent Households in Closter borough
The poverty data for Closter borough shows that 41 of the married-couple family households (2.2%) and 126 of the single-parent households (27.2%) are living below the poverty level. Within the married-couple family households, those with no children have the highest poverty rate, with 29 households (3.1%) falling below the poverty line. Among the single-parent households, those with 3 or 4 children have the highest poverty rate, with 83 household (76.1%) living below poverty.
| Children | Married-Couple Families | Single-Parent Households |
| No Children | 29 (3.1%) | 10 (7.0%) |
| 1 or 2 Children | 12 (1.4%) | 33 (15.6%) |
| 3 or 4 Children | 0 (0.0%) | 83 (76.1%) |
| 5 or more Children | 0 (0.0%) | 0 (0.0%) |
| Total | 41 (2.2%) | 126 (27.2%) |
Race in Closter borough
The most populous races in Closter borough are White / Caucasian (4,186 | 48.9%), Asian (2,987 | 34.9%), and Hispanic or Latino (706 | 8.3%).
| Race | # Population | % Population |
| Asian | 2,987 | 34.9% |
| Black / African American | 287 | 3.4% |
| Hawaiian / Pacific | 0 | 0.0% |
| Hispanic or Latino | 706 | 8.3% |
| Native / Alaskan | 129 | 1.5% |
| White / Caucasian | 4,186 | 48.9% |
| Two or more Races | 682 | 8.0% |
| Some other Race | 284 | 3.3% |
| Total | 8,555 | 100.0% |
Ancestry in Closter borough
The most populous ancestries reported in Closter borough are Burmese (2,097 | 24.5%), Italian (971 | 11.4%), German (525 | 6.1%), Thai (409 | 4.8%), and Irish (405 | 4.7%), together accounting for 51.5% of all Closter borough residents.
| Ancestry | # Population | % Population |
| Albanian | 91 | 1.1% |
| American | 264 | 3.1% |
| Arab | 92 | 1.1% |
| Argentinean | 12 | 0.1% |
| Armenian | 55 | 0.6% |
| Austrian | 30 | 0.4% |
| Bhutanese | 151 | 1.8% |
| British | 53 | 0.6% |
| British West Indian | 19 | 0.2% |
| Burmese | 2,097 | 24.5% |
| Canadian | 24 | 0.3% |
| Central American | 77 | 0.9% |
| Central American Indian | 54 | 0.6% |
| Cherokee | 6 | 0.1% |
| Colombian | 29 | 0.3% |
| Creek | 279 | 3.3% |
| Croatian | 56 | 0.6% |
| Cuban | 190 | 2.2% |
| Cypriot | 127 | 1.5% |
| Czechoslovakian | 5 | 0.1% |
| Dominican | 149 | 1.7% |
| Dutch | 38 | 0.4% |
| Eastern European | 268 | 3.1% |
| Ecuadorian | 36 | 0.4% |
| Egyptian | 57 | 0.7% |
| English | 214 | 2.5% |
| European | 41 | 0.5% |
| Filipino | 12 | 0.1% |
| French | 198 | 2.3% |
| German | 525 | 6.1% |
| Greek | 41 | 0.5% |
| Guatemalan | 55 | 0.6% |
| Haitian | 20 | 0.2% |
| Hungarian | 60 | 0.7% |
| Indian (Asian) | 384 | 4.5% |
| Irish | 405 | 4.7% |
| Israeli | 80 | 0.9% |
| Italian | 971 | 11.4% |
| Korean | 202 | 2.4% |
| Laotian | 32 | 0.4% |
| Lithuanian | 49 | 0.6% |
| Mexican | 70 | 0.8% |
| Mexican American Indian | 85 | 1.0% |
| Northern European | 24 | 0.3% |
| Norwegian | 6 | 0.1% |
| Pakistani | 10 | 0.1% |
| Polish | 165 | 1.9% |
| Puerto Rican | 93 | 1.1% |
| Romanian | 135 | 1.6% |
| Russian | 101 | 1.2% |
| Salvadoran | 22 | 0.3% |
| Scotch-Irish | 9 | 0.1% |
| Scottish | 74 | 0.9% |
| Slovak | 11 | 0.1% |
| South American | 77 | 0.9% |
| Spaniard | 11 | 0.1% |
| Swedish | 25 | 0.3% |
| Syrian | 35 | 0.4% |
| Thai | 409 | 4.8% |
| Turkish | 53 | 0.6% |
| Ukrainian | 41 | 0.5% |
| West Indian | 36 | 0.4% | View All 62 Rows |
Immigrants in Closter borough
The most numerous immigrant groups reported in Closter borough came from Asia (2,013 | 23.5%), Eastern Asia (1,397 | 16.3%), Korea (1,186 | 13.9%), Latin America (428 | 5.0%), and Europe (382 | 4.5%), together accounting for 63.2% of all Closter borough residents.
| Immigration Origin | # Population | % Population |
| Africa | 16 | 0.2% |
| Albania | 12 | 0.1% |
| Argentina | 20 | 0.2% |
| Asia | 2,013 | 23.5% |
| Bahamas | 16 | 0.2% |
| Belarus | 41 | 0.5% |
| Canada | 19 | 0.2% |
| Caribbean | 207 | 2.4% |
| Central America | 107 | 1.3% |
| China | 180 | 2.1% |
| Colombia | 9 | 0.1% |
| Croatia | 7 | 0.1% |
| Cuba | 55 | 0.6% |
| Dominican Republic | 85 | 1.0% |
| Eastern Asia | 1,397 | 16.3% |
| Eastern Europe | 221 | 2.6% |
| Ecuador | 40 | 0.5% |
| Egypt | 11 | 0.1% |
| El Salvador | 13 | 0.2% |
| England | 6 | 0.1% |
| Europe | 382 | 4.5% |
| France | 18 | 0.2% |
| Germany | 7 | 0.1% |
| Greece | 29 | 0.3% |
| Grenada | 7 | 0.1% |
| Guatemala | 55 | 0.6% |
| Haiti | 8 | 0.1% |
| Hong Kong | 27 | 0.3% |
| Hungary | 9 | 0.1% |
| India | 203 | 2.4% |
| Indonesia | 26 | 0.3% |
| Iraq | 22 | 0.3% |
| Ireland | 29 | 0.3% |
| Israel | 138 | 1.6% |
| Italy | 27 | 0.3% |
| Japan | 31 | 0.4% |
| Korea | 1,186 | 13.9% |
| Latin America | 428 | 5.0% |
| Lebanon | 18 | 0.2% |
| Mexico | 39 | 0.5% |
| Nepal | 49 | 0.6% |
| Northern Africa | 16 | 0.2% |
| Northern Europe | 74 | 0.9% |
| Pakistan | 3 | 0.0% |
| Peru | 45 | 0.5% |
| Philippines | 69 | 0.8% |
| Romania | 41 | 0.5% |
| Russia | 8 | 0.1% |
| Singapore | 9 | 0.1% |
| South America | 114 | 1.3% |
| South Central Asia | 255 | 3.0% |
| South Eastern Asia | 104 | 1.2% |
| Southern Europe | 62 | 0.7% |
| Spain | 6 | 0.1% |
| Sweden | 15 | 0.2% |
| Syria | 17 | 0.2% |
| Trinidad and Tobago | 36 | 0.4% |
| Turkey | 62 | 0.7% |
| Ukraine | 23 | 0.3% |
| Western Asia | 257 | 3.0% |
| Western Europe | 25 | 0.3% | View All 61 Rows |
Sex and Age in Closter borough
Sex and Age in Closter borough
The most populous age groups in Closter borough are 5 to 9 Years (493 | 11.0%) for men and 55 to 59 Years (429 | 10.5%) for women.
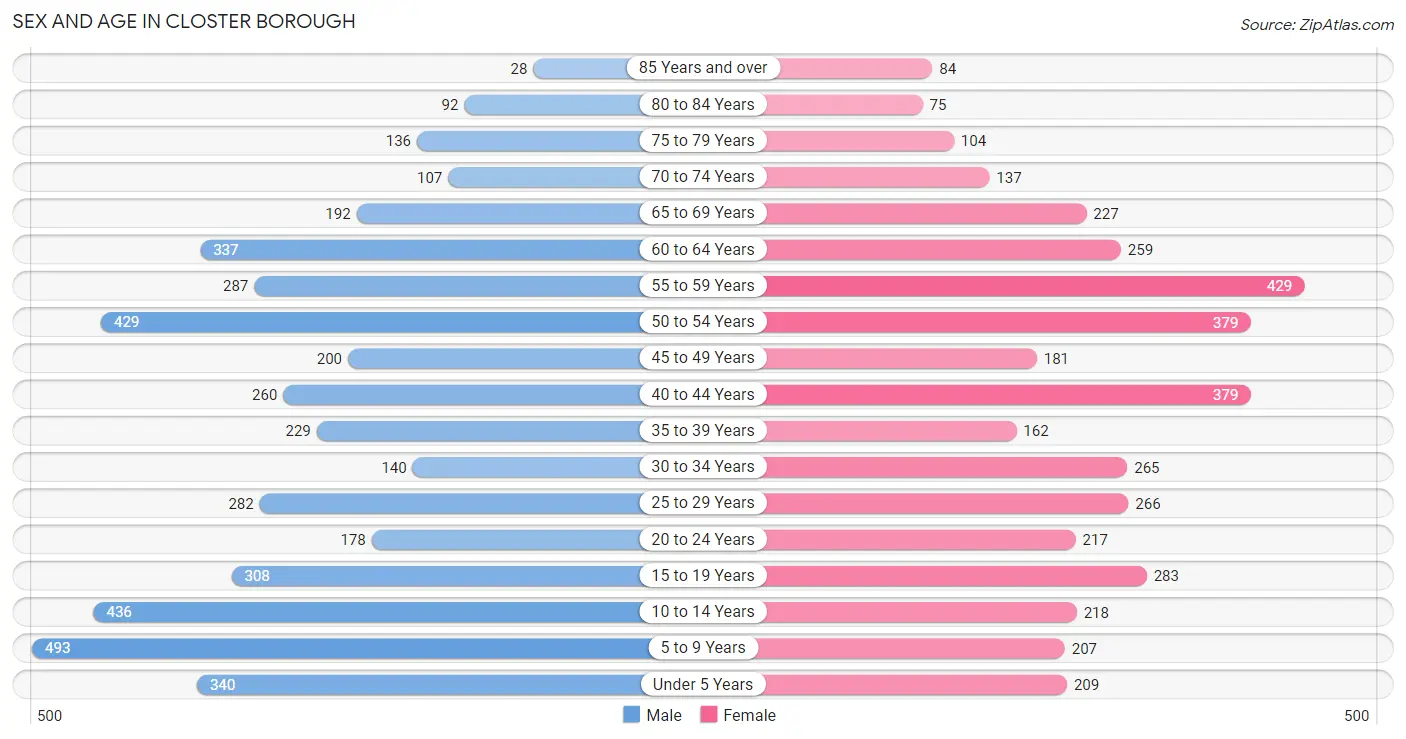
| Age Bracket | Male | Female |
| Under 5 Years | 340 (7.6%) | 209 (5.1%) |
| 5 to 9 Years | 493 (11.0%) | 207 (5.1%) |
| 10 to 14 Years | 436 (9.8%) | 218 (5.3%) |
| 15 to 19 Years | 308 (6.9%) | 283 (6.9%) |
| 20 to 24 Years | 178 (4.0%) | 217 (5.3%) |
| 25 to 29 Years | 282 (6.3%) | 266 (6.5%) |
| 30 to 34 Years | 140 (3.1%) | 265 (6.5%) |
| 35 to 39 Years | 229 (5.1%) | 162 (4.0%) |
| 40 to 44 Years | 260 (5.8%) | 379 (9.3%) |
| 45 to 49 Years | 200 (4.5%) | 181 (4.4%) |
| 50 to 54 Years | 429 (9.6%) | 379 (9.3%) |
| 55 to 59 Years | 287 (6.4%) | 429 (10.5%) |
| 60 to 64 Years | 337 (7.5%) | 259 (6.4%) |
| 65 to 69 Years | 192 (4.3%) | 227 (5.6%) |
| 70 to 74 Years | 107 (2.4%) | 137 (3.4%) |
| 75 to 79 Years | 136 (3.0%) | 104 (2.5%) |
| 80 to 84 Years | 92 (2.1%) | 75 (1.8%) |
| 85 Years and over | 28 (0.6%) | 84 (2.1%) |
| Total | 4,474 (100.0%) | 4,081 (100.0%) |
Families and Households in Closter borough
Median Family Size in Closter borough
The median family size in Closter borough is 3.36 persons per family, with married-couple families (1,881 | 80.2%) accounting for the largest median family size of 3.4 persons per family. On the other hand, single male/father families (171 | 7.3%) represent the smallest median family size with 3.22 persons per family.
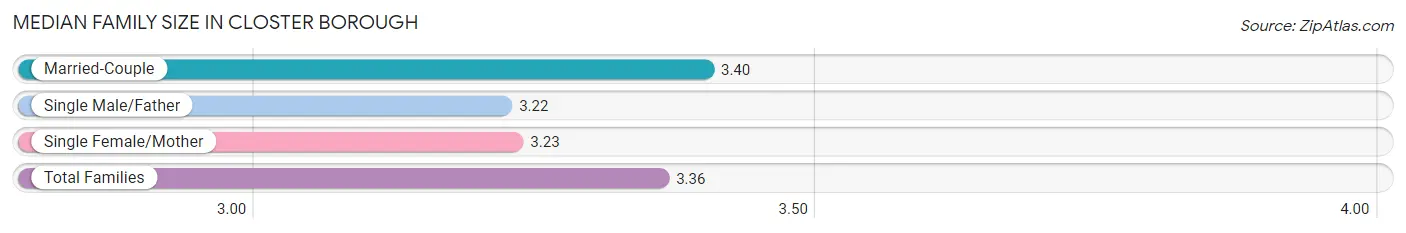
| Family Type | # Families | Family Size |
| Married-Couple | 1,881 (80.2%) | 3.40 |
| Single Male/Father | 171 (7.3%) | 3.22 |
| Single Female/Mother | 292 (12.5%) | 3.23 |
| Total Families | 2,344 (100.0%) | 3.36 |
Median Household Size in Closter borough
The median household size in Closter borough is 3.12 persons per household, with single male/father households (171 | 6.3%) accounting for the largest median household size of 3.87 persons per household. non-family households (377 | 13.9%) represent the smallest median household size with 1.12 persons per household.
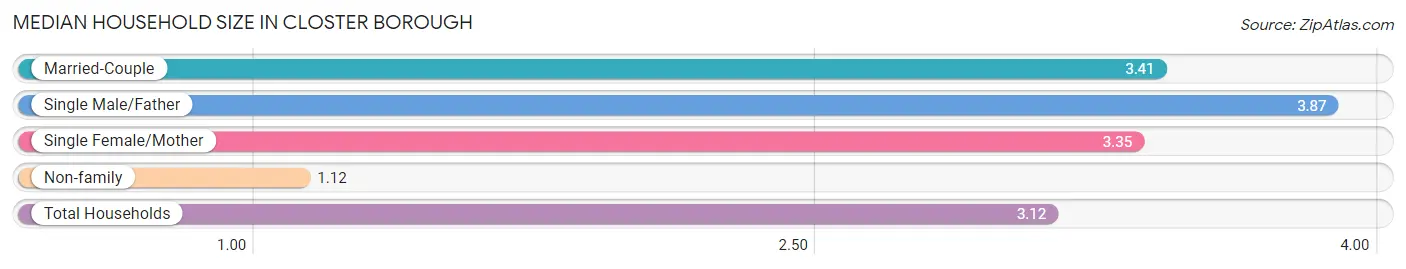
| Household Type | # Households | Household Size |
| Married-Couple | 1,881 (69.1%) | 3.41 |
| Single Male/Father | 171 (6.3%) | 3.87 |
| Single Female/Mother | 292 (10.7%) | 3.35 |
| Non-family | 377 (13.9%) | 1.12 |
| Total Households | 2,721 (100.0%) | 3.12 |
Household Size by Marriage Status in Closter borough
Out of a total of 2,721 households in Closter borough, 2,344 (86.1%) are family households, while 377 (13.9%) are nonfamily households. The most numerous type of family households are 3-person households, comprising 691, and the most common type of nonfamily households are 1-person households, comprising 337.
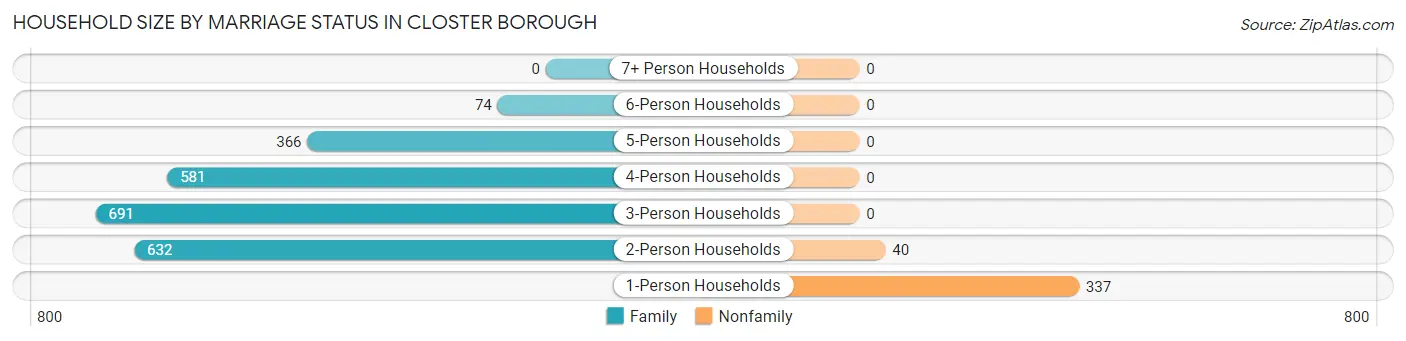
| Household Size | Family Households | Nonfamily Households |
| 1-Person Households | - | 337 (12.4%) |
| 2-Person Households | 632 (23.2%) | 40 (1.5%) |
| 3-Person Households | 691 (25.4%) | 0 (0.0%) |
| 4-Person Households | 581 (21.3%) | 0 (0.0%) |
| 5-Person Households | 366 (13.5%) | 0 (0.0%) |
| 6-Person Households | 74 (2.7%) | 0 (0.0%) |
| 7+ Person Households | 0 (0.0%) | 0 (0.0%) |
| Total | 2,344 (86.1%) | 377 (13.9%) |
Female Fertility in Closter borough
Fertility by Age in Closter borough
Average fertility rate in Closter borough is 39.0 births per 1,000 women. Women in the age bracket of 35 to 50 years have the highest fertility rate with 53.0 births per 1,000 women. Women in the age bracket of 35 to 50 years acount for 60.3% of all women with births.
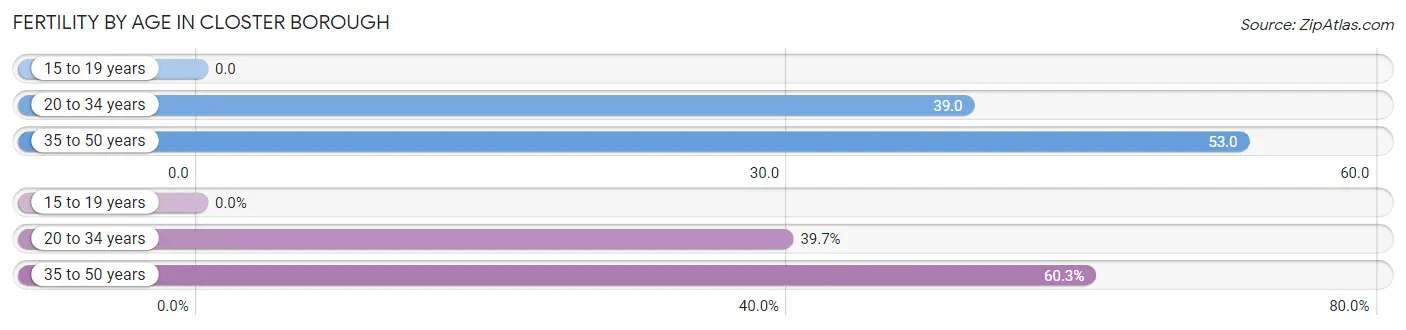
| Age Bracket | Women with Births | Births / 1,000 Women |
| 15 to 19 years | 0 (0.0%) | 0.0 |
| 20 to 34 years | 29 (39.7%) | 39.0 |
| 35 to 50 years | 44 (60.3%) | 53.0 |
| Total | 73 (100.0%) | 39.0 |
Fertility by Age by Marriage Status in Closter borough
90.4% of women with births (73) in Closter borough are married. The highest percentage of unmarried women with births falls into 35 to 50 years age bracket with 15.9% of them unmarried at the time of birth, while the lowest percentage of unmarried women with births belong to 20 to 34 years age bracket with 0.0% of them unmarried.
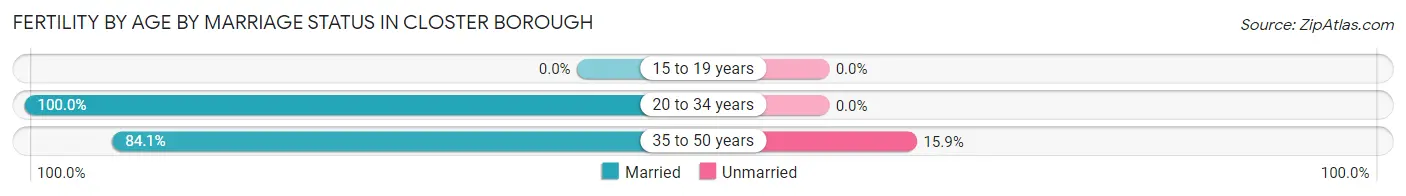
| Age Bracket | Married | Unmarried |
| 15 to 19 years | 0 (0.0%) | 0 (0.0%) |
| 20 to 34 years | 29 (100.0%) | 0 (0.0%) |
| 35 to 50 years | 37 (84.1%) | 7 (15.9%) |
| Total | 66 (90.4%) | 7 (9.6%) |
Fertility by Education in Closter borough
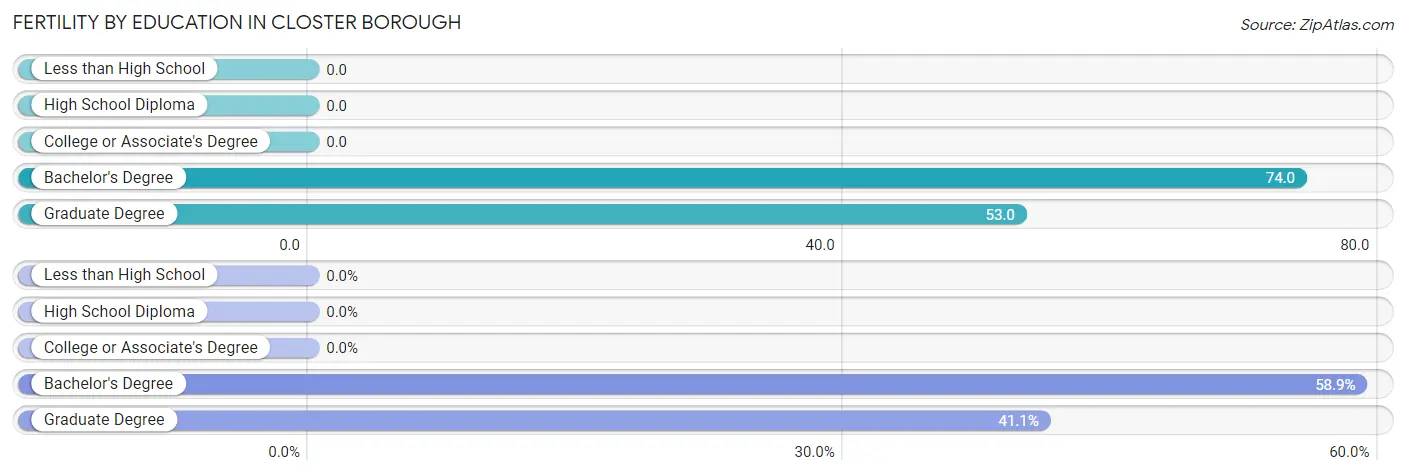
| Educational Attainment | Women with Births | Births / 1,000 Women |
| Less than High School | 0 (0.0%) | 0.0 |
| High School Diploma | 0 (0.0%) | 0.0 |
| College or Associate's Degree | 0 (0.0%) | 0.0 |
| Bachelor's Degree | 43 (58.9%) | 74.0 |
| Graduate Degree | 30 (41.1%) | 53.0 |
| Total | 73 (100.0%) | 39.0 |
Fertility by Education by Marriage Status in Closter borough
9.6% of women with births in Closter borough are unmarried. Women with the educational attainment of graduate degree are most likely to be married with 100.0% of them married at childbirth, while women with the educational attainment of bachelor's degree are least likely to be married with 16.3% of them unmarried at childbirth.
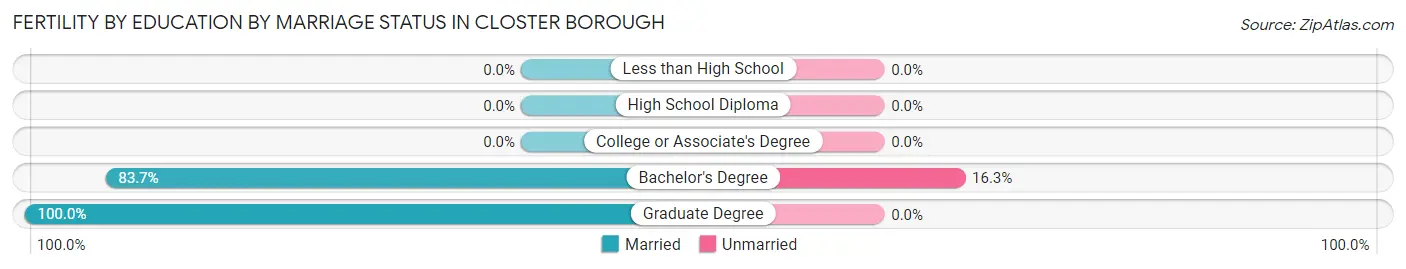
| Educational Attainment | Married | Unmarried |
| Less than High School | 0 (0.0%) | 0 (0.0%) |
| High School Diploma | 0 (0.0%) | 0 (0.0%) |
| College or Associate's Degree | 0 (0.0%) | 0 (0.0%) |
| Bachelor's Degree | 36 (83.7%) | 7 (16.3%) |
| Graduate Degree | 30 (100.0%) | 0 (0.0%) |
| Total | 66 (90.4%) | 7 (9.6%) |
Employment Characteristics in Closter borough
Employment by Class of Employer in Closter borough
Among the 4,421 employed individuals in Closter borough, private company employees (2,741 | 62.0%), not-for-profit organizations (579 | 13.1%), and self-employed (incorporated) (441 | 10.0%) make up the most common classes of employment.
| Employer Class | # Employees | % Employees |
| Private Company Employees | 2,741 | 62.0% |
| Self-Employed (Incorporated) | 441 | 10.0% |
| Self-Employed (Not Incorporated) | 246 | 5.6% |
| Not-for-profit Organizations | 579 | 13.1% |
| Local Government Employees | 319 | 7.2% |
| State Government Employees | 59 | 1.3% |
| Federal Government Employees | 36 | 0.8% |
| Unpaid Family Workers | 0 | 0.0% |
| Total | 4,421 | 100.0% |
Employment Status by Age in Closter borough
According to the labor force statistics for Closter borough, out of the total population over 16 years of age (6,527), 70.8% or 4,621 individuals are in the labor force, with 3.8% or 176 of them unemployed. The age group with the highest labor force participation rate is 25 to 29 years, with 89.4% or 490 individuals in the labor force. Within the labor force, the 16 to 19 years age range has the highest percentage of unemployed individuals, with 27.3% or 42 of them being unemployed.
| Age Bracket | In Labor Force | Unemployed |
| 16 to 19 Years | 154 (33.0%) | 42 (27.3%) |
| 20 to 24 Years | 245 (62.0%) | 0 (0.0%) |
| 25 to 29 Years | 490 (89.4%) | 16 (3.3%) |
| 30 to 34 Years | 353 (87.2%) | 8 (2.3%) |
| 35 to 44 Years | 856 (83.1%) | 31 (3.6%) |
| 45 to 54 Years | 1,062 (89.3%) | 62 (5.8%) |
| 55 to 59 Years | 580 (81.0%) | 0 (0.0%) |
| 60 to 64 Years | 484 (81.2%) | 17 (3.5%) |
| 65 to 74 Years | 322 (48.6%) | 0 (0.0%) |
| 75 Years and over | 78 (15.0%) | 0 (0.0%) |
| Total | 4,621 (70.8%) | 176 (3.8%) |
Employment Status by Educational Attainment in Closter borough
According to labor force statistics for Closter borough, 85.3% of individuals (3,825) out of the total population between 25 and 64 years of age (4,484) are in the labor force, with 3.5% or 134 of them being unemployed. The group with the highest labor force participation rate are those with the educational attainment of bachelor's degree or higher, with 87.5% or 2,841 individuals in the labor force. Within the labor force, individuals with bachelor's degree or higher education have the highest percentage of unemployment, with 4.3% or 122 of them being unemployed.
| Educational Attainment | In Labor Force | Unemployed |
| Less than High School | 158 (84.0%) | 0 (0.0%) |
| High School Diploma | 394 (84.5%) | 0 (0.0%) |
| College / Associate Degree | 432 (74.1%) | 15 (2.5%) |
| Bachelor's Degree or higher | 2,841 (87.5%) | 140 (4.3%) |
| Total | 3,825 (85.3%) | 157 (3.5%) |
Employment Occupations by Sex in Closter borough
Management, Business, Science and Arts Occupations
The most common Management, Business, Science and Arts occupations in Closter borough are Management (667 | 15.0%), Community & Social Service (651 | 14.6%), Business & Financial (422 | 9.5%), Computers, Engineering & Science (388 | 8.7%), and Health Diagnosing & Treating (380 | 8.5%).
Management, Business, Science and Arts Occupations by Sex
Within the Management, Business, Science and Arts occupations in Closter borough, the most male-oriented occupations are Architecture & Engineering (77.2%), Management (73.0%), and Legal Services & Support (72.6%), while the most female-oriented occupations are Education, Arts & Media (82.4%), Education Instruction & Library (78.7%), and Health Diagnosing & Treating (71.1%).
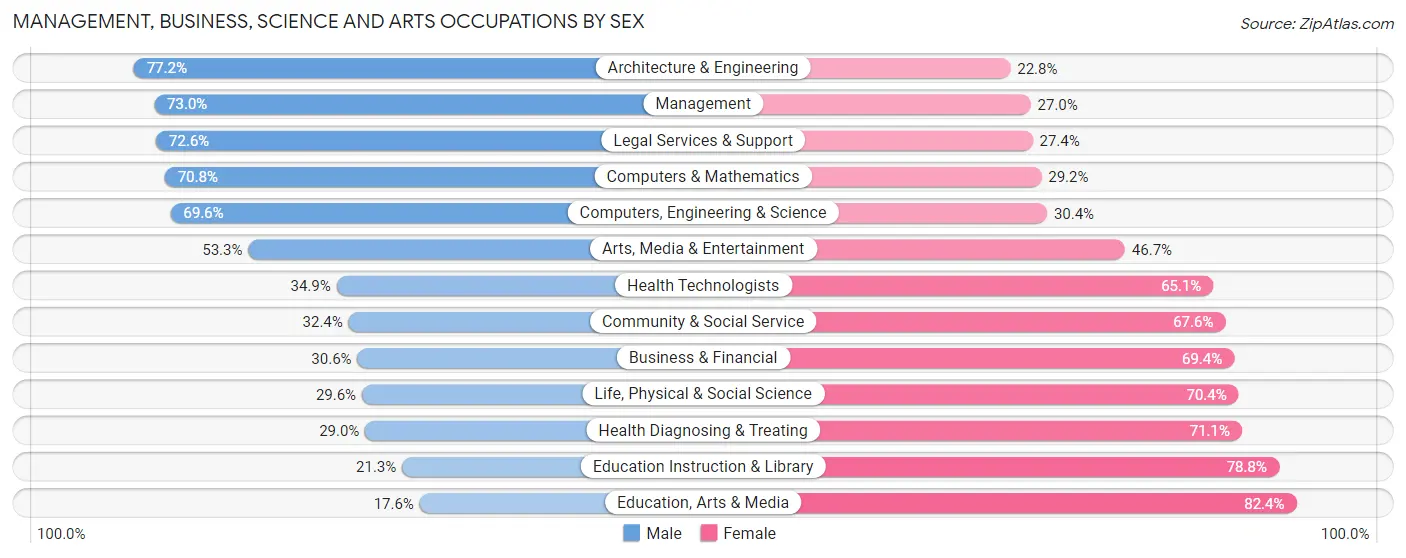
| Occupation | Male | Female |
| Management | 487 (73.0%) | 180 (27.0%) |
| Business & Financial | 129 (30.6%) | 293 (69.4%) |
| Computers, Engineering & Science | 270 (69.6%) | 118 (30.4%) |
| Computers & Mathematics | 184 (70.8%) | 76 (29.2%) |
| Architecture & Engineering | 78 (77.2%) | 23 (22.8%) |
| Life, Physical & Social Science | 8 (29.6%) | 19 (70.4%) |
| Community & Social Service | 211 (32.4%) | 440 (67.6%) |
| Education, Arts & Media | 16 (17.6%) | 75 (82.4%) |
| Legal Services & Support | 53 (72.6%) | 20 (27.4%) |
| Education Instruction & Library | 78 (21.2%) | 289 (78.7%) |
| Arts, Media & Entertainment | 64 (53.3%) | 56 (46.7%) |
| Health Diagnosing & Treating | 110 (28.9%) | 270 (71.1%) |
| Health Technologists | 110 (34.9%) | 205 (65.1%) |
| Total (Category) | 1,207 (48.1%) | 1,301 (51.9%) |
| Total (Overall) | 2,264 (50.9%) | 2,184 (49.1%) |
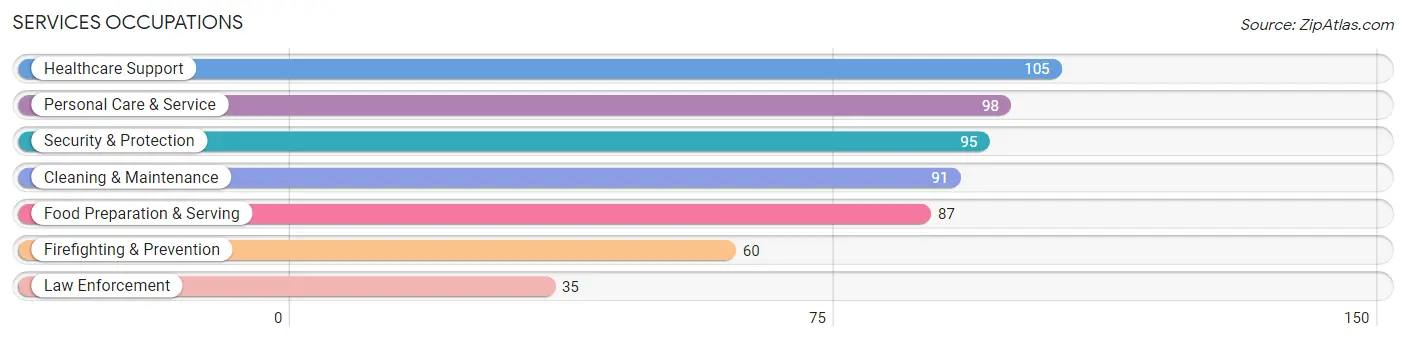
Services Occupations
The most common Services occupations in Closter borough are Healthcare Support (105 | 2.4%), Personal Care & Service (98 | 2.2%), Security & Protection (95 | 2.1%), Cleaning & Maintenance (91 | 2.1%), and Food Preparation & Serving (87 | 2.0%).
Services Occupations by Sex
Within the Services occupations in Closter borough, the most male-oriented occupations are Law Enforcement (100.0%), Security & Protection (69.5%), and Cleaning & Maintenance (54.9%), while the most female-oriented occupations are Healthcare Support (94.3%), Personal Care & Service (90.8%), and Food Preparation & Serving (52.9%).
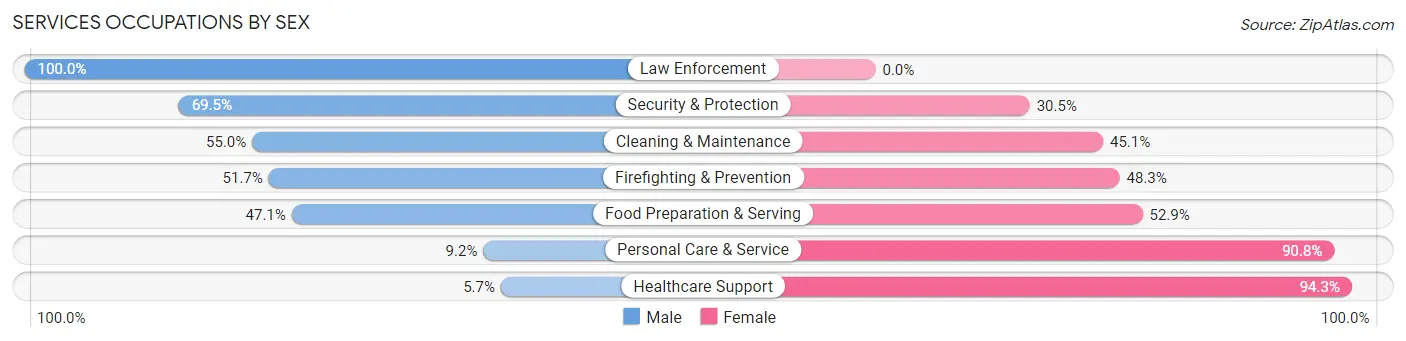
| Occupation | Male | Female |
| Healthcare Support | 6 (5.7%) | 99 (94.3%) |
| Security & Protection | 66 (69.5%) | 29 (30.5%) |
| Firefighting & Prevention | 31 (51.7%) | 29 (48.3%) |
| Law Enforcement | 35 (100.0%) | 0 (0.0%) |
| Food Preparation & Serving | 41 (47.1%) | 46 (52.9%) |
| Cleaning & Maintenance | 50 (54.9%) | 41 (45.1%) |
| Personal Care & Service | 9 (9.2%) | 89 (90.8%) |
| Total (Category) | 172 (36.1%) | 304 (63.9%) |
| Total (Overall) | 2,264 (50.9%) | 2,184 (49.1%) |
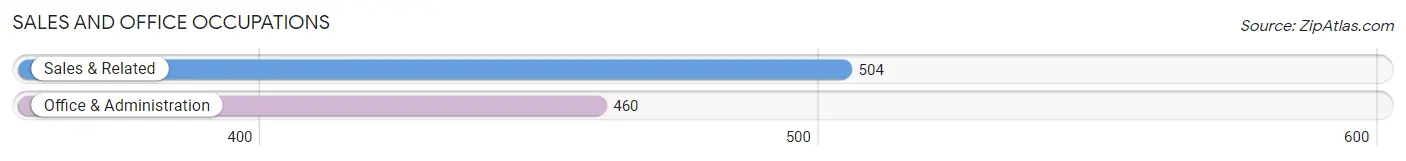
Sales and Office Occupations
The most common Sales and Office occupations in Closter borough are Sales & Related (504 | 11.3%), and Office & Administration (460 | 10.3%).
Sales and Office Occupations by Sex
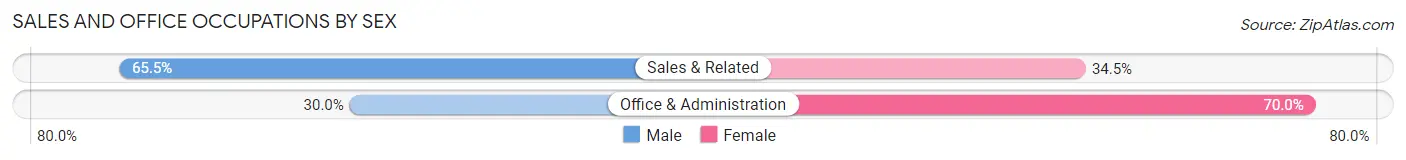
| Occupation | Male | Female |
| Sales & Related | 330 (65.5%) | 174 (34.5%) |
| Office & Administration | 138 (30.0%) | 322 (70.0%) |
| Total (Category) | 468 (48.5%) | 496 (51.4%) |
| Total (Overall) | 2,264 (50.9%) | 2,184 (49.1%) |
Natural Resources, Construction and Maintenance Occupations
The most common Natural Resources, Construction and Maintenance occupations in Closter borough are Construction & Extraction (128 | 2.9%), and Installation, Maintenance & Repair (71 | 1.6%).
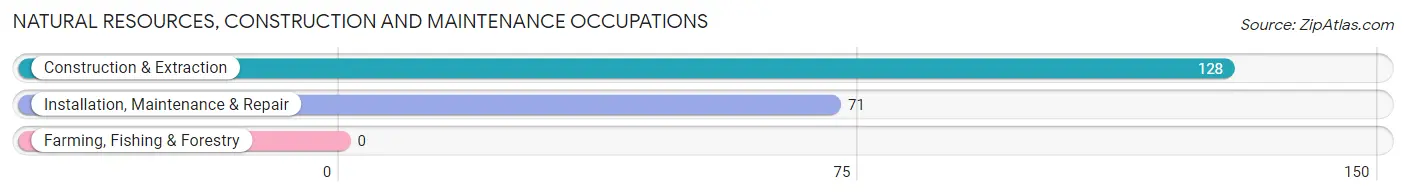
Natural Resources, Construction and Maintenance Occupations by Sex
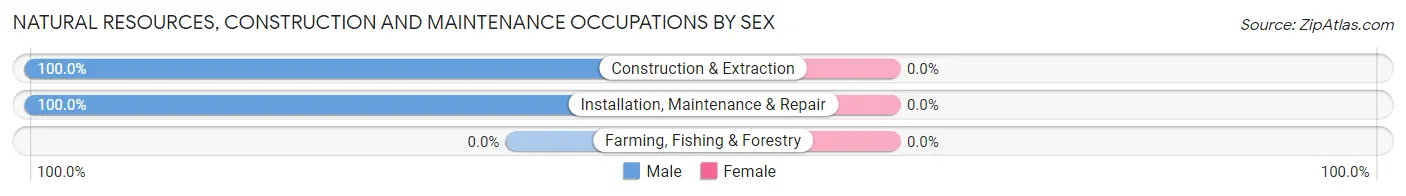
| Occupation | Male | Female |
| Farming, Fishing & Forestry | 0 (0.0%) | 0 (0.0%) |
| Construction & Extraction | 128 (100.0%) | 0 (0.0%) |
| Installation, Maintenance & Repair | 71 (100.0%) | 0 (0.0%) |
| Total (Category) | 199 (100.0%) | 0 (0.0%) |
| Total (Overall) | 2,264 (50.9%) | 2,184 (49.1%) |
Production, Transportation and Moving Occupations
The most common Production, Transportation and Moving occupations in Closter borough are Transportation (139 | 3.1%), Material Moving (113 | 2.5%), and Production (49 | 1.1%).
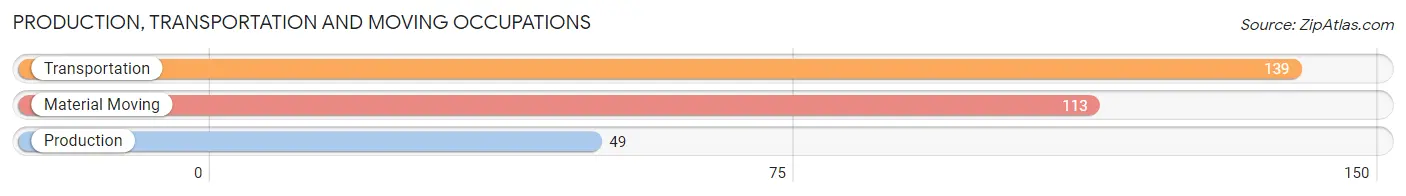
Production, Transportation and Moving Occupations by Sex
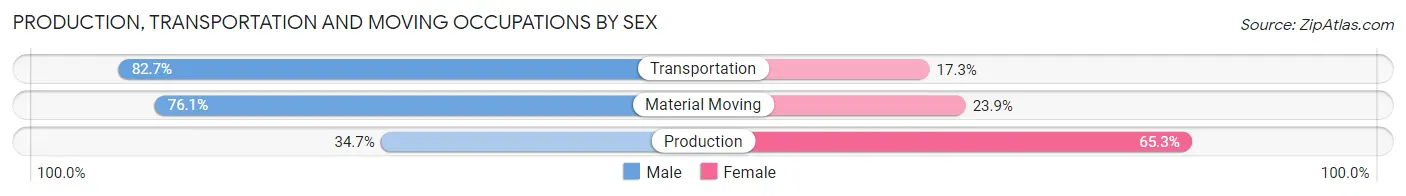
| Occupation | Male | Female |
| Production | 17 (34.7%) | 32 (65.3%) |
| Transportation | 115 (82.7%) | 24 (17.3%) |
| Material Moving | 86 (76.1%) | 27 (23.9%) |
| Total (Category) | 218 (72.4%) | 83 (27.6%) |
| Total (Overall) | 2,264 (50.9%) | 2,184 (49.1%) |
Employment Industries by Sex in Closter borough
Employment Industries in Closter borough
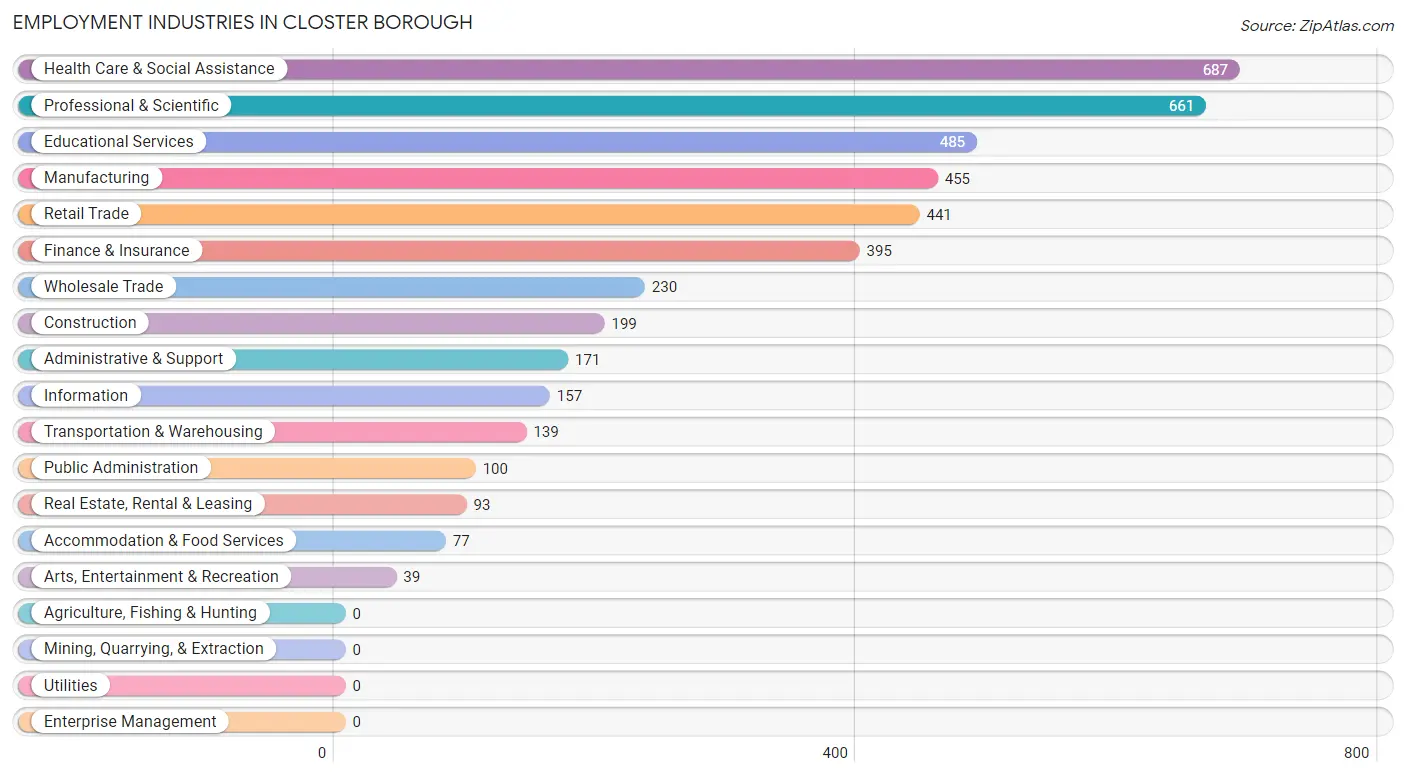
The major employment industries in Closter borough include Health Care & Social Assistance (687 | 15.4%), Professional & Scientific (661 | 14.9%), Educational Services (485 | 10.9%), Manufacturing (455 | 10.2%), and Retail Trade (441 | 9.9%).
Employment Industries by Sex in Closter borough
The Closter borough industries that see more men than women are Construction (90.9%), Public Administration (82.0%), and Transportation & Warehousing (76.3%), whereas the industries that tend to have a higher number of women are Real Estate, Rental & Leasing (82.8%), Health Care & Social Assistance (81.4%), and Educational Services (79.6%).
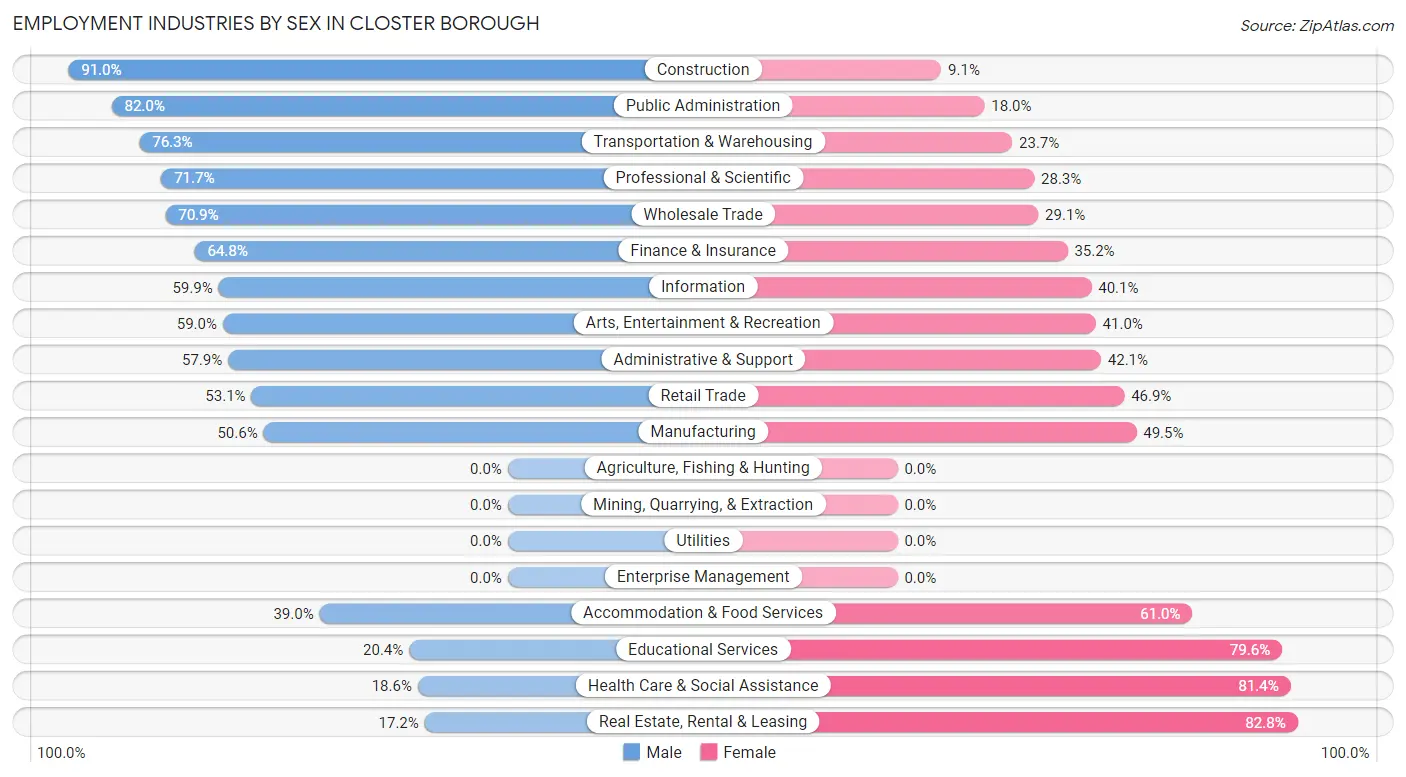
| Industry | Male | Female |
| Agriculture, Fishing & Hunting | 0 (0.0%) | 0 (0.0%) |
| Mining, Quarrying, & Extraction | 0 (0.0%) | 0 (0.0%) |
| Construction | 181 (90.9%) | 18 (9.0%) |
| Manufacturing | 230 (50.5%) | 225 (49.4%) |
| Wholesale Trade | 163 (70.9%) | 67 (29.1%) |
| Retail Trade | 234 (53.1%) | 207 (46.9%) |
| Transportation & Warehousing | 106 (76.3%) | 33 (23.7%) |
| Utilities | 0 (0.0%) | 0 (0.0%) |
| Information | 94 (59.9%) | 63 (40.1%) |
| Finance & Insurance | 256 (64.8%) | 139 (35.2%) |
| Real Estate, Rental & Leasing | 16 (17.2%) | 77 (82.8%) |
| Professional & Scientific | 474 (71.7%) | 187 (28.3%) |
| Enterprise Management | 0 (0.0%) | 0 (0.0%) |
| Administrative & Support | 99 (57.9%) | 72 (42.1%) |
| Educational Services | 99 (20.4%) | 386 (79.6%) |
| Health Care & Social Assistance | 128 (18.6%) | 559 (81.4%) |
| Arts, Entertainment & Recreation | 23 (59.0%) | 16 (41.0%) |
| Accommodation & Food Services | 30 (39.0%) | 47 (61.0%) |
| Public Administration | 82 (82.0%) | 18 (18.0%) |
| Total | 2,264 (50.9%) | 2,184 (49.1%) |
Education in Closter borough
School Enrollment in Closter borough
The most common levels of schooling among the 2,613 students in Closter borough are elementary school (622 | 23.8%), middle school (551 | 21.1%), and high school (549 | 21.0%).
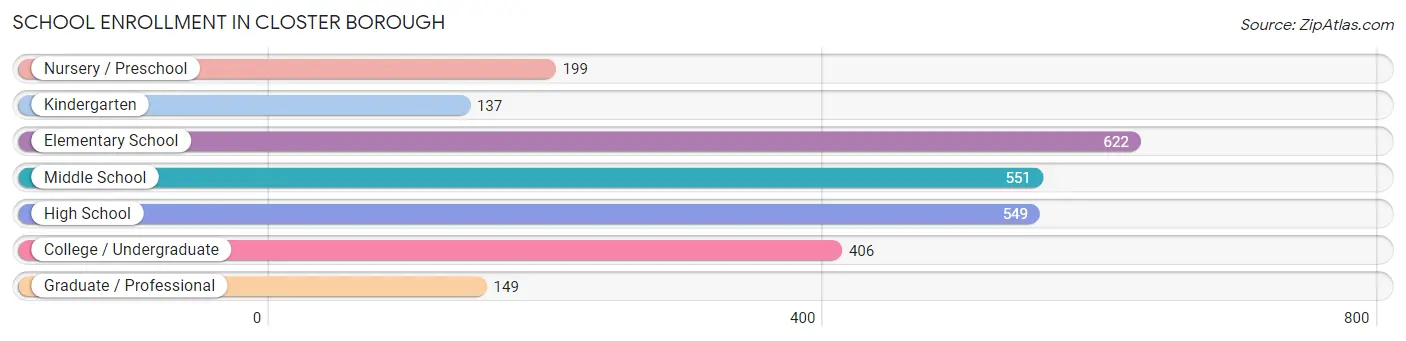
| School Level | # Students | % Students |
| Nursery / Preschool | 199 | 7.6% |
| Kindergarten | 137 | 5.2% |
| Elementary School | 622 | 23.8% |
| Middle School | 551 | 21.1% |
| High School | 549 | 21.0% |
| College / Undergraduate | 406 | 15.5% |
| Graduate / Professional | 149 | 5.7% |
| Total | 2,613 | 100.0% |
School Enrollment by Age by Funding Source in Closter borough
Out of a total of 2,613 students who are enrolled in schools in Closter borough, 452 (17.3%) attend a private institution, while the remaining 2,161 (82.7%) are enrolled in public schools. The age group of 20 to 24 year olds has the highest likelihood of being enrolled in private schools, with 144 (73.1% in the age bracket) enrolled. Conversely, the age group of 18 to 19 year olds has the lowest likelihood of being enrolled in a private school, with 177 (100.0% in the age bracket) attending a public institution.
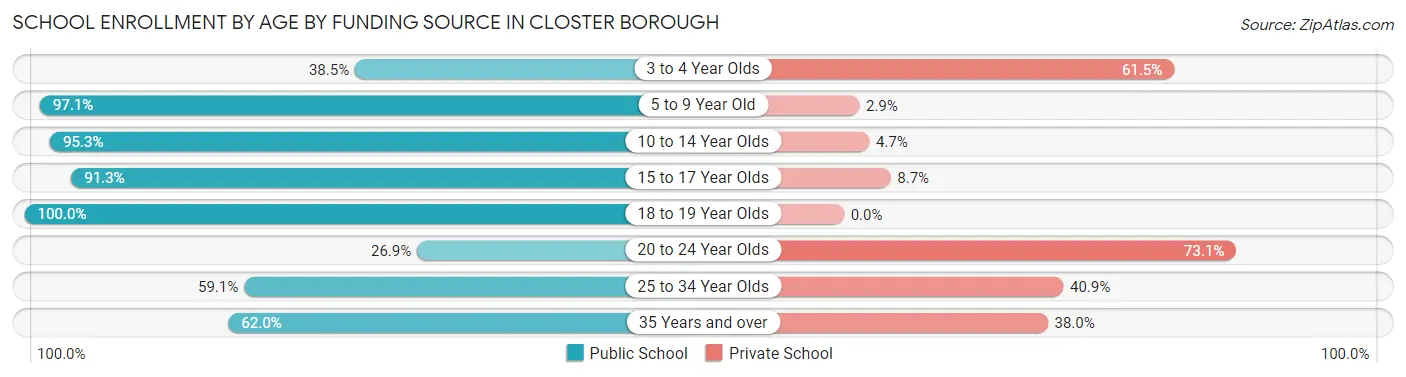
| Age Bracket | Public School | Private School |
| 3 to 4 Year Olds | 65 (38.5%) | 104 (61.5%) |
| 5 to 9 Year Old | 680 (97.1%) | 20 (2.9%) |
| 10 to 14 Year Olds | 623 (95.3%) | 31 (4.7%) |
| 15 to 17 Year Olds | 378 (91.3%) | 36 (8.7%) |
| 18 to 19 Year Olds | 177 (100.0%) | 0 (0.0%) |
| 20 to 24 Year Olds | 53 (26.9%) | 144 (73.1%) |
| 25 to 34 Year Olds | 68 (59.1%) | 47 (40.9%) |
| 35 Years and over | 116 (62.0%) | 71 (38.0%) |
| Total | 2,161 (82.7%) | 452 (17.3%) |
Educational Attainment by Field of Study in Closter borough
Business (883 | 22.1%), science & technology (446 | 11.2%), social sciences (434 | 10.9%), engineering (292 | 7.3%), and bio, nature & agricultural (238 | 6.0%) are the most common fields of study among 3,992 individuals in Closter borough who have obtained a bachelor's degree or higher.
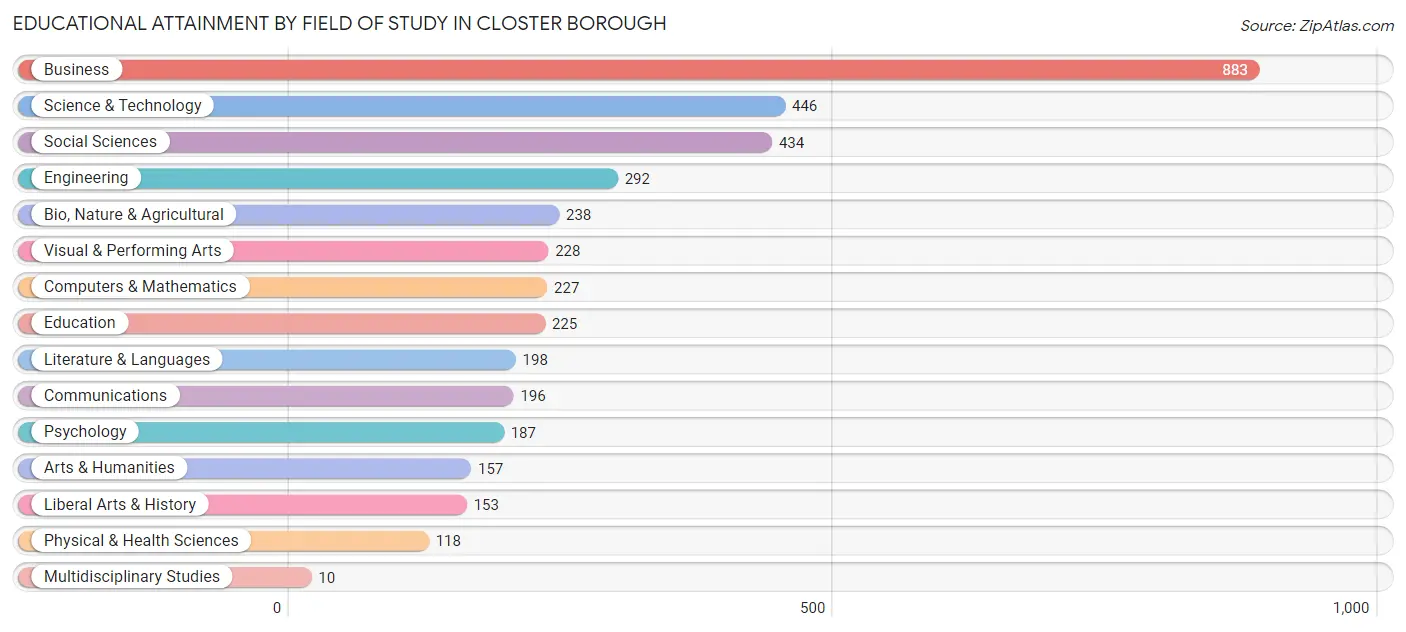
| Field of Study | # Graduates | % Graduates |
| Computers & Mathematics | 227 | 5.7% |
| Bio, Nature & Agricultural | 238 | 6.0% |
| Physical & Health Sciences | 118 | 3.0% |
| Psychology | 187 | 4.7% |
| Social Sciences | 434 | 10.9% |
| Engineering | 292 | 7.3% |
| Multidisciplinary Studies | 10 | 0.3% |
| Science & Technology | 446 | 11.2% |
| Business | 883 | 22.1% |
| Education | 225 | 5.6% |
| Literature & Languages | 198 | 5.0% |
| Liberal Arts & History | 153 | 3.8% |
| Visual & Performing Arts | 228 | 5.7% |
| Communications | 196 | 4.9% |
| Arts & Humanities | 157 | 3.9% |
| Total | 3,992 | 100.0% |
Transportation & Commute in Closter borough
Vehicle Availability by Sex in Closter borough
The most prevalent vehicle ownership categories in Closter borough are males with 2 vehicles (1,088, accounting for 48.5%) and females with 2 vehicles (1,059, making up 50.0%).
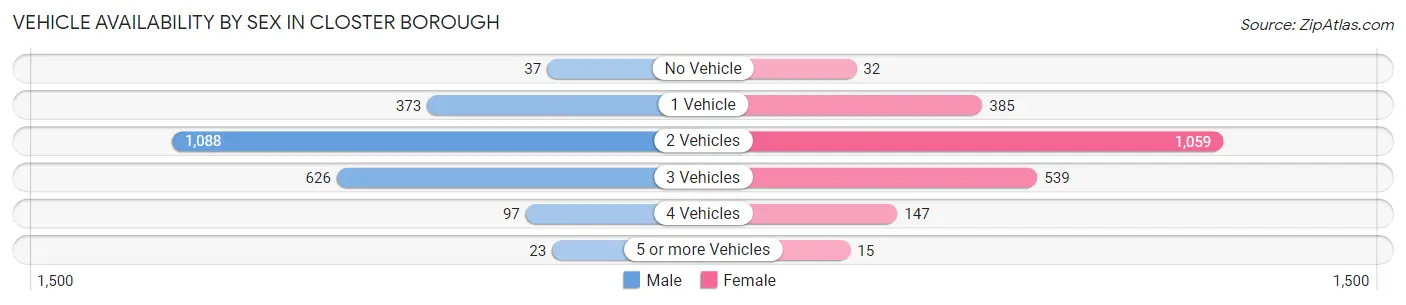
| Vehicles Available | Male | Female |
| No Vehicle | 37 (1.7%) | 32 (1.5%) |
| 1 Vehicle | 373 (16.6%) | 385 (17.7%) |
| 2 Vehicles | 1,088 (48.5%) | 1,059 (48.6%) |
| 3 Vehicles | 626 (27.9%) | 539 (24.8%) |
| 4 Vehicles | 97 (4.3%) | 147 (6.8%) |
| 5 or more Vehicles | 23 (1.0%) | 15 (0.7%) |
| Total | 2,244 (100.0%) | 2,177 (100.0%) |
Commute Time in Closter borough
The most frequently occuring commute durations in Closter borough are 60 to 89 minutes (674 commuters, 18.8%), 30 to 34 minutes (457 commuters, 12.7%), and 5 to 9 minutes (425 commuters, 11.8%).
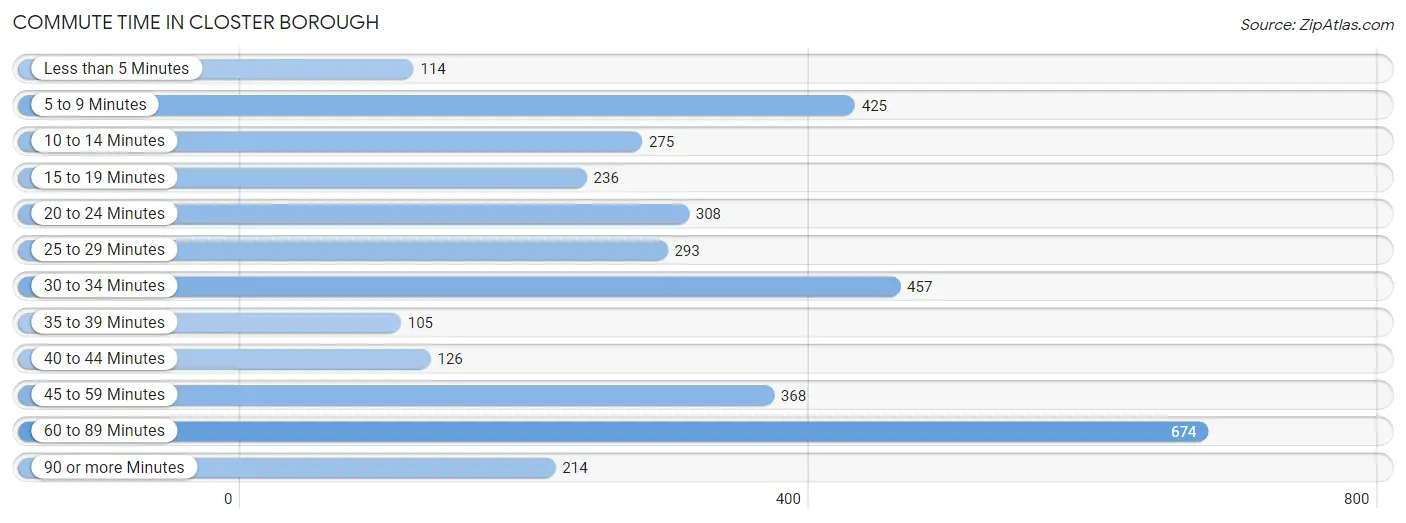
| Commute Time | # Commuters | % Commuters |
| Less than 5 Minutes | 114 | 3.2% |
| 5 to 9 Minutes | 425 | 11.8% |
| 10 to 14 Minutes | 275 | 7.6% |
| 15 to 19 Minutes | 236 | 6.6% |
| 20 to 24 Minutes | 308 | 8.6% |
| 25 to 29 Minutes | 293 | 8.2% |
| 30 to 34 Minutes | 457 | 12.7% |
| 35 to 39 Minutes | 105 | 2.9% |
| 40 to 44 Minutes | 126 | 3.5% |
| 45 to 59 Minutes | 368 | 10.2% |
| 60 to 89 Minutes | 674 | 18.8% |
| 90 or more Minutes | 214 | 5.9% |
Commute Time by Sex in Closter borough
The most common commute times in Closter borough are 60 to 89 minutes (339 commuters, 18.2%) for males and 60 to 89 minutes (335 commuters, 19.3%) for females.
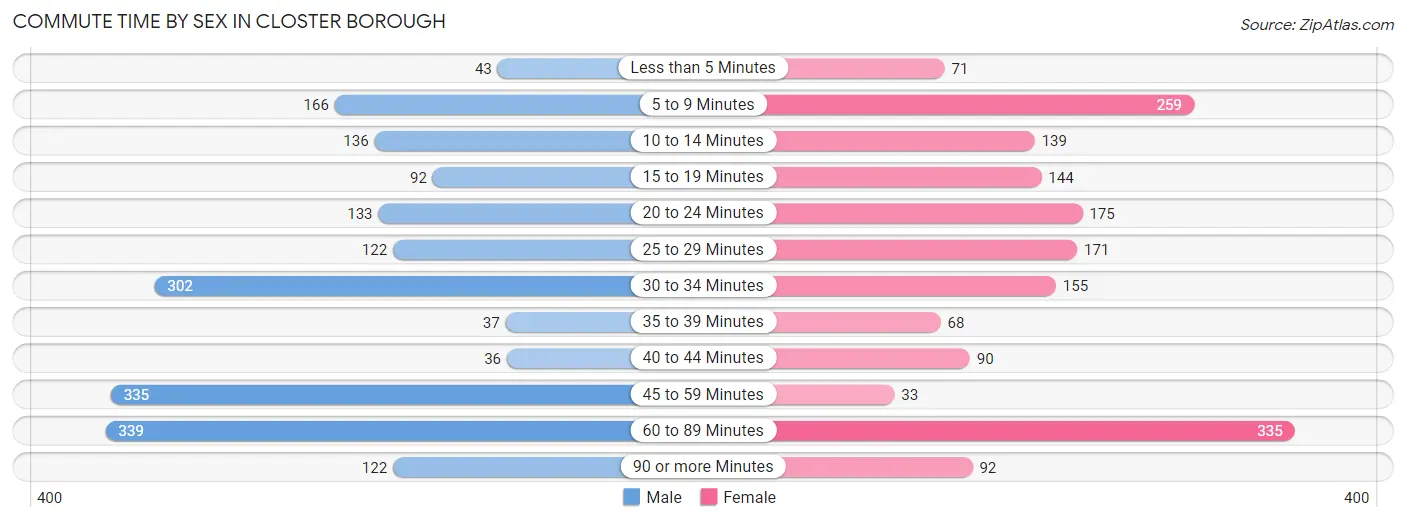
| Commute Time | Male | Female |
| Less than 5 Minutes | 43 (2.3%) | 71 (4.1%) |
| 5 to 9 Minutes | 166 (8.9%) | 259 (14.9%) |
| 10 to 14 Minutes | 136 (7.3%) | 139 (8.0%) |
| 15 to 19 Minutes | 92 (4.9%) | 144 (8.3%) |
| 20 to 24 Minutes | 133 (7.1%) | 175 (10.1%) |
| 25 to 29 Minutes | 122 (6.6%) | 171 (9.9%) |
| 30 to 34 Minutes | 302 (16.2%) | 155 (8.9%) |
| 35 to 39 Minutes | 37 (2.0%) | 68 (3.9%) |
| 40 to 44 Minutes | 36 (1.9%) | 90 (5.2%) |
| 45 to 59 Minutes | 335 (18.0%) | 33 (1.9%) |
| 60 to 89 Minutes | 339 (18.2%) | 335 (19.3%) |
| 90 or more Minutes | 122 (6.6%) | 92 (5.3%) |
Time of Departure to Work by Sex in Closter borough
The most frequent times of departure to work in Closter borough are 8:30 AM to 8:59 AM (335, 18.0%) for males and 8:00 AM to 8:29 AM (406, 23.4%) for females.
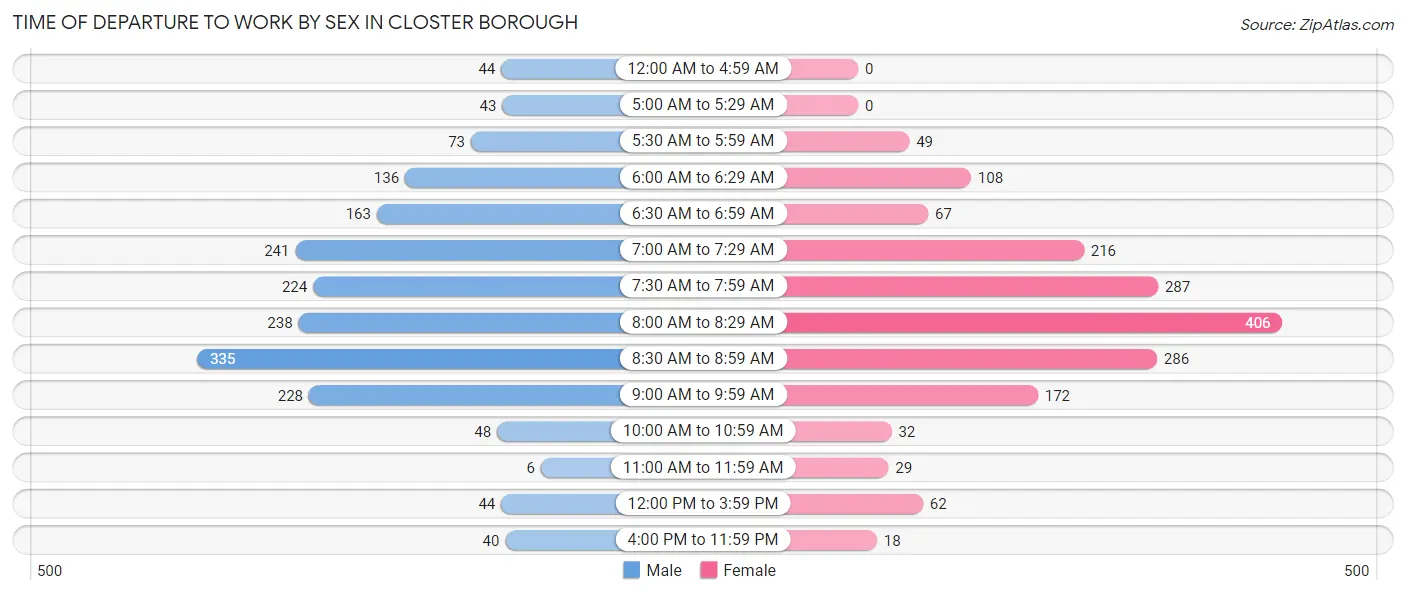
| Time of Departure | Male | Female |
| 12:00 AM to 4:59 AM | 44 (2.4%) | 0 (0.0%) |
| 5:00 AM to 5:29 AM | 43 (2.3%) | 0 (0.0%) |
| 5:30 AM to 5:59 AM | 73 (3.9%) | 49 (2.8%) |
| 6:00 AM to 6:29 AM | 136 (7.3%) | 108 (6.2%) |
| 6:30 AM to 6:59 AM | 163 (8.7%) | 67 (3.9%) |
| 7:00 AM to 7:29 AM | 241 (12.9%) | 216 (12.5%) |
| 7:30 AM to 7:59 AM | 224 (12.0%) | 287 (16.6%) |
| 8:00 AM to 8:29 AM | 238 (12.8%) | 406 (23.4%) |
| 8:30 AM to 8:59 AM | 335 (18.0%) | 286 (16.5%) |
| 9:00 AM to 9:59 AM | 228 (12.2%) | 172 (9.9%) |
| 10:00 AM to 10:59 AM | 48 (2.6%) | 32 (1.8%) |
| 11:00 AM to 11:59 AM | 6 (0.3%) | 29 (1.7%) |
| 12:00 PM to 3:59 PM | 44 (2.4%) | 62 (3.6%) |
| 4:00 PM to 11:59 PM | 40 (2.1%) | 18 (1.0%) |
| Total | 1,863 (100.0%) | 1,732 (100.0%) |
Housing Occupancy in Closter borough
Occupancy by Ownership in Closter borough
Of the total 2,721 dwellings in Closter borough, owner-occupied units account for 2,194 (80.6%), while renter-occupied units make up 527 (19.4%).
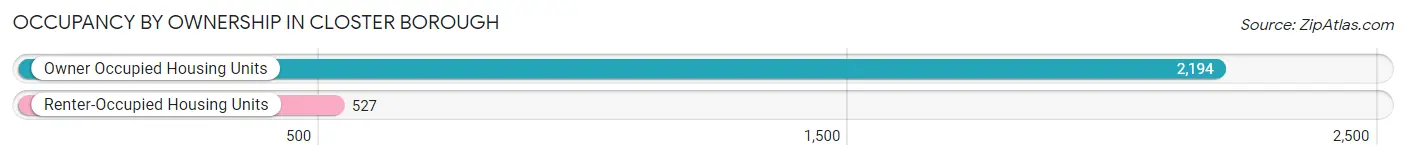
| Occupancy | # Housing Units | % Housing Units |
| Owner Occupied Housing Units | 2,194 | 80.6% |
| Renter-Occupied Housing Units | 527 | 19.4% |
| Total Occupied Housing Units | 2,721 | 100.0% |
Occupancy by Household Size in Closter borough
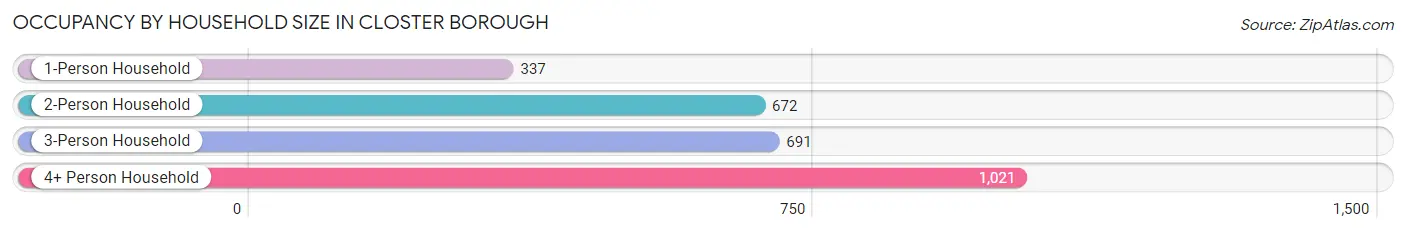
| Household Size | # Housing Units | % Housing Units |
| 1-Person Household | 337 | 12.4% |
| 2-Person Household | 672 | 24.7% |
| 3-Person Household | 691 | 25.4% |
| 4+ Person Household | 1,021 | 37.5% |
| Total Housing Units | 2,721 | 100.0% |
Occupancy by Ownership by Household Size in Closter borough
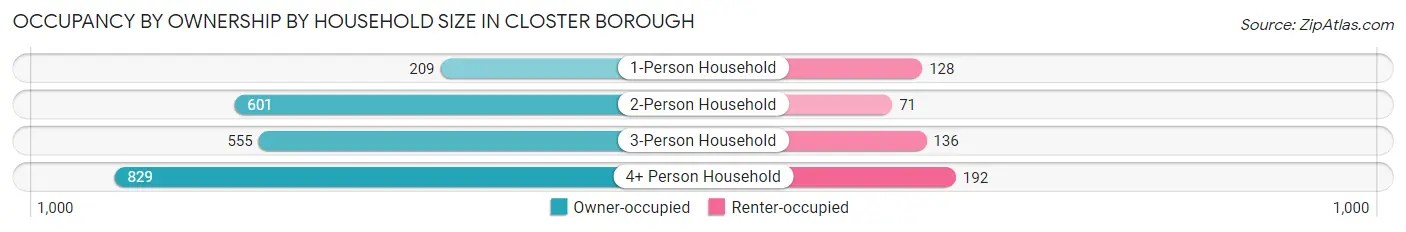
| Household Size | Owner-occupied | Renter-occupied |
| 1-Person Household | 209 (62.0%) | 128 (38.0%) |
| 2-Person Household | 601 (89.4%) | 71 (10.6%) |
| 3-Person Household | 555 (80.3%) | 136 (19.7%) |
| 4+ Person Household | 829 (81.2%) | 192 (18.8%) |
| Total Housing Units | 2,194 (80.6%) | 527 (19.4%) |
Occupancy by Educational Attainment in Closter borough
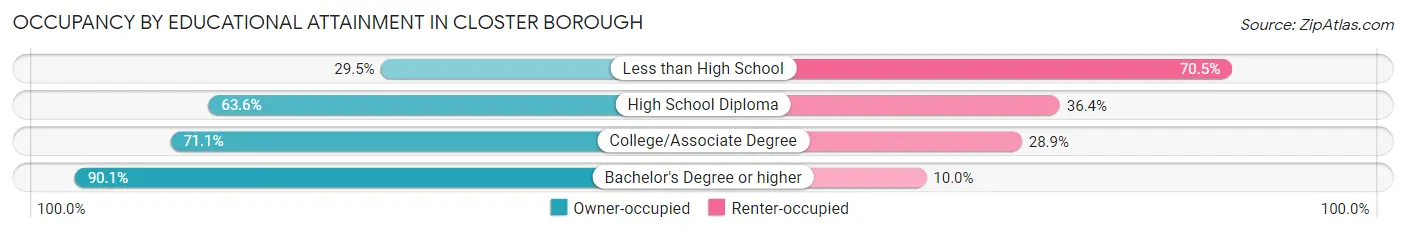
| Household Size | Owner-occupied | Renter-occupied |
| Less than High School | 38 (29.5%) | 91 (70.5%) |
| High School Diploma | 220 (63.6%) | 126 (36.4%) |
| College/Associate Degree | 325 (71.1%) | 132 (28.9%) |
| Bachelor's Degree or higher | 1,611 (90.0%) | 178 (10.0%) |
Occupancy by Age of Householder in Closter borough
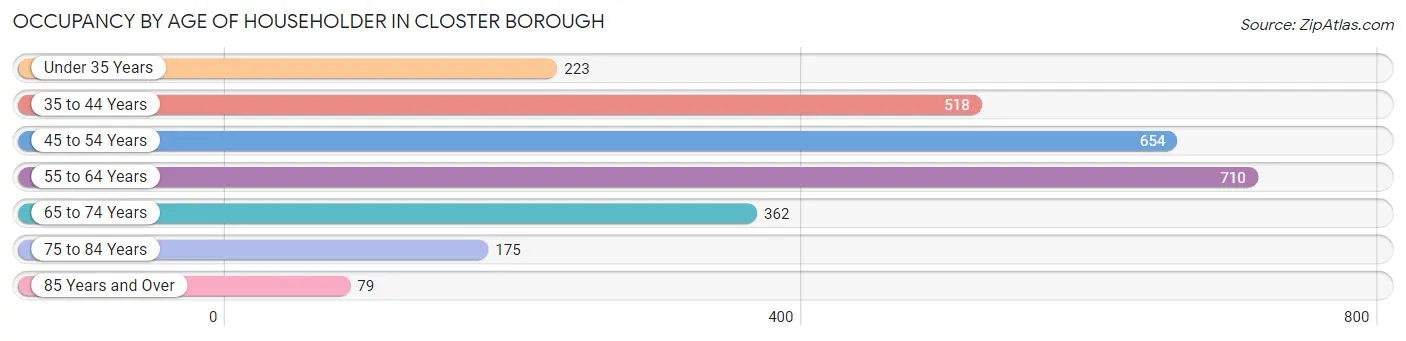
| Age Bracket | # Households | % Households |
| Under 35 Years | 223 | 8.2% |
| 35 to 44 Years | 518 | 19.0% |
| 45 to 54 Years | 654 | 24.0% |
| 55 to 64 Years | 710 | 26.1% |
| 65 to 74 Years | 362 | 13.3% |
| 75 to 84 Years | 175 | 6.4% |
| 85 Years and Over | 79 | 2.9% |
| Total | 2,721 | 100.0% |
Housing Finances in Closter borough
Median Income by Occupancy in Closter borough
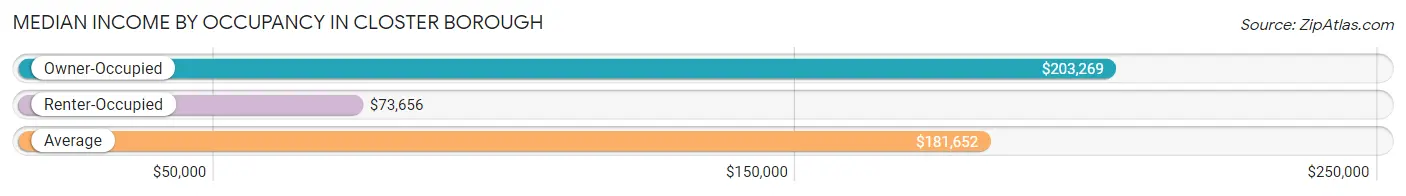
| Occupancy Type | # Households | Median Income |
| Owner-Occupied | 2,194 (80.6%) | $203,269 |
| Renter-Occupied | 527 (19.4%) | $73,656 |
| Average | 2,721 (100.0%) | $181,652 |
Occupancy by Householder Income Bracket in Closter borough
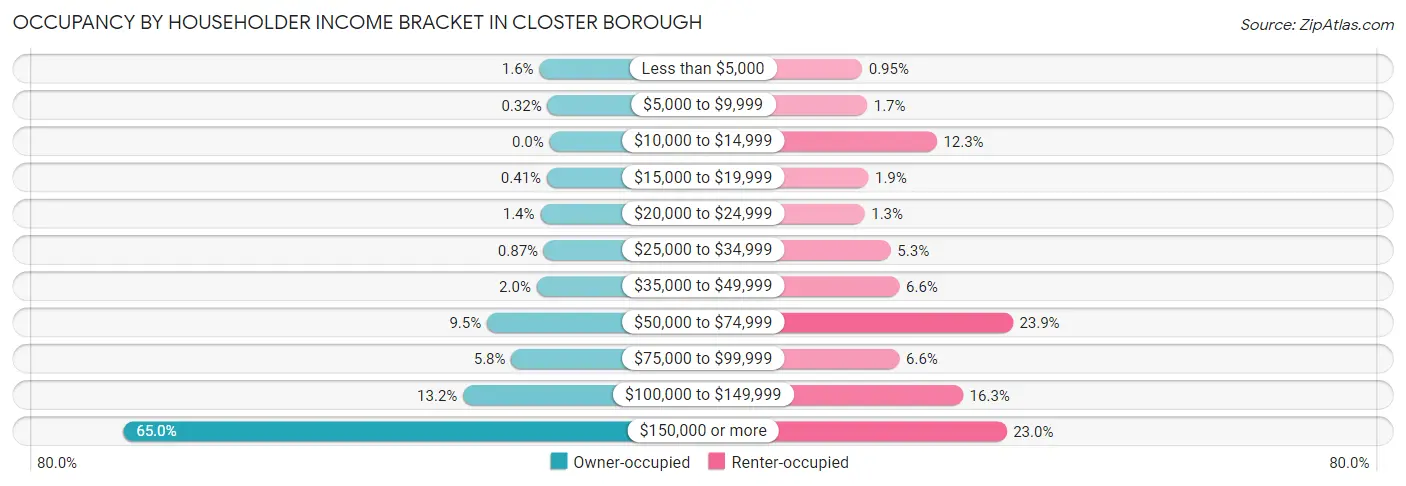
| Income Bracket | Owner-occupied | Renter-occupied |
| Less than $5,000 | 34 (1.5%) | 5 (0.9%) |
| $5,000 to $9,999 | 7 (0.3%) | 9 (1.7%) |
| $10,000 to $14,999 | 0 (0.0%) | 65 (12.3%) |
| $15,000 to $19,999 | 9 (0.4%) | 10 (1.9%) |
| $20,000 to $24,999 | 31 (1.4%) | 7 (1.3%) |
| $25,000 to $34,999 | 19 (0.9%) | 28 (5.3%) |
| $35,000 to $49,999 | 43 (2.0%) | 35 (6.6%) |
| $50,000 to $74,999 | 209 (9.5%) | 126 (23.9%) |
| $75,000 to $99,999 | 128 (5.8%) | 35 (6.6%) |
| $100,000 to $149,999 | 289 (13.2%) | 86 (16.3%) |
| $150,000 or more | 1,425 (64.9%) | 121 (23.0%) |
| Total | 2,194 (100.0%) | 527 (100.0%) |
Monthly Housing Cost Tiers in Closter borough
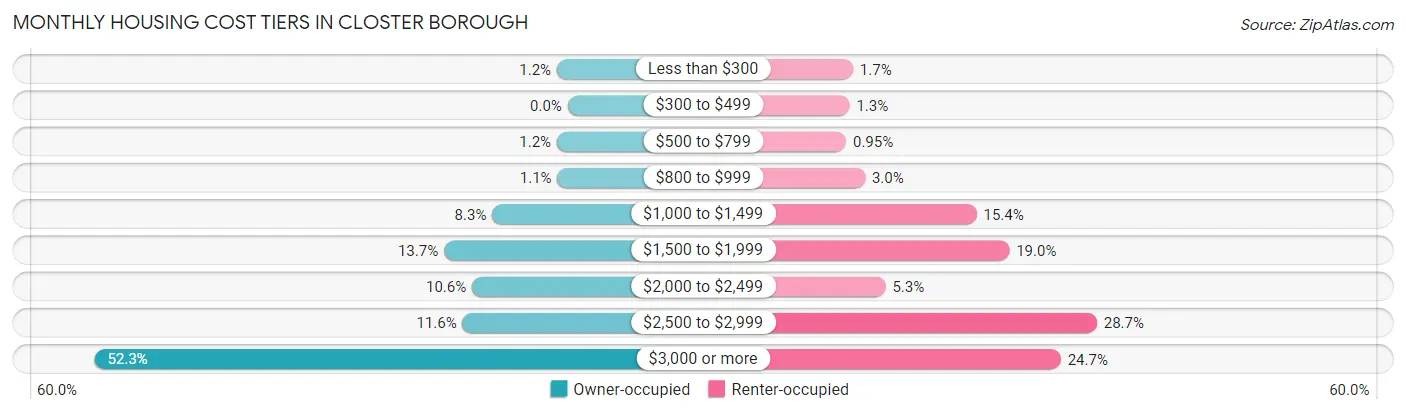
| Monthly Cost | Owner-occupied | Renter-occupied |
| Less than $300 | 26 (1.2%) | 9 (1.7%) |
| $300 to $499 | 0 (0.0%) | 7 (1.3%) |
| $500 to $799 | 26 (1.2%) | 5 (0.9%) |
| $800 to $999 | 25 (1.1%) | 16 (3.0%) |
| $1,000 to $1,499 | 183 (8.3%) | 81 (15.4%) |
| $1,500 to $1,999 | 300 (13.7%) | 100 (19.0%) |
| $2,000 to $2,499 | 232 (10.6%) | 28 (5.3%) |
| $2,500 to $2,999 | 255 (11.6%) | 151 (28.6%) |
| $3,000 or more | 1,147 (52.3%) | 130 (24.7%) |
| Total | 2,194 (100.0%) | 527 (100.0%) |
Physical Housing Characteristics in Closter borough
Housing Structures in Closter borough
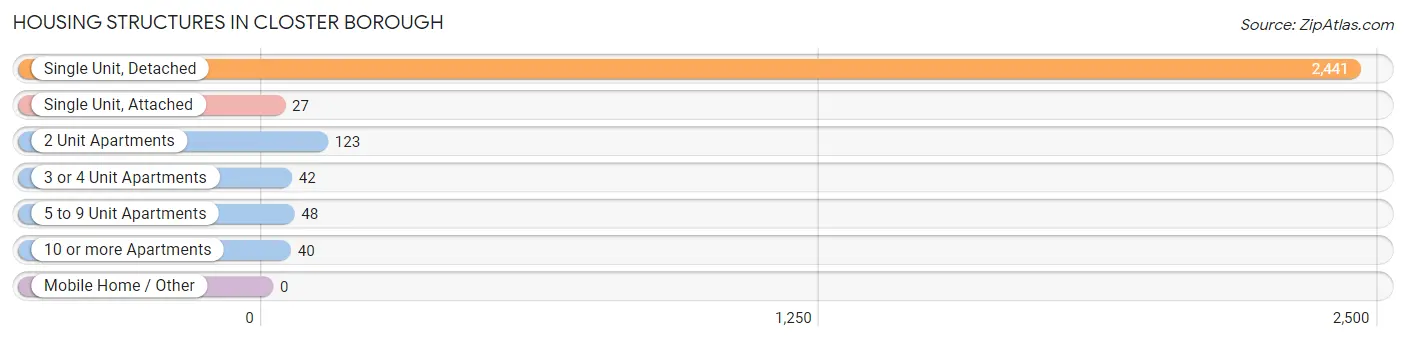
| Structure Type | # Housing Units | % Housing Units |
| Single Unit, Detached | 2,441 | 89.7% |
| Single Unit, Attached | 27 | 1.0% |
| 2 Unit Apartments | 123 | 4.5% |
| 3 or 4 Unit Apartments | 42 | 1.5% |
| 5 to 9 Unit Apartments | 48 | 1.8% |
| 10 or more Apartments | 40 | 1.5% |
| Mobile Home / Other | 0 | 0.0% |
| Total | 2,721 | 100.0% |
Housing Structures by Occupancy in Closter borough
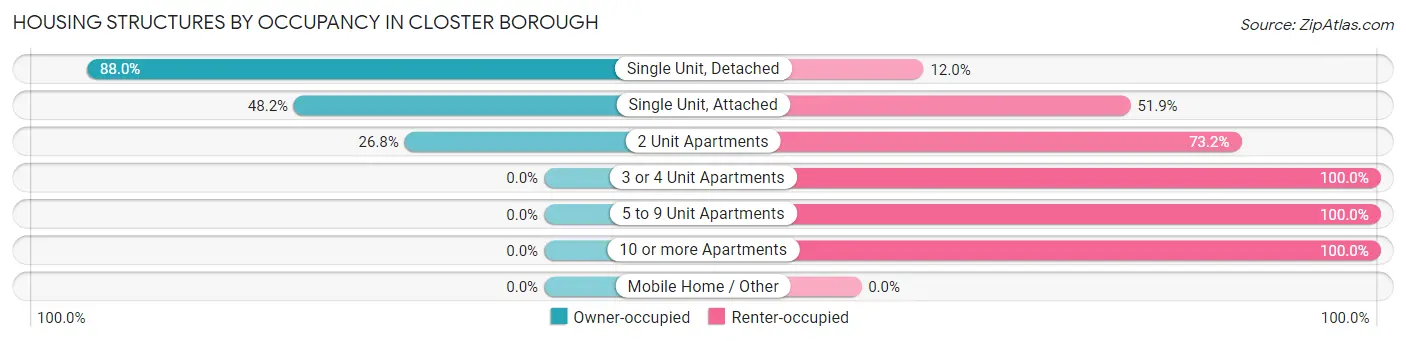
| Structure Type | Owner-occupied | Renter-occupied |
| Single Unit, Detached | 2,148 (88.0%) | 293 (12.0%) |
| Single Unit, Attached | 13 (48.1%) | 14 (51.8%) |
| 2 Unit Apartments | 33 (26.8%) | 90 (73.2%) |
| 3 or 4 Unit Apartments | 0 (0.0%) | 42 (100.0%) |
| 5 to 9 Unit Apartments | 0 (0.0%) | 48 (100.0%) |
| 10 or more Apartments | 0 (0.0%) | 40 (100.0%) |
| Mobile Home / Other | 0 (0.0%) | 0 (0.0%) |
| Total | 2,194 (80.6%) | 527 (19.4%) |
Housing Structures by Number of Rooms in Closter borough
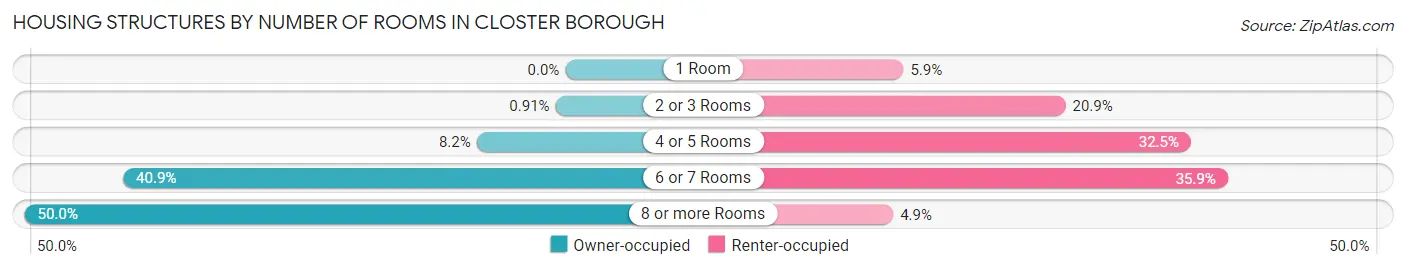
| Number of Rooms | Owner-occupied | Renter-occupied |
| 1 Room | 0 (0.0%) | 31 (5.9%) |
| 2 or 3 Rooms | 20 (0.9%) | 110 (20.9%) |
| 4 or 5 Rooms | 180 (8.2%) | 171 (32.5%) |
| 6 or 7 Rooms | 897 (40.9%) | 189 (35.9%) |
| 8 or more Rooms | 1,097 (50.0%) | 26 (4.9%) |
| Total | 2,194 (100.0%) | 527 (100.0%) |
Housing Structure by Heating Type in Closter borough
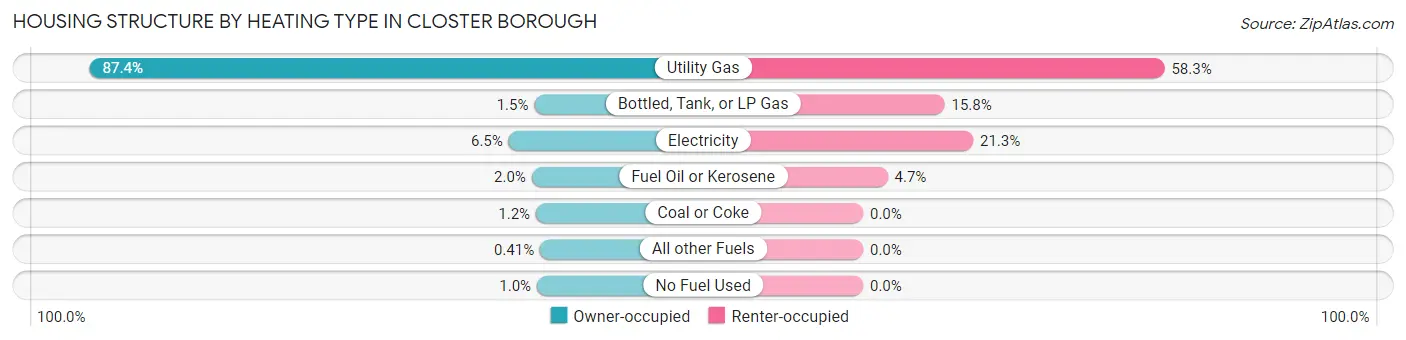
| Heating Type | Owner-occupied | Renter-occupied |
| Utility Gas | 1,918 (87.4%) | 307 (58.3%) |
| Bottled, Tank, or LP Gas | 33 (1.5%) | 83 (15.8%) |
| Electricity | 142 (6.5%) | 112 (21.2%) |
| Fuel Oil or Kerosene | 44 (2.0%) | 25 (4.7%) |
| Coal or Coke | 26 (1.2%) | 0 (0.0%) |
| All other Fuels | 9 (0.4%) | 0 (0.0%) |
| No Fuel Used | 22 (1.0%) | 0 (0.0%) |
| Total | 2,194 (100.0%) | 527 (100.0%) |
Household Vehicle Usage in Closter borough
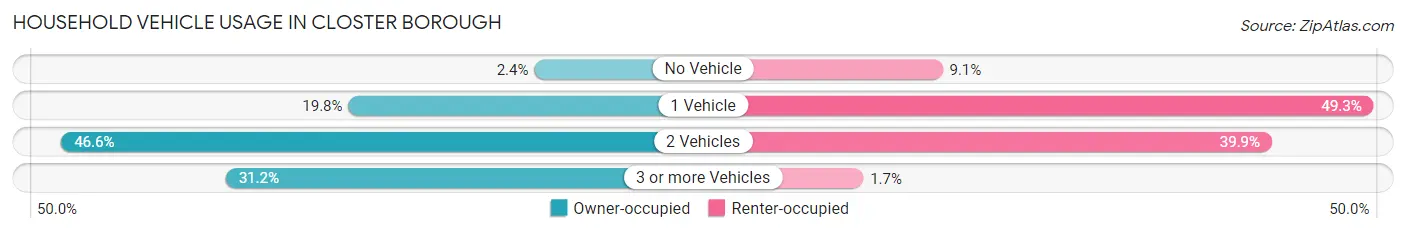
| Vehicles per Household | Owner-occupied | Renter-occupied |
| No Vehicle | 53 (2.4%) | 48 (9.1%) |
| 1 Vehicle | 434 (19.8%) | 260 (49.3%) |
| 2 Vehicles | 1,022 (46.6%) | 210 (39.9%) |
| 3 or more Vehicles | 685 (31.2%) | 9 (1.7%) |
| Total | 2,194 (100.0%) | 527 (100.0%) |
Real Estate & Mortgages in Closter borough
Real Estate and Mortgage Overview in Closter borough
| Characteristic | Without Mortgage | With Mortgage |
| Housing Units | 717 | 1,477 |
| Median Property Value | $730,200 | $800,300 |
| Median Household Income | $161,250 | $1,061 |
| Monthly Housing Costs | $1,501 | $1,126 |
| Real Estate Taxes | $10,001 | $16 |
Property Value by Mortgage Status in Closter borough
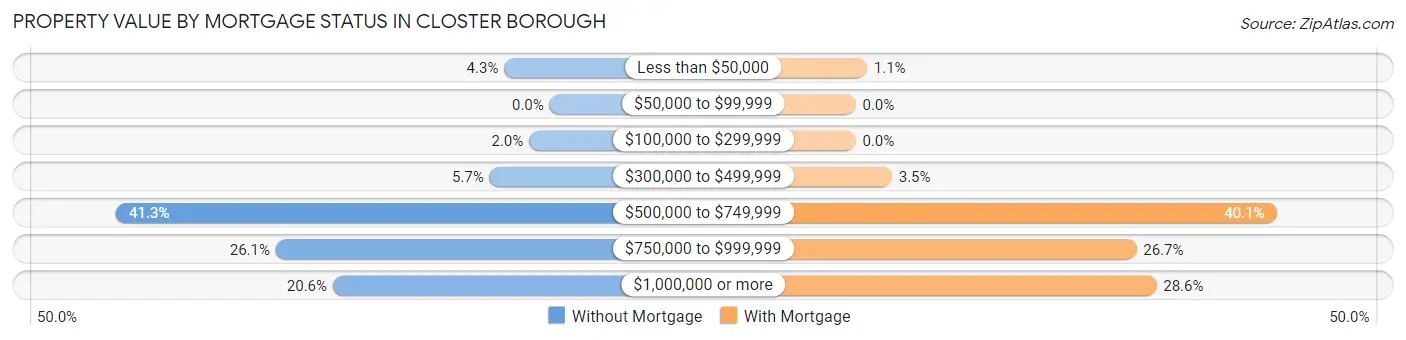
| Property Value | Without Mortgage | With Mortgage |
| Less than $50,000 | 31 (4.3%) | 16 (1.1%) |
| $50,000 to $99,999 | 0 (0.0%) | 0 (0.0%) |
| $100,000 to $299,999 | 14 (1.9%) | 0 (0.0%) |
| $300,000 to $499,999 | 41 (5.7%) | 51 (3.5%) |
| $500,000 to $749,999 | 296 (41.3%) | 592 (40.1%) |
| $750,000 to $999,999 | 187 (26.1%) | 395 (26.7%) |
| $1,000,000 or more | 148 (20.6%) | 423 (28.6%) |
| Total | 717 (100.0%) | 1,477 (100.0%) |
Household Income by Mortgage Status in Closter borough
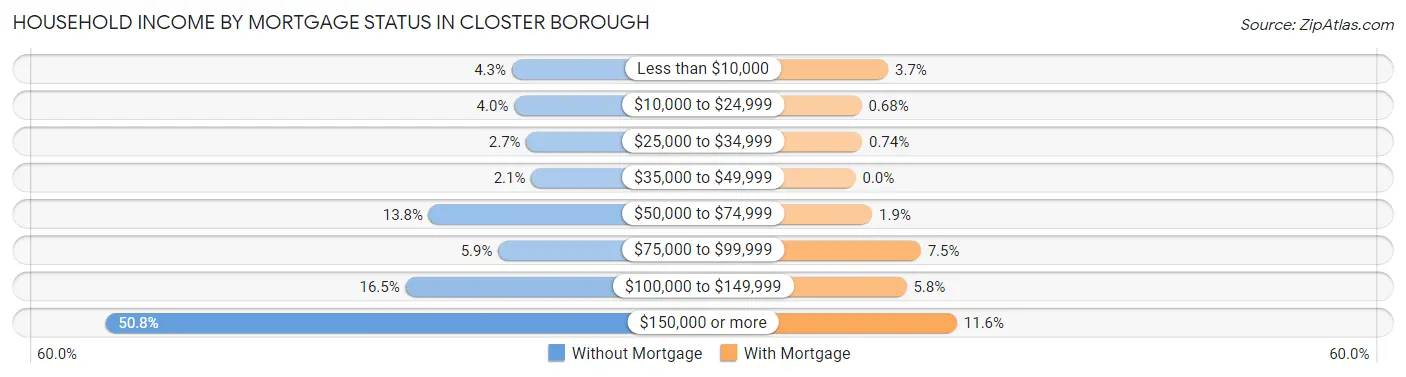
| Household Income | Without Mortgage | With Mortgage |
| Less than $10,000 | 31 (4.3%) | 55 (3.7%) |
| $10,000 to $24,999 | 29 (4.0%) | 10 (0.7%) |
| $25,000 to $34,999 | 19 (2.6%) | 11 (0.7%) |
| $35,000 to $49,999 | 15 (2.1%) | 0 (0.0%) |
| $50,000 to $74,999 | 99 (13.8%) | 28 (1.9%) |
| $75,000 to $99,999 | 42 (5.9%) | 110 (7.4%) |
| $100,000 to $149,999 | 118 (16.5%) | 86 (5.8%) |
| $150,000 or more | 364 (50.8%) | 171 (11.6%) |
| Total | 717 (100.0%) | 1,477 (100.0%) |
Property Value to Household Income Ratio in Closter borough
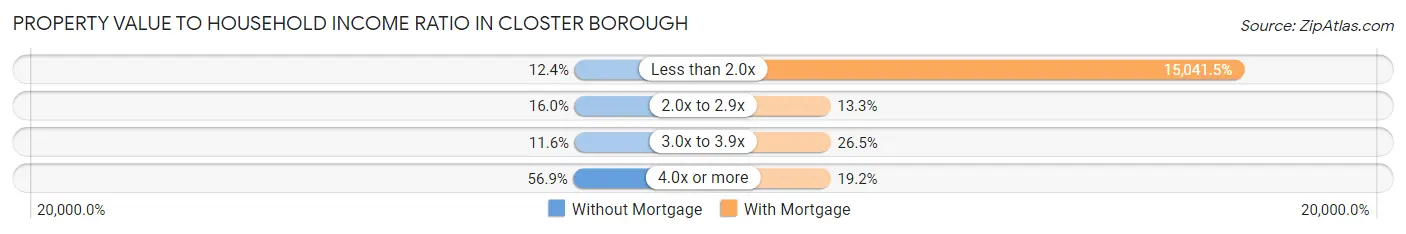
| Value-to-Income Ratio | Without Mortgage | With Mortgage |
| Less than 2.0x | 89 (12.4%) | 222,163 (15,041.5%) |
| 2.0x to 2.9x | 115 (16.0%) | 197 (13.3%) |
| 3.0x to 3.9x | 83 (11.6%) | 391 (26.5%) |
| 4.0x or more | 408 (56.9%) | 284 (19.2%) |
| Total | 717 (100.0%) | 1,477 (100.0%) |
Real Estate Taxes by Mortgage Status in Closter borough
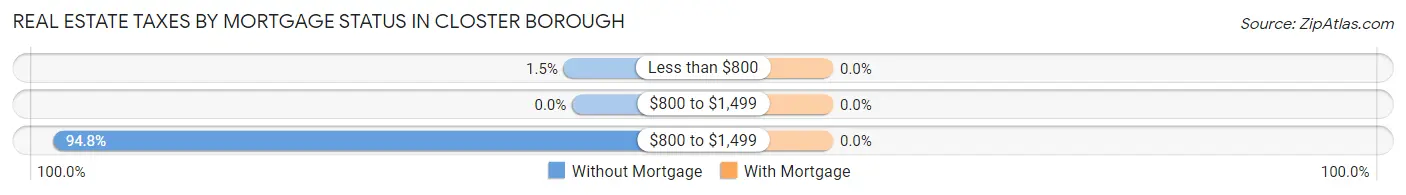
| Property Taxes | Without Mortgage | With Mortgage |
| Less than $800 | 11 (1.5%) | 0 (0.0%) |
| $800 to $1,499 | 0 (0.0%) | 0 (0.0%) |
| $800 to $1,499 | 680 (94.8%) | 0 (0.0%) |
| Total | 717 (100.0%) | 1,477 (100.0%) |
Health & Disability in Closter borough
Health Insurance Coverage by Age in Closter borough
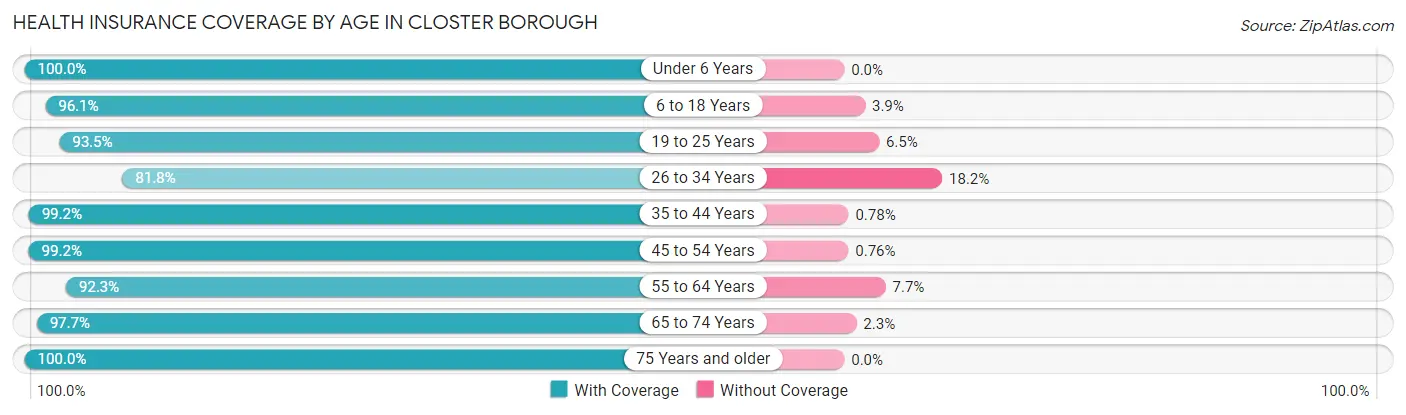
| Age Bracket | With Coverage | Without Coverage |
| Under 6 Years | 610 (100.0%) | 0 (0.0%) |
| 6 to 18 Years | 1,740 (96.1%) | 70 (3.9%) |
| 19 to 25 Years | 520 (93.5%) | 36 (6.5%) |
| 26 to 34 Years | 708 (81.8%) | 158 (18.2%) |
| 35 to 44 Years | 1,022 (99.2%) | 8 (0.8%) |
| 45 to 54 Years | 1,180 (99.2%) | 9 (0.8%) |
| 55 to 64 Years | 1,211 (92.3%) | 101 (7.7%) |
| 65 to 74 Years | 648 (97.7%) | 15 (2.3%) |
| 75 Years and older | 469 (100.0%) | 0 (0.0%) |
| Total | 8,108 (95.3%) | 397 (4.7%) |
Health Insurance Coverage by Citizenship Status in Closter borough
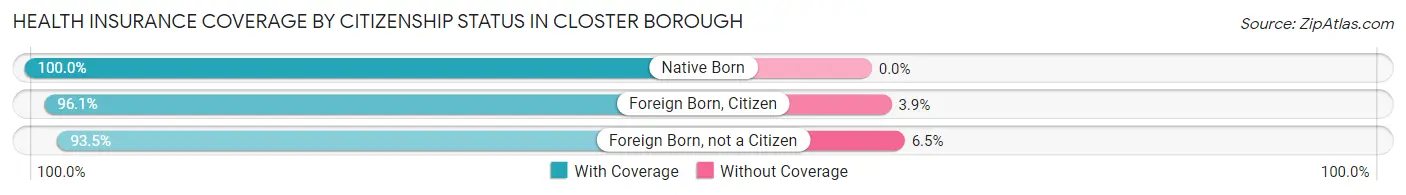
| Citizenship Status | With Coverage | Without Coverage |
| Native Born | 610 (100.0%) | 0 (0.0%) |
| Foreign Born, Citizen | 1,740 (96.1%) | 70 (3.9%) |
| Foreign Born, not a Citizen | 520 (93.5%) | 36 (6.5%) |
Health Insurance Coverage by Household Income in Closter borough
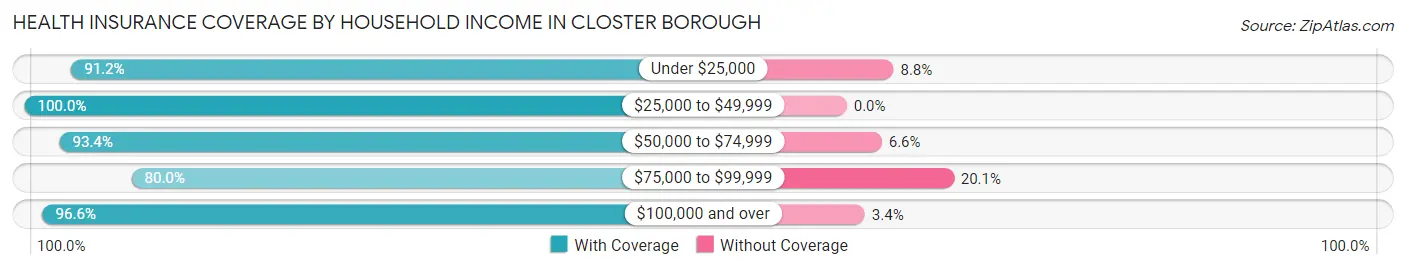
| Household Income | With Coverage | Without Coverage |
| Under $25,000 | 302 (91.2%) | 29 (8.8%) |
| $25,000 to $49,999 | 192 (100.0%) | 0 (0.0%) |
| $50,000 to $74,999 | 869 (93.4%) | 61 (6.6%) |
| $75,000 to $99,999 | 331 (79.9%) | 83 (20.1%) |
| $100,000 and over | 6,387 (96.6%) | 224 (3.4%) |
Public vs Private Health Insurance Coverage by Age in Closter borough
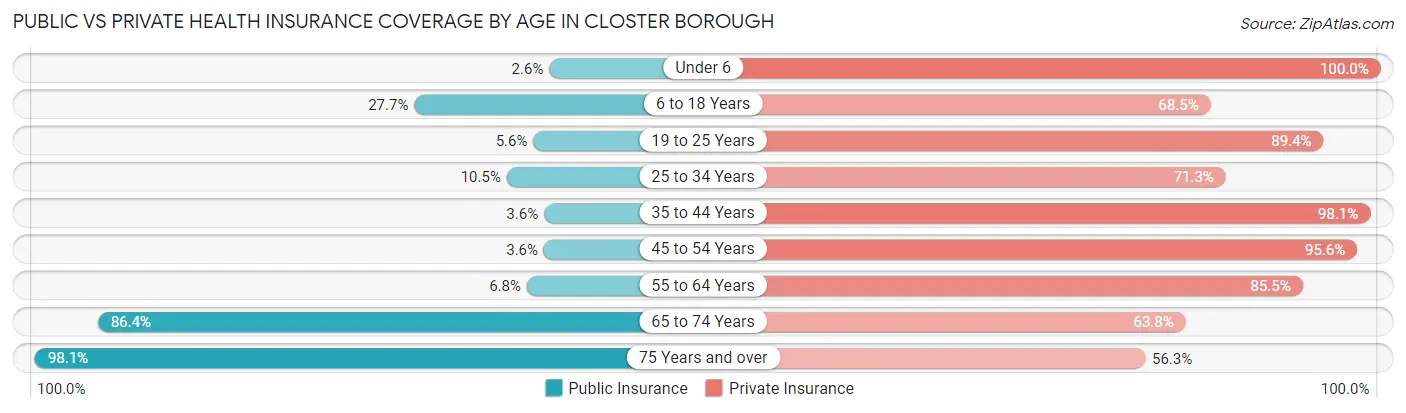
| Age Bracket | Public Insurance | Private Insurance |
| Under 6 | 16 (2.6%) | 610 (100.0%) |
| 6 to 18 Years | 501 (27.7%) | 1,239 (68.4%) |
| 19 to 25 Years | 31 (5.6%) | 497 (89.4%) |
| 25 to 34 Years | 91 (10.5%) | 617 (71.3%) |
| 35 to 44 Years | 37 (3.6%) | 1,010 (98.1%) |
| 45 to 54 Years | 43 (3.6%) | 1,137 (95.6%) |
| 55 to 64 Years | 89 (6.8%) | 1,122 (85.5%) |
| 65 to 74 Years | 573 (86.4%) | 423 (63.8%) |
| 75 Years and over | 460 (98.1%) | 264 (56.3%) |
| Total | 1,841 (21.6%) | 6,919 (81.4%) |
Disability Status by Sex by Age in Closter borough
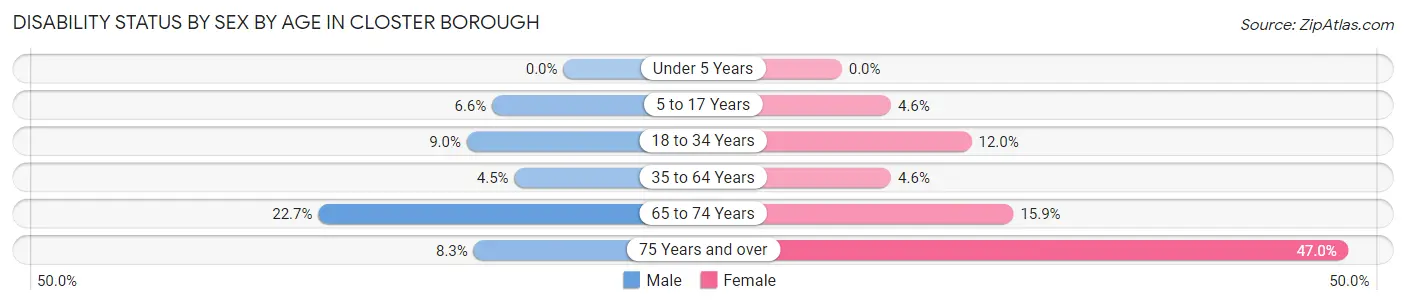
| Age Bracket | Male | Female |
| Under 5 Years | 0 (0.0%) | 0 (0.0%) |
| 5 to 17 Years | 75 (6.6%) | 29 (4.6%) |
| 18 to 34 Years | 63 (9.0%) | 99 (12.0%) |
| 35 to 64 Years | 79 (4.5%) | 82 (4.6%) |
| 65 to 74 Years | 68 (22.7%) | 58 (15.9%) |
| 75 Years and over | 18 (8.3%) | 119 (47.0%) |
Disability Class by Sex by Age in Closter borough
Disability Class: Hearing Difficulty
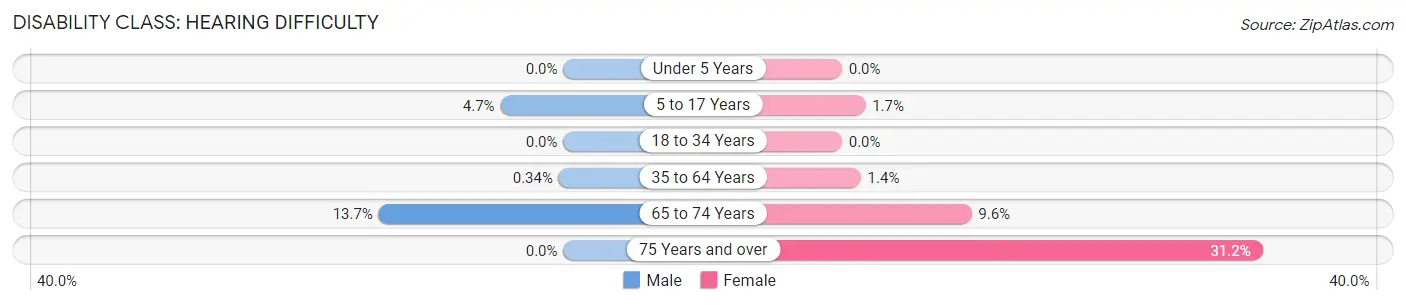
| Age Bracket | Male | Female |
| Under 5 Years | 0 (0.0%) | 0 (0.0%) |
| 5 to 17 Years | 53 (4.7%) | 11 (1.7%) |
| 18 to 34 Years | 0 (0.0%) | 0 (0.0%) |
| 35 to 64 Years | 6 (0.3%) | 25 (1.4%) |
| 65 to 74 Years | 41 (13.7%) | 35 (9.6%) |
| 75 Years and over | 0 (0.0%) | 79 (31.2%) |
Disability Class: Vision Difficulty
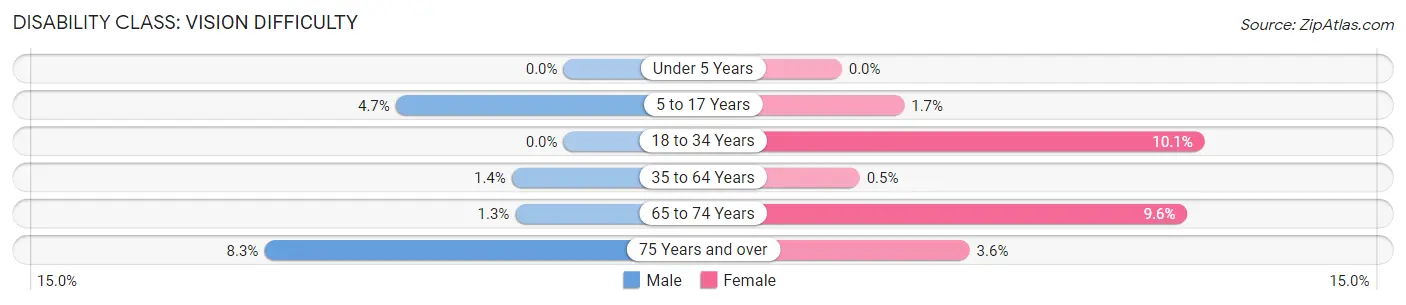
| Age Bracket | Male | Female |
| Under 5 Years | 0 (0.0%) | 0 (0.0%) |
| 5 to 17 Years | 53 (4.7%) | 11 (1.7%) |
| 18 to 34 Years | 0 (0.0%) | 83 (10.1%) |
| 35 to 64 Years | 25 (1.4%) | 9 (0.5%) |
| 65 to 74 Years | 4 (1.3%) | 35 (9.6%) |
| 75 Years and over | 18 (8.3%) | 9 (3.6%) |
Disability Class: Cognitive Difficulty
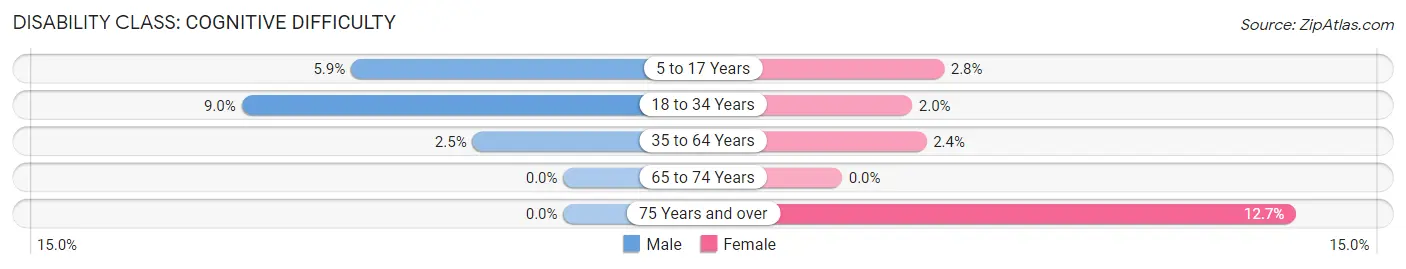
| Age Bracket | Male | Female |
| 5 to 17 Years | 67 (5.9%) | 18 (2.8%) |
| 18 to 34 Years | 63 (9.0%) | 16 (1.9%) |
| 35 to 64 Years | 44 (2.5%) | 42 (2.4%) |
| 65 to 74 Years | 0 (0.0%) | 0 (0.0%) |
| 75 Years and over | 0 (0.0%) | 32 (12.7%) |
Disability Class: Ambulatory Difficulty
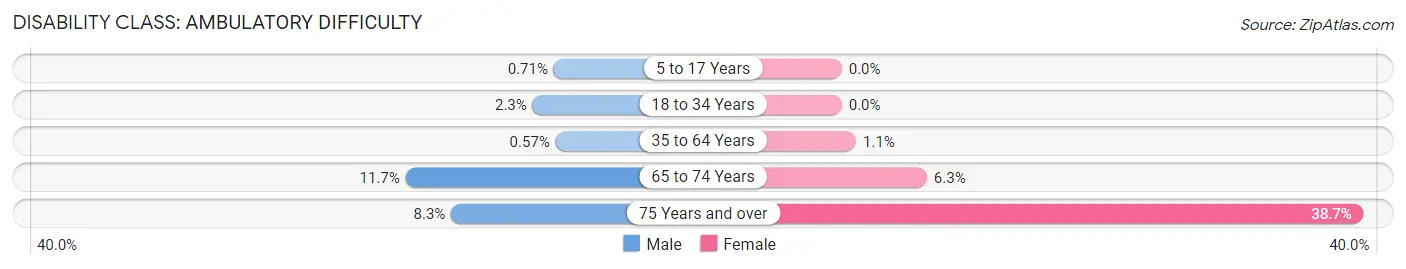
| Age Bracket | Male | Female |
| 5 to 17 Years | 8 (0.7%) | 0 (0.0%) |
| 18 to 34 Years | 16 (2.3%) | 0 (0.0%) |
| 35 to 64 Years | 10 (0.6%) | 19 (1.1%) |
| 65 to 74 Years | 35 (11.7%) | 23 (6.3%) |
| 75 Years and over | 18 (8.3%) | 98 (38.7%) |
Disability Class: Self-Care Difficulty
| Age Bracket | Male | Female |
| 5 to 17 Years | 53 (4.7%) | 0 (0.0%) |
| 18 to 34 Years | 46 (6.5%) | 0 (0.0%) |
| 35 to 64 Years | 0 (0.0%) | 6 (0.3%) |
| 65 to 74 Years | 4 (1.3%) | 0 (0.0%) |
| 75 Years and over | 0 (0.0%) | 52 (20.5%) |
Technology Access in Closter borough
Computing Device Access in Closter borough
| Device Type | # Households | % Households |
| Desktop or Laptop | 2,506 | 92.1% |
| Smartphone | 2,573 | 94.6% |
| Tablet | 2,256 | 82.9% |
| No Computing Device | 48 | 1.8% |
| Total | 2,721 | 100.0% |
Internet Access in Closter borough
| Internet Type | # Households | % Households |
| Dial-Up Internet | 0 | 0.0% |
| Broadband Home | 2,540 | 93.3% |
| Cellular Data Only | 99 | 3.6% |
| Satellite Internet | 47 | 1.7% |
| No Internet | 82 | 3.0% |
| Total | 2,721 | 100.0% |
Closter borough Summary
Closter Borough is a small borough located in Bergen County, New Jersey. It is situated in the northern part of the state, just west of the Hudson River. The borough is bordered by the towns of Harrington Park, Norwood, Northvale, and Alpine. Closter is home to approximately 8,000 people and is known for its small-town charm and close-knit community.
History
Closter was first settled in the late 1600s by Dutch settlers. The area was originally known as “Closter”, which is derived from the Dutch word for “cluster”. The area was part of the larger Harrington Township until 1904, when it was incorporated as a borough. The borough was named after the Closter family, who were prominent landowners in the area.
Geography
Closter is located in the northern part of Bergen County, just west of the Hudson River. The borough is bordered by the towns of Harrington Park, Norwood, Northvale, and Alpine. Closter is situated on a ridge of the Palisades, which is a line of steep cliffs along the western side of the Hudson River. The borough is approximately 4.5 square miles in size and is home to several parks, including Closter Nature Center and Closter Park.
Economy
Closter’s economy is largely based on retail and services. The borough is home to several small businesses, including restaurants, shops, and professional services. Closter is also home to several corporate headquarters, including the headquarters of the pharmaceutical company, Merck & Co. The borough is also home to several industrial parks, which provide employment opportunities for local residents.
Demographics
As of the 2010 census, Closter had a population of 8,373 people. The racial makeup of the borough was 79.3% White, 8.2% Asian, 6.7% Hispanic or Latino, and 5.8% African American. The median household income in Closter was $107,917, and the median family income was $125,917. The median age of the population was 43.7 years.
Conclusion
Closter is a small borough located in Bergen County, New Jersey. It is known for its small-town charm and close-knit community. The borough is situated on a ridge of the Palisades and is home to several parks, businesses, and corporate headquarters. Closter’s economy is largely based on retail and services, and the borough is home to a diverse population. Closter is a great place to live and work, and it is a great example of a small town with a big heart.
Common Questions
What is Per Capita Income in Closter borough?
Per Capita income in Closter borough is $69,763.
What is the Median Family Income in Closter borough?
Median Family Income in Closter borough is $193,148.
What is the Median Household income in Closter borough?
Median Household Income in Closter borough is $181,652.
What is Income or Wage Gap in Closter borough?
Income or Wage Gap in Closter borough is 41.3%.
Women in Closter borough earn 58.7 cents for every dollar earned by a man.
What is Family Income Deficit in Closter borough?
Family Income Deficit in Closter borough is $11,585.
Families that are below poverty line in Closter borough earn $11,585 less on average than the poverty threshold level.
What is Inequality or Gini Index in Closter borough?
Inequality or Gini Index in Closter borough is 0.43.
What is the Total Population of Closter borough?
Total Population of Closter borough is 8,555.
What is the Total Male Population of Closter borough?
Total Male Population of Closter borough is 4,474.
What is the Total Female Population of Closter borough?
Total Female Population of Closter borough is 4,081.
What is the Ratio of Males per 100 Females in Closter borough?
There are 109.63 Males per 100 Females in Closter borough.
What is the Ratio of Females per 100 Males in Closter borough?
There are 91.22 Females per 100 Males in Closter borough.
What is the Median Population Age in Closter borough?
Median Population Age in Closter borough is 40.4 Years.
What is the Average Family Size in Closter borough
Average Family Size in Closter borough is 3.4 People.
What is the Average Household Size in Closter borough
Average Household Size in Closter borough is 3.1 People.
How Large is the Labor Force in Closter borough?
There are 4,621 People in the Labor Forcein in Closter borough.
What is the Percentage of People in the Labor Force in Closter borough?
70.8% of People are in the Labor Force in Closter borough.
What is the Unemployment Rate in Closter borough?
Unemployment Rate in Closter borough is 3.8%.