Sayreville borough, NJ Map & Demographics
Sayreville borough Overview
$43,127
PER CAPITA INCOME
$111,634
AVG FAMILY INCOME
$95,250
AVG HOUSEHOLD INCOME
26.6%
WAGE / INCOME GAP [ % ]
73.4¢/ $1
WAGE / INCOME GAP [ $ ]
0.38
INEQUALITY / GINI INDEX
45,136
TOTAL POPULATION
23,077
MALE POPULATION
22,059
FEMALE POPULATION
104.61
MALES / 100 FEMALES
95.59
FEMALES / 100 MALES
39.1
MEDIAN AGE
3.2
AVG FAMILY SIZE
2.7
AVG HOUSEHOLD SIZE
25,488
LABOR FORCE [ PEOPLE ]
69.6%
PERCENT IN LABOR FORCE
5.4%
UNEMPLOYMENT RATE
Income in Sayreville borough
Income Overview in Sayreville borough
Per Capita Income in Sayreville borough is $43,127, while median incomes of families and households are $111,634 and $95,250 respectively.
| Characteristic | Number | Measure |
| Per Capita Income | 45,136 | $43,127 |
| Median Family Income | 11,880 | $111,634 |
| Mean Family Income | 11,880 | $127,822 |
| Median Household Income | 16,851 | $95,250 |
| Mean Household Income | 16,851 | $114,197 |
| Income Deficit | 11,880 | $0 |
| Wage / Income Gap (%) | 45,136 | 26.64% |
| Wage / Income Gap ($) | 45,136 | 73.36¢ per $1 |
| Gini / Inequality Index | 45,136 | 0.38 |
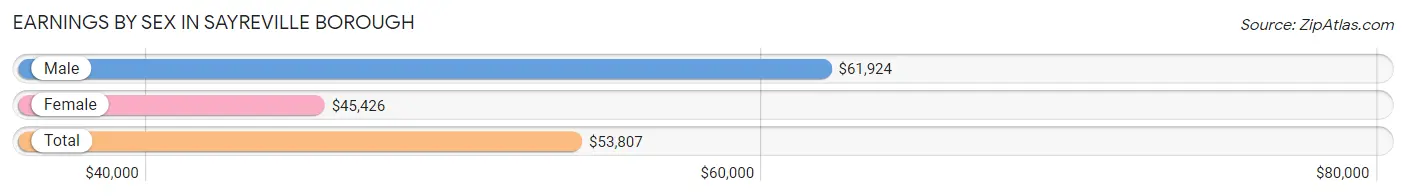
Earnings by Sex in Sayreville borough
Average Earnings in Sayreville borough are $53,807, $61,924 for men and $45,426 for women, a difference of 26.6%.
| Sex | Number | Average Earnings |
| Male | 14,374 (55.7%) | $61,924 |
| Female | 11,447 (44.3%) | $45,426 |
| Total | 25,821 (100.0%) | $53,807 |
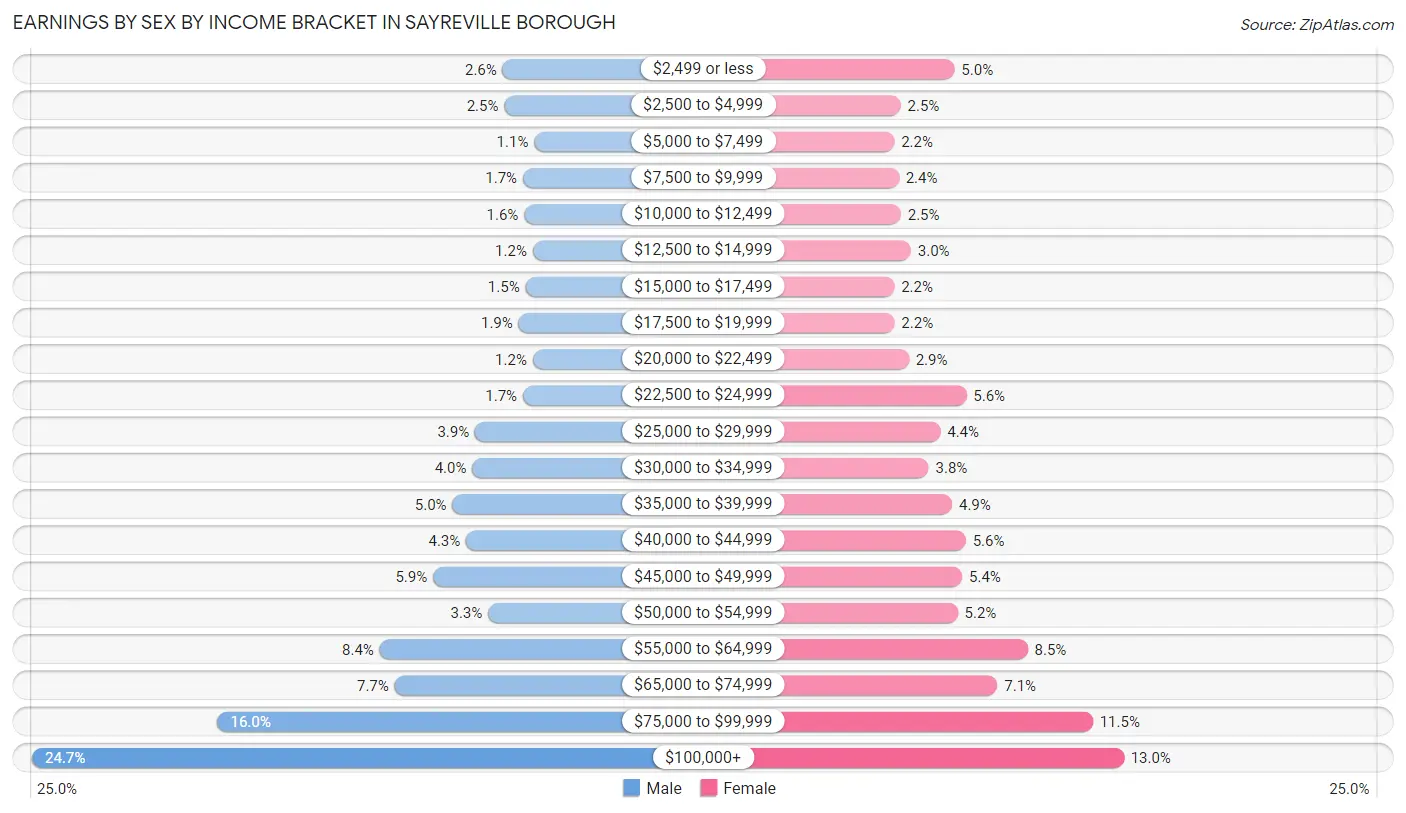
Earnings by Sex by Income Bracket in Sayreville borough
The most common earnings brackets in Sayreville borough are $100,000+ for men (3,543 | 24.6%) and $100,000+ for women (1,485 | 13.0%).
| Income | Male | Female |
| $2,499 or less | 375 (2.6%) | 577 (5.0%) |
| $2,500 to $4,999 | 363 (2.5%) | 289 (2.5%) |
| $5,000 to $7,499 | 162 (1.1%) | 254 (2.2%) |
| $7,500 to $9,999 | 239 (1.7%) | 278 (2.4%) |
| $10,000 to $12,499 | 230 (1.6%) | 290 (2.5%) |
| $12,500 to $14,999 | 172 (1.2%) | 343 (3.0%) |
| $15,000 to $17,499 | 222 (1.5%) | 254 (2.2%) |
| $17,500 to $19,999 | 267 (1.9%) | 255 (2.2%) |
| $20,000 to $22,499 | 173 (1.2%) | 332 (2.9%) |
| $22,500 to $24,999 | 238 (1.7%) | 641 (5.6%) |
| $25,000 to $29,999 | 561 (3.9%) | 501 (4.4%) |
| $30,000 to $34,999 | 579 (4.0%) | 438 (3.8%) |
| $35,000 to $39,999 | 713 (5.0%) | 564 (4.9%) |
| $40,000 to $44,999 | 621 (4.3%) | 638 (5.6%) |
| $45,000 to $49,999 | 844 (5.9%) | 618 (5.4%) |
| $50,000 to $54,999 | 473 (3.3%) | 594 (5.2%) |
| $55,000 to $64,999 | 1,203 (8.4%) | 970 (8.5%) |
| $65,000 to $74,999 | 1,102 (7.7%) | 807 (7.0%) |
| $75,000 to $99,999 | 2,294 (16.0%) | 1,319 (11.5%) |
| $100,000+ | 3,543 (24.6%) | 1,485 (13.0%) |
| Total | 14,374 (100.0%) | 11,447 (100.0%) |
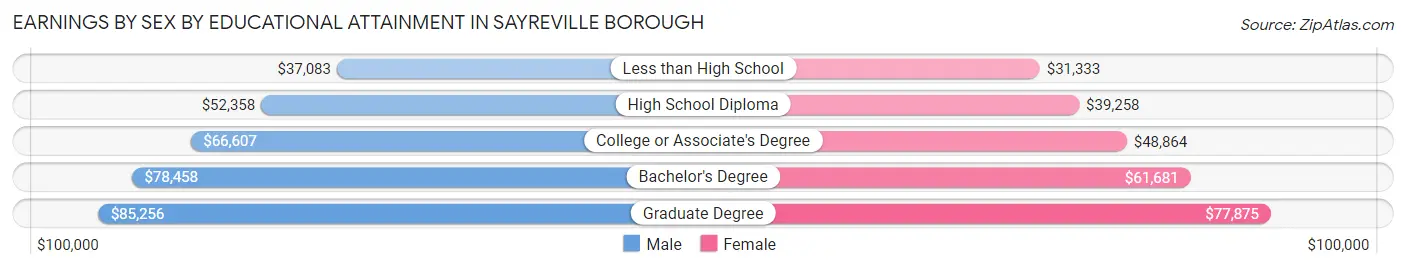
Earnings by Sex by Educational Attainment in Sayreville borough
Average earnings in Sayreville borough are $67,282 for men and $50,548 for women, a difference of 24.9%. Men with an educational attainment of graduate degree enjoy the highest average annual earnings of $85,256, while those with less than high school education earn the least with $37,083. Women with an educational attainment of graduate degree earn the most with the average annual earnings of $77,875, while those with less than high school education have the smallest earnings of $31,333.
| Educational Attainment | Male Income | Female Income |
| Less than High School | $37,083 | $31,333 |
| High School Diploma | $52,358 | $39,258 |
| College or Associate's Degree | $66,607 | $48,864 |
| Bachelor's Degree | $78,458 | $61,681 |
| Graduate Degree | $85,256 | $77,875 |
| Total | $67,282 | $50,548 |
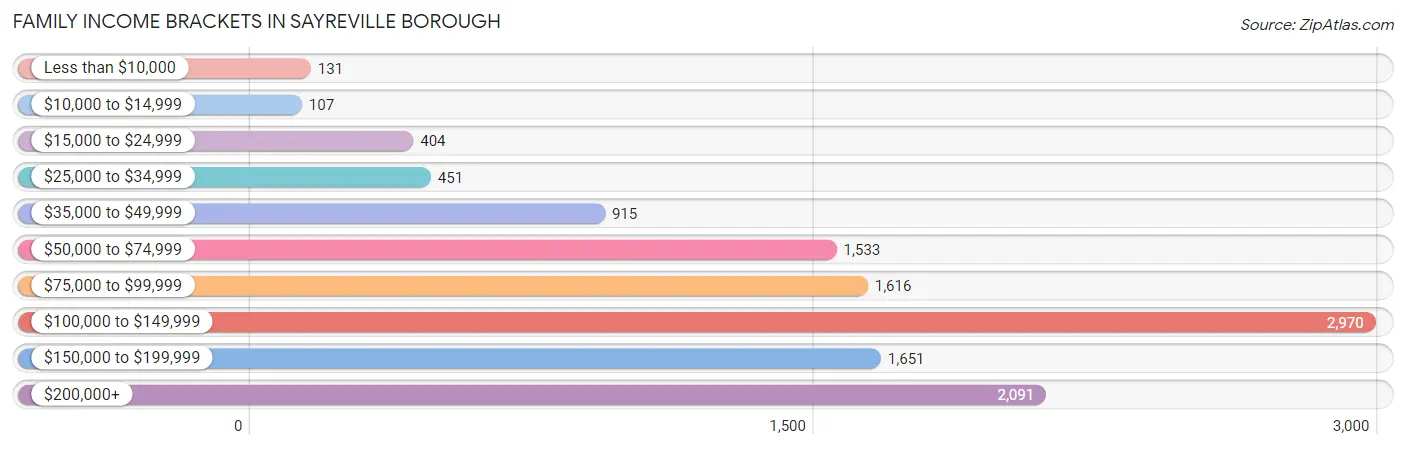
Family Income in Sayreville borough
Family Income Brackets in Sayreville borough
According to the Sayreville borough family income data, there are 2,970 families falling into the $100,000 to $149,999 income range, which is the most common income bracket and makes up 25.0% of all families. Conversely, the $10,000 to $14,999 income bracket is the least frequent group with only 107 families (0.9%) belonging to this category.
| Income Bracket | # Families | % Families |
| Less than $10,000 | 131 | 1.1% |
| $10,000 to $14,999 | 107 | 0.9% |
| $15,000 to $24,999 | 404 | 3.4% |
| $25,000 to $34,999 | 451 | 3.8% |
| $35,000 to $49,999 | 915 | 7.7% |
| $50,000 to $74,999 | 1,533 | 12.9% |
| $75,000 to $99,999 | 1,616 | 13.6% |
| $100,000 to $149,999 | 2,970 | 25.0% |
| $150,000 to $199,999 | 1,651 | 13.9% |
| $200,000+ | 2,091 | 17.6% |
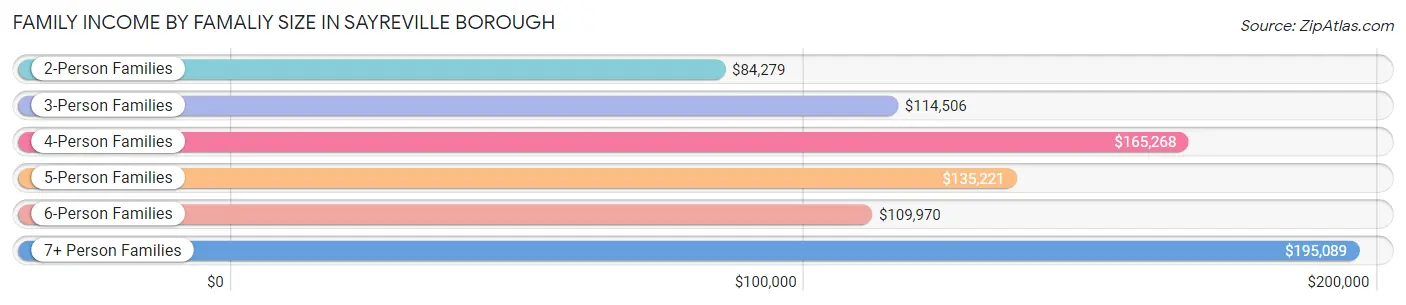
Family Income by Famaliy Size in Sayreville borough
7+ person families (209 | 1.8%) account for the highest median family income in Sayreville borough with $195,089 per family, while 2-person families (4,419 | 37.2%) have the highest median income of $42,140 per family member.
| Income Bracket | # Families | Median Income |
| 2-Person Families | 4,419 (37.2%) | $84,279 |
| 3-Person Families | 3,136 (26.4%) | $114,506 |
| 4-Person Families | 2,435 (20.5%) | $165,268 |
| 5-Person Families | 1,301 (11.0%) | $135,221 |
| 6-Person Families | 380 (3.2%) | $109,970 |
| 7+ Person Families | 209 (1.8%) | $195,089 |
| Total | 11,880 (100.0%) | $111,634 |
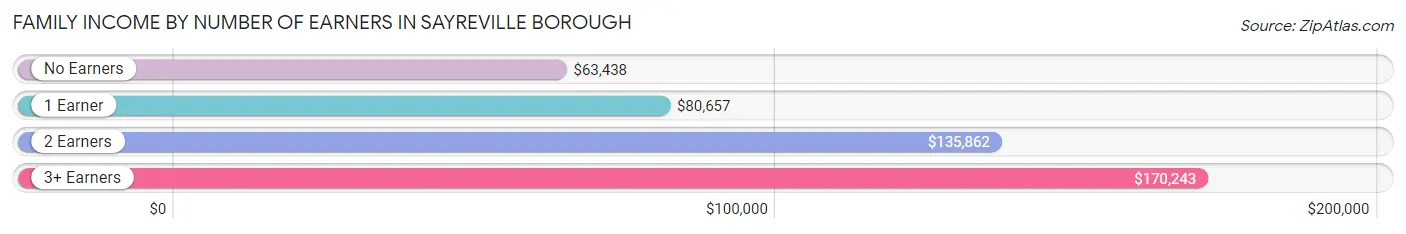
Family Income by Number of Earners in Sayreville borough
The median family income in Sayreville borough is $111,634, with families comprising 3+ earners (2,421) having the highest median family income of $170,243, while families with no earners (1,180) have the lowest median family income of $63,438, accounting for 20.4% and 9.9% of families, respectively.
| Number of Earners | # Families | Median Income |
| No Earners | 1,180 (9.9%) | $63,438 |
| 1 Earner | 3,641 (30.6%) | $80,657 |
| 2 Earners | 4,638 (39.0%) | $135,862 |
| 3+ Earners | 2,421 (20.4%) | $170,243 |
| Total | 11,880 (100.0%) | $111,634 |
Household Income in Sayreville borough
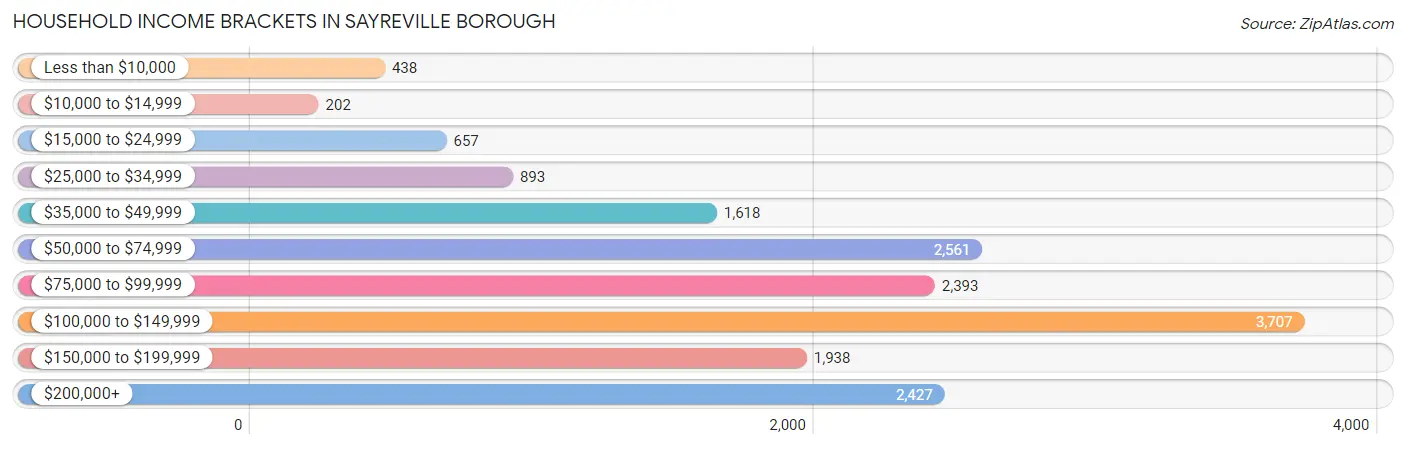
Household Income Brackets in Sayreville borough
With 3,707 households falling in the category, the $100,000 to $149,999 income range is the most frequent in Sayreville borough, accounting for 22.0% of all households. In contrast, only 202 households (1.2%) fall into the $10,000 to $14,999 income bracket, making it the least populous group.
| Income Bracket | # Households | % Households |
| Less than $10,000 | 438 | 2.6% |
| $10,000 to $14,999 | 202 | 1.2% |
| $15,000 to $24,999 | 657 | 3.9% |
| $25,000 to $34,999 | 893 | 5.3% |
| $35,000 to $49,999 | 1,618 | 9.6% |
| $50,000 to $74,999 | 2,561 | 15.2% |
| $75,000 to $99,999 | 2,393 | 14.2% |
| $100,000 to $149,999 | 3,707 | 22.0% |
| $150,000 to $199,999 | 1,938 | 11.5% |
| $200,000+ | 2,427 | 14.4% |
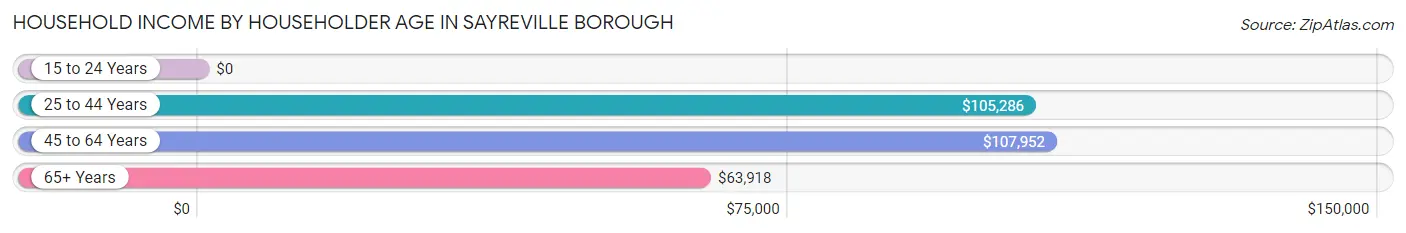
Household Income by Householder Age in Sayreville borough
The median household income in Sayreville borough is $95,250, with the highest median household income of $107,952 found in the 45 to 64 years age bracket for the primary householder. A total of 6,631 households (39.4%) fall into this category. Meanwhile, the 15 to 24 years age bracket for the primary householder has the lowest median household income of $0, with 112 households (0.7%) in this group.
| Income Bracket | # Households | Median Income |
| 15 to 24 Years | 112 (0.7%) | $0 |
| 25 to 44 Years | 6,019 (35.7%) | $105,286 |
| 45 to 64 Years | 6,631 (39.4%) | $107,952 |
| 65+ Years | 4,089 (24.3%) | $63,918 |
| Total | 16,851 (100.0%) | $95,250 |
Poverty in Sayreville borough
Income Below Poverty by Sex and Age in Sayreville borough
With 4.9% poverty level for males and 5.8% for females among the residents of Sayreville borough, 75 year old and over males and 15 year old females are the most vulnerable to poverty, with 185 males (19.0%) and 39 females (28.3%) in their respective age groups living below the poverty level.
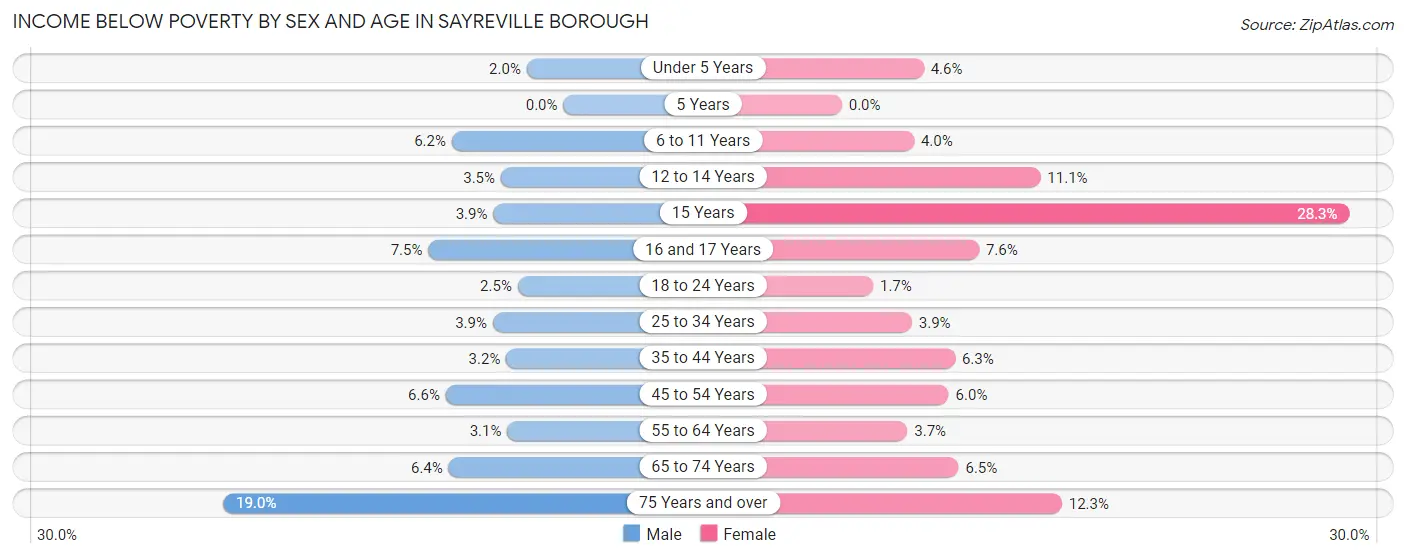
| Age Bracket | Male | Female |
| Under 5 Years | 31 (2.0%) | 51 (4.6%) |
| 5 Years | 0 (0.0%) | 0 (0.0%) |
| 6 to 11 Years | 96 (6.2%) | 54 (4.0%) |
| 12 to 14 Years | 27 (3.5%) | 127 (11.1%) |
| 15 Years | 18 (3.9%) | 39 (28.3%) |
| 16 and 17 Years | 31 (7.5%) | 57 (7.6%) |
| 18 to 24 Years | 40 (2.5%) | 28 (1.7%) |
| 25 to 34 Years | 145 (3.9%) | 112 (3.9%) |
| 35 to 44 Years | 110 (3.2%) | 209 (6.3%) |
| 45 to 54 Years | 229 (6.6%) | 183 (5.9%) |
| 55 to 64 Years | 87 (3.1%) | 108 (3.6%) |
| 65 to 74 Years | 139 (6.4%) | 134 (6.5%) |
| 75 Years and over | 185 (19.0%) | 170 (12.2%) |
| Total | 1,138 (4.9%) | 1,272 (5.8%) |
Income Above Poverty by Sex and Age in Sayreville borough
According to the poverty statistics in Sayreville borough, males aged 5 years and females aged 5 years are the age groups that are most secure financially, with 100.0% of males and 100.0% of females in these age groups living above the poverty line.
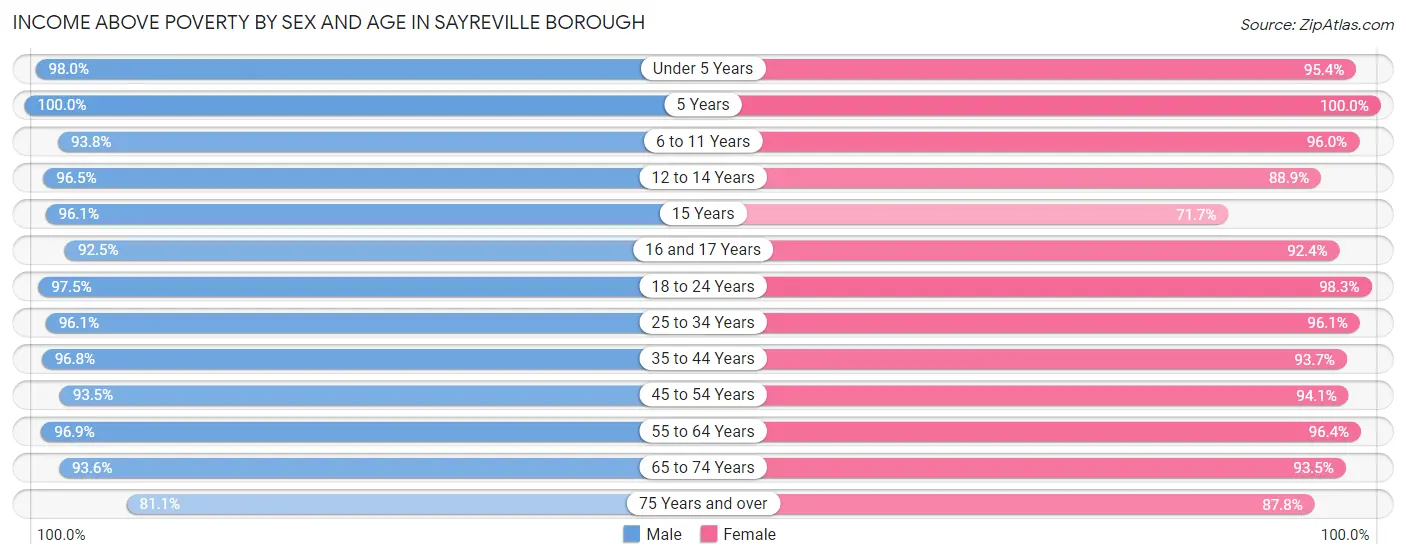
| Age Bracket | Male | Female |
| Under 5 Years | 1,491 (98.0%) | 1,067 (95.4%) |
| 5 Years | 177 (100.0%) | 267 (100.0%) |
| 6 to 11 Years | 1,449 (93.8%) | 1,290 (96.0%) |
| 12 to 14 Years | 748 (96.5%) | 1,021 (88.9%) |
| 15 Years | 444 (96.1%) | 99 (71.7%) |
| 16 and 17 Years | 381 (92.5%) | 689 (92.4%) |
| 18 to 24 Years | 1,537 (97.5%) | 1,584 (98.3%) |
| 25 to 34 Years | 3,547 (96.1%) | 2,760 (96.1%) |
| 35 to 44 Years | 3,353 (96.8%) | 3,109 (93.7%) |
| 45 to 54 Years | 3,269 (93.4%) | 2,895 (94.1%) |
| 55 to 64 Years | 2,703 (96.9%) | 2,851 (96.4%) |
| 65 to 74 Years | 2,037 (93.6%) | 1,929 (93.5%) |
| 75 Years and over | 791 (81.0%) | 1,218 (87.7%) |
| Total | 21,927 (95.1%) | 20,779 (94.2%) |
Income Below Poverty Among Married-Couple Families in Sayreville borough
The poverty statistics for married-couple families in Sayreville borough show that 3.9% or 336 of the total 8,618 families live below the poverty line. Families with 1 or 2 children have the highest poverty rate of 4.3%, comprising of 151 families. On the other hand, families with 3 or 4 children have the lowest poverty rate of 0.9%, which includes 6 families.
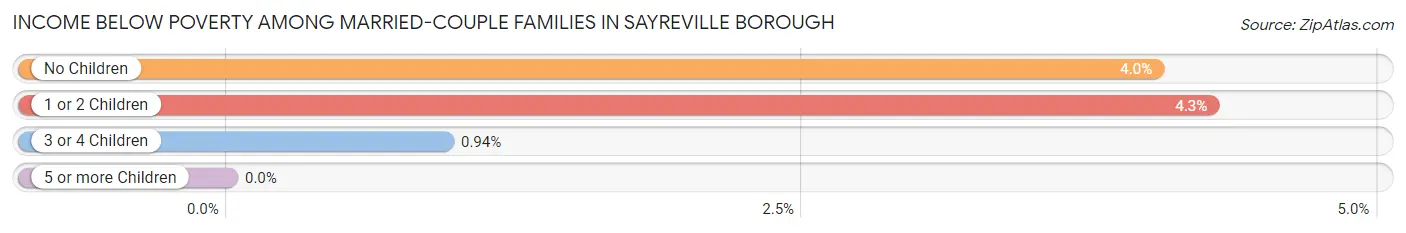
| Children | Above Poverty | Below Poverty |
| No Children | 4,263 (96.0%) | 179 (4.0%) |
| 1 or 2 Children | 3,385 (95.7%) | 151 (4.3%) |
| 3 or 4 Children | 634 (99.1%) | 6 (0.9%) |
| 5 or more Children | 0 (0.0%) | 0 (0.0%) |
| Total | 8,282 (96.1%) | 336 (3.9%) |
Income Below Poverty Among Single-Parent Households in Sayreville borough
According to the poverty data in Sayreville borough, 2.9% or 35 single-father households and 7.1% or 148 single-mother households are living below the poverty line. Among single-father households, those with 1 or 2 children have the highest poverty rate, with 35 households (7.2%) experiencing poverty. Likewise, among single-mother households, those with 3 or 4 children have the highest poverty rate, with 15 households (33.3%) falling below the poverty line.
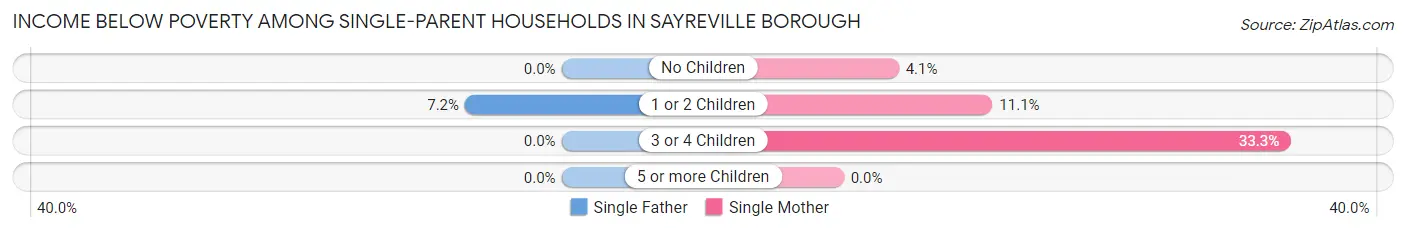
| Children | Single Father | Single Mother |
| No Children | 0 (0.0%) | 54 (4.1%) |
| 1 or 2 Children | 35 (7.2%) | 79 (11.1%) |
| 3 or 4 Children | 0 (0.0%) | 15 (33.3%) |
| 5 or more Children | 0 (0.0%) | 0 (0.0%) |
| Total | 35 (2.9%) | 148 (7.1%) |
Income Below Poverty Among Married-Couple vs Single-Parent Households in Sayreville borough
The poverty data for Sayreville borough shows that 336 of the married-couple family households (3.9%) and 183 of the single-parent households (5.6%) are living below the poverty level. Within the married-couple family households, those with 1 or 2 children have the highest poverty rate, with 151 households (4.3%) falling below the poverty line. Among the single-parent households, those with 3 or 4 children have the highest poverty rate, with 15 household (11.6%) living below poverty.
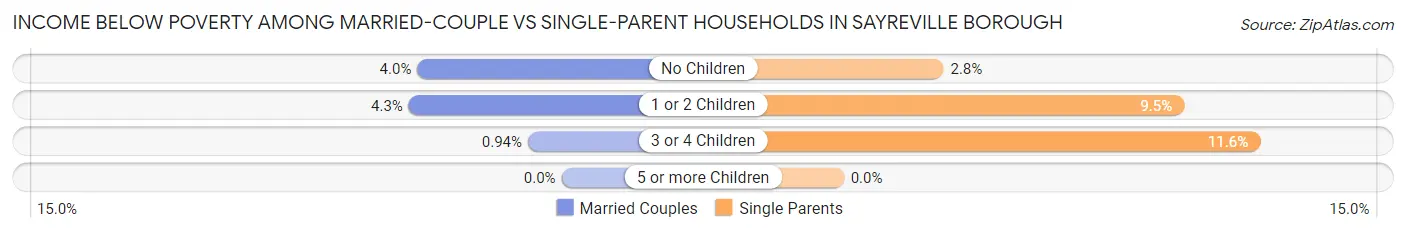
| Children | Married-Couple Families | Single-Parent Households |
| No Children | 179 (4.0%) | 54 (2.8%) |
| 1 or 2 Children | 151 (4.3%) | 114 (9.5%) |
| 3 or 4 Children | 6 (0.9%) | 15 (11.6%) |
| 5 or more Children | 0 (0.0%) | 0 (0.0%) |
| Total | 336 (3.9%) | 183 (5.6%) |
Race in Sayreville borough
The most populous races in Sayreville borough are White / Caucasian (25,298 | 56.0%), Hispanic or Latino (9,112 | 20.2%), and Asian (7,786 | 17.2%).
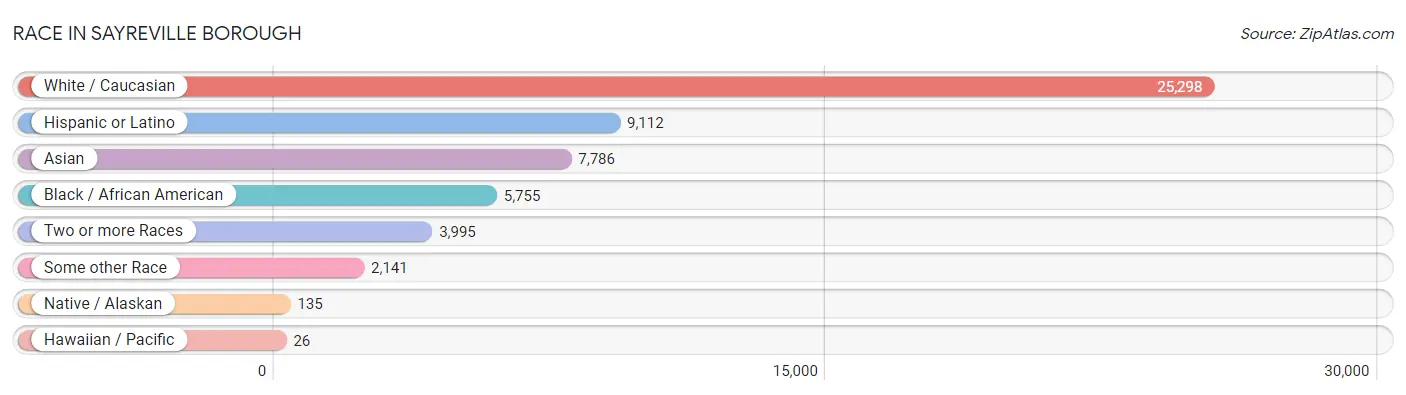
| Race | # Population | % Population |
| Asian | 7,786 | 17.2% |
| Black / African American | 5,755 | 12.8% |
| Hawaiian / Pacific | 26 | 0.1% |
| Hispanic or Latino | 9,112 | 20.2% |
| Native / Alaskan | 135 | 0.3% |
| White / Caucasian | 25,298 | 56.0% |
| Two or more Races | 3,995 | 8.8% |
| Some other Race | 2,141 | 4.7% |
| Total | 45,136 | 100.0% |
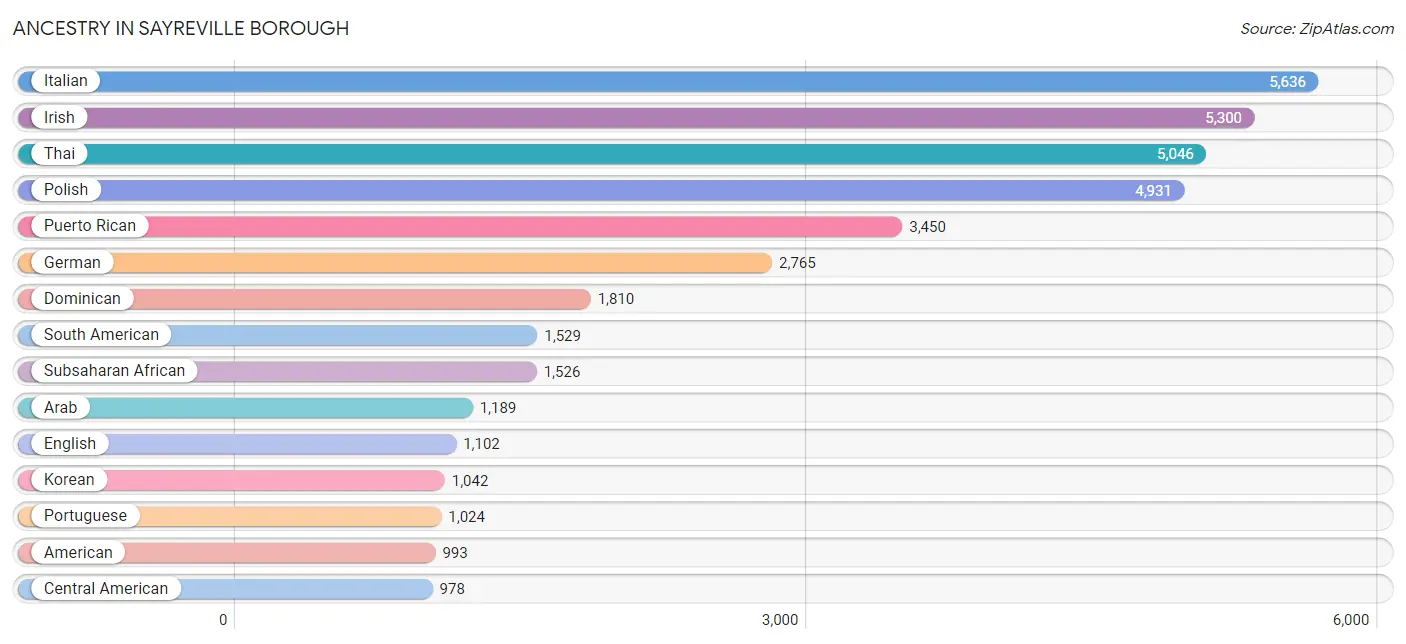
Ancestry in Sayreville borough
The most populous ancestries reported in Sayreville borough are Italian (5,636 | 12.5%), Irish (5,300 | 11.7%), Thai (5,046 | 11.2%), Polish (4,931 | 10.9%), and Puerto Rican (3,450 | 7.6%), together accounting for 54.0% of all Sayreville borough residents.
| Ancestry | # Population | % Population |
| African | 764 | 1.7% |
| American | 993 | 2.2% |
| Arab | 1,189 | 2.6% |
| Argentinean | 361 | 0.8% |
| Armenian | 14 | 0.0% |
| Austrian | 125 | 0.3% |
| Barbadian | 11 | 0.0% |
| Basque | 33 | 0.1% |
| Belgian | 15 | 0.0% |
| Bhutanese | 33 | 0.1% |
| Bolivian | 38 | 0.1% |
| Brazilian | 549 | 1.2% |
| British | 21 | 0.1% |
| British West Indian | 21 | 0.1% |
| Burmese | 260 | 0.6% |
| Canadian | 4 | 0.0% |
| Central American | 978 | 2.2% |
| Central American Indian | 83 | 0.2% |
| Cherokee | 24 | 0.1% |
| Chilean | 43 | 0.1% |
| Colombian | 326 | 0.7% |
| Costa Rican | 13 | 0.0% |
| Croatian | 21 | 0.1% |
| Cuban | 322 | 0.7% |
| Czech | 75 | 0.2% |
| Czechoslovakian | 92 | 0.2% |
| Danish | 98 | 0.2% |
| Dominican | 1,810 | 4.0% |
| Dutch | 67 | 0.2% |
| Eastern European | 196 | 0.4% |
| Ecuadorian | 157 | 0.4% |
| Egyptian | 810 | 1.8% |
| English | 1,102 | 2.4% |
| Estonian | 27 | 0.1% |
| European | 556 | 1.2% |
| Filipino | 14 | 0.0% |
| Finnish | 17 | 0.0% |
| French | 132 | 0.3% |
| French Canadian | 31 | 0.1% |
| German | 2,765 | 6.1% |
| German Russian | 16 | 0.0% |
| Ghanaian | 333 | 0.7% |
| Greek | 323 | 0.7% |
| Guatemalan | 43 | 0.1% |
| Guyanese | 66 | 0.2% |
| Haitian | 153 | 0.3% |
| Honduran | 533 | 1.2% |
| Hungarian | 499 | 1.1% |
| Indian (Asian) | 538 | 1.2% |
| Irish | 5,300 | 11.7% |
| Israeli | 10 | 0.0% |
| Italian | 5,636 | 12.5% |
| Jamaican | 438 | 1.0% |
| Jordanian | 26 | 0.1% |
| Kenyan | 63 | 0.1% |
| Korean | 1,042 | 2.3% |
| Lebanese | 42 | 0.1% |
| Lithuanian | 47 | 0.1% |
| Maltese | 16 | 0.0% |
| Mexican | 375 | 0.8% |
| Mexican American Indian | 39 | 0.1% |
| Moroccan | 83 | 0.2% |
| Navajo | 76 | 0.2% |
| Nicaraguan | 53 | 0.1% |
| Nigerian | 201 | 0.4% |
| Norwegian | 37 | 0.1% |
| Pakistani | 14 | 0.0% |
| Palestinian | 28 | 0.1% |
| Panamanian | 193 | 0.4% |
| Paraguayan | 24 | 0.1% |
| Peruvian | 253 | 0.6% |
| Polish | 4,931 | 10.9% |
| Portuguese | 1,024 | 2.3% |
| Puerto Rican | 3,450 | 7.6% |
| Romanian | 48 | 0.1% |
| Russian | 600 | 1.3% |
| Salvadoran | 143 | 0.3% |
| Samoan | 38 | 0.1% |
| Scotch-Irish | 70 | 0.2% |
| Scottish | 73 | 0.2% |
| Slavic | 21 | 0.1% |
| Slovak | 219 | 0.5% |
| South American | 1,529 | 3.4% |
| South American Indian | 18 | 0.0% |
| Spaniard | 38 | 0.1% |
| Spanish | 268 | 0.6% |
| Sri Lankan | 73 | 0.2% |
| Subsaharan African | 1,526 | 3.4% |
| Swedish | 52 | 0.1% |
| Syrian | 15 | 0.0% |
| Thai | 5,046 | 11.2% |
| Trinidadian and Tobagonian | 172 | 0.4% |
| Turkish | 8 | 0.0% |
| Ukrainian | 205 | 0.4% |
| Uruguayan | 30 | 0.1% |
| Venezuelan | 297 | 0.7% |
| Vietnamese | 63 | 0.1% |
| Welsh | 28 | 0.1% |
| West Indian | 398 | 0.9% |
| Zimbabwean | 7 | 0.0% | View All 100 Rows |
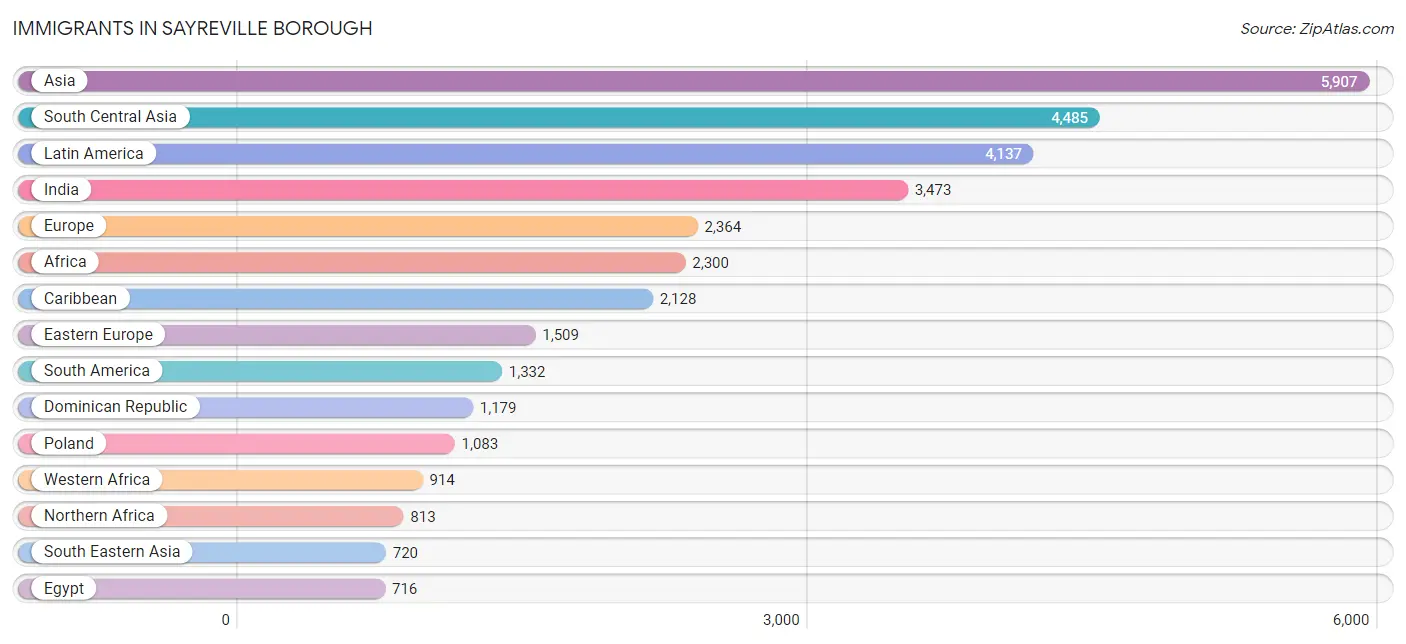
Immigrants in Sayreville borough
The most numerous immigrant groups reported in Sayreville borough came from Asia (5,907 | 13.1%), South Central Asia (4,485 | 9.9%), Latin America (4,137 | 9.2%), India (3,473 | 7.7%), and Europe (2,364 | 5.2%), together accounting for 45.1% of all Sayreville borough residents.
| Immigration Origin | # Population | % Population |
| Africa | 2,300 | 5.1% |
| Argentina | 143 | 0.3% |
| Asia | 5,907 | 13.1% |
| Bahamas | 28 | 0.1% |
| Bangladesh | 182 | 0.4% |
| Barbados | 11 | 0.0% |
| Belarus | 15 | 0.0% |
| Bolivia | 4 | 0.0% |
| Brazil | 411 | 0.9% |
| Canada | 29 | 0.1% |
| Caribbean | 2,128 | 4.7% |
| Central America | 677 | 1.5% |
| Chile | 15 | 0.0% |
| China | 256 | 0.6% |
| Colombia | 119 | 0.3% |
| Costa Rica | 123 | 0.3% |
| Cuba | 49 | 0.1% |
| Czechoslovakia | 76 | 0.2% |
| Dominica | 314 | 0.7% |
| Dominican Republic | 1,179 | 2.6% |
| Eastern Africa | 510 | 1.1% |
| Eastern Asia | 441 | 1.0% |
| Eastern Europe | 1,509 | 3.3% |
| Ecuador | 30 | 0.1% |
| Egypt | 716 | 1.6% |
| El Salvador | 51 | 0.1% |
| England | 84 | 0.2% |
| Europe | 2,364 | 5.2% |
| France | 22 | 0.1% |
| Germany | 34 | 0.1% |
| Ghana | 412 | 0.9% |
| Greece | 58 | 0.1% |
| Grenada | 10 | 0.0% |
| Guatemala | 20 | 0.0% |
| Guyana | 180 | 0.4% |
| Haiti | 98 | 0.2% |
| Honduras | 316 | 0.7% |
| Hong Kong | 40 | 0.1% |
| Hungary | 54 | 0.1% |
| India | 3,473 | 7.7% |
| Ireland | 24 | 0.1% |
| Israel | 18 | 0.0% |
| Italy | 119 | 0.3% |
| Jamaica | 233 | 0.5% |
| Japan | 29 | 0.1% |
| Jordan | 69 | 0.2% |
| Kenya | 459 | 1.0% |
| Korea | 156 | 0.4% |
| Kuwait | 34 | 0.1% |
| Latin America | 4,137 | 9.2% |
| Lebanon | 22 | 0.1% |
| Liberia | 91 | 0.2% |
| Malaysia | 29 | 0.1% |
| Mexico | 107 | 0.2% |
| Moldova | 20 | 0.0% |
| Morocco | 60 | 0.1% |
| Nepal | 190 | 0.4% |
| Nicaragua | 36 | 0.1% |
| Nigeria | 198 | 0.4% |
| Northern Africa | 813 | 1.8% |
| Northern Europe | 143 | 0.3% |
| Pakistan | 566 | 1.3% |
| Panama | 24 | 0.1% |
| Peru | 145 | 0.3% |
| Philippines | 632 | 1.4% |
| Poland | 1,083 | 2.4% |
| Portugal | 446 | 1.0% |
| Romania | 16 | 0.0% |
| Russia | 55 | 0.1% |
| Saudi Arabia | 32 | 0.1% |
| Sierra Leone | 96 | 0.2% |
| Singapore | 6 | 0.0% |
| South Africa | 15 | 0.0% |
| South America | 1,332 | 2.9% |
| South Central Asia | 4,485 | 9.9% |
| South Eastern Asia | 720 | 1.6% |
| Southern Europe | 630 | 1.4% |
| Sri Lanka | 39 | 0.1% |
| Sudan | 19 | 0.0% |
| Syria | 33 | 0.1% |
| Taiwan | 14 | 0.0% |
| Trinidad and Tobago | 169 | 0.4% |
| Turkey | 3 | 0.0% |
| Uganda | 44 | 0.1% |
| Ukraine | 174 | 0.4% |
| Uruguay | 17 | 0.0% |
| Uzbekistan | 35 | 0.1% |
| Venezuela | 244 | 0.5% |
| Vietnam | 53 | 0.1% |
| West Indies | 21 | 0.1% |
| Western Africa | 914 | 2.0% |
| Western Asia | 218 | 0.5% |
| Western Europe | 56 | 0.1% |
| Yemen | 7 | 0.0% |
| Zimbabwe | 7 | 0.0% | View All 95 Rows |
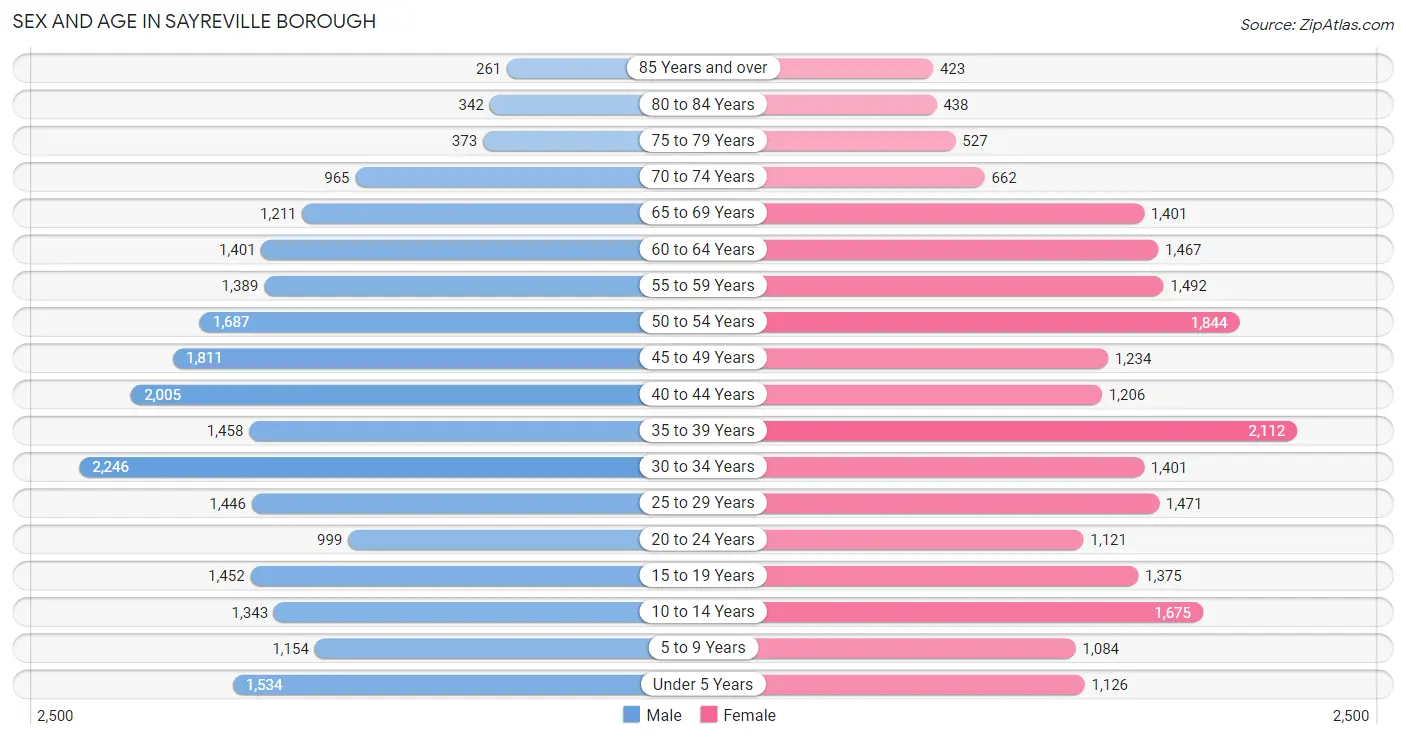
Sex and Age in Sayreville borough
Sex and Age in Sayreville borough
The most populous age groups in Sayreville borough are 30 to 34 Years (2,246 | 9.7%) for men and 35 to 39 Years (2,112 | 9.6%) for women.
| Age Bracket | Male | Female |
| Under 5 Years | 1,534 (6.7%) | 1,126 (5.1%) |
| 5 to 9 Years | 1,154 (5.0%) | 1,084 (4.9%) |
| 10 to 14 Years | 1,343 (5.8%) | 1,675 (7.6%) |
| 15 to 19 Years | 1,452 (6.3%) | 1,375 (6.2%) |
| 20 to 24 Years | 999 (4.3%) | 1,121 (5.1%) |
| 25 to 29 Years | 1,446 (6.3%) | 1,471 (6.7%) |
| 30 to 34 Years | 2,246 (9.7%) | 1,401 (6.4%) |
| 35 to 39 Years | 1,458 (6.3%) | 2,112 (9.6%) |
| 40 to 44 Years | 2,005 (8.7%) | 1,206 (5.5%) |
| 45 to 49 Years | 1,811 (7.9%) | 1,234 (5.6%) |
| 50 to 54 Years | 1,687 (7.3%) | 1,844 (8.4%) |
| 55 to 59 Years | 1,389 (6.0%) | 1,492 (6.8%) |
| 60 to 64 Years | 1,401 (6.1%) | 1,467 (6.7%) |
| 65 to 69 Years | 1,211 (5.2%) | 1,401 (6.4%) |
| 70 to 74 Years | 965 (4.2%) | 662 (3.0%) |
| 75 to 79 Years | 373 (1.6%) | 527 (2.4%) |
| 80 to 84 Years | 342 (1.5%) | 438 (2.0%) |
| 85 Years and over | 261 (1.1%) | 423 (1.9%) |
| Total | 23,077 (100.0%) | 22,059 (100.0%) |
Families and Households in Sayreville borough
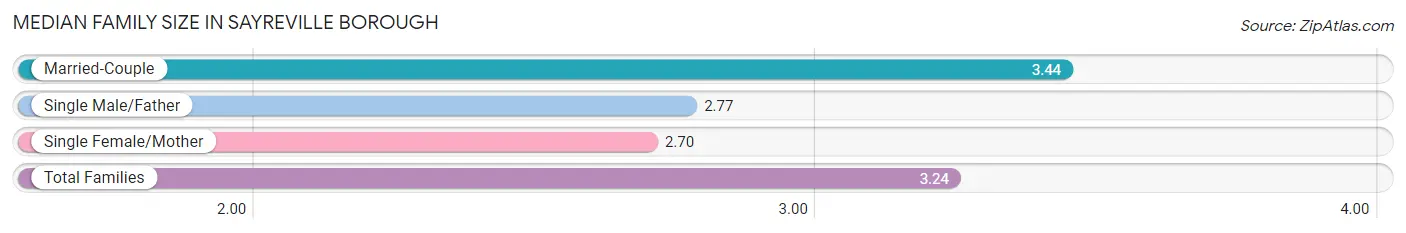
Median Family Size in Sayreville borough
The median family size in Sayreville borough is 3.24 persons per family, with married-couple families (8,618 | 72.5%) accounting for the largest median family size of 3.44 persons per family. On the other hand, single female/mother families (2,076 | 17.5%) represent the smallest median family size with 2.70 persons per family.
| Family Type | # Families | Family Size |
| Married-Couple | 8,618 (72.5%) | 3.44 |
| Single Male/Father | 1,186 (10.0%) | 2.77 |
| Single Female/Mother | 2,076 (17.5%) | 2.70 |
| Total Families | 11,880 (100.0%) | 3.24 |
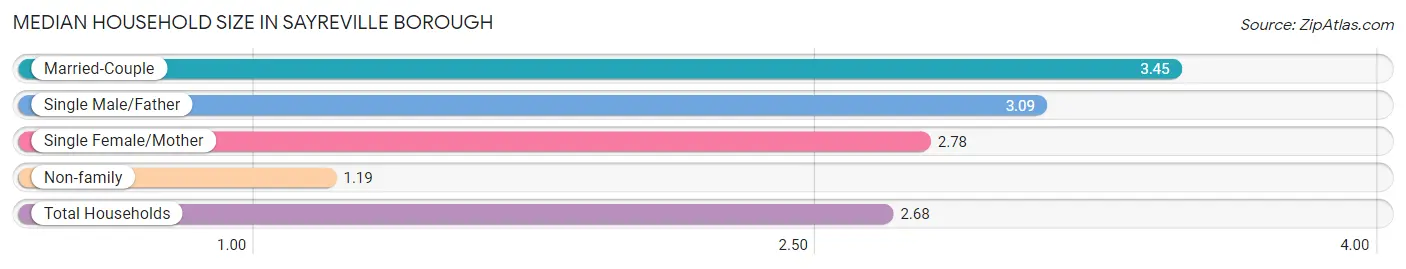
Median Household Size in Sayreville borough
The median household size in Sayreville borough is 2.68 persons per household, with married-couple households (8,618 | 51.1%) accounting for the largest median household size of 3.45 persons per household. non-family households (4,971 | 29.5%) represent the smallest median household size with 1.19 persons per household.
| Household Type | # Households | Household Size |
| Married-Couple | 8,618 (51.1%) | 3.45 |
| Single Male/Father | 1,186 (7.0%) | 3.09 |
| Single Female/Mother | 2,076 (12.3%) | 2.78 |
| Non-family | 4,971 (29.5%) | 1.19 |
| Total Households | 16,851 (100.0%) | 2.68 |
Household Size by Marriage Status in Sayreville borough
Out of a total of 16,851 households in Sayreville borough, 11,880 (70.5%) are family households, while 4,971 (29.5%) are nonfamily households. The most numerous type of family households are 2-person households, comprising 4,185, and the most common type of nonfamily households are 1-person households, comprising 4,203.
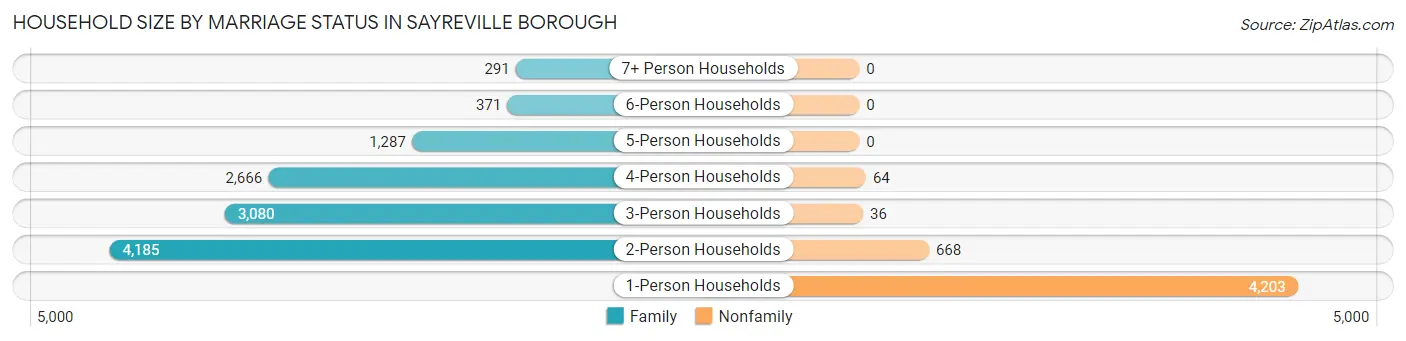
| Household Size | Family Households | Nonfamily Households |
| 1-Person Households | - | 4,203 (24.9%) |
| 2-Person Households | 4,185 (24.8%) | 668 (4.0%) |
| 3-Person Households | 3,080 (18.3%) | 36 (0.2%) |
| 4-Person Households | 2,666 (15.8%) | 64 (0.4%) |
| 5-Person Households | 1,287 (7.6%) | 0 (0.0%) |
| 6-Person Households | 371 (2.2%) | 0 (0.0%) |
| 7+ Person Households | 291 (1.7%) | 0 (0.0%) |
| Total | 11,880 (70.5%) | 4,971 (29.5%) |
Female Fertility in Sayreville borough
Fertility by Age in Sayreville borough
Average fertility rate in Sayreville borough is 50.0 births per 1,000 women. Women in the age bracket of 20 to 34 years have the highest fertility rate with 72.0 births per 1,000 women. Women in the age bracket of 20 to 34 years acount for 55.1% of all women with births.
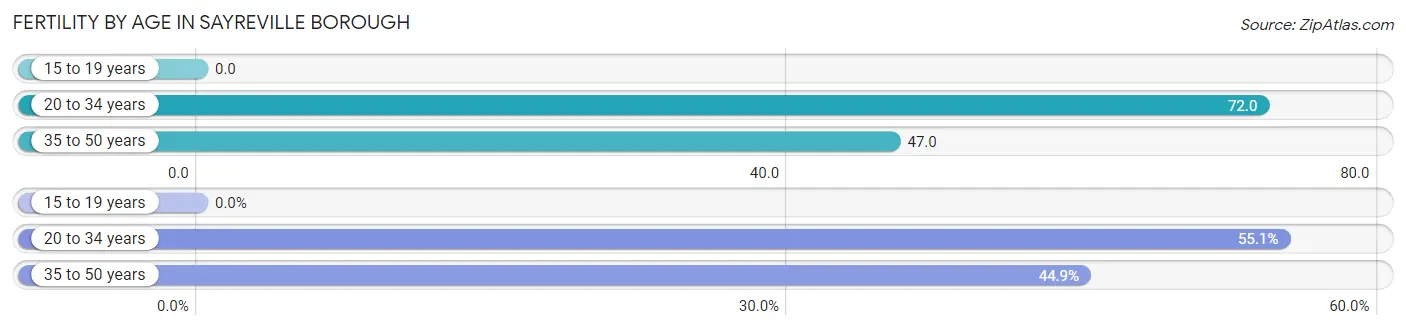
| Age Bracket | Women with Births | Births / 1,000 Women |
| 15 to 19 years | 0 (0.0%) | 0.0 |
| 20 to 34 years | 288 (55.1%) | 72.0 |
| 35 to 50 years | 235 (44.9%) | 47.0 |
| Total | 523 (100.0%) | 50.0 |
Fertility by Age by Marriage Status in Sayreville borough
95.4% of women with births (523) in Sayreville borough are married. The highest percentage of unmarried women with births falls into 35 to 50 years age bracket with 10.2% of them unmarried at the time of birth, while the lowest percentage of unmarried women with births belong to 20 to 34 years age bracket with 0.0% of them unmarried.
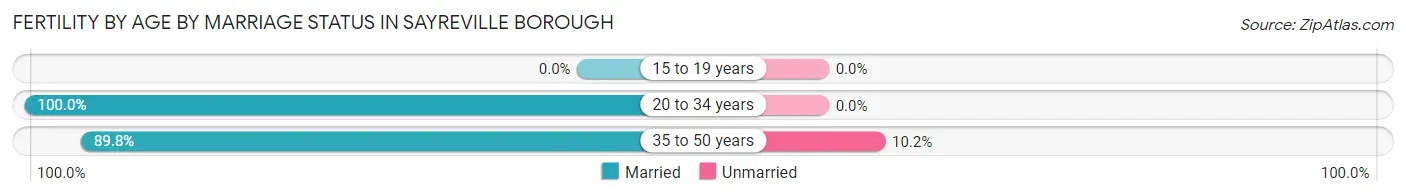
| Age Bracket | Married | Unmarried |
| 15 to 19 years | 0 (0.0%) | 0 (0.0%) |
| 20 to 34 years | 288 (100.0%) | 0 (0.0%) |
| 35 to 50 years | 211 (89.8%) | 24 (10.2%) |
| Total | 499 (95.4%) | 24 (4.6%) |
Fertility by Education in Sayreville borough
Average fertility rate in Sayreville borough is 50.0 births per 1,000 women. Women with the education attainment of bachelor's degree have the highest fertility rate of 90.0 births per 1,000 women, while women with the education attainment of less than high school have the lowest fertility at 20.0 births per 1,000 women. Women with the education attainment of bachelor's degree represent 53.1% of all women with births.
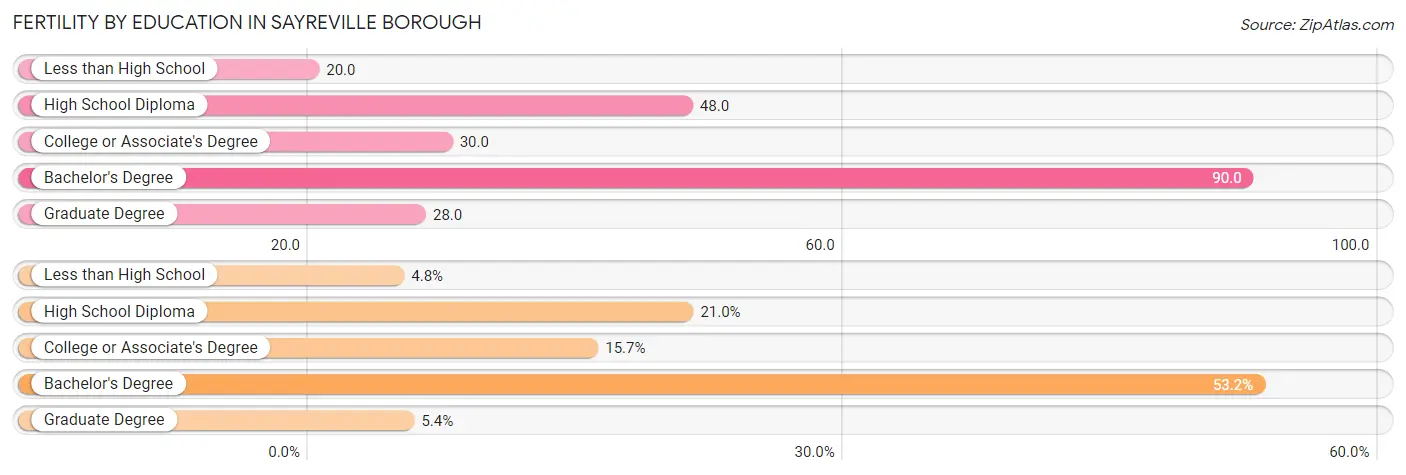
| Educational Attainment | Women with Births | Births / 1,000 Women |
| Less than High School | 25 (4.8%) | 20.0 |
| High School Diploma | 110 (21.0%) | 48.0 |
| College or Associate's Degree | 82 (15.7%) | 30.0 |
| Bachelor's Degree | 278 (53.1%) | 90.0 |
| Graduate Degree | 28 (5.3%) | 28.0 |
| Total | 523 (100.0%) | 50.0 |
Fertility by Education by Marriage Status in Sayreville borough
4.6% of women with births in Sayreville borough are unmarried. Women with the educational attainment of high school diploma are most likely to be married with 100.0% of them married at childbirth, while women with the educational attainment of less than high school are least likely to be married with 8.0% of them unmarried at childbirth.
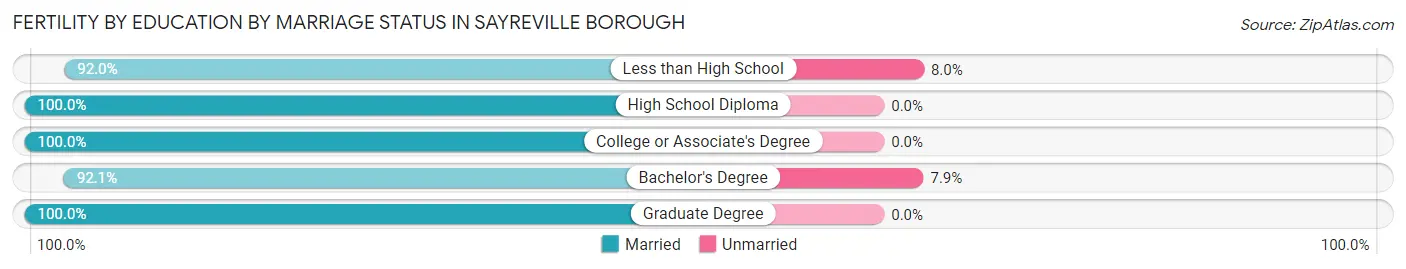
| Educational Attainment | Married | Unmarried |
| Less than High School | 23 (92.0%) | 2 (8.0%) |
| High School Diploma | 110 (100.0%) | 0 (0.0%) |
| College or Associate's Degree | 82 (100.0%) | 0 (0.0%) |
| Bachelor's Degree | 256 (92.1%) | 22 (7.9%) |
| Graduate Degree | 28 (100.0%) | 0 (0.0%) |
| Total | 499 (95.4%) | 24 (4.6%) |
Employment Characteristics in Sayreville borough
Employment by Class of Employer in Sayreville borough
Among the 23,461 employed individuals in Sayreville borough, private company employees (16,944 | 72.2%), local government employees (2,079 | 8.9%), and not-for-profit organizations (1,118 | 4.8%) make up the most common classes of employment.
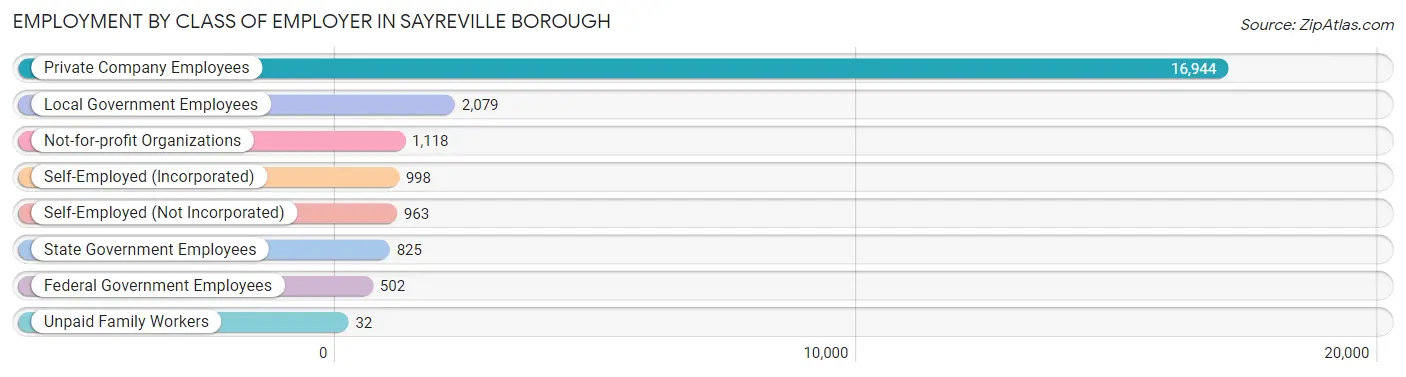
| Employer Class | # Employees | % Employees |
| Private Company Employees | 16,944 | 72.2% |
| Self-Employed (Incorporated) | 998 | 4.3% |
| Self-Employed (Not Incorporated) | 963 | 4.1% |
| Not-for-profit Organizations | 1,118 | 4.8% |
| Local Government Employees | 2,079 | 8.9% |
| State Government Employees | 825 | 3.5% |
| Federal Government Employees | 502 | 2.1% |
| Unpaid Family Workers | 32 | 0.1% |
| Total | 23,461 | 100.0% |
Employment Status by Age in Sayreville borough
According to the labor force statistics for Sayreville borough, out of the total population over 16 years of age (36,620), 69.6% or 25,488 individuals are in the labor force, with 5.4% or 1,376 of them unemployed. The age group with the highest labor force participation rate is 30 to 34 years, with 92.3% or 3,366 individuals in the labor force. Within the labor force, the 65 to 74 years age range has the highest percentage of unemployed individuals, with 8.9% or 108 of them being unemployed.
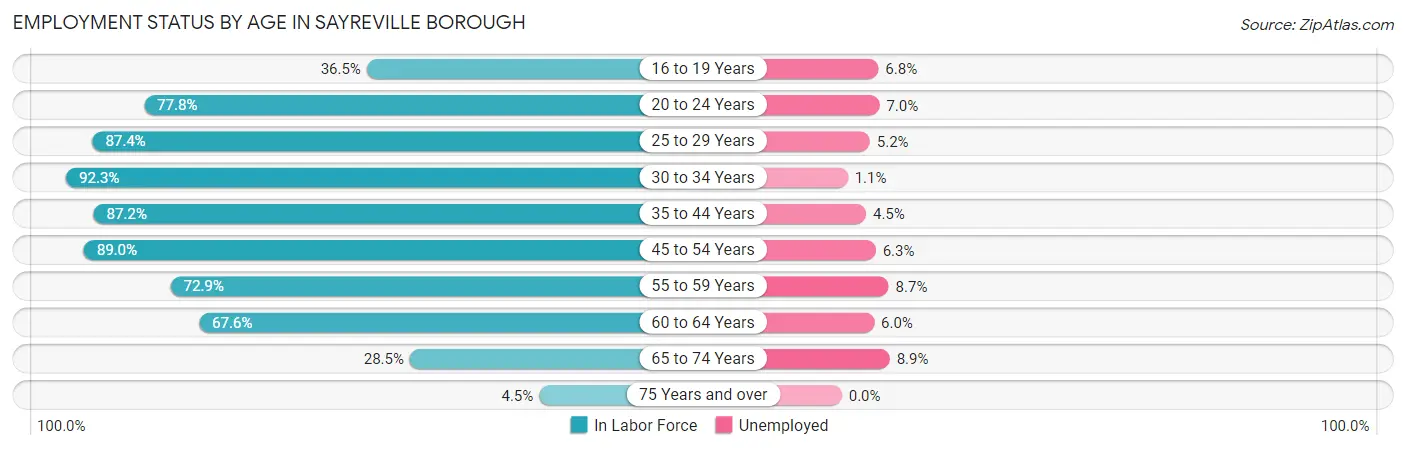
| Age Bracket | In Labor Force | Unemployed |
| 16 to 19 Years | 813 (36.5%) | 55 (6.8%) |
| 20 to 24 Years | 1,649 (77.8%) | 115 (7.0%) |
| 25 to 29 Years | 2,549 (87.4%) | 133 (5.2%) |
| 30 to 34 Years | 3,366 (92.3%) | 37 (1.1%) |
| 35 to 44 Years | 5,913 (87.2%) | 266 (4.5%) |
| 45 to 54 Years | 5,853 (89.0%) | 369 (6.3%) |
| 55 to 59 Years | 2,100 (72.9%) | 183 (8.7%) |
| 60 to 64 Years | 1,939 (67.6%) | 116 (6.0%) |
| 65 to 74 Years | 1,208 (28.5%) | 108 (8.9%) |
| 75 Years and over | 106 (4.5%) | 0 (0.0%) |
| Total | 25,488 (69.6%) | 1,376 (5.4%) |
Employment Status by Educational Attainment in Sayreville borough
According to labor force statistics for Sayreville borough, 84.6% of individuals (21,717) out of the total population between 25 and 64 years of age (25,670) are in the labor force, with 5.1% or 1,108 of them being unemployed. The group with the highest labor force participation rate are those with the educational attainment of bachelor's degree or higher, with 88.8% or 9,154 individuals in the labor force. Within the labor force, individuals with less than high school education have the highest percentage of unemployment, with 17.5% or 214 of them being unemployed.
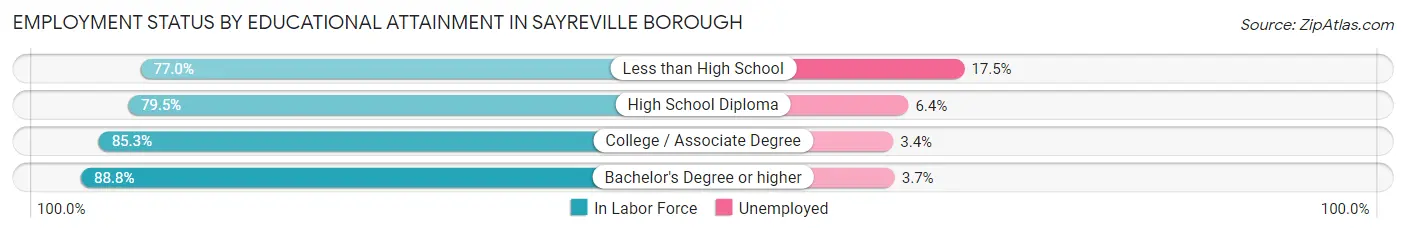
| Educational Attainment | In Labor Force | Unemployed |
| Less than High School | 1,220 (77.0%) | 277 (17.5%) |
| High School Diploma | 5,534 (79.5%) | 446 (6.4%) |
| College / Associate Degree | 5,814 (85.3%) | 232 (3.4%) |
| Bachelor's Degree or higher | 9,154 (88.8%) | 381 (3.7%) |
| Total | 21,717 (84.6%) | 1,309 (5.1%) |
Employment Occupations by Sex in Sayreville borough
Management, Business, Science and Arts Occupations
The most common Management, Business, Science and Arts occupations in Sayreville borough are Management (2,785 | 11.6%), Computers, Engineering & Science (2,364 | 9.8%), Community & Social Service (2,184 | 9.1%), Business & Financial (1,583 | 6.6%), and Computers & Mathematics (1,481 | 6.1%).
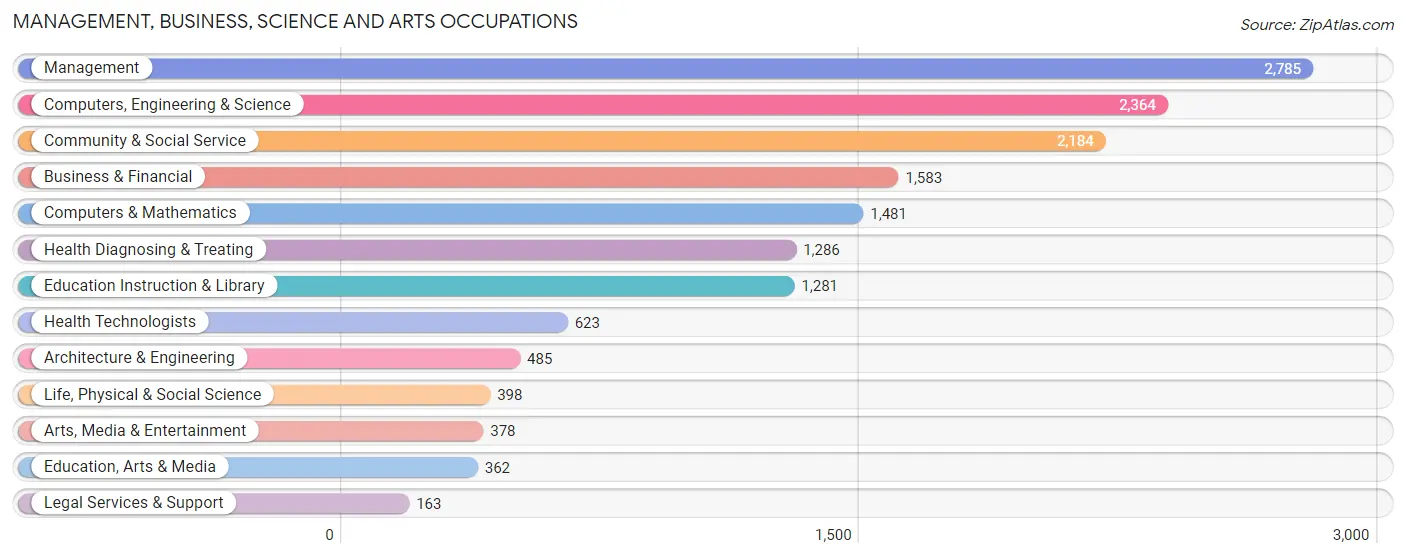
Management, Business, Science and Arts Occupations by Sex
Within the Management, Business, Science and Arts occupations in Sayreville borough, the most male-oriented occupations are Architecture & Engineering (96.7%), Computers & Mathematics (88.2%), and Computers, Engineering & Science (84.6%), while the most female-oriented occupations are Health Technologists (92.5%), Health Diagnosing & Treating (83.9%), and Education, Arts & Media (77.9%).
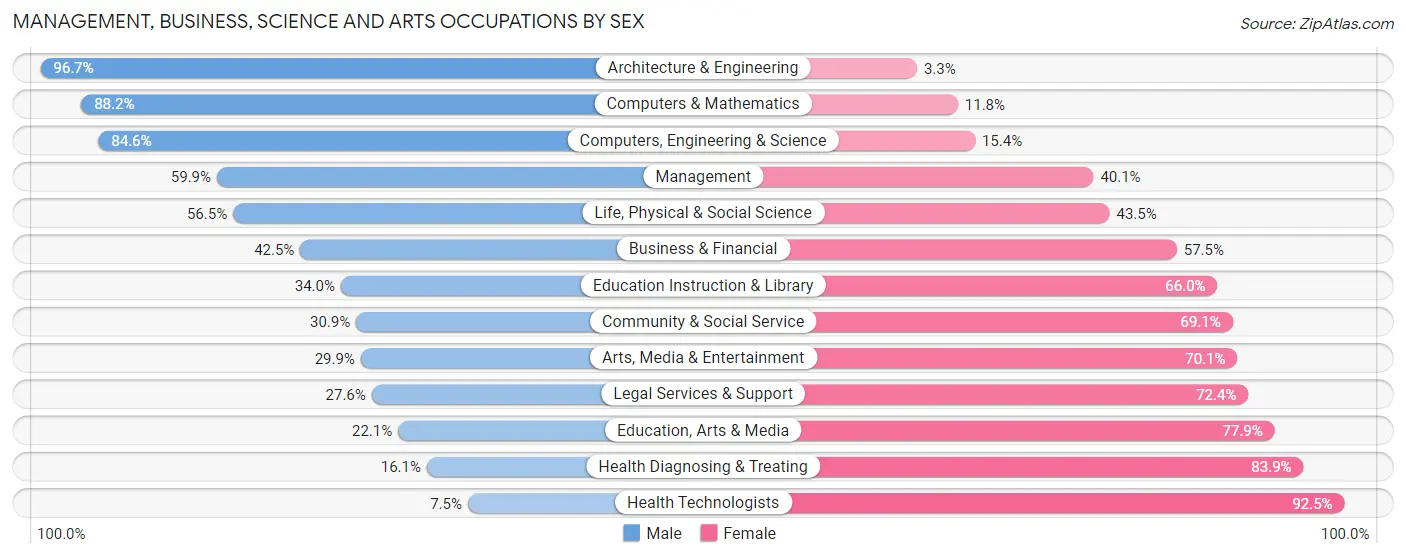
| Occupation | Male | Female |
| Management | 1,668 (59.9%) | 1,117 (40.1%) |
| Business & Financial | 673 (42.5%) | 910 (57.5%) |
| Computers, Engineering & Science | 2,000 (84.6%) | 364 (15.4%) |
| Computers & Mathematics | 1,306 (88.2%) | 175 (11.8%) |
| Architecture & Engineering | 469 (96.7%) | 16 (3.3%) |
| Life, Physical & Social Science | 225 (56.5%) | 173 (43.5%) |
| Community & Social Service | 674 (30.9%) | 1,510 (69.1%) |
| Education, Arts & Media | 80 (22.1%) | 282 (77.9%) |
| Legal Services & Support | 45 (27.6%) | 118 (72.4%) |
| Education Instruction & Library | 436 (34.0%) | 845 (66.0%) |
| Arts, Media & Entertainment | 113 (29.9%) | 265 (70.1%) |
| Health Diagnosing & Treating | 207 (16.1%) | 1,079 (83.9%) |
| Health Technologists | 47 (7.5%) | 576 (92.5%) |
| Total (Category) | 5,222 (51.2%) | 4,980 (48.8%) |
| Total (Overall) | 13,438 (55.8%) | 10,651 (44.2%) |
Services Occupations
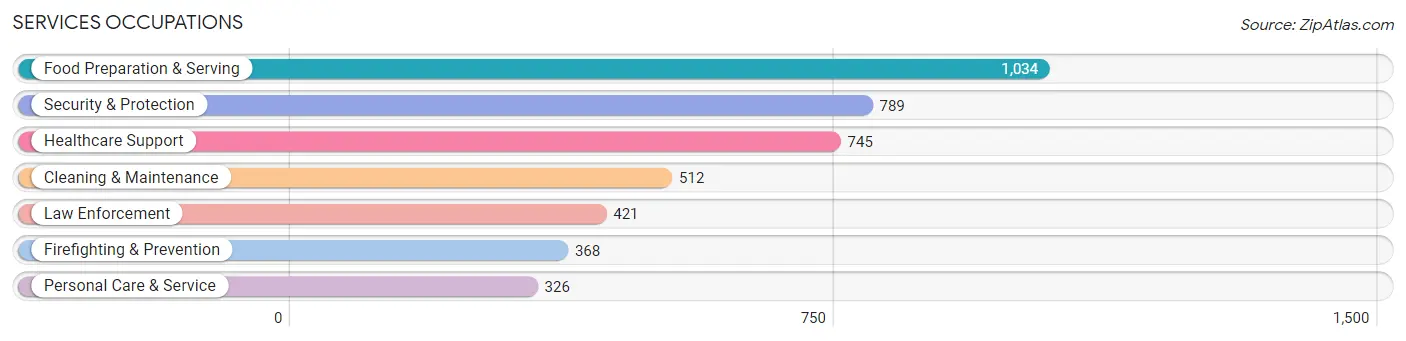
The most common Services occupations in Sayreville borough are Food Preparation & Serving (1,034 | 4.3%), Security & Protection (789 | 3.3%), Healthcare Support (745 | 3.1%), Cleaning & Maintenance (512 | 2.1%), and Law Enforcement (421 | 1.8%).
Services Occupations by Sex
Within the Services occupations in Sayreville borough, the most male-oriented occupations are Firefighting & Prevention (94.3%), Security & Protection (88.6%), and Law Enforcement (83.6%), while the most female-oriented occupations are Healthcare Support (65.5%), Personal Care & Service (62.6%), and Food Preparation & Serving (51.6%).
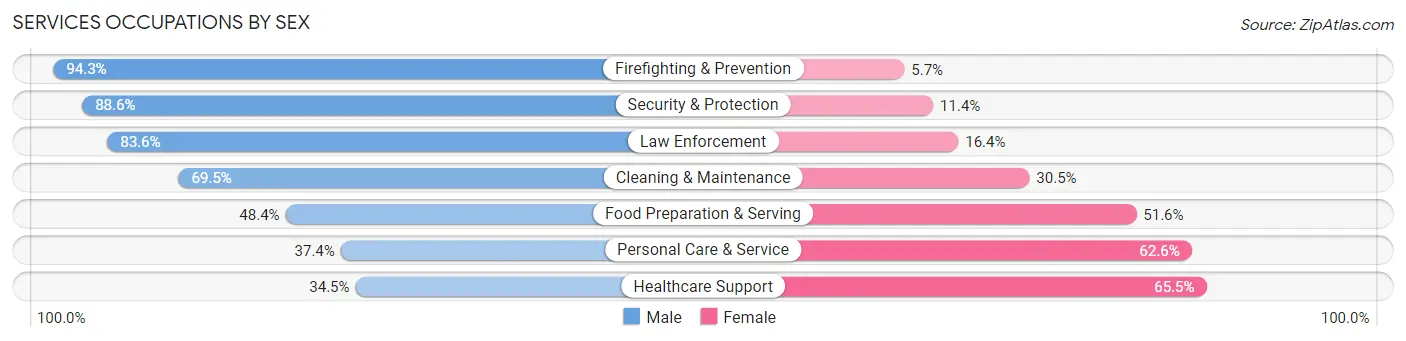
| Occupation | Male | Female |
| Healthcare Support | 257 (34.5%) | 488 (65.5%) |
| Security & Protection | 699 (88.6%) | 90 (11.4%) |
| Firefighting & Prevention | 347 (94.3%) | 21 (5.7%) |
| Law Enforcement | 352 (83.6%) | 69 (16.4%) |
| Food Preparation & Serving | 500 (48.4%) | 534 (51.6%) |
| Cleaning & Maintenance | 356 (69.5%) | 156 (30.5%) |
| Personal Care & Service | 122 (37.4%) | 204 (62.6%) |
| Total (Category) | 1,934 (56.8%) | 1,472 (43.2%) |
| Total (Overall) | 13,438 (55.8%) | 10,651 (44.2%) |
Sales and Office Occupations
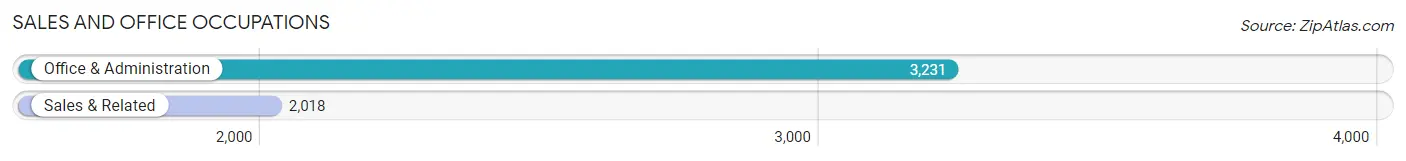
The most common Sales and Office occupations in Sayreville borough are Office & Administration (3,231 | 13.4%), and Sales & Related (2,018 | 8.4%).
Sales and Office Occupations by Sex
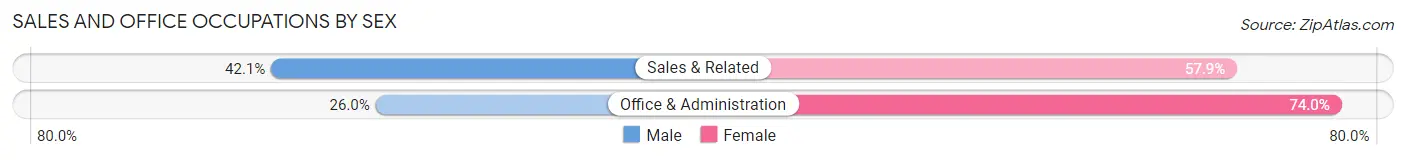
| Occupation | Male | Female |
| Sales & Related | 849 (42.1%) | 1,169 (57.9%) |
| Office & Administration | 840 (26.0%) | 2,391 (74.0%) |
| Total (Category) | 1,689 (32.2%) | 3,560 (67.8%) |
| Total (Overall) | 13,438 (55.8%) | 10,651 (44.2%) |
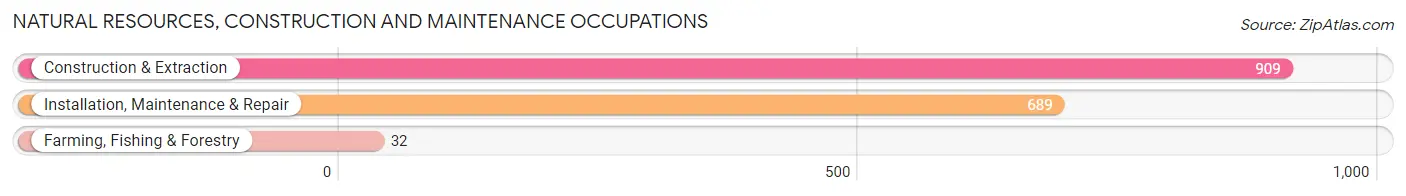
Natural Resources, Construction and Maintenance Occupations
The most common Natural Resources, Construction and Maintenance occupations in Sayreville borough are Construction & Extraction (909 | 3.8%), Installation, Maintenance & Repair (689 | 2.9%), and Farming, Fishing & Forestry (32 | 0.1%).
Natural Resources, Construction and Maintenance Occupations by Sex
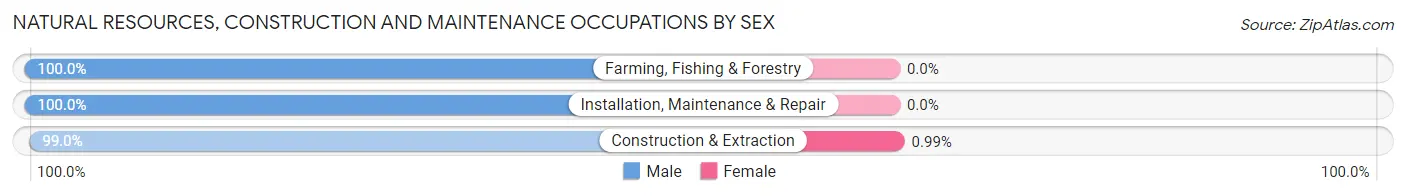
| Occupation | Male | Female |
| Farming, Fishing & Forestry | 32 (100.0%) | 0 (0.0%) |
| Construction & Extraction | 900 (99.0%) | 9 (1.0%) |
| Installation, Maintenance & Repair | 689 (100.0%) | 0 (0.0%) |
| Total (Category) | 1,621 (99.5%) | 9 (0.5%) |
| Total (Overall) | 13,438 (55.8%) | 10,651 (44.2%) |
Production, Transportation and Moving Occupations
The most common Production, Transportation and Moving occupations in Sayreville borough are Transportation (1,672 | 6.9%), Material Moving (1,239 | 5.1%), and Production (691 | 2.9%).
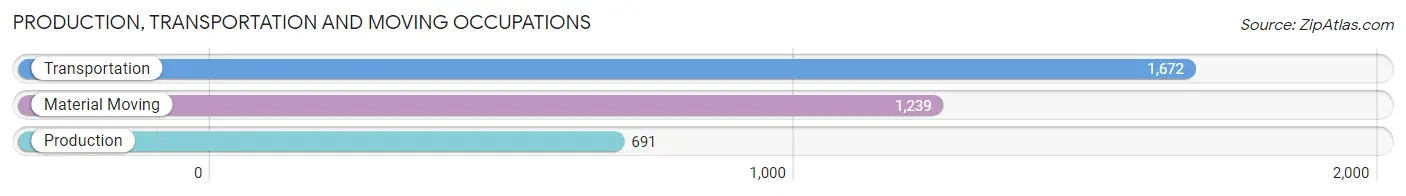
Production, Transportation and Moving Occupations by Sex
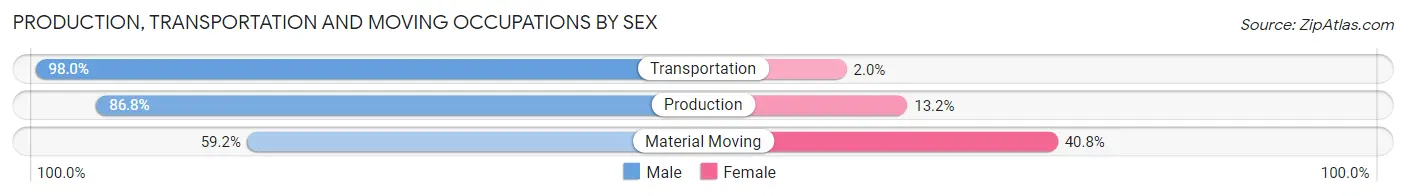
| Occupation | Male | Female |
| Production | 600 (86.8%) | 91 (13.2%) |
| Transportation | 1,638 (98.0%) | 34 (2.0%) |
| Material Moving | 734 (59.2%) | 505 (40.8%) |
| Total (Category) | 2,972 (82.5%) | 630 (17.5%) |
| Total (Overall) | 13,438 (55.8%) | 10,651 (44.2%) |
Employment Industries by Sex in Sayreville borough
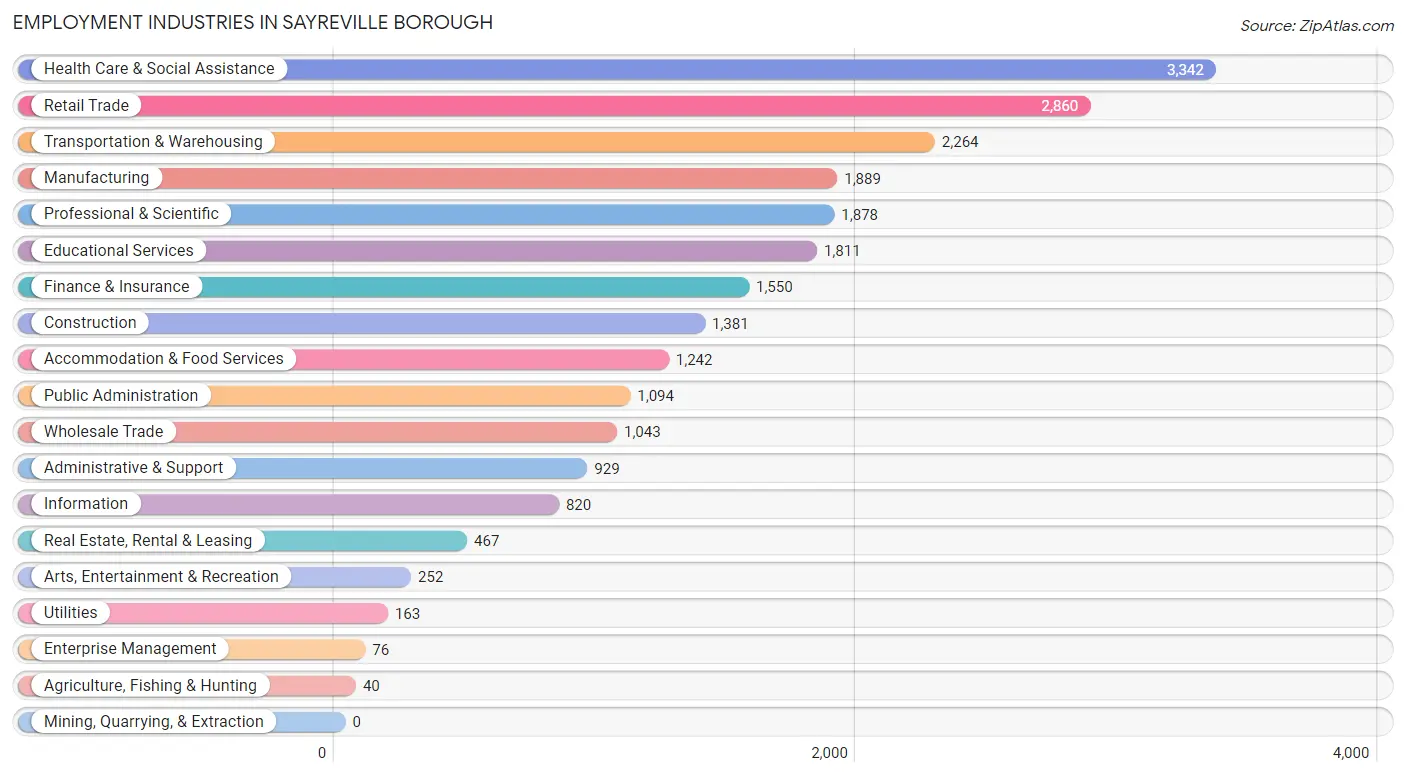
Employment Industries in Sayreville borough
The major employment industries in Sayreville borough include Health Care & Social Assistance (3,342 | 13.9%), Retail Trade (2,860 | 11.9%), Transportation & Warehousing (2,264 | 9.4%), Manufacturing (1,889 | 7.8%), and Professional & Scientific (1,878 | 7.8%).
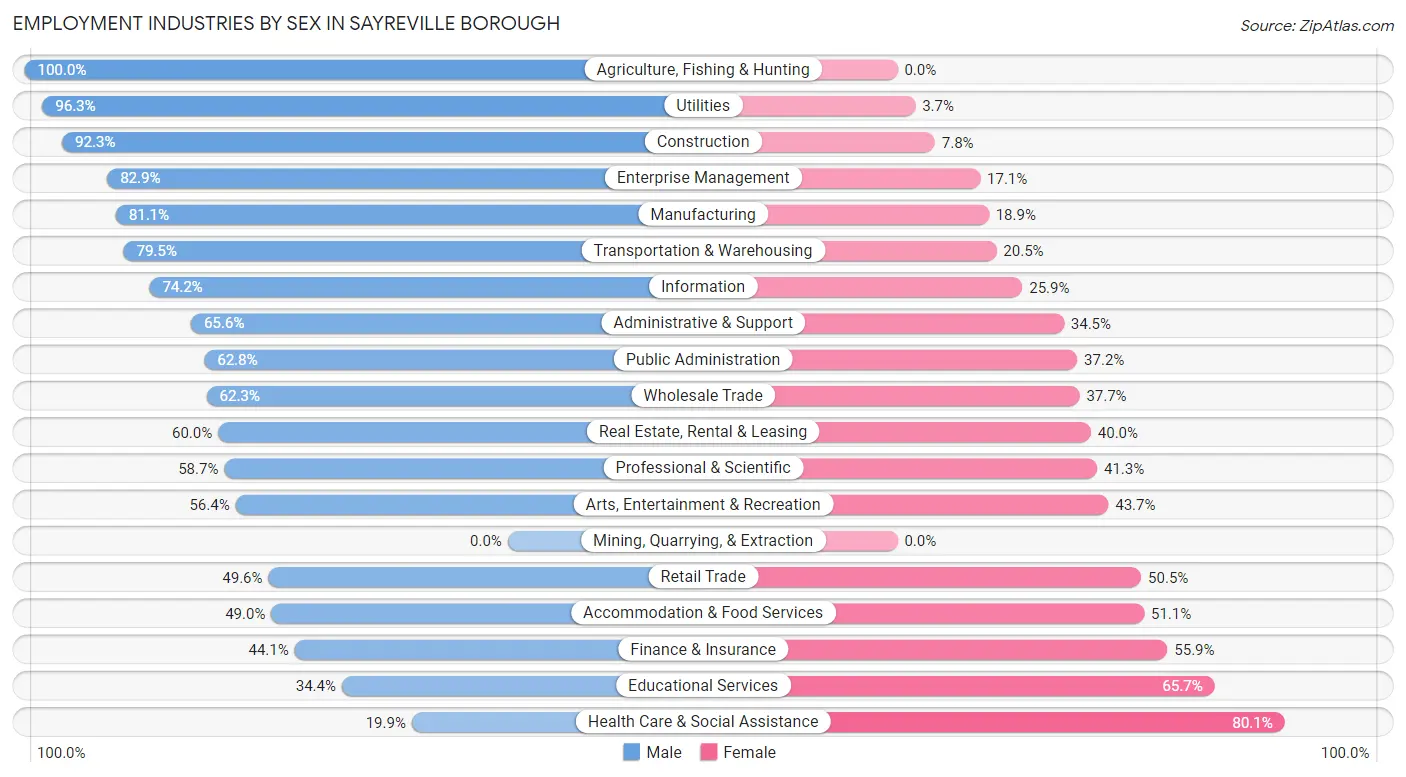
Employment Industries by Sex in Sayreville borough
The Sayreville borough industries that see more men than women are Agriculture, Fishing & Hunting (100.0%), Utilities (96.3%), and Construction (92.2%), whereas the industries that tend to have a higher number of women are Health Care & Social Assistance (80.1%), Educational Services (65.6%), and Finance & Insurance (55.9%).
| Industry | Male | Female |
| Agriculture, Fishing & Hunting | 40 (100.0%) | 0 (0.0%) |
| Mining, Quarrying, & Extraction | 0 (0.0%) | 0 (0.0%) |
| Construction | 1,274 (92.2%) | 107 (7.7%) |
| Manufacturing | 1,532 (81.1%) | 357 (18.9%) |
| Wholesale Trade | 650 (62.3%) | 393 (37.7%) |
| Retail Trade | 1,417 (49.5%) | 1,443 (50.4%) |
| Transportation & Warehousing | 1,800 (79.5%) | 464 (20.5%) |
| Utilities | 157 (96.3%) | 6 (3.7%) |
| Information | 608 (74.2%) | 212 (25.9%) |
| Finance & Insurance | 684 (44.1%) | 866 (55.9%) |
| Real Estate, Rental & Leasing | 280 (60.0%) | 187 (40.0%) |
| Professional & Scientific | 1,102 (58.7%) | 776 (41.3%) |
| Enterprise Management | 63 (82.9%) | 13 (17.1%) |
| Administrative & Support | 609 (65.5%) | 320 (34.4%) |
| Educational Services | 622 (34.4%) | 1,189 (65.6%) |
| Health Care & Social Assistance | 664 (19.9%) | 2,678 (80.1%) |
| Arts, Entertainment & Recreation | 142 (56.4%) | 110 (43.6%) |
| Accommodation & Food Services | 608 (48.9%) | 634 (51.0%) |
| Public Administration | 687 (62.8%) | 407 (37.2%) |
| Total | 13,438 (55.8%) | 10,651 (44.2%) |
Education in Sayreville borough
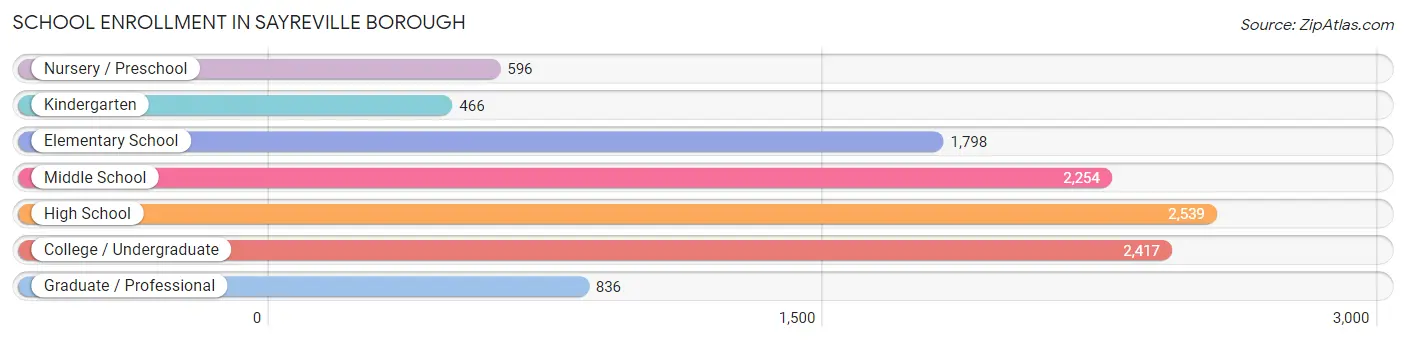
School Enrollment in Sayreville borough
The most common levels of schooling among the 10,906 students in Sayreville borough are high school (2,539 | 23.3%), college / undergraduate (2,417 | 22.2%), and middle school (2,254 | 20.7%).
| School Level | # Students | % Students |
| Nursery / Preschool | 596 | 5.5% |
| Kindergarten | 466 | 4.3% |
| Elementary School | 1,798 | 16.5% |
| Middle School | 2,254 | 20.7% |
| High School | 2,539 | 23.3% |
| College / Undergraduate | 2,417 | 22.2% |
| Graduate / Professional | 836 | 7.7% |
| Total | 10,906 | 100.0% |
School Enrollment by Age by Funding Source in Sayreville borough
Out of a total of 10,906 students who are enrolled in schools in Sayreville borough, 1,876 (17.2%) attend a private institution, while the remaining 9,030 (82.8%) are enrolled in public schools. The age group of 35 years and over has the highest likelihood of being enrolled in private schools, with 314 (47.4% in the age bracket) enrolled. Conversely, the age group of 10 to 14 year olds has the lowest likelihood of being enrolled in a private school, with 2,921 (97.5% in the age bracket) attending a public institution.
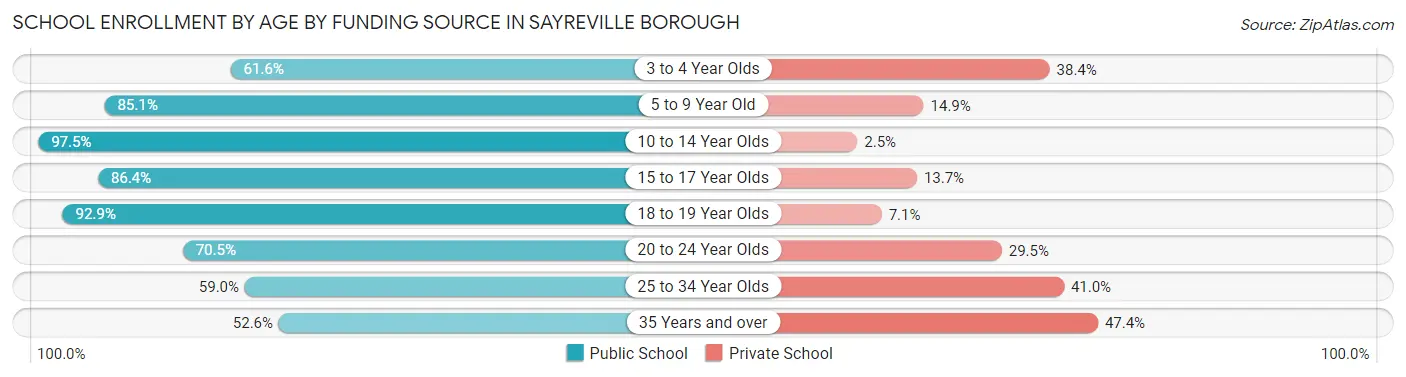
| Age Bracket | Public School | Private School |
| 3 to 4 Year Olds | 331 (61.6%) | 206 (38.4%) |
| 5 to 9 Year Old | 1,817 (85.1%) | 318 (14.9%) |
| 10 to 14 Year Olds | 2,921 (97.5%) | 76 (2.5%) |
| 15 to 17 Year Olds | 1,518 (86.4%) | 240 (13.7%) |
| 18 to 19 Year Olds | 892 (92.9%) | 68 (7.1%) |
| 20 to 24 Year Olds | 680 (70.5%) | 284 (29.5%) |
| 25 to 34 Year Olds | 526 (59.0%) | 366 (41.0%) |
| 35 Years and over | 349 (52.6%) | 314 (47.4%) |
| Total | 9,030 (82.8%) | 1,876 (17.2%) |
Educational Attainment by Field of Study in Sayreville borough
Business (2,839 | 21.3%), engineering (1,434 | 10.8%), computers & mathematics (1,347 | 10.1%), education (1,335 | 10.0%), and science & technology (1,218 | 9.1%) are the most common fields of study among 13,331 individuals in Sayreville borough who have obtained a bachelor's degree or higher.
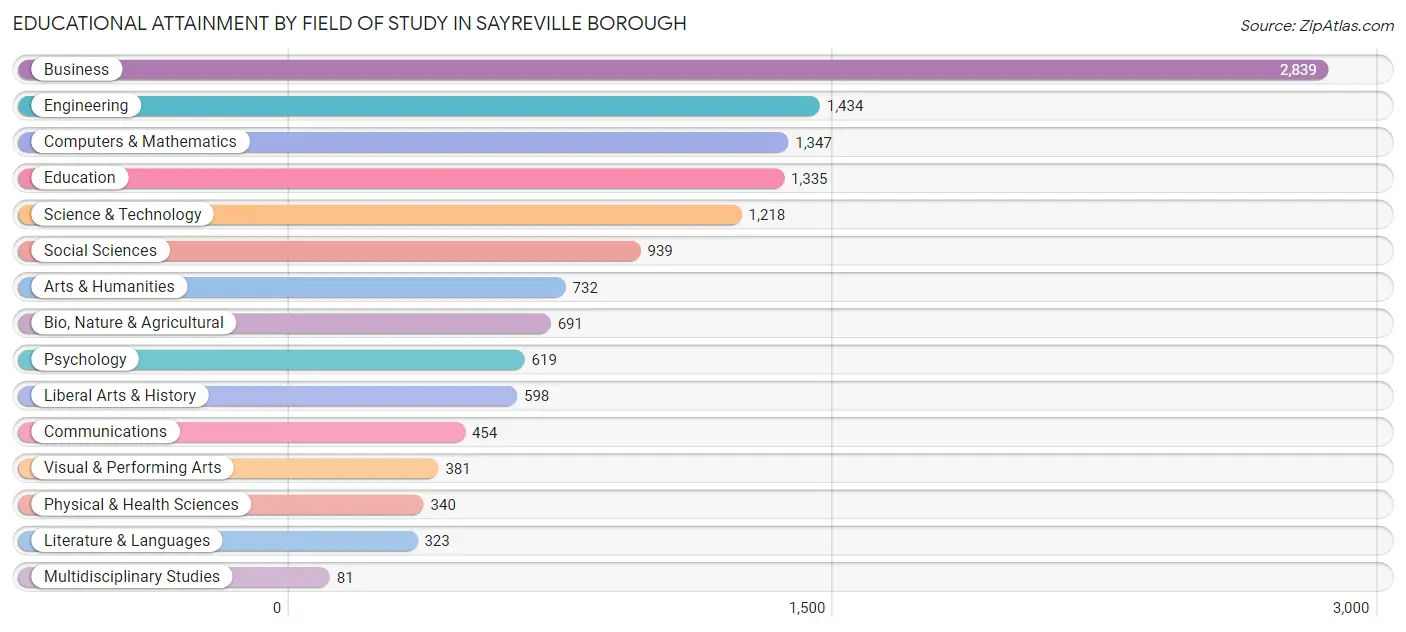
| Field of Study | # Graduates | % Graduates |
| Computers & Mathematics | 1,347 | 10.1% |
| Bio, Nature & Agricultural | 691 | 5.2% |
| Physical & Health Sciences | 340 | 2.5% |
| Psychology | 619 | 4.6% |
| Social Sciences | 939 | 7.0% |
| Engineering | 1,434 | 10.8% |
| Multidisciplinary Studies | 81 | 0.6% |
| Science & Technology | 1,218 | 9.1% |
| Business | 2,839 | 21.3% |
| Education | 1,335 | 10.0% |
| Literature & Languages | 323 | 2.4% |
| Liberal Arts & History | 598 | 4.5% |
| Visual & Performing Arts | 381 | 2.9% |
| Communications | 454 | 3.4% |
| Arts & Humanities | 732 | 5.5% |
| Total | 13,331 | 100.0% |
Transportation & Commute in Sayreville borough
Vehicle Availability by Sex in Sayreville borough
The most prevalent vehicle ownership categories in Sayreville borough are males with 2 vehicles (5,515, accounting for 42.4%) and females with 2 vehicles (3,714, making up 52.8%).
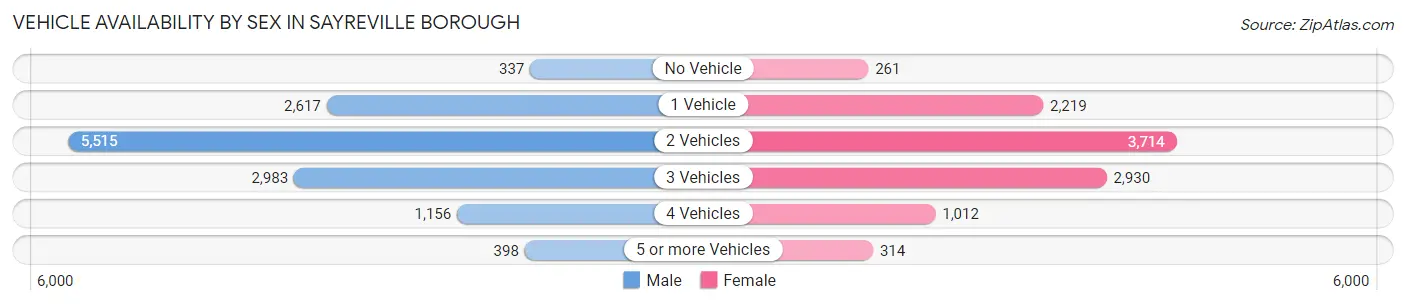
| Vehicles Available | Male | Female |
| No Vehicle | 337 (2.6%) | 261 (2.5%) |
| 1 Vehicle | 2,617 (20.1%) | 2,219 (21.2%) |
| 2 Vehicles | 5,515 (42.4%) | 3,714 (35.5%) |
| 3 Vehicles | 2,983 (22.9%) | 2,930 (28.0%) |
| 4 Vehicles | 1,156 (8.9%) | 1,012 (9.7%) |
| 5 or more Vehicles | 398 (3.1%) | 314 (3.0%) |
| Total | 13,006 (100.0%) | 10,450 (100.0%) |
Commute Time in Sayreville borough
The most frequently occuring commute durations in Sayreville borough are 30 to 34 minutes (3,435 commuters, 16.3%), 15 to 19 minutes (2,818 commuters, 13.4%), and 20 to 24 minutes (2,674 commuters, 12.7%).
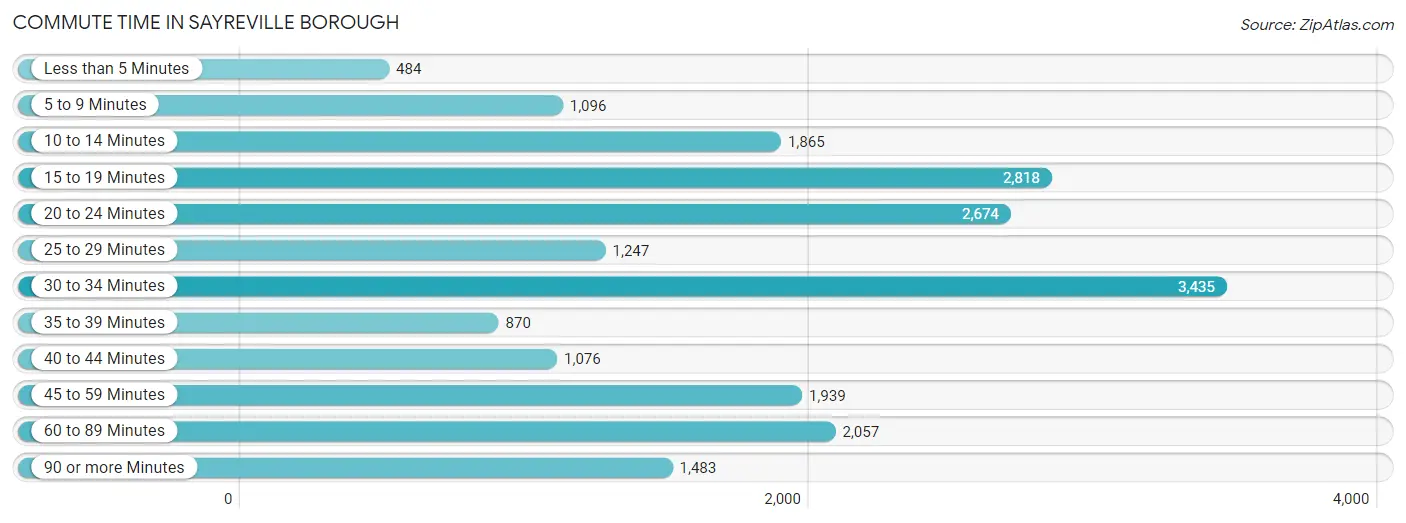
| Commute Time | # Commuters | % Commuters |
| Less than 5 Minutes | 484 | 2.3% |
| 5 to 9 Minutes | 1,096 | 5.2% |
| 10 to 14 Minutes | 1,865 | 8.9% |
| 15 to 19 Minutes | 2,818 | 13.4% |
| 20 to 24 Minutes | 2,674 | 12.7% |
| 25 to 29 Minutes | 1,247 | 5.9% |
| 30 to 34 Minutes | 3,435 | 16.3% |
| 35 to 39 Minutes | 870 | 4.1% |
| 40 to 44 Minutes | 1,076 | 5.1% |
| 45 to 59 Minutes | 1,939 | 9.2% |
| 60 to 89 Minutes | 2,057 | 9.8% |
| 90 or more Minutes | 1,483 | 7.0% |
Commute Time by Sex in Sayreville borough
The most common commute times in Sayreville borough are 30 to 34 minutes (1,843 commuters, 15.6%) for males and 30 to 34 minutes (1,592 commuters, 17.3%) for females.
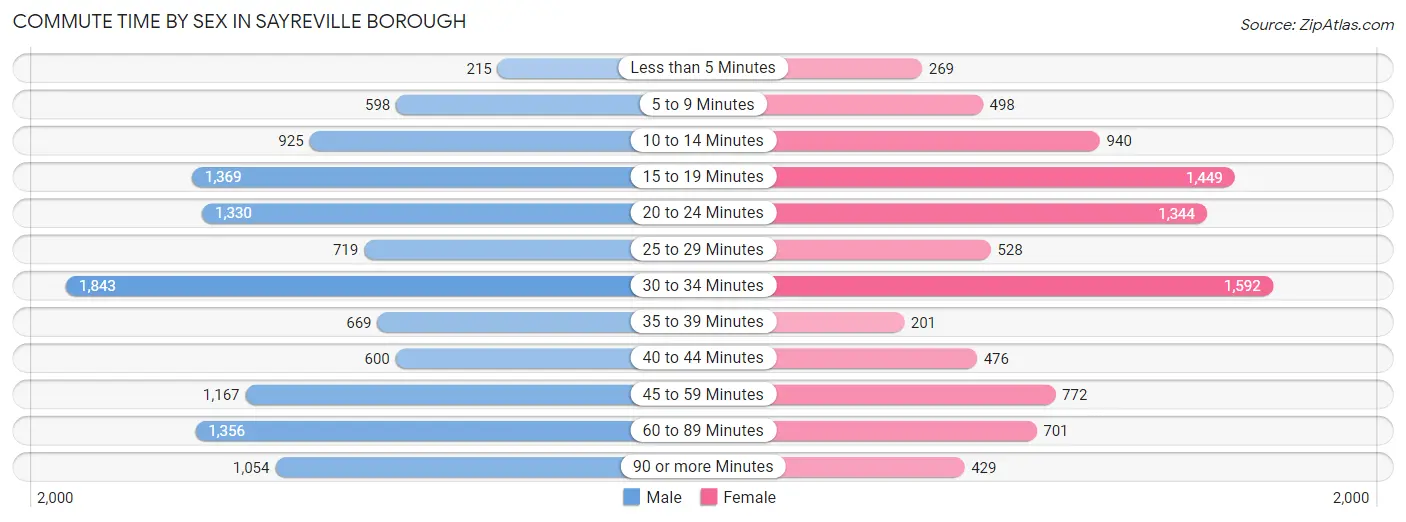
| Commute Time | Male | Female |
| Less than 5 Minutes | 215 (1.8%) | 269 (2.9%) |
| 5 to 9 Minutes | 598 (5.1%) | 498 (5.4%) |
| 10 to 14 Minutes | 925 (7.8%) | 940 (10.2%) |
| 15 to 19 Minutes | 1,369 (11.6%) | 1,449 (15.8%) |
| 20 to 24 Minutes | 1,330 (11.2%) | 1,344 (14.6%) |
| 25 to 29 Minutes | 719 (6.1%) | 528 (5.7%) |
| 30 to 34 Minutes | 1,843 (15.6%) | 1,592 (17.3%) |
| 35 to 39 Minutes | 669 (5.7%) | 201 (2.2%) |
| 40 to 44 Minutes | 600 (5.1%) | 476 (5.2%) |
| 45 to 59 Minutes | 1,167 (9.9%) | 772 (8.4%) |
| 60 to 89 Minutes | 1,356 (11.5%) | 701 (7.6%) |
| 90 or more Minutes | 1,054 (8.9%) | 429 (4.7%) |
Time of Departure to Work by Sex in Sayreville borough
The most frequent times of departure to work in Sayreville borough are 6:00 AM to 6:29 AM (1,381, 11.7%) for males and 7:00 AM to 7:29 AM (1,247, 13.6%) for females.
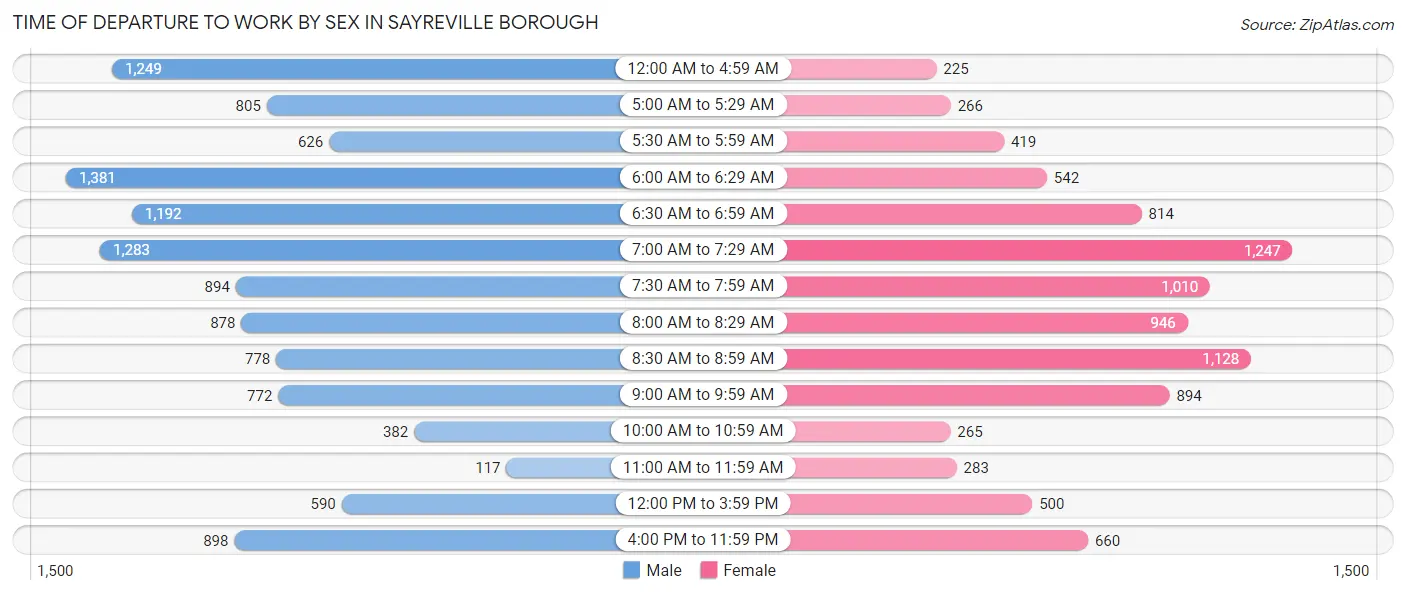
| Time of Departure | Male | Female |
| 12:00 AM to 4:59 AM | 1,249 (10.5%) | 225 (2.5%) |
| 5:00 AM to 5:29 AM | 805 (6.8%) | 266 (2.9%) |
| 5:30 AM to 5:59 AM | 626 (5.3%) | 419 (4.5%) |
| 6:00 AM to 6:29 AM | 1,381 (11.7%) | 542 (5.9%) |
| 6:30 AM to 6:59 AM | 1,192 (10.1%) | 814 (8.8%) |
| 7:00 AM to 7:29 AM | 1,283 (10.8%) | 1,247 (13.6%) |
| 7:30 AM to 7:59 AM | 894 (7.5%) | 1,010 (11.0%) |
| 8:00 AM to 8:29 AM | 878 (7.4%) | 946 (10.3%) |
| 8:30 AM to 8:59 AM | 778 (6.6%) | 1,128 (12.3%) |
| 9:00 AM to 9:59 AM | 772 (6.5%) | 894 (9.7%) |
| 10:00 AM to 10:59 AM | 382 (3.2%) | 265 (2.9%) |
| 11:00 AM to 11:59 AM | 117 (1.0%) | 283 (3.1%) |
| 12:00 PM to 3:59 PM | 590 (5.0%) | 500 (5.4%) |
| 4:00 PM to 11:59 PM | 898 (7.6%) | 660 (7.2%) |
| Total | 11,845 (100.0%) | 9,199 (100.0%) |
Housing Occupancy in Sayreville borough
Occupancy by Ownership in Sayreville borough
Of the total 16,851 dwellings in Sayreville borough, owner-occupied units account for 10,718 (63.6%), while renter-occupied units make up 6,133 (36.4%).
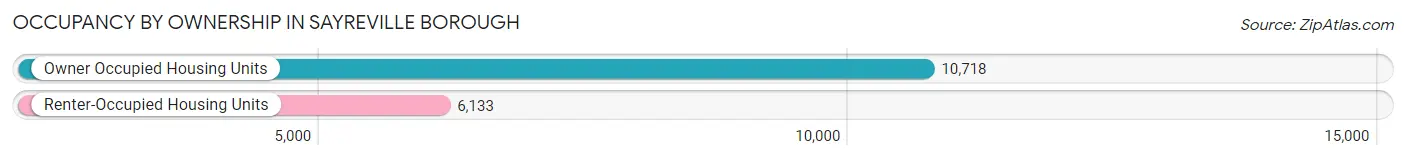
| Occupancy | # Housing Units | % Housing Units |
| Owner Occupied Housing Units | 10,718 | 63.6% |
| Renter-Occupied Housing Units | 6,133 | 36.4% |
| Total Occupied Housing Units | 16,851 | 100.0% |
Occupancy by Household Size in Sayreville borough
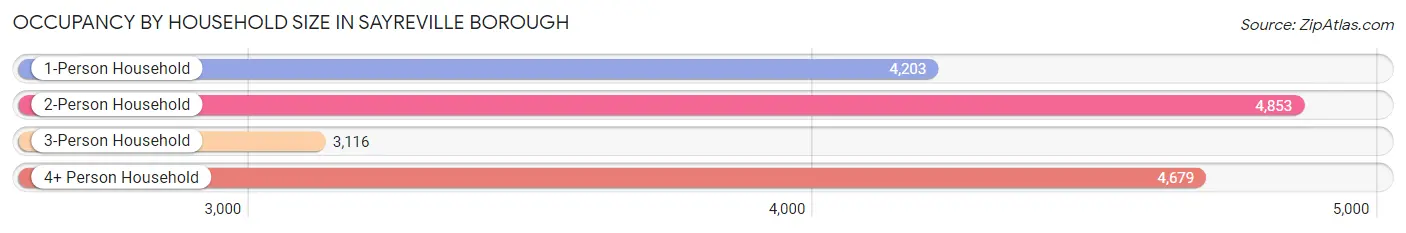
| Household Size | # Housing Units | % Housing Units |
| 1-Person Household | 4,203 | 24.9% |
| 2-Person Household | 4,853 | 28.8% |
| 3-Person Household | 3,116 | 18.5% |
| 4+ Person Household | 4,679 | 27.8% |
| Total Housing Units | 16,851 | 100.0% |
Occupancy by Ownership by Household Size in Sayreville borough
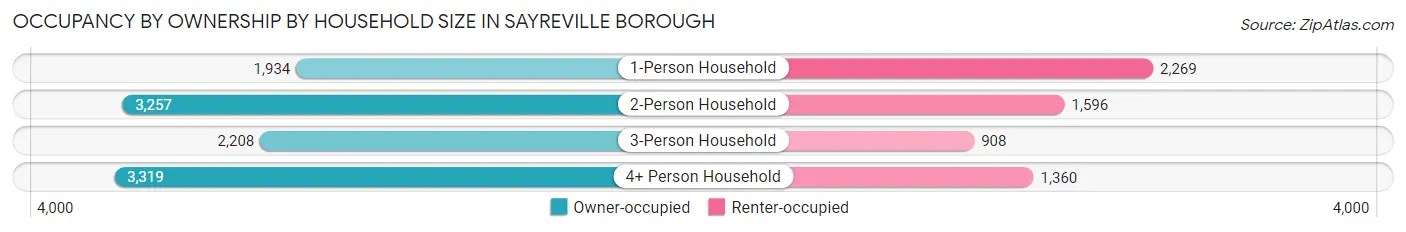
| Household Size | Owner-occupied | Renter-occupied |
| 1-Person Household | 1,934 (46.0%) | 2,269 (54.0%) |
| 2-Person Household | 3,257 (67.1%) | 1,596 (32.9%) |
| 3-Person Household | 2,208 (70.9%) | 908 (29.1%) |
| 4+ Person Household | 3,319 (70.9%) | 1,360 (29.1%) |
| Total Housing Units | 10,718 (63.6%) | 6,133 (36.4%) |
Occupancy by Educational Attainment in Sayreville borough
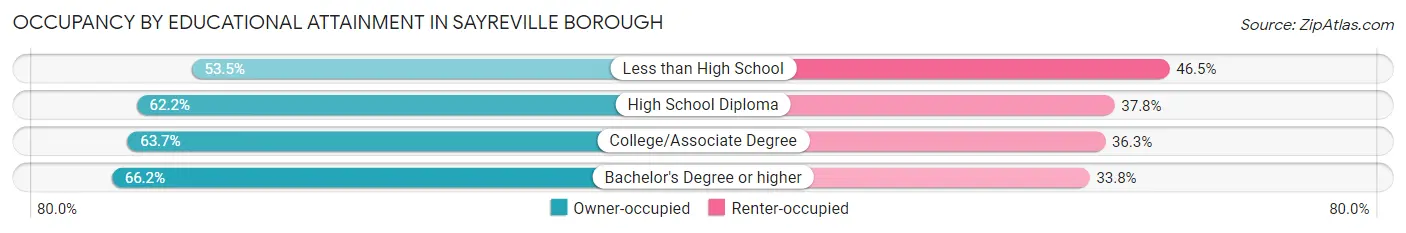
| Household Size | Owner-occupied | Renter-occupied |
| Less than High School | 580 (53.5%) | 504 (46.5%) |
| High School Diploma | 2,821 (62.2%) | 1,713 (37.8%) |
| College/Associate Degree | 2,991 (63.7%) | 1,704 (36.3%) |
| Bachelor's Degree or higher | 4,326 (66.2%) | 2,212 (33.8%) |
Occupancy by Age of Householder in Sayreville borough
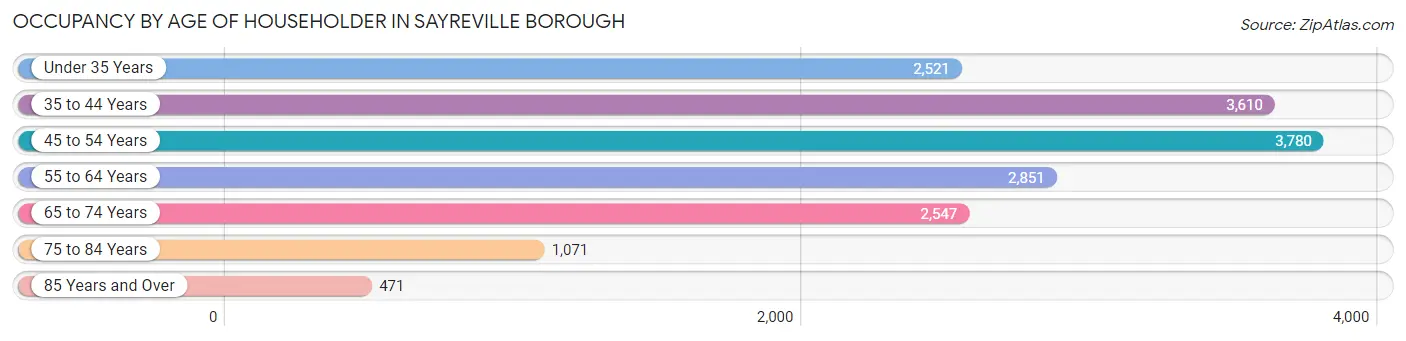
| Age Bracket | # Households | % Households |
| Under 35 Years | 2,521 | 15.0% |
| 35 to 44 Years | 3,610 | 21.4% |
| 45 to 54 Years | 3,780 | 22.4% |
| 55 to 64 Years | 2,851 | 16.9% |
| 65 to 74 Years | 2,547 | 15.1% |
| 75 to 84 Years | 1,071 | 6.4% |
| 85 Years and Over | 471 | 2.8% |
| Total | 16,851 | 100.0% |
Housing Finances in Sayreville borough
Median Income by Occupancy in Sayreville borough
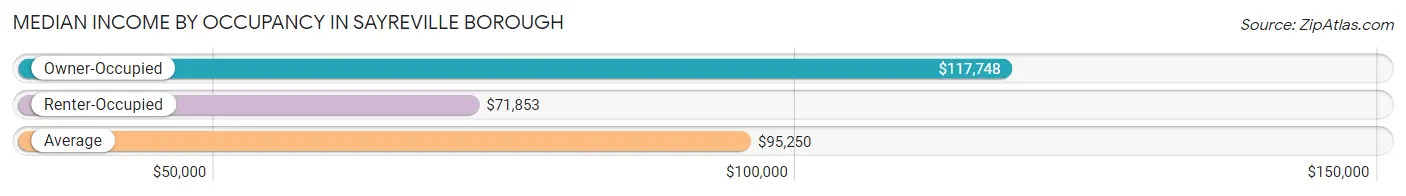
| Occupancy Type | # Households | Median Income |
| Owner-Occupied | 10,718 (63.6%) | $117,748 |
| Renter-Occupied | 6,133 (36.4%) | $71,853 |
| Average | 16,851 (100.0%) | $95,250 |
Occupancy by Householder Income Bracket in Sayreville borough
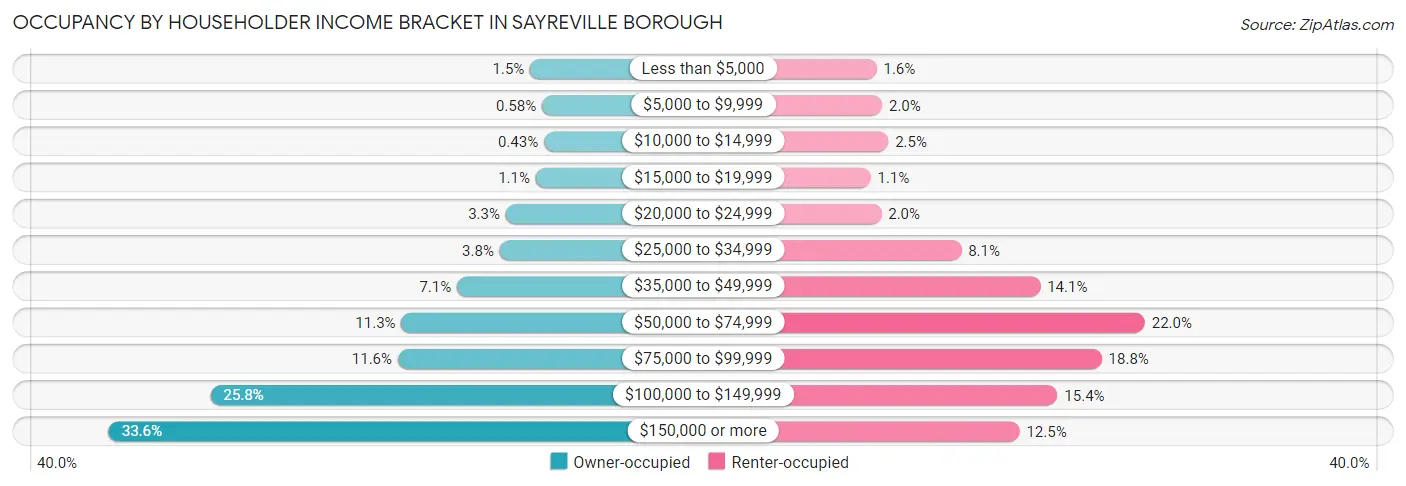
| Income Bracket | Owner-occupied | Renter-occupied |
| Less than $5,000 | 159 (1.5%) | 98 (1.6%) |
| $5,000 to $9,999 | 62 (0.6%) | 124 (2.0%) |
| $10,000 to $14,999 | 46 (0.4%) | 153 (2.5%) |
| $15,000 to $19,999 | 113 (1.1%) | 70 (1.1%) |
| $20,000 to $24,999 | 358 (3.3%) | 120 (2.0%) |
| $25,000 to $34,999 | 407 (3.8%) | 494 (8.1%) |
| $35,000 to $49,999 | 756 (7.0%) | 863 (14.1%) |
| $50,000 to $74,999 | 1,210 (11.3%) | 1,352 (22.0%) |
| $75,000 to $99,999 | 1,239 (11.6%) | 1,150 (18.8%) |
| $100,000 to $149,999 | 2,769 (25.8%) | 943 (15.4%) |
| $150,000 or more | 3,599 (33.6%) | 766 (12.5%) |
| Total | 10,718 (100.0%) | 6,133 (100.0%) |
Monthly Housing Cost Tiers in Sayreville borough
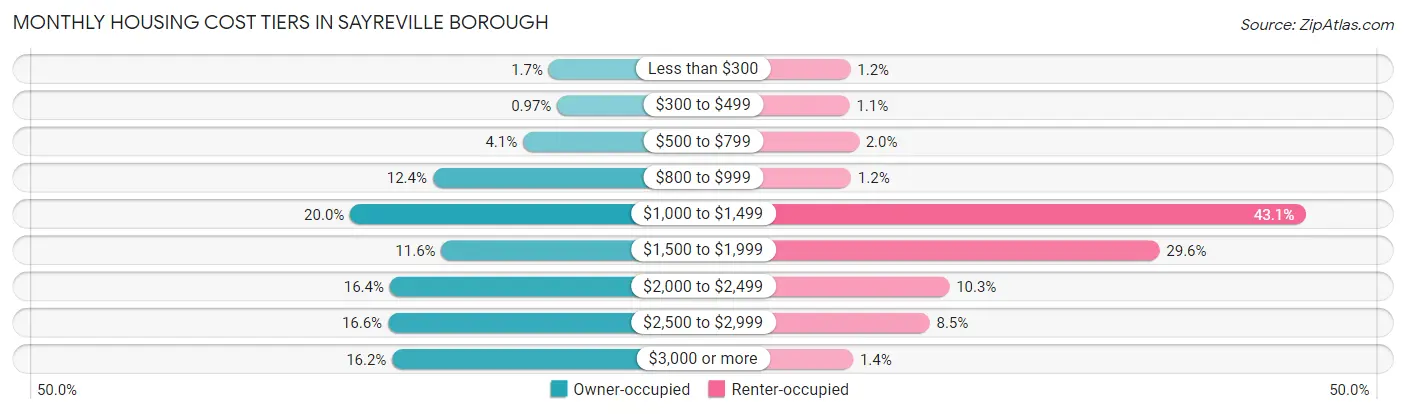
| Monthly Cost | Owner-occupied | Renter-occupied |
| Less than $300 | 187 (1.7%) | 73 (1.2%) |
| $300 to $499 | 104 (1.0%) | 68 (1.1%) |
| $500 to $799 | 441 (4.1%) | 120 (2.0%) |
| $800 to $999 | 1,331 (12.4%) | 76 (1.2%) |
| $1,000 to $1,499 | 2,147 (20.0%) | 2,646 (43.1%) |
| $1,500 to $1,999 | 1,246 (11.6%) | 1,818 (29.6%) |
| $2,000 to $2,499 | 1,756 (16.4%) | 631 (10.3%) |
| $2,500 to $2,999 | 1,774 (16.6%) | 520 (8.5%) |
| $3,000 or more | 1,732 (16.2%) | 88 (1.4%) |
| Total | 10,718 (100.0%) | 6,133 (100.0%) |
Physical Housing Characteristics in Sayreville borough
Housing Structures in Sayreville borough
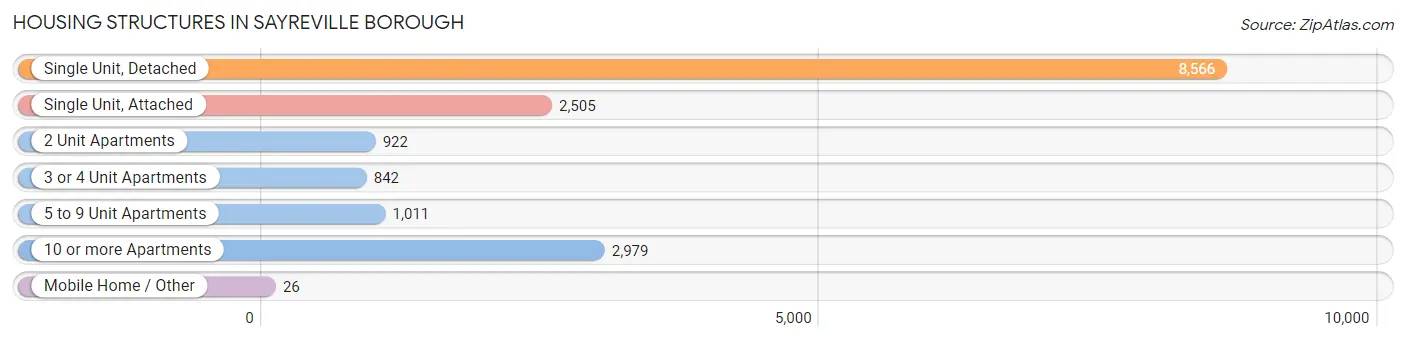
| Structure Type | # Housing Units | % Housing Units |
| Single Unit, Detached | 8,566 | 50.8% |
| Single Unit, Attached | 2,505 | 14.9% |
| 2 Unit Apartments | 922 | 5.5% |
| 3 or 4 Unit Apartments | 842 | 5.0% |
| 5 to 9 Unit Apartments | 1,011 | 6.0% |
| 10 or more Apartments | 2,979 | 17.7% |
| Mobile Home / Other | 26 | 0.2% |
| Total | 16,851 | 100.0% |
Housing Structures by Occupancy in Sayreville borough
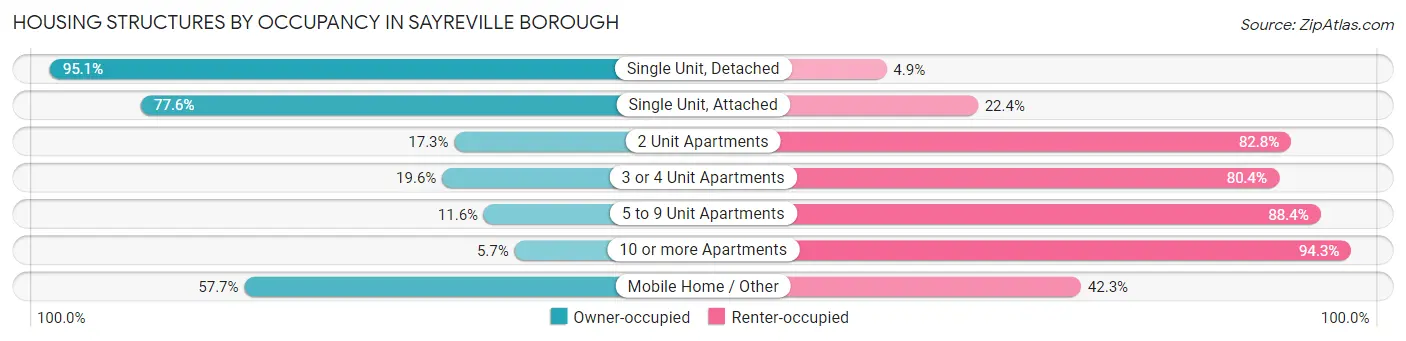
| Structure Type | Owner-occupied | Renter-occupied |
| Single Unit, Detached | 8,150 (95.1%) | 416 (4.9%) |
| Single Unit, Attached | 1,943 (77.6%) | 562 (22.4%) |
| 2 Unit Apartments | 159 (17.2%) | 763 (82.8%) |
| 3 or 4 Unit Apartments | 165 (19.6%) | 677 (80.4%) |
| 5 to 9 Unit Apartments | 117 (11.6%) | 894 (88.4%) |
| 10 or more Apartments | 169 (5.7%) | 2,810 (94.3%) |
| Mobile Home / Other | 15 (57.7%) | 11 (42.3%) |
| Total | 10,718 (63.6%) | 6,133 (36.4%) |
Housing Structures by Number of Rooms in Sayreville borough
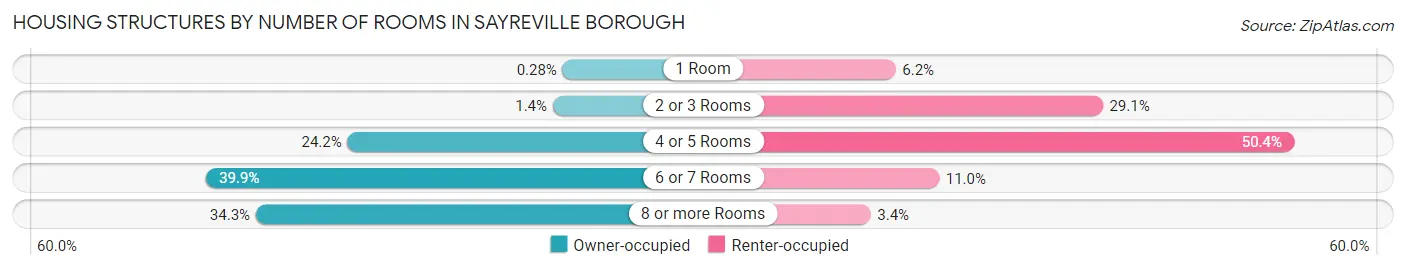
| Number of Rooms | Owner-occupied | Renter-occupied |
| 1 Room | 30 (0.3%) | 377 (6.1%) |
| 2 or 3 Rooms | 147 (1.4%) | 1,787 (29.1%) |
| 4 or 5 Rooms | 2,589 (24.2%) | 3,089 (50.4%) |
| 6 or 7 Rooms | 4,272 (39.9%) | 673 (11.0%) |
| 8 or more Rooms | 3,680 (34.3%) | 207 (3.4%) |
| Total | 10,718 (100.0%) | 6,133 (100.0%) |
Housing Structure by Heating Type in Sayreville borough
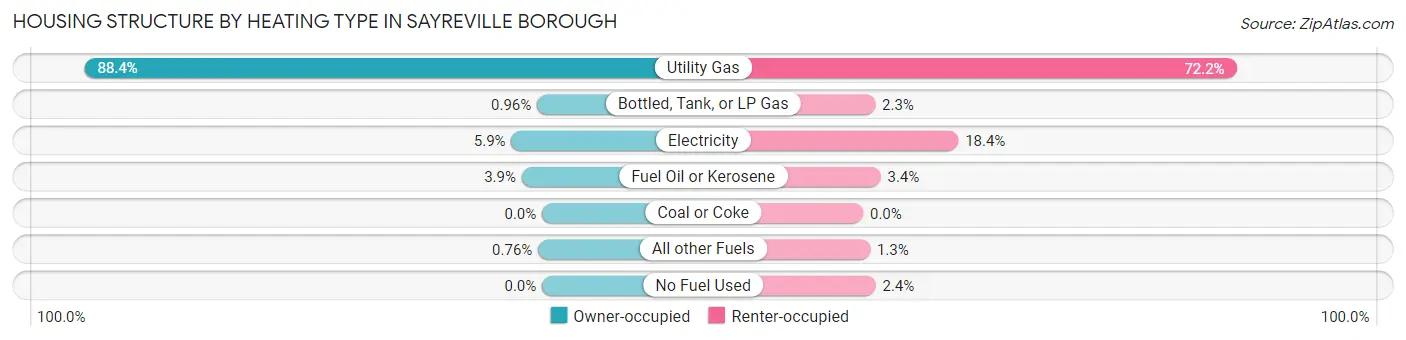
| Heating Type | Owner-occupied | Renter-occupied |
| Utility Gas | 9,478 (88.4%) | 4,425 (72.2%) |
| Bottled, Tank, or LP Gas | 103 (1.0%) | 143 (2.3%) |
| Electricity | 636 (5.9%) | 1,128 (18.4%) |
| Fuel Oil or Kerosene | 420 (3.9%) | 207 (3.4%) |
| Coal or Coke | 0 (0.0%) | 0 (0.0%) |
| All other Fuels | 81 (0.8%) | 82 (1.3%) |
| No Fuel Used | 0 (0.0%) | 148 (2.4%) |
| Total | 10,718 (100.0%) | 6,133 (100.0%) |
Household Vehicle Usage in Sayreville borough
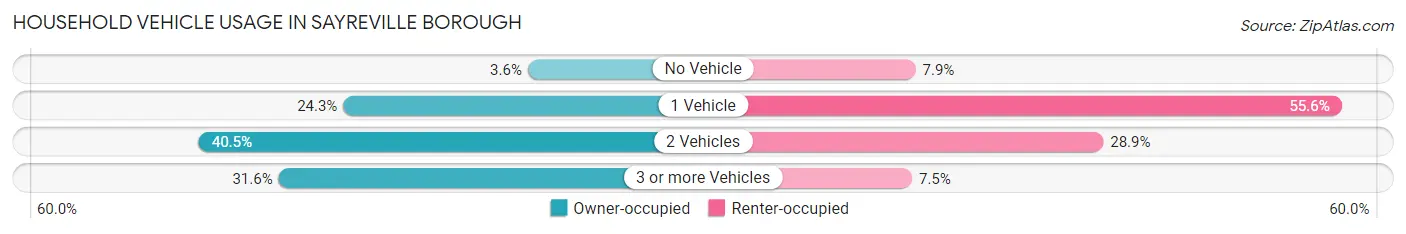
| Vehicles per Household | Owner-occupied | Renter-occupied |
| No Vehicle | 390 (3.6%) | 486 (7.9%) |
| 1 Vehicle | 2,606 (24.3%) | 3,411 (55.6%) |
| 2 Vehicles | 4,339 (40.5%) | 1,775 (28.9%) |
| 3 or more Vehicles | 3,383 (31.6%) | 461 (7.5%) |
| Total | 10,718 (100.0%) | 6,133 (100.0%) |
Real Estate & Mortgages in Sayreville borough
Real Estate and Mortgage Overview in Sayreville borough
| Characteristic | Without Mortgage | With Mortgage |
| Housing Units | 4,059 | 6,659 |
| Median Property Value | $371,100 | $380,600 |
| Median Household Income | $86,971 | $2,730 |
| Monthly Housing Costs | $1,015 | $1,723 |
| Real Estate Taxes | $8,108 | $107 |
Property Value by Mortgage Status in Sayreville borough
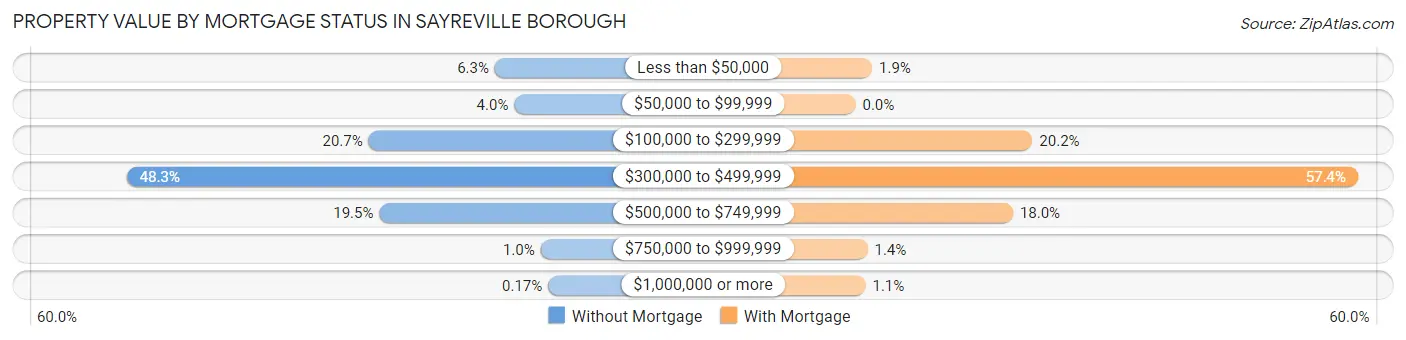
| Property Value | Without Mortgage | With Mortgage |
| Less than $50,000 | 254 (6.3%) | 126 (1.9%) |
| $50,000 to $99,999 | 164 (4.0%) | 0 (0.0%) |
| $100,000 to $299,999 | 840 (20.7%) | 1,346 (20.2%) |
| $300,000 to $499,999 | 1,962 (48.3%) | 3,822 (57.4%) |
| $500,000 to $749,999 | 790 (19.5%) | 1,198 (18.0%) |
| $750,000 to $999,999 | 42 (1.0%) | 91 (1.4%) |
| $1,000,000 or more | 7 (0.2%) | 76 (1.1%) |
| Total | 4,059 (100.0%) | 6,659 (100.0%) |
Household Income by Mortgage Status in Sayreville borough
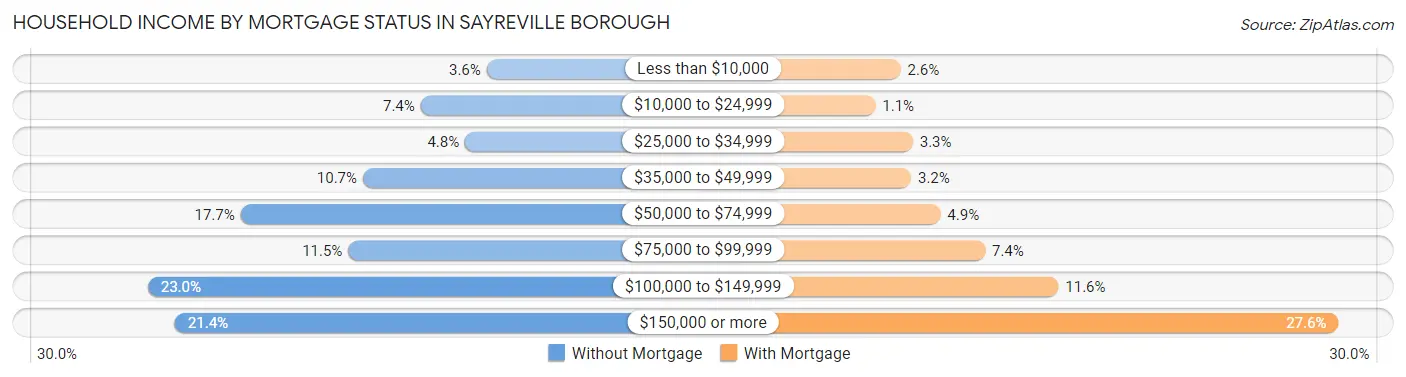
| Household Income | Without Mortgage | With Mortgage |
| Less than $10,000 | 146 (3.6%) | 171 (2.6%) |
| $10,000 to $24,999 | 299 (7.4%) | 75 (1.1%) |
| $25,000 to $34,999 | 196 (4.8%) | 218 (3.3%) |
| $35,000 to $49,999 | 433 (10.7%) | 211 (3.2%) |
| $50,000 to $74,999 | 717 (17.7%) | 323 (4.9%) |
| $75,000 to $99,999 | 467 (11.5%) | 493 (7.4%) |
| $100,000 to $149,999 | 932 (23.0%) | 772 (11.6%) |
| $150,000 or more | 869 (21.4%) | 1,837 (27.6%) |
| Total | 4,059 (100.0%) | 6,659 (100.0%) |
Property Value to Household Income Ratio in Sayreville borough
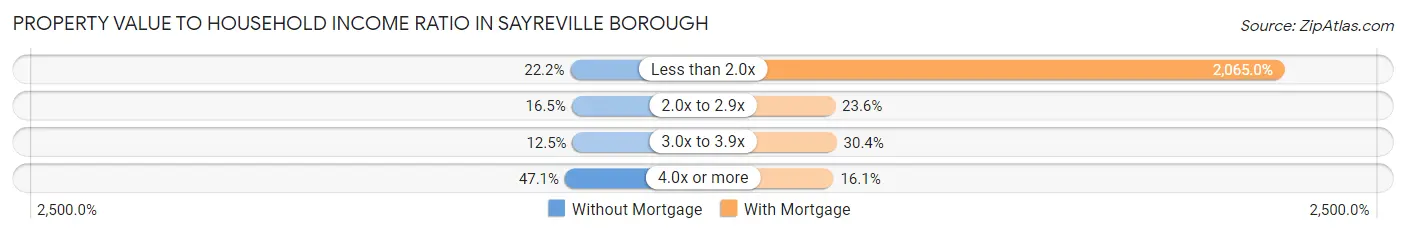
| Value-to-Income Ratio | Without Mortgage | With Mortgage |
| Less than 2.0x | 901 (22.2%) | 137,507 (2,065.0%) |
| 2.0x to 2.9x | 668 (16.5%) | 1,573 (23.6%) |
| 3.0x to 3.9x | 508 (12.5%) | 2,027 (30.4%) |
| 4.0x or more | 1,910 (47.1%) | 1,070 (16.1%) |
| Total | 4,059 (100.0%) | 6,659 (100.0%) |
Real Estate Taxes by Mortgage Status in Sayreville borough
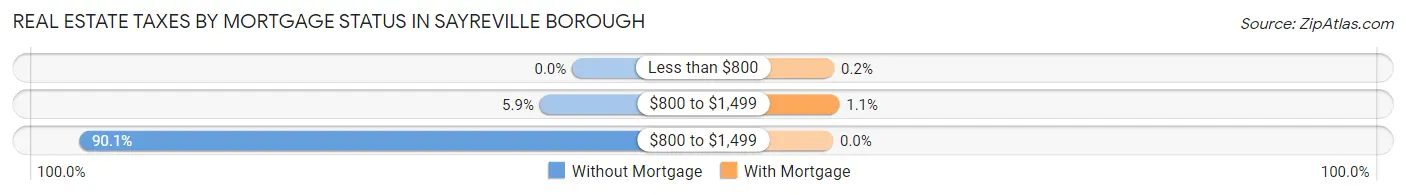
| Property Taxes | Without Mortgage | With Mortgage |
| Less than $800 | 0 (0.0%) | 13 (0.2%) |
| $800 to $1,499 | 240 (5.9%) | 76 (1.1%) |
| $800 to $1,499 | 3,656 (90.1%) | 0 (0.0%) |
| Total | 4,059 (100.0%) | 6,659 (100.0%) |
Health & Disability in Sayreville borough
Health Insurance Coverage by Age in Sayreville borough
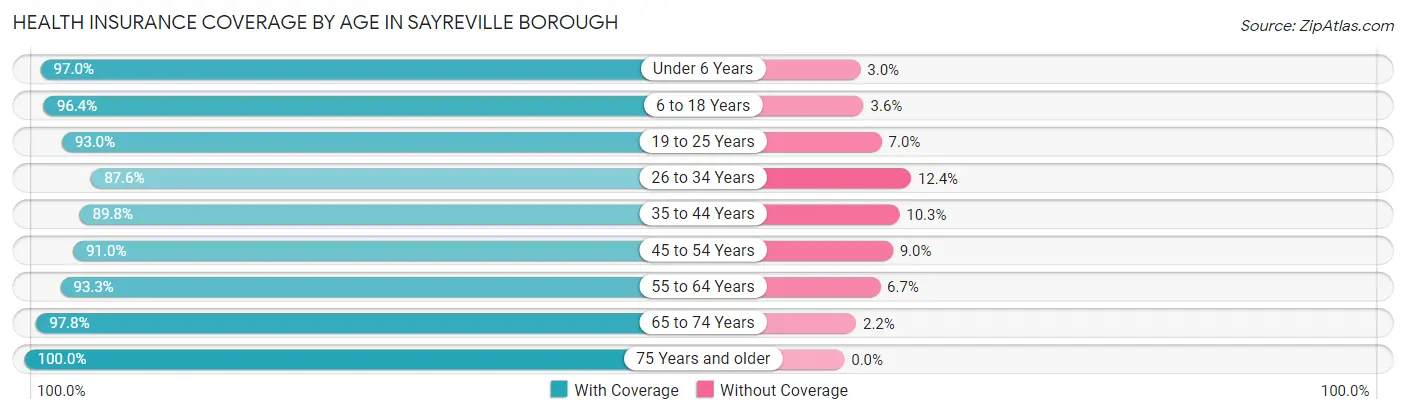
| Age Bracket | With Coverage | Without Coverage |
| Under 6 Years | 3,011 (97.0%) | 93 (3.0%) |
| 6 to 18 Years | 6,796 (96.4%) | 254 (3.6%) |
| 19 to 25 Years | 3,126 (93.0%) | 234 (7.0%) |
| 26 to 34 Years | 5,178 (87.6%) | 735 (12.4%) |
| 35 to 44 Years | 6,059 (89.7%) | 692 (10.2%) |
| 45 to 54 Years | 5,982 (91.0%) | 594 (9.0%) |
| 55 to 64 Years | 5,365 (93.3%) | 384 (6.7%) |
| 65 to 74 Years | 4,146 (97.8%) | 93 (2.2%) |
| 75 Years and older | 2,364 (100.0%) | 0 (0.0%) |
| Total | 42,027 (93.2%) | 3,079 (6.8%) |
Health Insurance Coverage by Citizenship Status in Sayreville borough
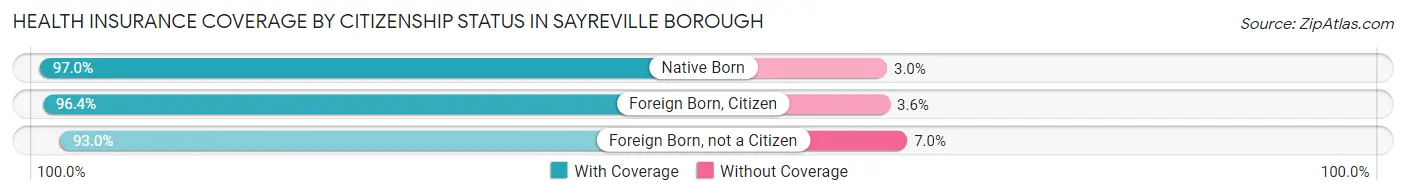
| Citizenship Status | With Coverage | Without Coverage |
| Native Born | 3,011 (97.0%) | 93 (3.0%) |
| Foreign Born, Citizen | 6,796 (96.4%) | 254 (3.6%) |
| Foreign Born, not a Citizen | 3,126 (93.0%) | 234 (7.0%) |
Health Insurance Coverage by Household Income in Sayreville borough
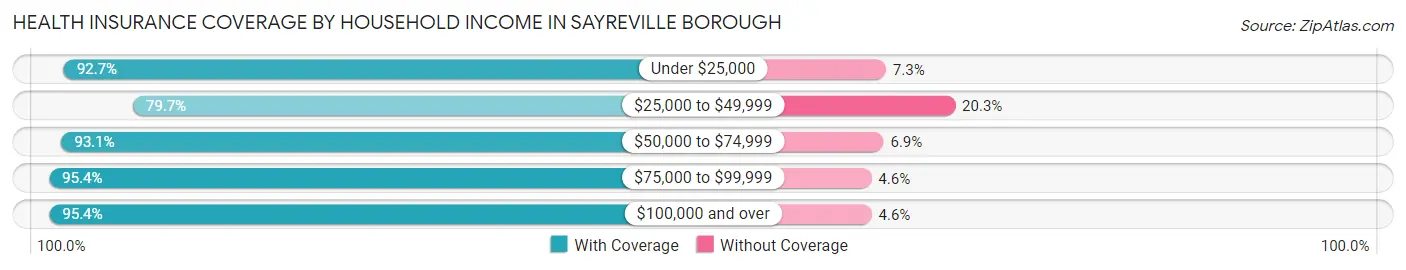
| Household Income | With Coverage | Without Coverage |
| Under $25,000 | 2,087 (92.7%) | 165 (7.3%) |
| $25,000 to $49,999 | 4,092 (79.7%) | 1,042 (20.3%) |
| $50,000 to $74,999 | 5,158 (93.1%) | 381 (6.9%) |
| $75,000 to $99,999 | 5,257 (95.4%) | 254 (4.6%) |
| $100,000 and over | 25,413 (95.4%) | 1,236 (4.6%) |
Public vs Private Health Insurance Coverage by Age in Sayreville borough
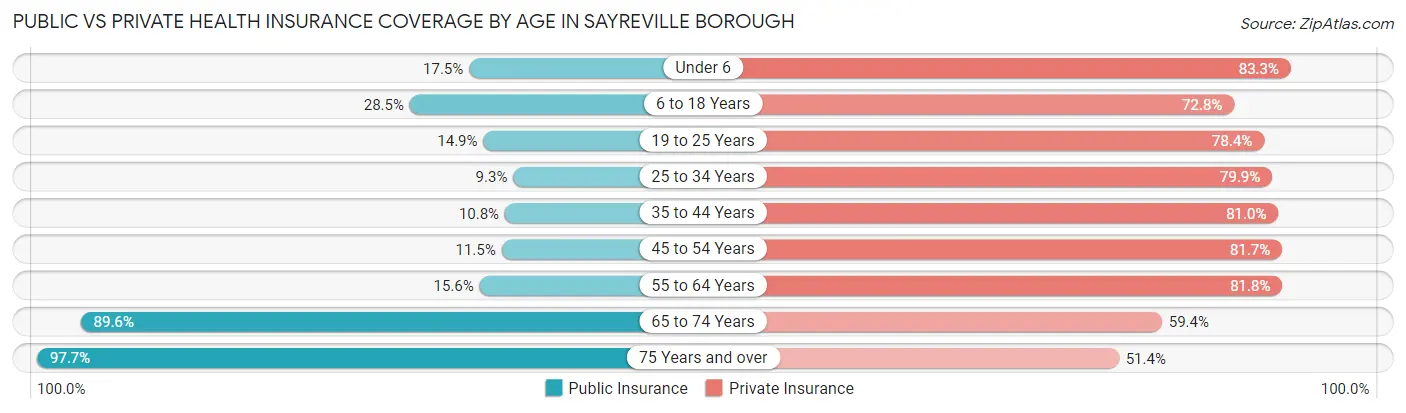
| Age Bracket | Public Insurance | Private Insurance |
| Under 6 | 543 (17.5%) | 2,587 (83.3%) |
| 6 to 18 Years | 2,009 (28.5%) | 5,134 (72.8%) |
| 19 to 25 Years | 499 (14.8%) | 2,634 (78.4%) |
| 25 to 34 Years | 550 (9.3%) | 4,723 (79.9%) |
| 35 to 44 Years | 732 (10.8%) | 5,468 (81.0%) |
| 45 to 54 Years | 754 (11.5%) | 5,373 (81.7%) |
| 55 to 64 Years | 894 (15.5%) | 4,700 (81.8%) |
| 65 to 74 Years | 3,798 (89.6%) | 2,518 (59.4%) |
| 75 Years and over | 2,310 (97.7%) | 1,215 (51.4%) |
| Total | 12,089 (26.8%) | 34,352 (76.2%) |
Disability Status by Sex by Age in Sayreville borough
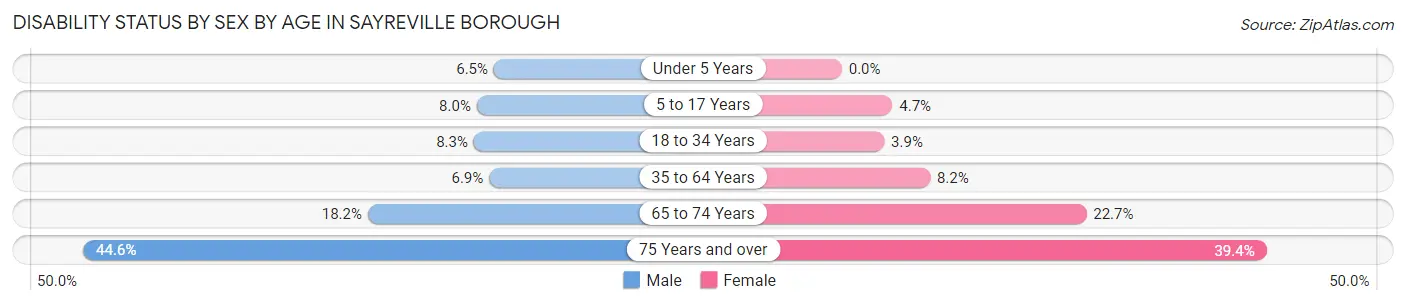
| Age Bracket | Male | Female |
| Under 5 Years | 99 (6.5%) | 0 (0.0%) |
| 5 to 17 Years | 271 (8.0%) | 171 (4.7%) |
| 18 to 34 Years | 438 (8.3%) | 176 (3.9%) |
| 35 to 64 Years | 672 (6.9%) | 763 (8.2%) |
| 65 to 74 Years | 395 (18.1%) | 468 (22.7%) |
| 75 Years and over | 435 (44.6%) | 547 (39.4%) |
Disability Class by Sex by Age in Sayreville borough
Disability Class: Hearing Difficulty
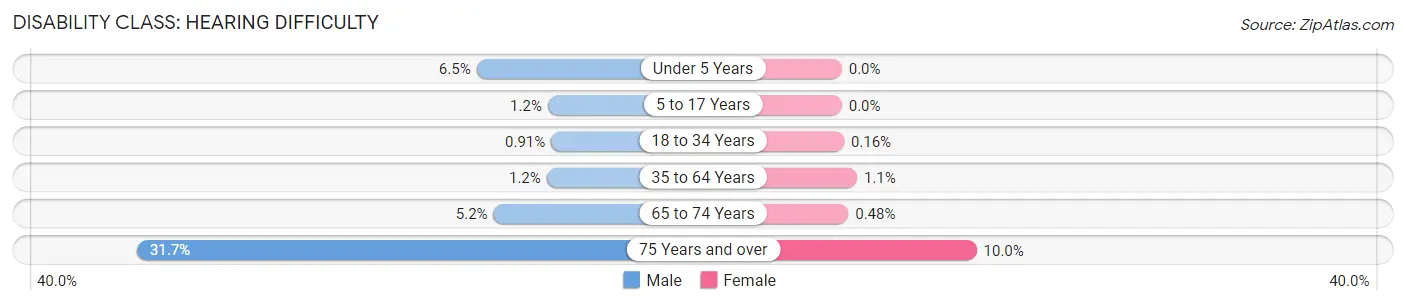
| Age Bracket | Male | Female |
| Under 5 Years | 99 (6.5%) | 0 (0.0%) |
| 5 to 17 Years | 39 (1.2%) | 0 (0.0%) |
| 18 to 34 Years | 48 (0.9%) | 7 (0.2%) |
| 35 to 64 Years | 121 (1.2%) | 105 (1.1%) |
| 65 to 74 Years | 113 (5.2%) | 10 (0.5%) |
| 75 Years and over | 309 (31.7%) | 139 (10.0%) |
Disability Class: Vision Difficulty
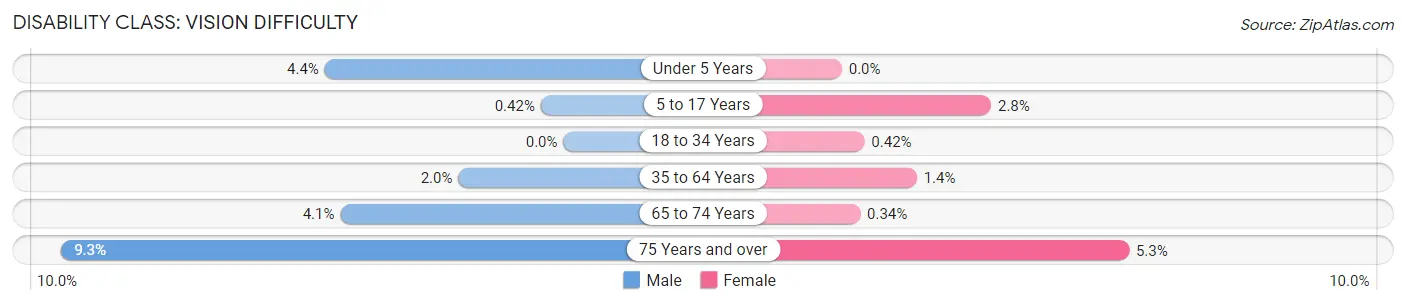
| Age Bracket | Male | Female |
| Under 5 Years | 68 (4.4%) | 0 (0.0%) |
| 5 to 17 Years | 14 (0.4%) | 101 (2.8%) |
| 18 to 34 Years | 0 (0.0%) | 19 (0.4%) |
| 35 to 64 Years | 190 (1.9%) | 130 (1.4%) |
| 65 to 74 Years | 90 (4.1%) | 7 (0.3%) |
| 75 Years and over | 91 (9.3%) | 74 (5.3%) |
Disability Class: Cognitive Difficulty
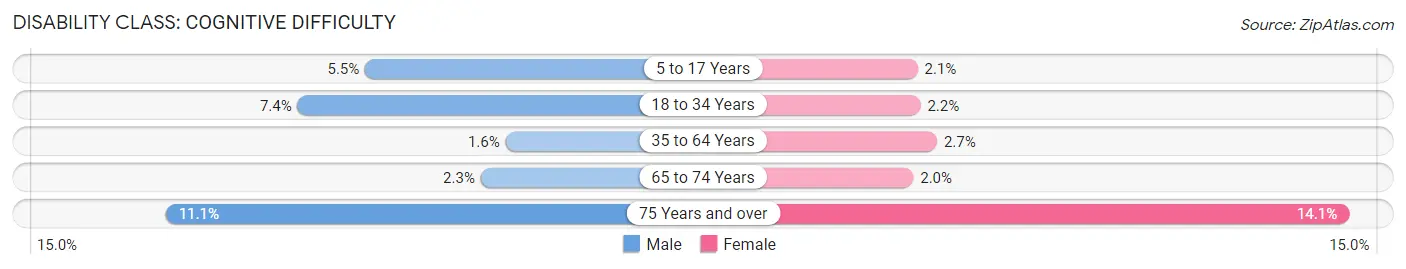
| Age Bracket | Male | Female |
| 5 to 17 Years | 186 (5.5%) | 77 (2.1%) |
| 18 to 34 Years | 390 (7.4%) | 98 (2.2%) |
| 35 to 64 Years | 157 (1.6%) | 247 (2.6%) |
| 65 to 74 Years | 50 (2.3%) | 41 (2.0%) |
| 75 Years and over | 108 (11.1%) | 196 (14.1%) |
Disability Class: Ambulatory Difficulty
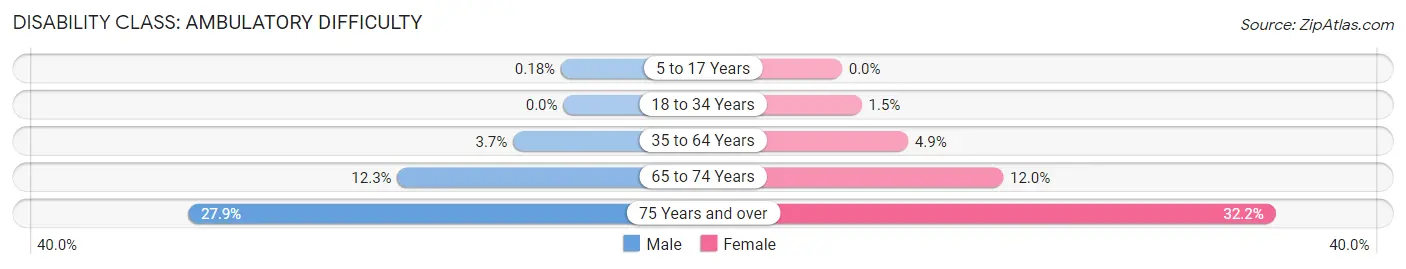
| Age Bracket | Male | Female |
| 5 to 17 Years | 6 (0.2%) | 0 (0.0%) |
| 18 to 34 Years | 0 (0.0%) | 66 (1.5%) |
| 35 to 64 Years | 364 (3.7%) | 458 (4.9%) |
| 65 to 74 Years | 268 (12.3%) | 247 (12.0%) |
| 75 Years and over | 272 (27.9%) | 447 (32.2%) |
Disability Class: Self-Care Difficulty
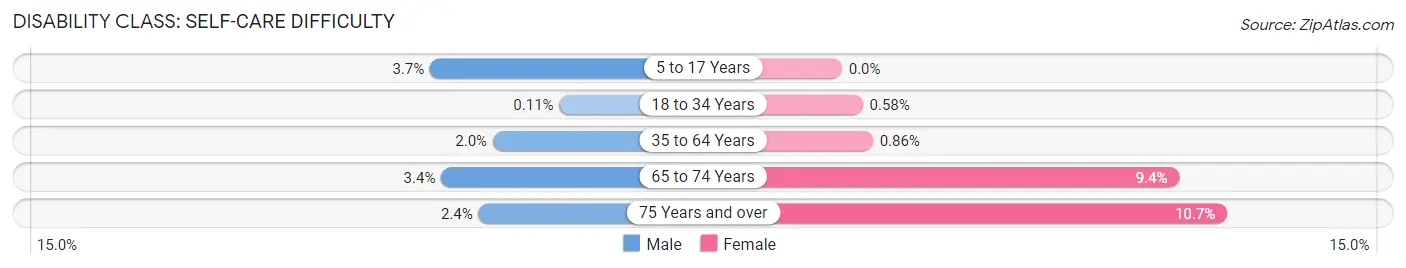
| Age Bracket | Male | Female |
| 5 to 17 Years | 125 (3.7%) | 0 (0.0%) |
| 18 to 34 Years | 6 (0.1%) | 26 (0.6%) |
| 35 to 64 Years | 191 (2.0%) | 80 (0.9%) |
| 65 to 74 Years | 74 (3.4%) | 194 (9.4%) |
| 75 Years and over | 23 (2.4%) | 149 (10.7%) |
Technology Access in Sayreville borough
Computing Device Access in Sayreville borough
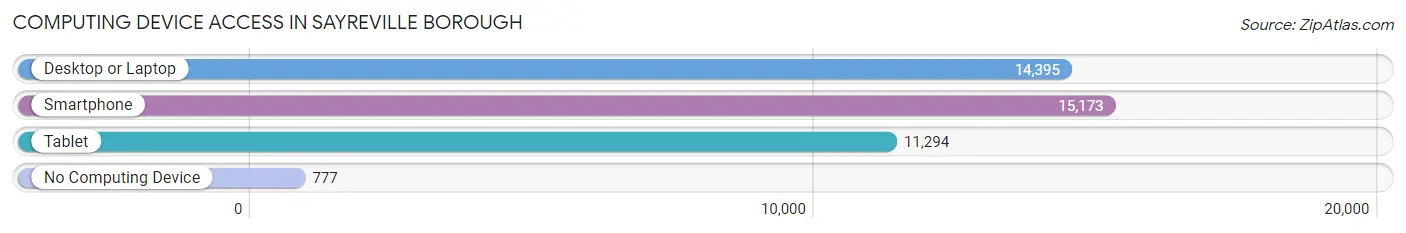
| Device Type | # Households | % Households |
| Desktop or Laptop | 14,395 | 85.4% |
| Smartphone | 15,173 | 90.0% |
| Tablet | 11,294 | 67.0% |
| No Computing Device | 777 | 4.6% |
| Total | 16,851 | 100.0% |
Internet Access in Sayreville borough
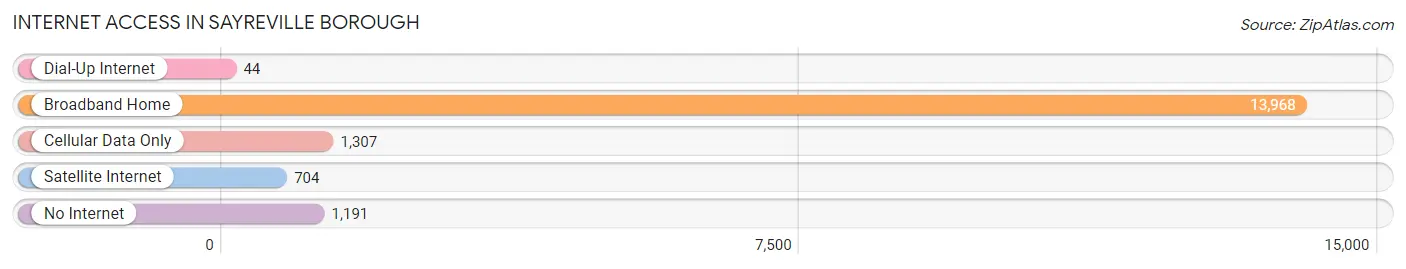
| Internet Type | # Households | % Households |
| Dial-Up Internet | 44 | 0.3% |
| Broadband Home | 13,968 | 82.9% |
| Cellular Data Only | 1,307 | 7.8% |
| Satellite Internet | 704 | 4.2% |
| No Internet | 1,191 | 7.1% |
| Total | 16,851 | 100.0% |
Sayreville borough Summary
Sayreville Borough is a small borough located in Middlesex County, New Jersey. It is situated on the Raritan River, and is part of the New York metropolitan area. The borough has a population of approximately 44,000 people, and is home to a diverse mix of cultures and backgrounds.
History
The area that is now Sayreville was originally inhabited by the Lenape Native Americans. The first European settlers arrived in the area in the late 1600s, and the area was officially incorporated as a borough in 1876. The borough was named after James Sayre, who was a prominent local landowner.
The borough experienced significant growth in the late 19th and early 20th centuries, as it became a popular destination for immigrants from Europe. The borough was also home to a number of factories and industries, which provided employment opportunities for many of the new arrivals.
Geography
Sayreville Borough is located in central New Jersey, and is situated on the Raritan River. The borough is bordered by South River to the north, Old Bridge Township to the east, South Amboy to the south, and Woodbridge Township to the west. The borough covers an area of approximately 8.5 square miles, and is home to a number of parks and recreational areas.
Economy
Sayreville Borough has a diverse economy, with a number of different industries represented. The borough is home to a number of manufacturing and industrial companies, including a number of pharmaceutical companies. The borough is also home to a number of retail stores, restaurants, and other businesses.
Demographics
As of the 2010 census, the population of Sayreville Borough was 44,000. The population is diverse, with a mix of different ethnic and racial backgrounds. The largest racial group is White (63.3%), followed by Hispanic or Latino (17.2%), Asian (7.7%), and African American (7.2%). The median household income is $68,000, and the median age is 40.
Conclusion
Sayreville Borough is a small borough located in Middlesex County, New Jersey. It is situated on the Raritan River, and is part of the New York metropolitan area. The borough has a population of approximately 44,000 people, and is home to a diverse mix of cultures and backgrounds. The borough has a diverse economy, with a number of different industries represented. The population is diverse, with a mix of different ethnic and racial backgrounds. Sayreville Borough is a vibrant and diverse community, and is a great place to live and work.
Common Questions
What is Per Capita Income in Sayreville borough?
Per Capita income in Sayreville borough is $43,127.
What is the Median Family Income in Sayreville borough?
Median Family Income in Sayreville borough is $111,634.
What is the Median Household income in Sayreville borough?
Median Household Income in Sayreville borough is $95,250.
What is Income or Wage Gap in Sayreville borough?
Income or Wage Gap in Sayreville borough is 26.6%.
Women in Sayreville borough earn 73.4 cents for every dollar earned by a man.
What is Inequality or Gini Index in Sayreville borough?
Inequality or Gini Index in Sayreville borough is 0.38.
What is the Total Population of Sayreville borough?
Total Population of Sayreville borough is 45,136.
What is the Total Male Population of Sayreville borough?
Total Male Population of Sayreville borough is 23,077.
What is the Total Female Population of Sayreville borough?
Total Female Population of Sayreville borough is 22,059.
What is the Ratio of Males per 100 Females in Sayreville borough?
There are 104.61 Males per 100 Females in Sayreville borough.
What is the Ratio of Females per 100 Males in Sayreville borough?
There are 95.59 Females per 100 Males in Sayreville borough.
What is the Median Population Age in Sayreville borough?
Median Population Age in Sayreville borough is 39.1 Years.
What is the Average Family Size in Sayreville borough
Average Family Size in Sayreville borough is 3.2 People.
What is the Average Household Size in Sayreville borough
Average Household Size in Sayreville borough is 2.7 People.
How Large is the Labor Force in Sayreville borough?
There are 25,488 People in the Labor Forcein in Sayreville borough.
What is the Percentage of People in the Labor Force in Sayreville borough?
69.6% of People are in the Labor Force in Sayreville borough.
What is the Unemployment Rate in Sayreville borough?
Unemployment Rate in Sayreville borough is 5.4%.