Dumont borough, NJ Map & Demographics
Dumont borough Overview
$52,142
PER CAPITA INCOME
$135,125
AVG FAMILY INCOME
$116,708
AVG HOUSEHOLD INCOME
39.5%
WAGE / INCOME GAP [ % ]
60.5¢/ $1
WAGE / INCOME GAP [ $ ]
$10,113
FAMILY INCOME DEFICIT
0.43
INEQUALITY / GINI INDEX
18,014
TOTAL POPULATION
8,561
MALE POPULATION
9,453
FEMALE POPULATION
90.56
MALES / 100 FEMALES
110.42
FEMALES / 100 MALES
42.3
MEDIAN AGE
3.3
AVG FAMILY SIZE
2.7
AVG HOUSEHOLD SIZE
10,499
LABOR FORCE [ PEOPLE ]
69.3%
PERCENT IN LABOR FORCE
5.1%
UNEMPLOYMENT RATE
Income in Dumont borough
Income Overview in Dumont borough
Per Capita Income in Dumont borough is $52,142, while median incomes of families and households are $135,125 and $116,708 respectively.
| Characteristic | Number | Measure |
| Per Capita Income | 18,014 | $52,142 |
| Median Family Income | 4,867 | $135,125 |
| Mean Family Income | 4,867 | $161,407 |
| Median Household Income | 6,593 | $116,708 |
| Mean Household Income | 6,593 | $140,251 |
| Income Deficit | 4,867 | $10,113 |
| Wage / Income Gap (%) | 18,014 | 39.47% |
| Wage / Income Gap ($) | 18,014 | 60.53¢ per $1 |
| Gini / Inequality Index | 18,014 | 0.43 |
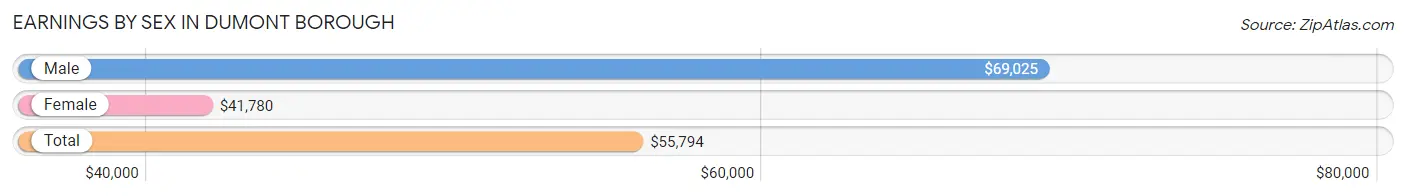
Earnings by Sex in Dumont borough
Average Earnings in Dumont borough are $55,794, $69,025 for men and $41,780 for women, a difference of 39.5%.
| Sex | Number | Average Earnings |
| Male | 5,271 (49.3%) | $69,025 |
| Female | 5,411 (50.7%) | $41,780 |
| Total | 10,682 (100.0%) | $55,794 |
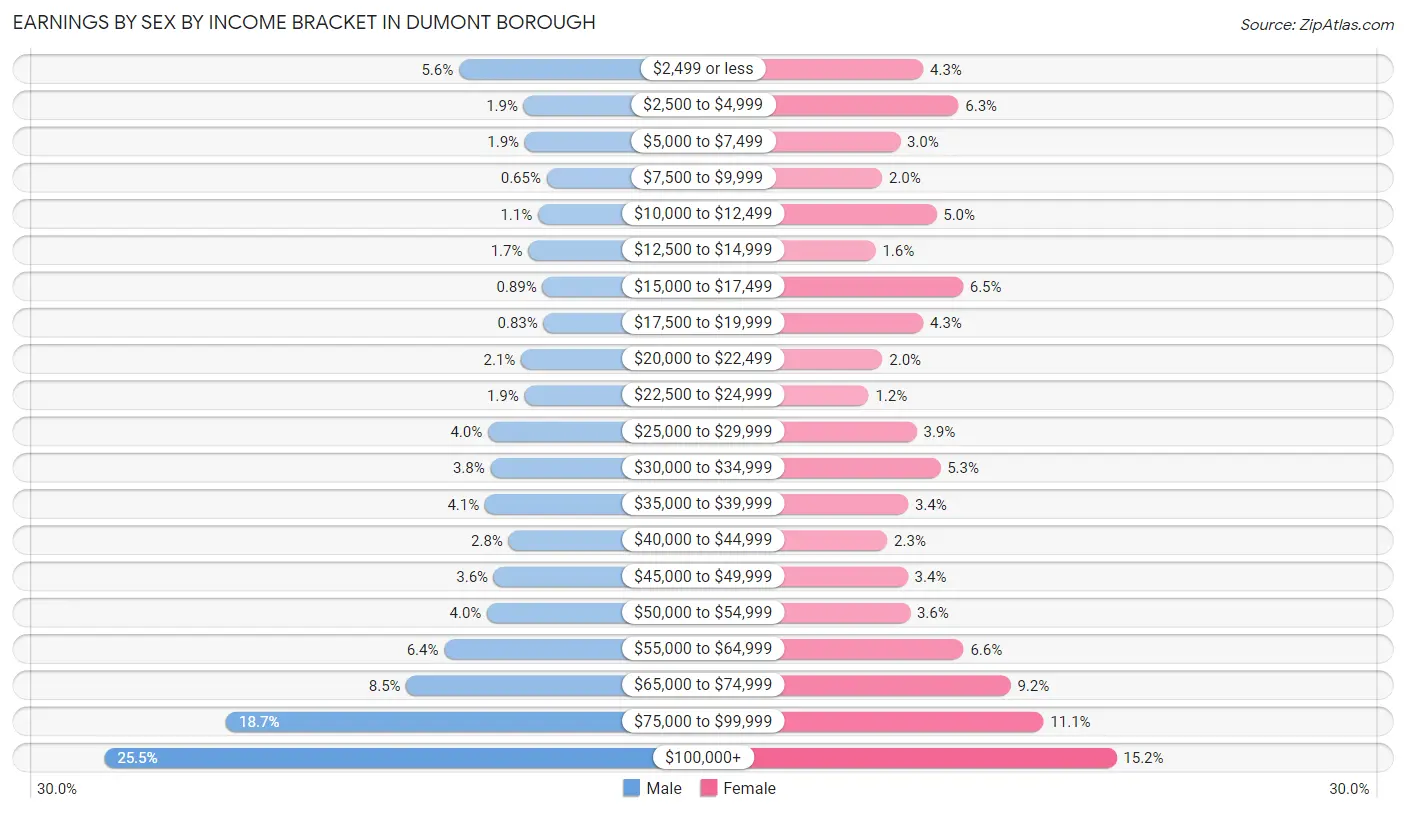
Earnings by Sex by Income Bracket in Dumont borough
The most common earnings brackets in Dumont borough are $100,000+ for men (1,345 | 25.5%) and $100,000+ for women (820 | 15.1%).
| Income | Male | Female |
| $2,499 or less | 294 (5.6%) | 232 (4.3%) |
| $2,500 to $4,999 | 102 (1.9%) | 339 (6.3%) |
| $5,000 to $7,499 | 99 (1.9%) | 162 (3.0%) |
| $7,500 to $9,999 | 34 (0.6%) | 107 (2.0%) |
| $10,000 to $12,499 | 60 (1.1%) | 272 (5.0%) |
| $12,500 to $14,999 | 89 (1.7%) | 87 (1.6%) |
| $15,000 to $17,499 | 47 (0.9%) | 353 (6.5%) |
| $17,500 to $19,999 | 44 (0.8%) | 232 (4.3%) |
| $20,000 to $22,499 | 110 (2.1%) | 108 (2.0%) |
| $22,500 to $24,999 | 100 (1.9%) | 66 (1.2%) |
| $25,000 to $29,999 | 208 (4.0%) | 212 (3.9%) |
| $30,000 to $34,999 | 201 (3.8%) | 284 (5.2%) |
| $35,000 to $39,999 | 217 (4.1%) | 186 (3.4%) |
| $40,000 to $44,999 | 147 (2.8%) | 123 (2.3%) |
| $45,000 to $49,999 | 191 (3.6%) | 185 (3.4%) |
| $50,000 to $54,999 | 211 (4.0%) | 192 (3.5%) |
| $55,000 to $64,999 | 338 (6.4%) | 355 (6.6%) |
| $65,000 to $74,999 | 450 (8.5%) | 498 (9.2%) |
| $75,000 to $99,999 | 984 (18.7%) | 598 (11.1%) |
| $100,000+ | 1,345 (25.5%) | 820 (15.1%) |
| Total | 5,271 (100.0%) | 5,411 (100.0%) |
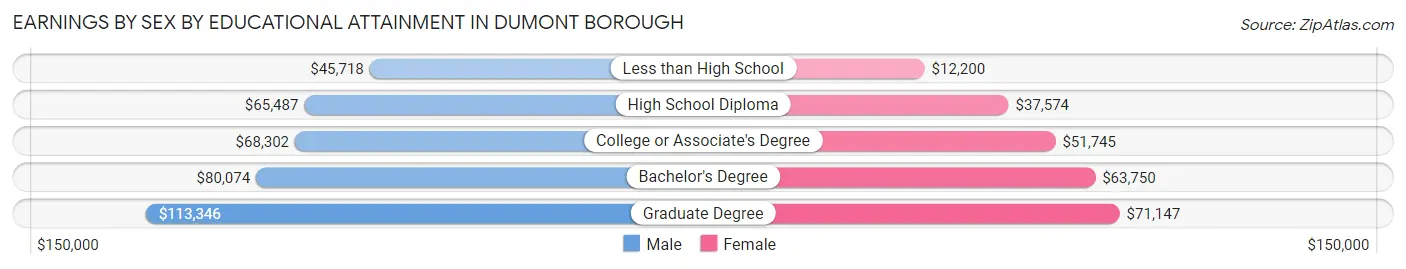
Earnings by Sex by Educational Attainment in Dumont borough
Average earnings in Dumont borough are $73,500 for men and $52,052 for women, a difference of 29.2%. Men with an educational attainment of graduate degree enjoy the highest average annual earnings of $113,346, while those with less than high school education earn the least with $45,718. Women with an educational attainment of graduate degree earn the most with the average annual earnings of $71,147, while those with less than high school education have the smallest earnings of $12,200.
| Educational Attainment | Male Income | Female Income |
| Less than High School | $45,718 | $12,200 |
| High School Diploma | $65,487 | $37,574 |
| College or Associate's Degree | $68,302 | $51,745 |
| Bachelor's Degree | $80,074 | $63,750 |
| Graduate Degree | $113,346 | $71,147 |
| Total | $73,500 | $52,052 |
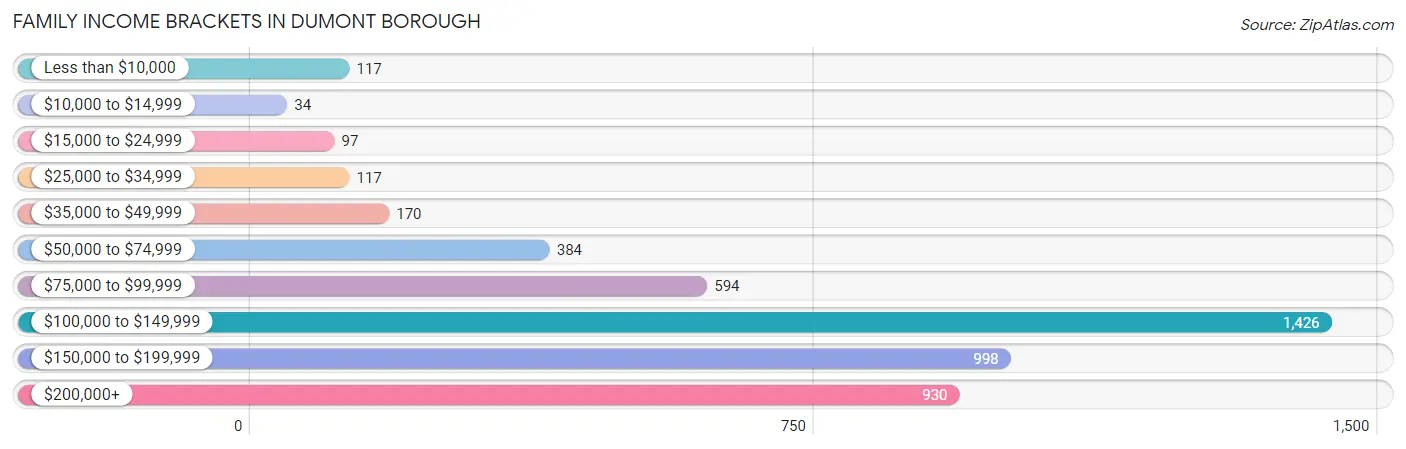
Family Income in Dumont borough
Family Income Brackets in Dumont borough
According to the Dumont borough family income data, there are 1,426 families falling into the $100,000 to $149,999 income range, which is the most common income bracket and makes up 29.3% of all families. Conversely, the $10,000 to $14,999 income bracket is the least frequent group with only 34 families (0.7%) belonging to this category.
| Income Bracket | # Families | % Families |
| Less than $10,000 | 117 | 2.4% |
| $10,000 to $14,999 | 34 | 0.7% |
| $15,000 to $24,999 | 97 | 2.0% |
| $25,000 to $34,999 | 117 | 2.4% |
| $35,000 to $49,999 | 170 | 3.5% |
| $50,000 to $74,999 | 384 | 7.9% |
| $75,000 to $99,999 | 594 | 12.2% |
| $100,000 to $149,999 | 1,426 | 29.3% |
| $150,000 to $199,999 | 998 | 20.5% |
| $200,000+ | 930 | 19.1% |
Family Income by Famaliy Size in Dumont borough
4-person families (1,119 | 23.0%) account for the highest median family income in Dumont borough with $164,081 per family, while 2-person families (1,700 | 34.9%) have the highest median income of $59,744 per family member.
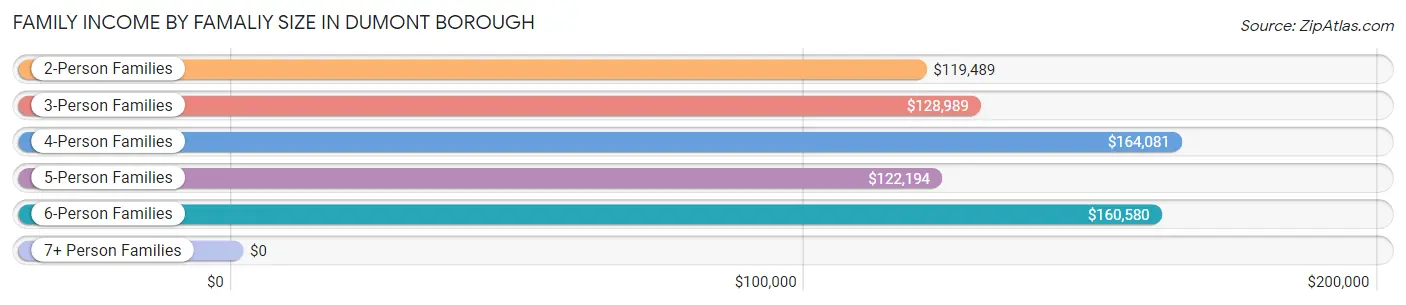
| Income Bracket | # Families | Median Income |
| 2-Person Families | 1,700 (34.9%) | $119,489 |
| 3-Person Families | 1,516 (31.1%) | $128,989 |
| 4-Person Families | 1,119 (23.0%) | $164,081 |
| 5-Person Families | 344 (7.1%) | $122,194 |
| 6-Person Families | 117 (2.4%) | $160,580 |
| 7+ Person Families | 71 (1.5%) | $0 |
| Total | 4,867 (100.0%) | $135,125 |
Family Income by Number of Earners in Dumont borough
The median family income in Dumont borough is $135,125, with families comprising 3+ earners (795) having the highest median family income of $191,065, while families with no earners (299) have the lowest median family income of $58,542, accounting for 16.3% and 6.1% of families, respectively.
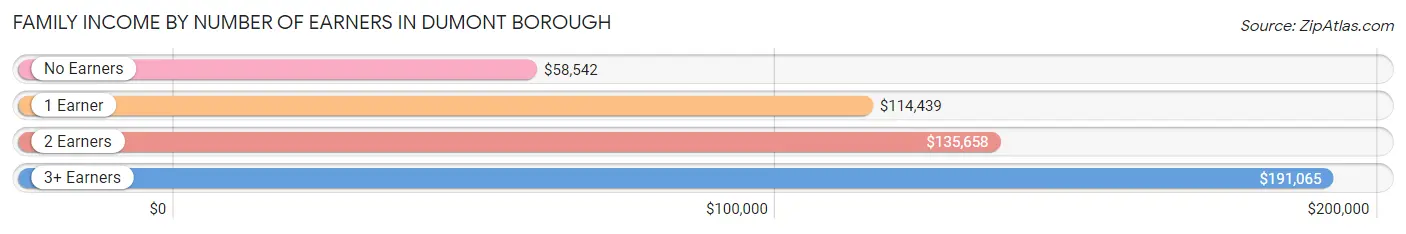
| Number of Earners | # Families | Median Income |
| No Earners | 299 (6.1%) | $58,542 |
| 1 Earner | 1,281 (26.3%) | $114,439 |
| 2 Earners | 2,492 (51.2%) | $135,658 |
| 3+ Earners | 795 (16.3%) | $191,065 |
| Total | 4,867 (100.0%) | $135,125 |
Household Income in Dumont borough
Household Income Brackets in Dumont borough
With 1,530 households falling in the category, the $100,000 to $149,999 income range is the most frequent in Dumont borough, accounting for 23.2% of all households. In contrast, only 119 households (1.8%) fall into the $10,000 to $14,999 income bracket, making it the least populous group.
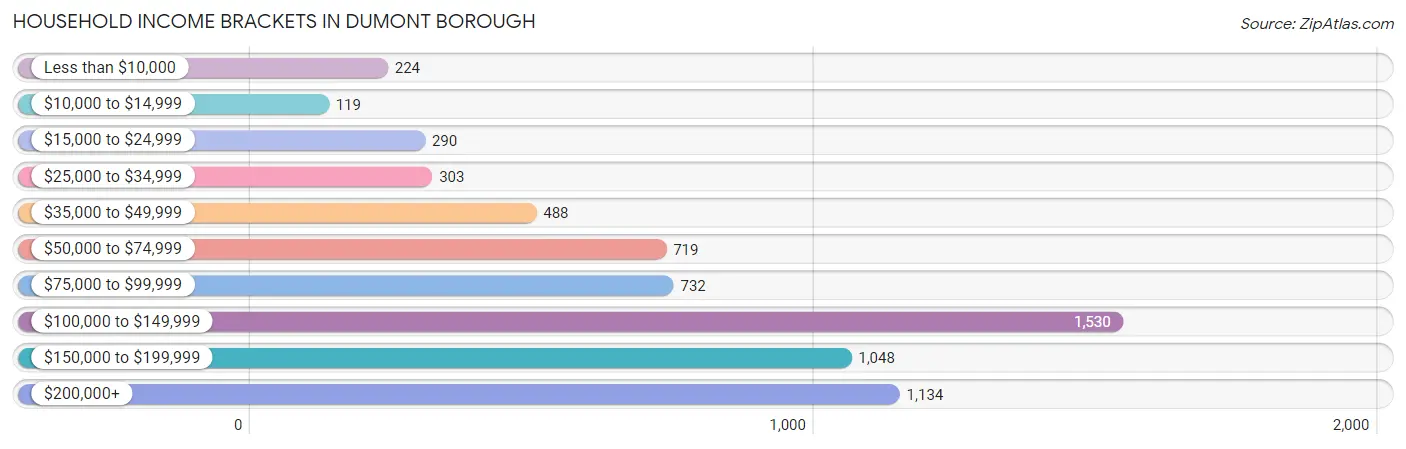
| Income Bracket | # Households | % Households |
| Less than $10,000 | 224 | 3.4% |
| $10,000 to $14,999 | 119 | 1.8% |
| $15,000 to $24,999 | 290 | 4.4% |
| $25,000 to $34,999 | 303 | 4.6% |
| $35,000 to $49,999 | 488 | 7.4% |
| $50,000 to $74,999 | 719 | 10.9% |
| $75,000 to $99,999 | 732 | 11.1% |
| $100,000 to $149,999 | 1,530 | 23.2% |
| $150,000 to $199,999 | 1,048 | 15.9% |
| $200,000+ | 1,134 | 17.2% |
Household Income by Householder Age in Dumont borough
The median household income in Dumont borough is $116,708, with the highest median household income of $136,485 found in the 45 to 64 years age bracket for the primary householder. A total of 3,119 households (47.3%) fall into this category.
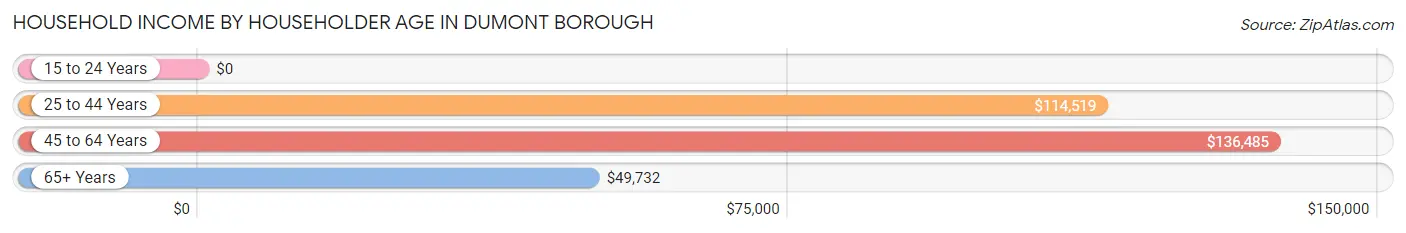
| Income Bracket | # Households | Median Income |
| 15 to 24 Years | 0 (0.0%) | $0 |
| 25 to 44 Years | 1,824 (27.7%) | $114,519 |
| 45 to 64 Years | 3,119 (47.3%) | $136,485 |
| 65+ Years | 1,650 (25.0%) | $49,732 |
| Total | 6,593 (100.0%) | $116,708 |
Poverty in Dumont borough
Income Below Poverty by Sex and Age in Dumont borough
With 5.0% poverty level for males and 7.6% for females among the residents of Dumont borough, 12 to 14 year old males and 16 and 17 year old females are the most vulnerable to poverty, with 24 males (14.8%) and 69 females (27.8%) in their respective age groups living below the poverty level.
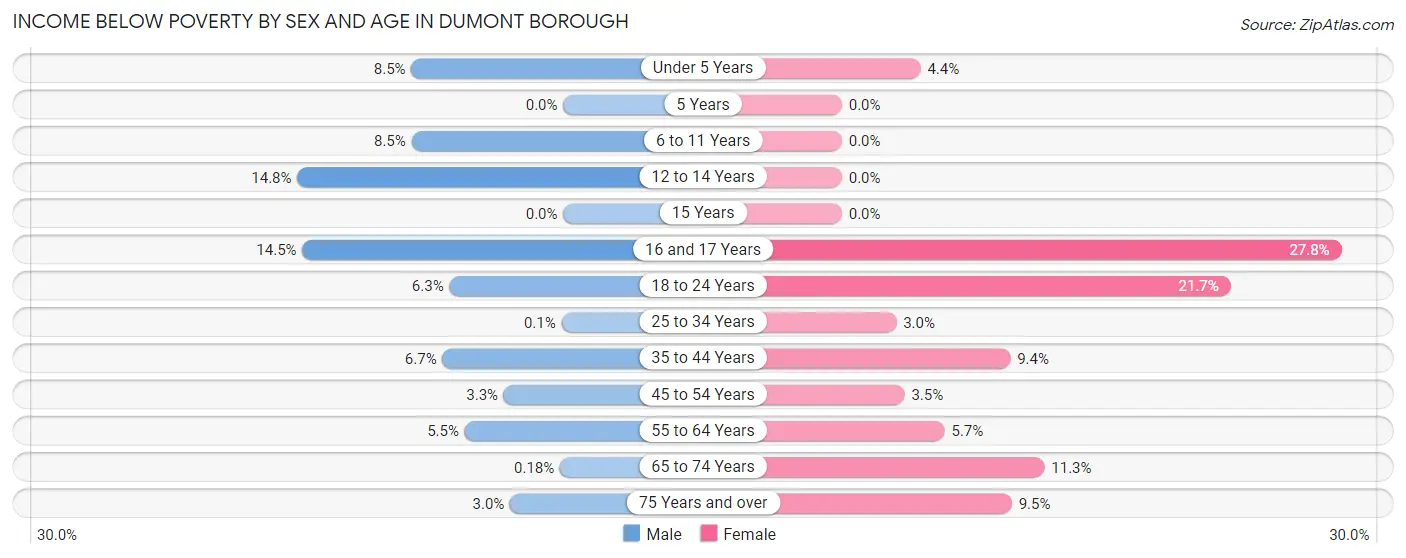
| Age Bracket | Male | Female |
| Under 5 Years | 23 (8.5%) | 20 (4.4%) |
| 5 Years | 0 (0.0%) | 0 (0.0%) |
| 6 to 11 Years | 53 (8.5%) | 0 (0.0%) |
| 12 to 14 Years | 24 (14.8%) | 0 (0.0%) |
| 15 Years | 0 (0.0%) | 0 (0.0%) |
| 16 and 17 Years | 42 (14.5%) | 69 (27.8%) |
| 18 to 24 Years | 64 (6.3%) | 184 (21.6%) |
| 25 to 34 Years | 1 (0.1%) | 31 (3.0%) |
| 35 to 44 Years | 69 (6.7%) | 98 (9.4%) |
| 45 to 54 Years | 35 (3.3%) | 38 (3.5%) |
| 55 to 64 Years | 101 (5.5%) | 109 (5.7%) |
| 65 to 74 Years | 1 (0.2%) | 80 (11.3%) |
| 75 Years and over | 16 (3.0%) | 92 (9.5%) |
| Total | 429 (5.0%) | 721 (7.6%) |
Income Above Poverty by Sex and Age in Dumont borough
According to the poverty statistics in Dumont borough, males aged 5 years and females aged 5 years are the age groups that are most secure financially, with 100.0% of males and 100.0% of females in these age groups living above the poverty line.
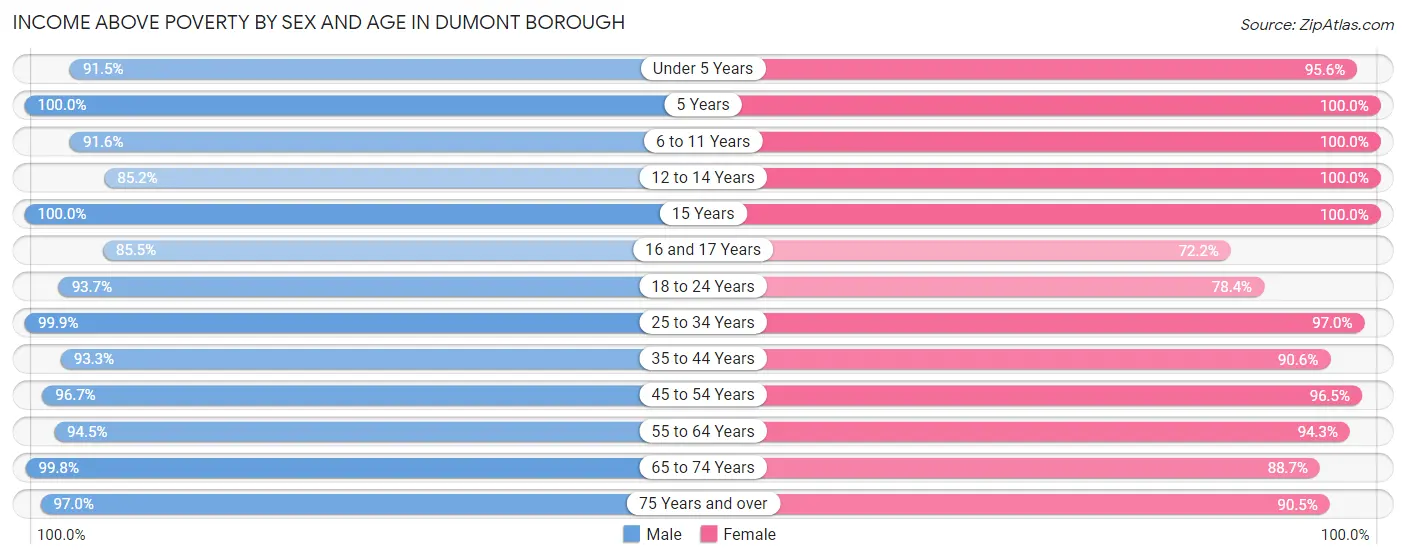
| Age Bracket | Male | Female |
| Under 5 Years | 249 (91.5%) | 437 (95.6%) |
| 5 Years | 63 (100.0%) | 40 (100.0%) |
| 6 to 11 Years | 574 (91.5%) | 688 (100.0%) |
| 12 to 14 Years | 138 (85.2%) | 369 (100.0%) |
| 15 Years | 114 (100.0%) | 42 (100.0%) |
| 16 and 17 Years | 247 (85.5%) | 179 (72.2%) |
| 18 to 24 Years | 945 (93.7%) | 666 (78.3%) |
| 25 to 34 Years | 999 (99.9%) | 992 (97.0%) |
| 35 to 44 Years | 956 (93.3%) | 947 (90.6%) |
| 45 to 54 Years | 1,022 (96.7%) | 1,050 (96.5%) |
| 55 to 64 Years | 1,739 (94.5%) | 1,797 (94.3%) |
| 65 to 74 Years | 547 (99.8%) | 629 (88.7%) |
| 75 Years and over | 524 (97.0%) | 881 (90.5%) |
| Total | 8,117 (95.0%) | 8,717 (92.4%) |
Income Below Poverty Among Married-Couple Families in Dumont borough
The poverty statistics for married-couple families in Dumont borough show that 3.0% or 120 of the total 4,018 families live below the poverty line. Families with 3 or 4 children have the highest poverty rate of 8.6%, comprising of 25 families. On the other hand, families with 1 or 2 children have the lowest poverty rate of 1.2%, which includes 16 families.
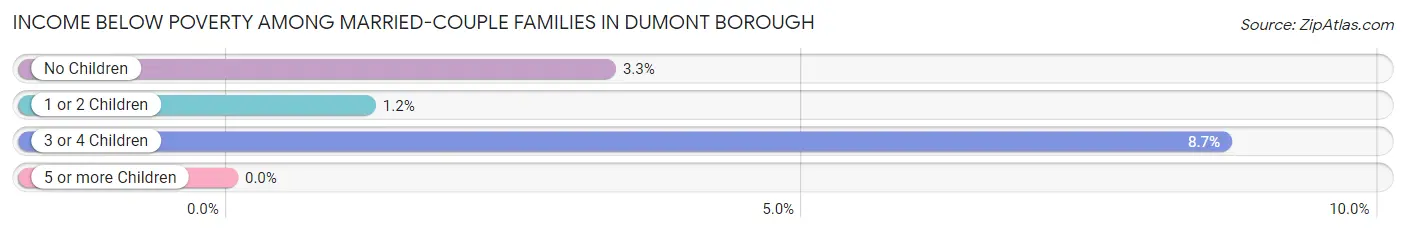
| Children | Above Poverty | Below Poverty |
| No Children | 2,321 (96.7%) | 79 (3.3%) |
| 1 or 2 Children | 1,313 (98.8%) | 16 (1.2%) |
| 3 or 4 Children | 264 (91.3%) | 25 (8.6%) |
| 5 or more Children | 0 (0.0%) | 0 (0.0%) |
| Total | 3,898 (97.0%) | 120 (3.0%) |
Income Below Poverty Among Single-Parent Households in Dumont borough
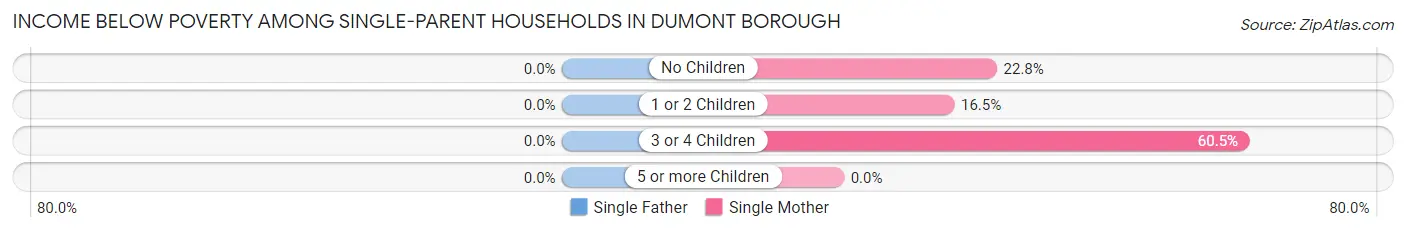
| Children | Single Father | Single Mother |
| No Children | 0 (0.0%) | 85 (22.8%) |
| 1 or 2 Children | 0 (0.0%) | 38 (16.5%) |
| 3 or 4 Children | 0 (0.0%) | 23 (60.5%) |
| 5 or more Children | 0 (0.0%) | 0 (0.0%) |
| Total | 0 (0.0%) | 146 (22.7%) |
Income Below Poverty Among Married-Couple vs Single-Parent Households in Dumont borough
The poverty data for Dumont borough shows that 120 of the married-couple family households (3.0%) and 146 of the single-parent households (17.2%) are living below the poverty level. Within the married-couple family households, those with 3 or 4 children have the highest poverty rate, with 25 households (8.6%) falling below the poverty line. Among the single-parent households, those with 3 or 4 children have the highest poverty rate, with 23 household (60.5%) living below poverty.
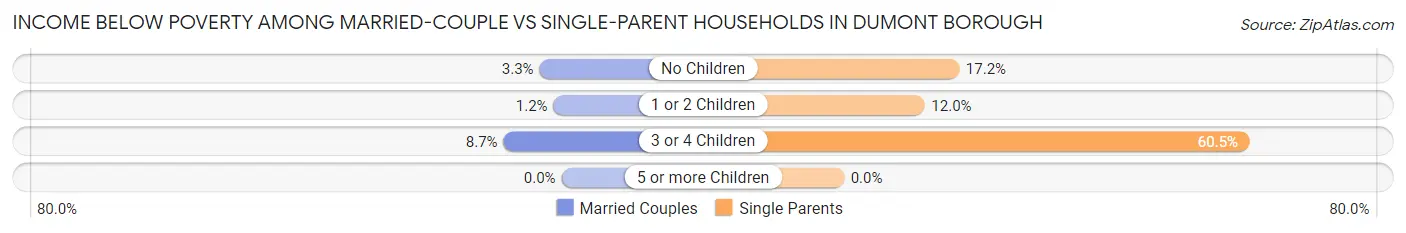
| Children | Married-Couple Families | Single-Parent Households |
| No Children | 79 (3.3%) | 85 (17.2%) |
| 1 or 2 Children | 16 (1.2%) | 38 (12.0%) |
| 3 or 4 Children | 25 (8.6%) | 23 (60.5%) |
| 5 or more Children | 0 (0.0%) | 0 (0.0%) |
| Total | 120 (3.0%) | 146 (17.2%) |
Race in Dumont borough
The most populous races in Dumont borough are White / Caucasian (10,867 | 60.3%), Hispanic or Latino (3,970 | 22.0%), and Asian (3,304 | 18.3%).
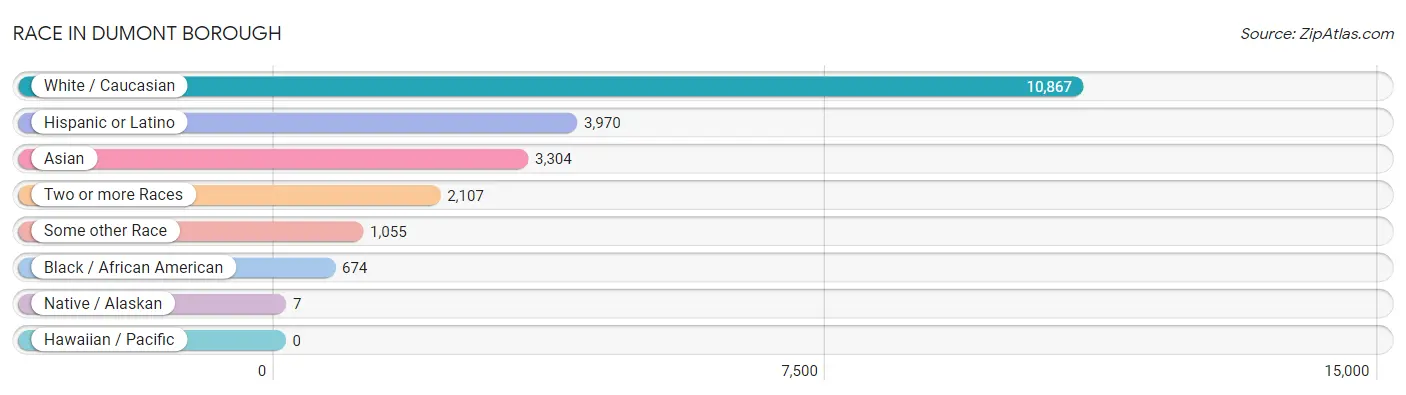
| Race | # Population | % Population |
| Asian | 3,304 | 18.3% |
| Black / African American | 674 | 3.7% |
| Hawaiian / Pacific | 0 | 0.0% |
| Hispanic or Latino | 3,970 | 22.0% |
| Native / Alaskan | 7 | 0.0% |
| White / Caucasian | 10,867 | 60.3% |
| Two or more Races | 2,107 | 11.7% |
| Some other Race | 1,055 | 5.9% |
| Total | 18,014 | 100.0% |
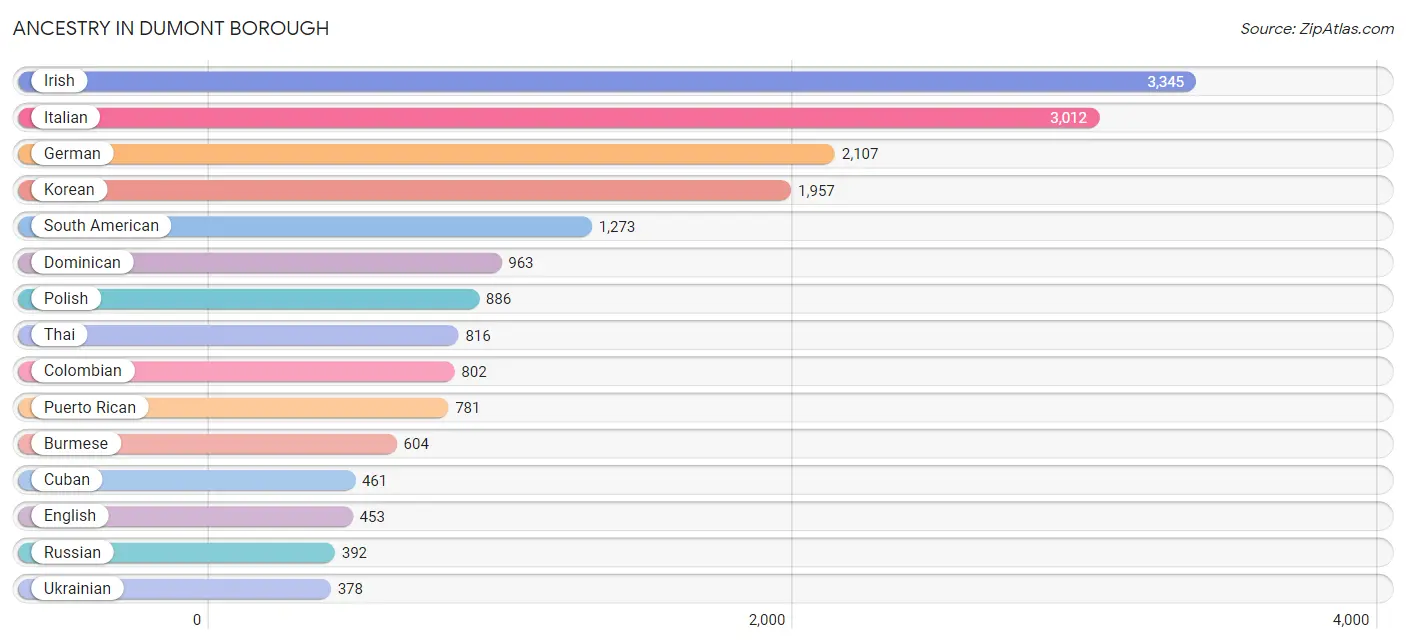
Ancestry in Dumont borough
The most populous ancestries reported in Dumont borough are Irish (3,345 | 18.6%), Italian (3,012 | 16.7%), German (2,107 | 11.7%), Korean (1,957 | 10.9%), and South American (1,273 | 7.1%), together accounting for 64.9% of all Dumont borough residents.
| Ancestry | # Population | % Population |
| Afghan | 80 | 0.4% |
| African | 214 | 1.2% |
| Albanian | 99 | 0.5% |
| American | 310 | 1.7% |
| Arab | 83 | 0.5% |
| Argentinean | 78 | 0.4% |
| Armenian | 67 | 0.4% |
| Assyrian / Chaldean / Syriac | 43 | 0.2% |
| Austrian | 23 | 0.1% |
| Bhutanese | 34 | 0.2% |
| British | 9 | 0.1% |
| Bulgarian | 44 | 0.2% |
| Burmese | 604 | 3.4% |
| Central American | 197 | 1.1% |
| Cherokee | 7 | 0.0% |
| Chilean | 47 | 0.3% |
| Colombian | 802 | 4.4% |
| Croatian | 28 | 0.2% |
| Cuban | 461 | 2.6% |
| Cypriot | 127 | 0.7% |
| Czech | 75 | 0.4% |
| Danish | 15 | 0.1% |
| Dominican | 963 | 5.3% |
| Dutch | 122 | 0.7% |
| Eastern European | 32 | 0.2% |
| Ecuadorian | 72 | 0.4% |
| English | 453 | 2.5% |
| Ethiopian | 7 | 0.0% |
| European | 91 | 0.5% |
| French | 199 | 1.1% |
| French Canadian | 16 | 0.1% |
| German | 2,107 | 11.7% |
| Ghanaian | 32 | 0.2% |
| Guatemalan | 25 | 0.1% |
| Honduran | 161 | 0.9% |
| Hungarian | 76 | 0.4% |
| Indian (Asian) | 180 | 1.0% |
| Indonesian | 17 | 0.1% |
| Irish | 3,345 | 18.6% |
| Italian | 3,012 | 16.7% |
| Jamaican | 101 | 0.6% |
| Korean | 1,957 | 10.9% |
| Latvian | 25 | 0.1% |
| Lebanese | 47 | 0.3% |
| Lithuanian | 38 | 0.2% |
| Maltese | 74 | 0.4% |
| Mexican | 225 | 1.3% |
| Norwegian | 33 | 0.2% |
| Pakistani | 101 | 0.6% |
| Palestinian | 6 | 0.0% |
| Panamanian | 11 | 0.1% |
| Peruvian | 274 | 1.5% |
| Polish | 886 | 4.9% |
| Portuguese | 138 | 0.8% |
| Puerto Rican | 781 | 4.3% |
| Romanian | 103 | 0.6% |
| Russian | 392 | 2.2% |
| Scandinavian | 18 | 0.1% |
| Scottish | 79 | 0.4% |
| Slovak | 29 | 0.2% |
| South American | 1,273 | 7.1% |
| Spaniard | 55 | 0.3% |
| Subsaharan African | 221 | 1.2% |
| Swedish | 15 | 0.1% |
| Swiss | 18 | 0.1% |
| Syrian | 30 | 0.2% |
| Thai | 816 | 4.5% |
| Turkish | 70 | 0.4% |
| Ukrainian | 378 | 2.1% |
| West Indian | 27 | 0.2% | View All 70 Rows |
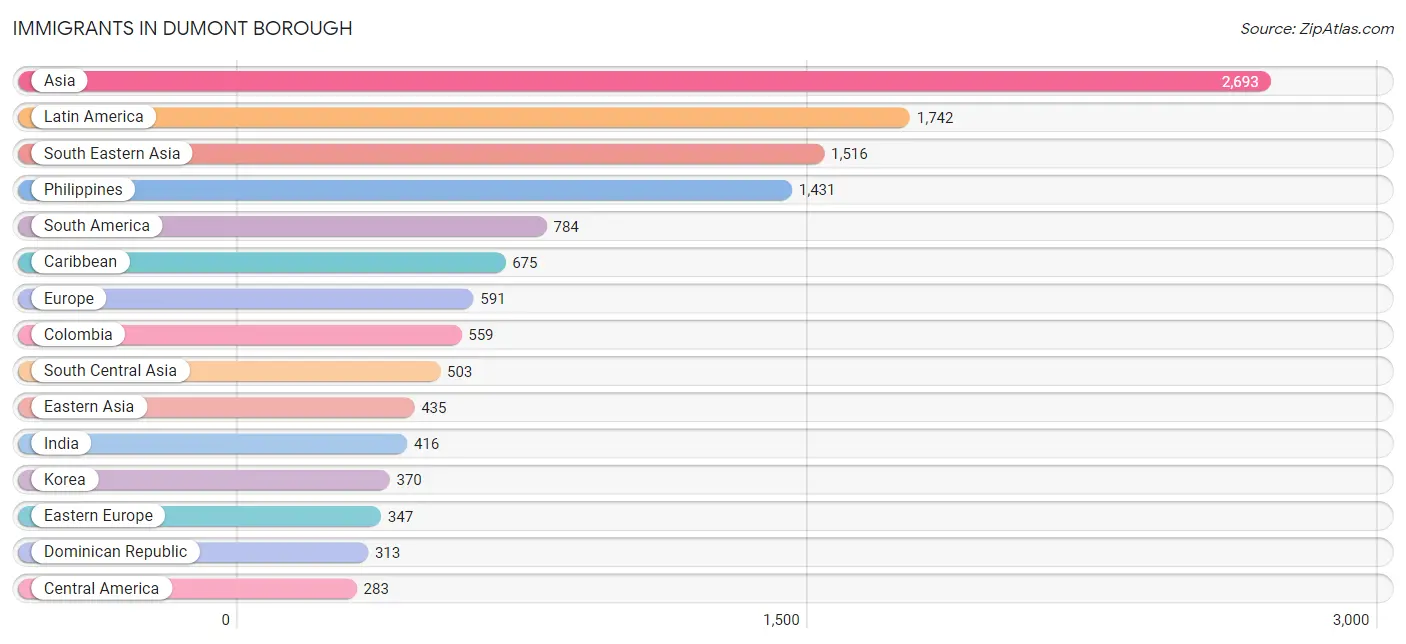
Immigrants in Dumont borough
The most numerous immigrant groups reported in Dumont borough came from Asia (2,693 | 14.9%), Latin America (1,742 | 9.7%), South Eastern Asia (1,516 | 8.4%), Philippines (1,431 | 7.9%), and South America (784 | 4.3%), together accounting for 45.3% of all Dumont borough residents.
| Immigration Origin | # Population | % Population |
| Afghanistan | 48 | 0.3% |
| Africa | 74 | 0.4% |
| Albania | 17 | 0.1% |
| Asia | 2,693 | 14.9% |
| Austria | 8 | 0.0% |
| Bangladesh | 9 | 0.1% |
| Brazil | 21 | 0.1% |
| Bulgaria | 44 | 0.2% |
| Caribbean | 675 | 3.7% |
| Central America | 283 | 1.6% |
| China | 65 | 0.4% |
| Colombia | 559 | 3.1% |
| Cuba | 222 | 1.2% |
| Czechoslovakia | 47 | 0.3% |
| Dominican Republic | 313 | 1.7% |
| Eastern Asia | 435 | 2.4% |
| Eastern Europe | 347 | 1.9% |
| Ecuador | 36 | 0.2% |
| England | 12 | 0.1% |
| Europe | 591 | 3.3% |
| Germany | 70 | 0.4% |
| Ghana | 41 | 0.2% |
| Guatemala | 25 | 0.1% |
| Guyana | 28 | 0.2% |
| Honduras | 84 | 0.5% |
| Hong Kong | 37 | 0.2% |
| India | 416 | 2.3% |
| Ireland | 85 | 0.5% |
| Israel | 12 | 0.1% |
| Italy | 19 | 0.1% |
| Jamaica | 37 | 0.2% |
| Korea | 370 | 2.1% |
| Kuwait | 11 | 0.1% |
| Latin America | 1,742 | 9.7% |
| Lebanon | 29 | 0.2% |
| Mexico | 163 | 0.9% |
| Northern Europe | 97 | 0.5% |
| Pakistan | 9 | 0.1% |
| Panama | 11 | 0.1% |
| Peru | 140 | 0.8% |
| Philippines | 1,431 | 7.9% |
| Poland | 76 | 0.4% |
| Portugal | 25 | 0.1% |
| Russia | 12 | 0.1% |
| Saudi Arabia | 12 | 0.1% |
| South America | 784 | 4.3% |
| South Central Asia | 503 | 2.8% |
| South Eastern Asia | 1,516 | 8.4% |
| Southern Europe | 69 | 0.4% |
| Spain | 25 | 0.1% |
| Syria | 50 | 0.3% |
| Thailand | 68 | 0.4% |
| Trinidad and Tobago | 103 | 0.6% |
| Turkey | 34 | 0.2% |
| Ukraine | 111 | 0.6% |
| Uzbekistan | 21 | 0.1% |
| Western Africa | 74 | 0.4% |
| Western Asia | 239 | 1.3% |
| Western Europe | 78 | 0.4% | View All 59 Rows |
Sex and Age in Dumont borough
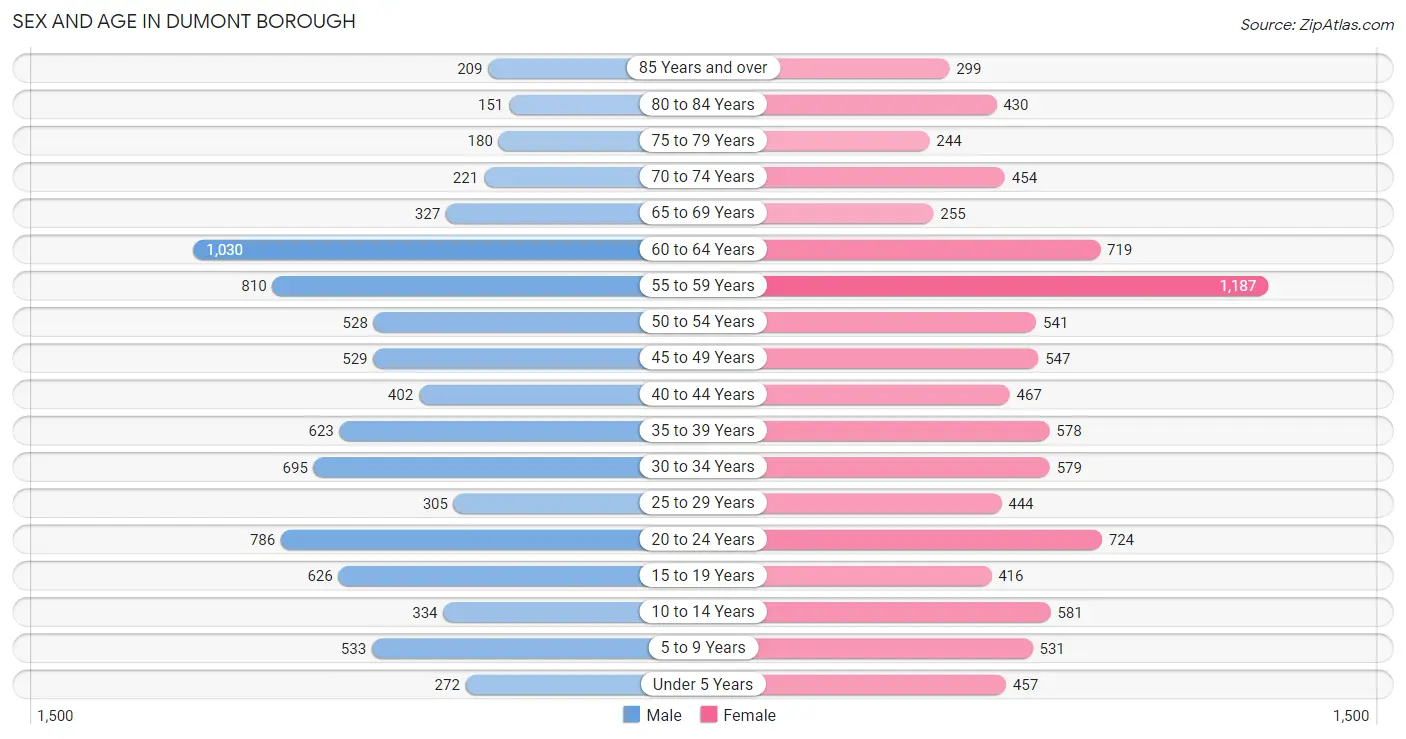
Sex and Age in Dumont borough
The most populous age groups in Dumont borough are 60 to 64 Years (1,030 | 12.0%) for men and 55 to 59 Years (1,187 | 12.6%) for women.
| Age Bracket | Male | Female |
| Under 5 Years | 272 (3.2%) | 457 (4.8%) |
| 5 to 9 Years | 533 (6.2%) | 531 (5.6%) |
| 10 to 14 Years | 334 (3.9%) | 581 (6.1%) |
| 15 to 19 Years | 626 (7.3%) | 416 (4.4%) |
| 20 to 24 Years | 786 (9.2%) | 724 (7.7%) |
| 25 to 29 Years | 305 (3.6%) | 444 (4.7%) |
| 30 to 34 Years | 695 (8.1%) | 579 (6.1%) |
| 35 to 39 Years | 623 (7.3%) | 578 (6.1%) |
| 40 to 44 Years | 402 (4.7%) | 467 (4.9%) |
| 45 to 49 Years | 529 (6.2%) | 547 (5.8%) |
| 50 to 54 Years | 528 (6.2%) | 541 (5.7%) |
| 55 to 59 Years | 810 (9.5%) | 1,187 (12.6%) |
| 60 to 64 Years | 1,030 (12.0%) | 719 (7.6%) |
| 65 to 69 Years | 327 (3.8%) | 255 (2.7%) |
| 70 to 74 Years | 221 (2.6%) | 454 (4.8%) |
| 75 to 79 Years | 180 (2.1%) | 244 (2.6%) |
| 80 to 84 Years | 151 (1.8%) | 430 (4.5%) |
| 85 Years and over | 209 (2.4%) | 299 (3.2%) |
| Total | 8,561 (100.0%) | 9,453 (100.0%) |
Families and Households in Dumont borough
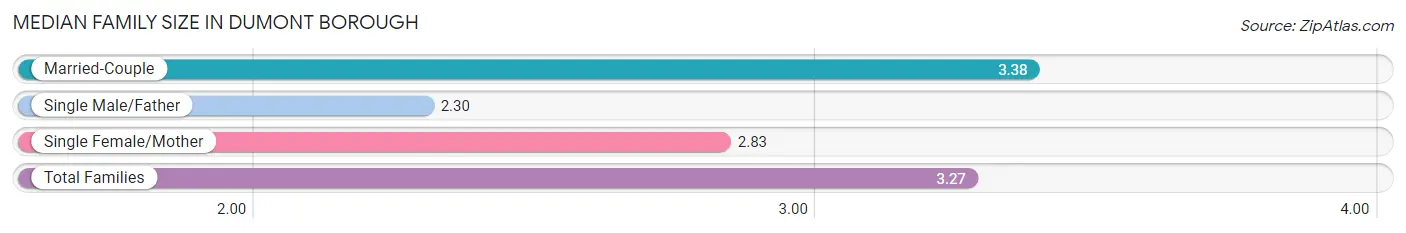
Median Family Size in Dumont borough
The median family size in Dumont borough is 3.27 persons per family, with married-couple families (4,018 | 82.6%) accounting for the largest median family size of 3.38 persons per family. On the other hand, single male/father families (207 | 4.3%) represent the smallest median family size with 2.30 persons per family.
| Family Type | # Families | Family Size |
| Married-Couple | 4,018 (82.6%) | 3.38 |
| Single Male/Father | 207 (4.3%) | 2.30 |
| Single Female/Mother | 642 (13.2%) | 2.83 |
| Total Families | 4,867 (100.0%) | 3.27 |
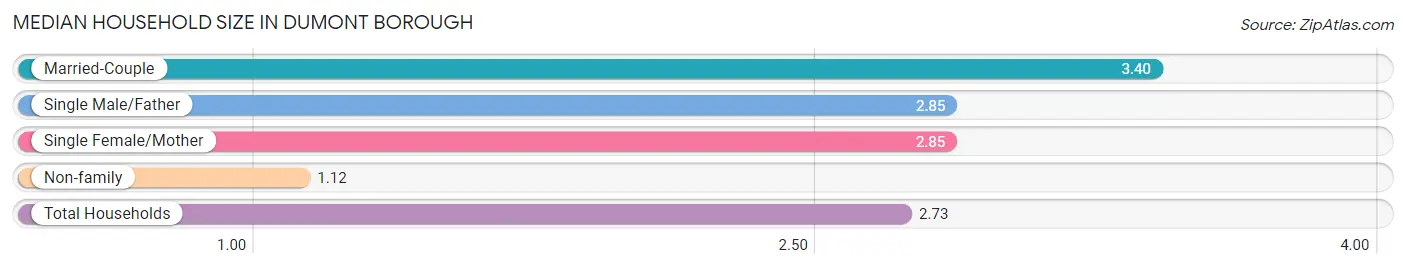
Median Household Size in Dumont borough
The median household size in Dumont borough is 2.73 persons per household, with married-couple households (4,018 | 60.9%) accounting for the largest median household size of 3.4 persons per household. non-family households (1,726 | 26.2%) represent the smallest median household size with 1.12 persons per household.
| Household Type | # Households | Household Size |
| Married-Couple | 4,018 (60.9%) | 3.40 |
| Single Male/Father | 207 (3.1%) | 2.85 |
| Single Female/Mother | 642 (9.7%) | 2.85 |
| Non-family | 1,726 (26.2%) | 1.12 |
| Total Households | 6,593 (100.0%) | 2.73 |
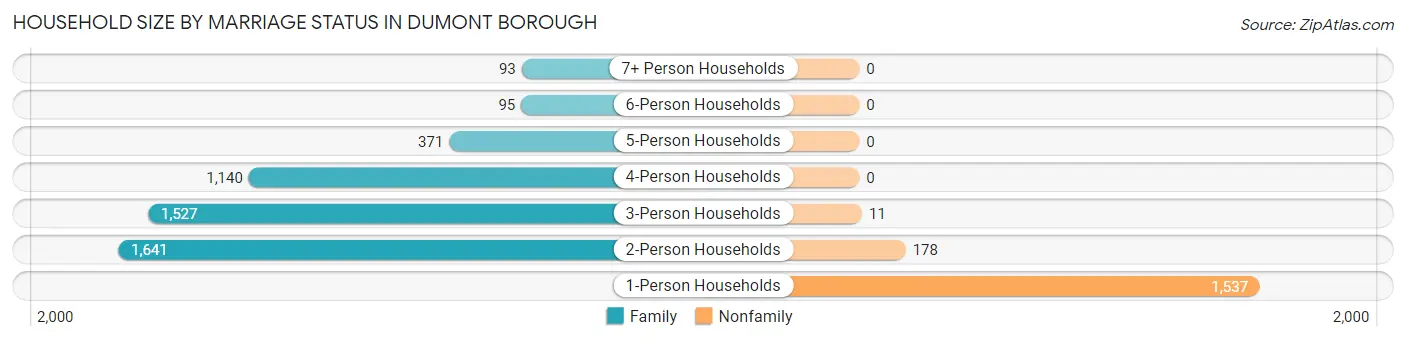
Household Size by Marriage Status in Dumont borough
Out of a total of 6,593 households in Dumont borough, 4,867 (73.8%) are family households, while 1,726 (26.2%) are nonfamily households. The most numerous type of family households are 2-person households, comprising 1,641, and the most common type of nonfamily households are 1-person households, comprising 1,537.
| Household Size | Family Households | Nonfamily Households |
| 1-Person Households | - | 1,537 (23.3%) |
| 2-Person Households | 1,641 (24.9%) | 178 (2.7%) |
| 3-Person Households | 1,527 (23.2%) | 11 (0.2%) |
| 4-Person Households | 1,140 (17.3%) | 0 (0.0%) |
| 5-Person Households | 371 (5.6%) | 0 (0.0%) |
| 6-Person Households | 95 (1.4%) | 0 (0.0%) |
| 7+ Person Households | 93 (1.4%) | 0 (0.0%) |
| Total | 4,867 (73.8%) | 1,726 (26.2%) |
Female Fertility in Dumont borough
Fertility by Age in Dumont borough
Average fertility rate in Dumont borough is 43.0 births per 1,000 women. Women in the age bracket of 35 to 50 years have the highest fertility rate with 50.0 births per 1,000 women. Women in the age bracket of 35 to 50 years acount for 51.2% of all women with births.
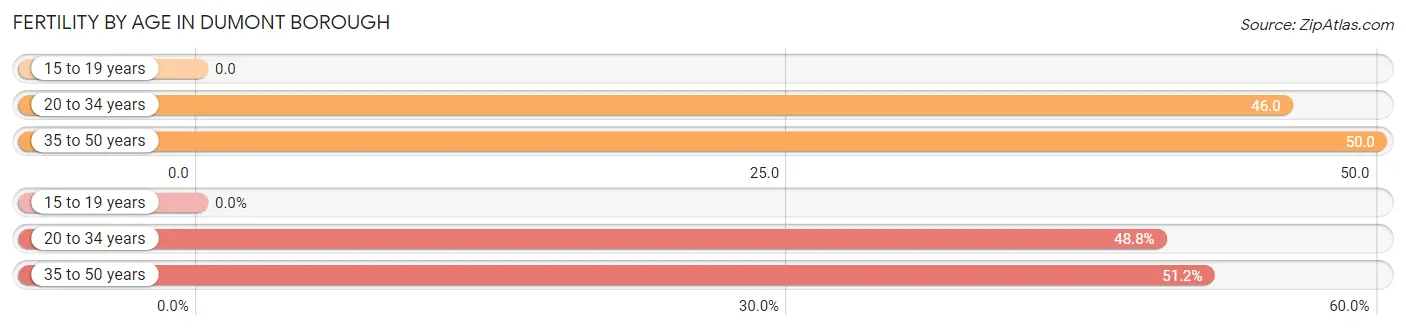
| Age Bracket | Women with Births | Births / 1,000 Women |
| 15 to 19 years | 0 (0.0%) | 0.0 |
| 20 to 34 years | 80 (48.8%) | 46.0 |
| 35 to 50 years | 84 (51.2%) | 50.0 |
| Total | 164 (100.0%) | 43.0 |
Fertility by Age by Marriage Status in Dumont borough
90.9% of women with births (164) in Dumont borough are married. The highest percentage of unmarried women with births falls into 35 to 50 years age bracket with 17.9% of them unmarried at the time of birth, while the lowest percentage of unmarried women with births belong to 20 to 34 years age bracket with 0.0% of them unmarried.
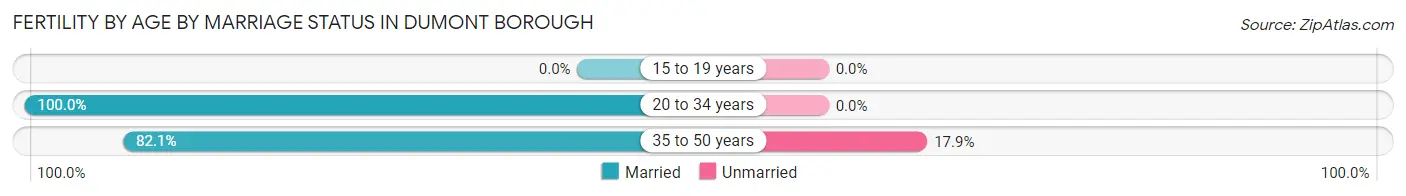
| Age Bracket | Married | Unmarried |
| 15 to 19 years | 0 (0.0%) | 0 (0.0%) |
| 20 to 34 years | 80 (100.0%) | 0 (0.0%) |
| 35 to 50 years | 69 (82.1%) | 15 (17.9%) |
| Total | 149 (90.8%) | 15 (9.1%) |
Fertility by Education in Dumont borough
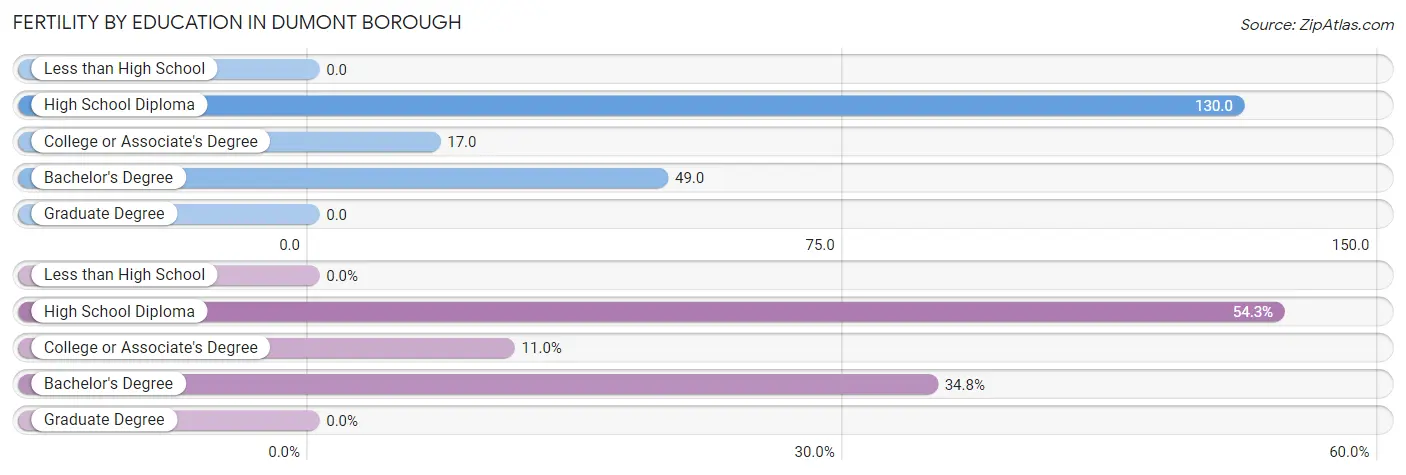
| Educational Attainment | Women with Births | Births / 1,000 Women |
| Less than High School | 0 (0.0%) | 0.0 |
| High School Diploma | 89 (54.3%) | 130.0 |
| College or Associate's Degree | 18 (11.0%) | 17.0 |
| Bachelor's Degree | 57 (34.8%) | 49.0 |
| Graduate Degree | 0 (0.0%) | 0.0 |
| Total | 164 (100.0%) | 43.0 |
Fertility by Education by Marriage Status in Dumont borough
9.1% of women with births in Dumont borough are unmarried. Women with the educational attainment of high school diploma are most likely to be married with 100.0% of them married at childbirth, while women with the educational attainment of bachelor's degree are least likely to be married with 26.3% of them unmarried at childbirth.
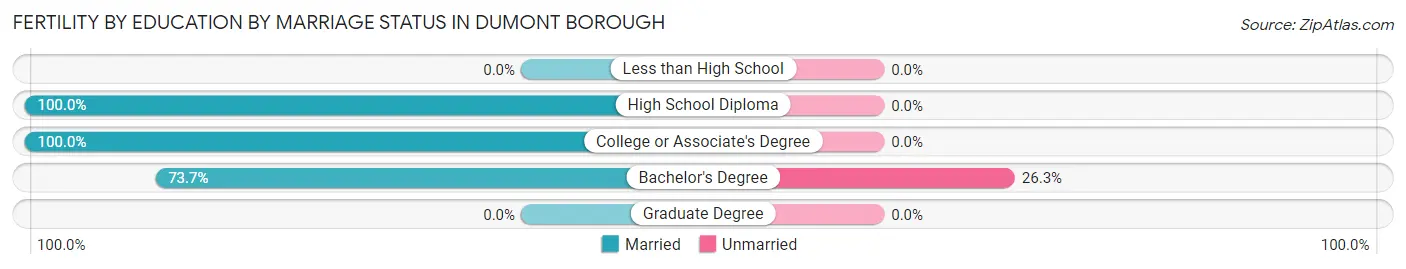
| Educational Attainment | Married | Unmarried |
| Less than High School | 0 (0.0%) | 0 (0.0%) |
| High School Diploma | 89 (100.0%) | 0 (0.0%) |
| College or Associate's Degree | 18 (100.0%) | 0 (0.0%) |
| Bachelor's Degree | 42 (73.7%) | 15 (26.3%) |
| Graduate Degree | 0 (0.0%) | 0 (0.0%) |
| Total | 149 (90.8%) | 15 (9.1%) |
Employment Characteristics in Dumont borough
Employment by Class of Employer in Dumont borough
Among the 9,804 employed individuals in Dumont borough, private company employees (6,328 | 64.5%), local government employees (1,361 | 13.9%), and not-for-profit organizations (1,054 | 10.7%) make up the most common classes of employment.
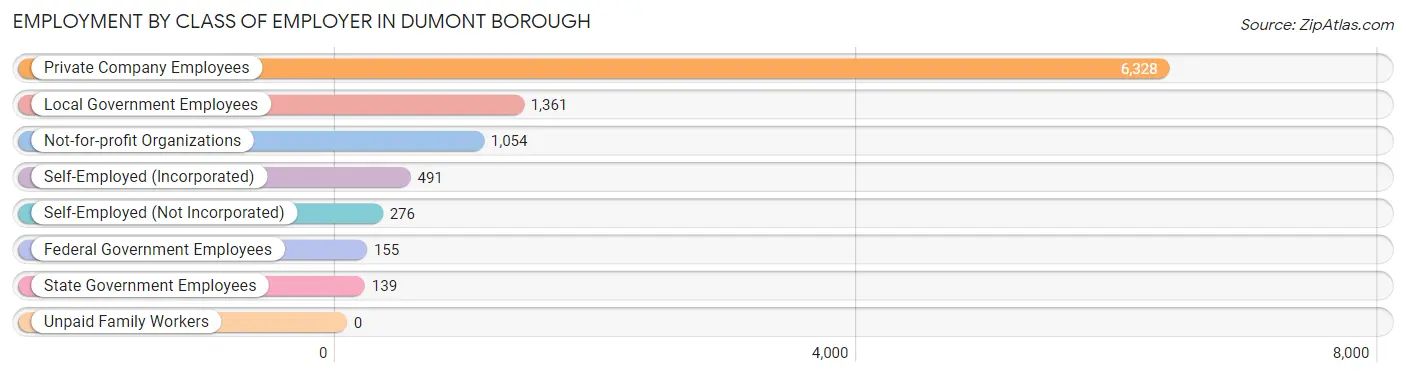
| Employer Class | # Employees | % Employees |
| Private Company Employees | 6,328 | 64.5% |
| Self-Employed (Incorporated) | 491 | 5.0% |
| Self-Employed (Not Incorporated) | 276 | 2.8% |
| Not-for-profit Organizations | 1,054 | 10.7% |
| Local Government Employees | 1,361 | 13.9% |
| State Government Employees | 139 | 1.4% |
| Federal Government Employees | 155 | 1.6% |
| Unpaid Family Workers | 0 | 0.0% |
| Total | 9,804 | 100.0% |
Employment Status by Age in Dumont borough
According to the labor force statistics for Dumont borough, out of the total population over 16 years of age (15,150), 69.3% or 10,499 individuals are in the labor force, with 5.1% or 535 of them unemployed. The age group with the highest labor force participation rate is 45 to 54 years, with 95.3% or 2,044 individuals in the labor force. Within the labor force, the 16 to 19 years age range has the highest percentage of unemployed individuals, with 50.6% or 134 of them being unemployed.
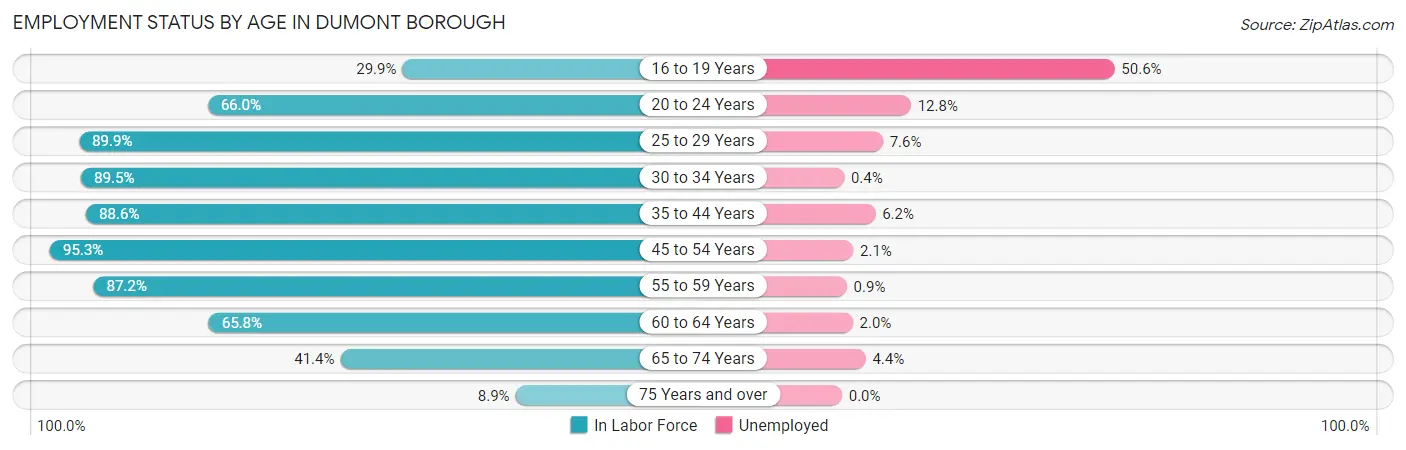
| Age Bracket | In Labor Force | Unemployed |
| 16 to 19 Years | 265 (29.9%) | 134 (50.6%) |
| 20 to 24 Years | 997 (66.0%) | 128 (12.8%) |
| 25 to 29 Years | 673 (89.9%) | 51 (7.6%) |
| 30 to 34 Years | 1,140 (89.5%) | 5 (0.4%) |
| 35 to 44 Years | 1,834 (88.6%) | 114 (6.2%) |
| 45 to 54 Years | 2,044 (95.3%) | 43 (2.1%) |
| 55 to 59 Years | 1,741 (87.2%) | 16 (0.9%) |
| 60 to 64 Years | 1,151 (65.8%) | 23 (2.0%) |
| 65 to 74 Years | 520 (41.4%) | 23 (4.4%) |
| 75 Years and over | 135 (8.9%) | 0 (0.0%) |
| Total | 10,499 (69.3%) | 535 (5.1%) |
Employment Status by Educational Attainment in Dumont borough
According to labor force statistics for Dumont borough, 86.0% of individuals (8,586) out of the total population between 25 and 64 years of age (9,984) are in the labor force, with 2.9% or 249 of them being unemployed. The group with the highest labor force participation rate are those with the educational attainment of college / associate degree, with 87.4% or 2,140 individuals in the labor force. Within the labor force, individuals with high school diploma education have the highest percentage of unemployment, with 6.3% or 124 of them being unemployed.

| Educational Attainment | In Labor Force | Unemployed |
| Less than High School | 250 (84.2%) | 0 (0.0%) |
| High School Diploma | 1,967 (82.3%) | 151 (6.3%) |
| College / Associate Degree | 2,140 (87.4%) | 78 (3.2%) |
| Bachelor's Degree or higher | 4,228 (87.2%) | 68 (1.4%) |
| Total | 8,586 (86.0%) | 290 (2.9%) |
Employment Occupations by Sex in Dumont borough
Management, Business, Science and Arts Occupations
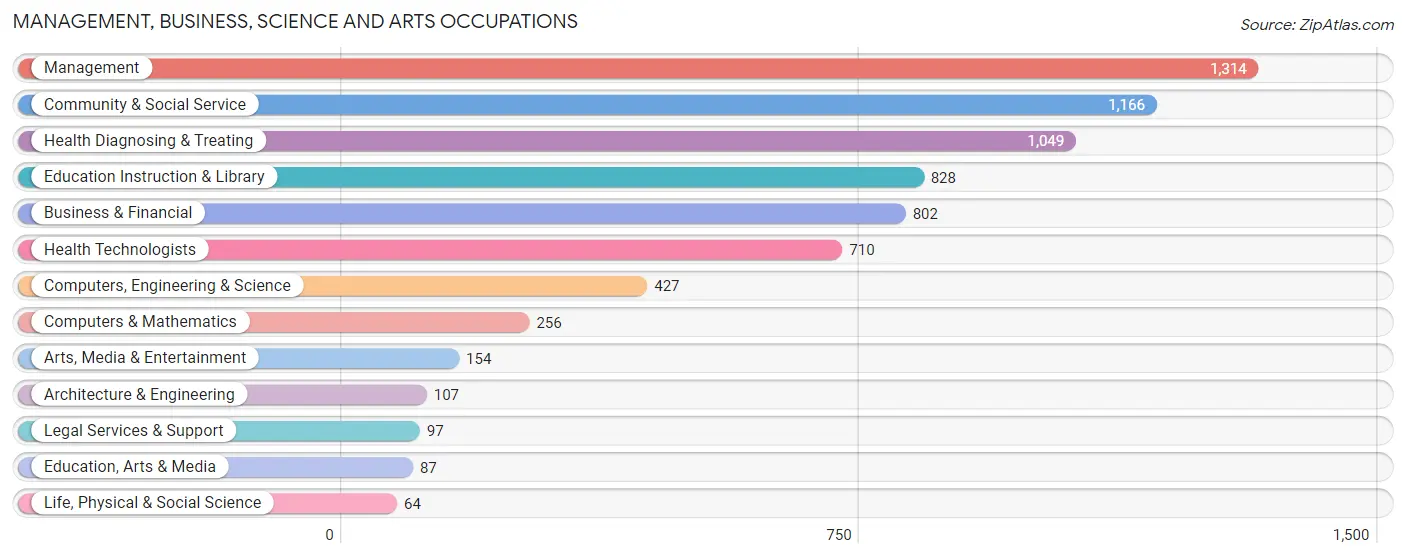
The most common Management, Business, Science and Arts occupations in Dumont borough are Management (1,314 | 13.2%), Community & Social Service (1,166 | 11.7%), Health Diagnosing & Treating (1,049 | 10.5%), Education Instruction & Library (828 | 8.3%), and Business & Financial (802 | 8.1%).
Management, Business, Science and Arts Occupations by Sex
Within the Management, Business, Science and Arts occupations in Dumont borough, the most male-oriented occupations are Architecture & Engineering (100.0%), Legal Services & Support (81.4%), and Computers, Engineering & Science (73.8%), while the most female-oriented occupations are Education Instruction & Library (74.6%), Health Diagnosing & Treating (71.2%), and Health Technologists (65.3%).
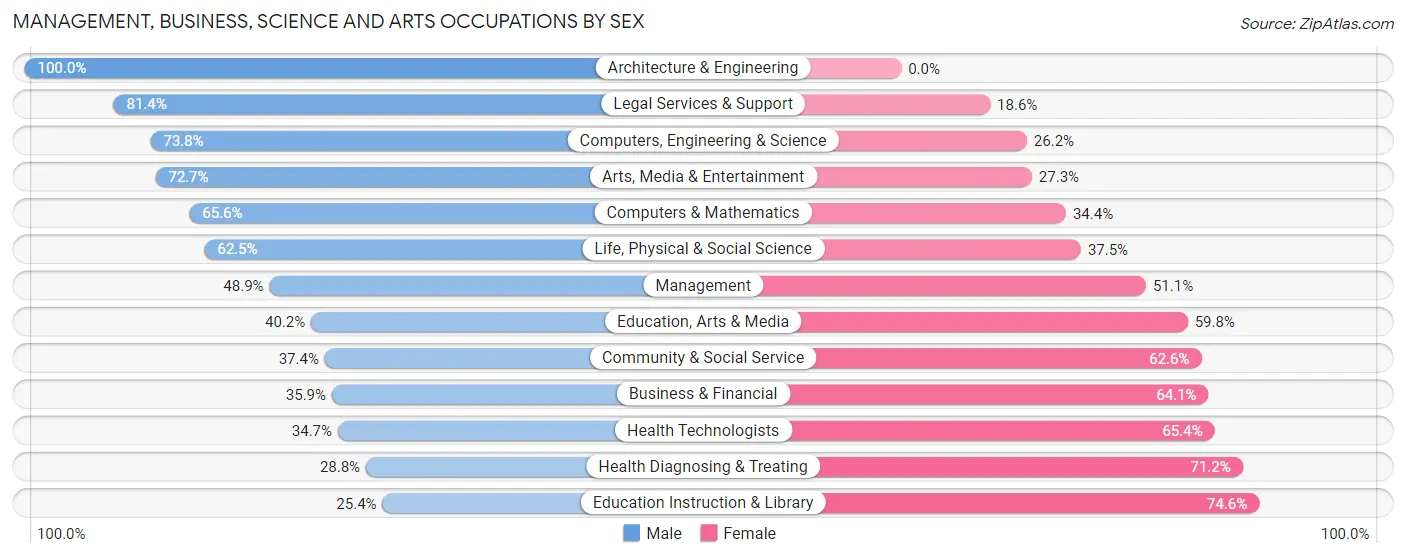
| Occupation | Male | Female |
| Management | 643 (48.9%) | 671 (51.1%) |
| Business & Financial | 288 (35.9%) | 514 (64.1%) |
| Computers, Engineering & Science | 315 (73.8%) | 112 (26.2%) |
| Computers & Mathematics | 168 (65.6%) | 88 (34.4%) |
| Architecture & Engineering | 107 (100.0%) | 0 (0.0%) |
| Life, Physical & Social Science | 40 (62.5%) | 24 (37.5%) |
| Community & Social Service | 436 (37.4%) | 730 (62.6%) |
| Education, Arts & Media | 35 (40.2%) | 52 (59.8%) |
| Legal Services & Support | 79 (81.4%) | 18 (18.6%) |
| Education Instruction & Library | 210 (25.4%) | 618 (74.6%) |
| Arts, Media & Entertainment | 112 (72.7%) | 42 (27.3%) |
| Health Diagnosing & Treating | 302 (28.8%) | 747 (71.2%) |
| Health Technologists | 246 (34.6%) | 464 (65.3%) |
| Total (Category) | 1,984 (41.7%) | 2,774 (58.3%) |
| Total (Overall) | 4,872 (48.9%) | 5,094 (51.1%) |
Services Occupations
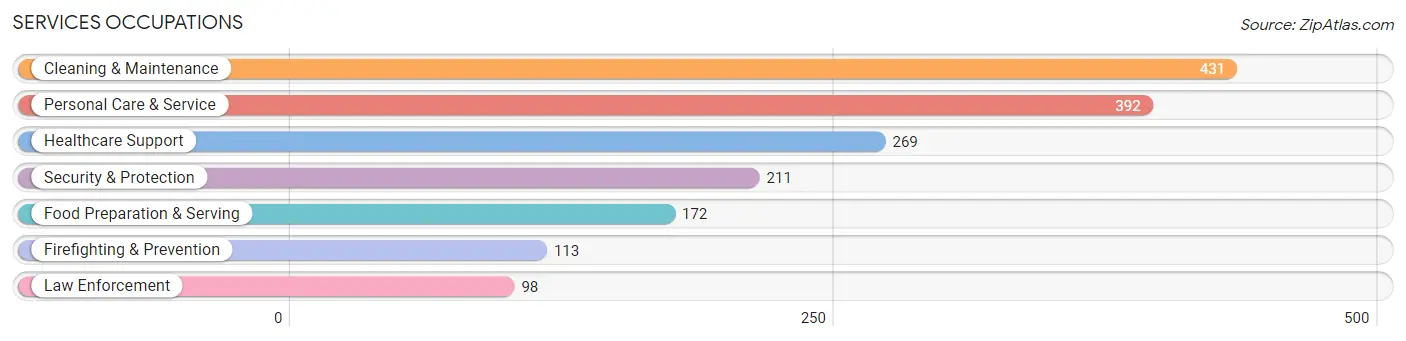
The most common Services occupations in Dumont borough are Cleaning & Maintenance (431 | 4.3%), Personal Care & Service (392 | 3.9%), Healthcare Support (269 | 2.7%), Security & Protection (211 | 2.1%), and Food Preparation & Serving (172 | 1.7%).
Services Occupations by Sex
Within the Services occupations in Dumont borough, the most male-oriented occupations are Law Enforcement (100.0%), Security & Protection (92.9%), and Firefighting & Prevention (86.7%), while the most female-oriented occupations are Personal Care & Service (96.2%), Food Preparation & Serving (66.9%), and Healthcare Support (62.1%).
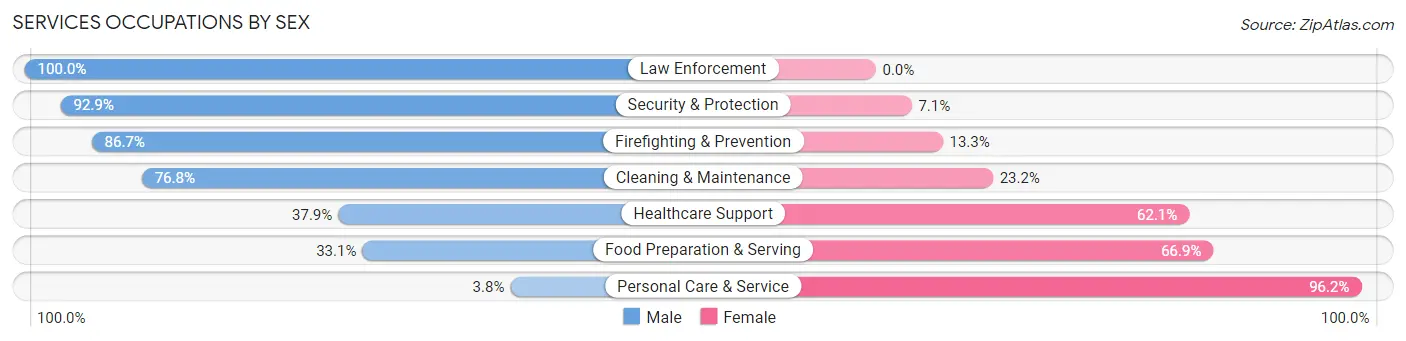
| Occupation | Male | Female |
| Healthcare Support | 102 (37.9%) | 167 (62.1%) |
| Security & Protection | 196 (92.9%) | 15 (7.1%) |
| Firefighting & Prevention | 98 (86.7%) | 15 (13.3%) |
| Law Enforcement | 98 (100.0%) | 0 (0.0%) |
| Food Preparation & Serving | 57 (33.1%) | 115 (66.9%) |
| Cleaning & Maintenance | 331 (76.8%) | 100 (23.2%) |
| Personal Care & Service | 15 (3.8%) | 377 (96.2%) |
| Total (Category) | 701 (47.5%) | 774 (52.5%) |
| Total (Overall) | 4,872 (48.9%) | 5,094 (51.1%) |
Sales and Office Occupations
The most common Sales and Office occupations in Dumont borough are Office & Administration (1,523 | 15.3%), and Sales & Related (757 | 7.6%).

Sales and Office Occupations by Sex

| Occupation | Male | Female |
| Sales & Related | 484 (63.9%) | 273 (36.1%) |
| Office & Administration | 399 (26.2%) | 1,124 (73.8%) |
| Total (Category) | 883 (38.7%) | 1,397 (61.3%) |
| Total (Overall) | 4,872 (48.9%) | 5,094 (51.1%) |
Natural Resources, Construction and Maintenance Occupations
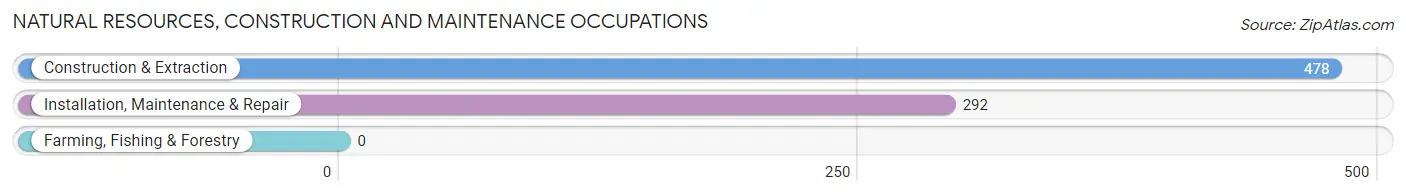
The most common Natural Resources, Construction and Maintenance occupations in Dumont borough are Construction & Extraction (478 | 4.8%), and Installation, Maintenance & Repair (292 | 2.9%).
Natural Resources, Construction and Maintenance Occupations by Sex

| Occupation | Male | Female |
| Farming, Fishing & Forestry | 0 (0.0%) | 0 (0.0%) |
| Construction & Extraction | 478 (100.0%) | 0 (0.0%) |
| Installation, Maintenance & Repair | 263 (90.1%) | 29 (9.9%) |
| Total (Category) | 741 (96.2%) | 29 (3.8%) |
| Total (Overall) | 4,872 (48.9%) | 5,094 (51.1%) |
Production, Transportation and Moving Occupations
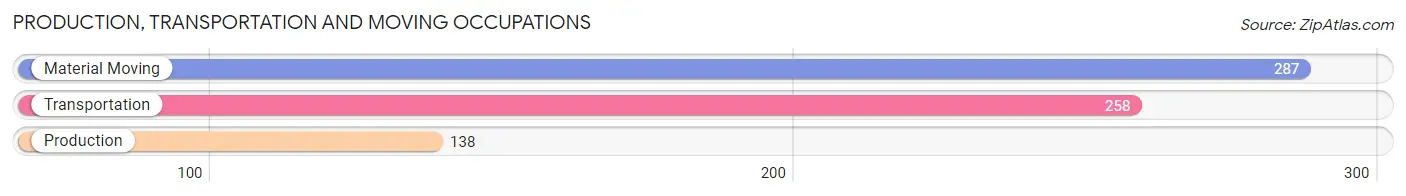
The most common Production, Transportation and Moving occupations in Dumont borough are Material Moving (287 | 2.9%), Transportation (258 | 2.6%), and Production (138 | 1.4%).
Production, Transportation and Moving Occupations by Sex
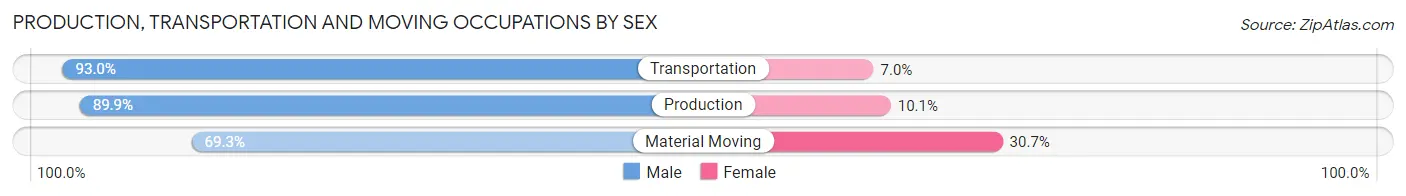
| Occupation | Male | Female |
| Production | 124 (89.9%) | 14 (10.1%) |
| Transportation | 240 (93.0%) | 18 (7.0%) |
| Material Moving | 199 (69.3%) | 88 (30.7%) |
| Total (Category) | 563 (82.4%) | 120 (17.6%) |
| Total (Overall) | 4,872 (48.9%) | 5,094 (51.1%) |
Employment Industries by Sex in Dumont borough
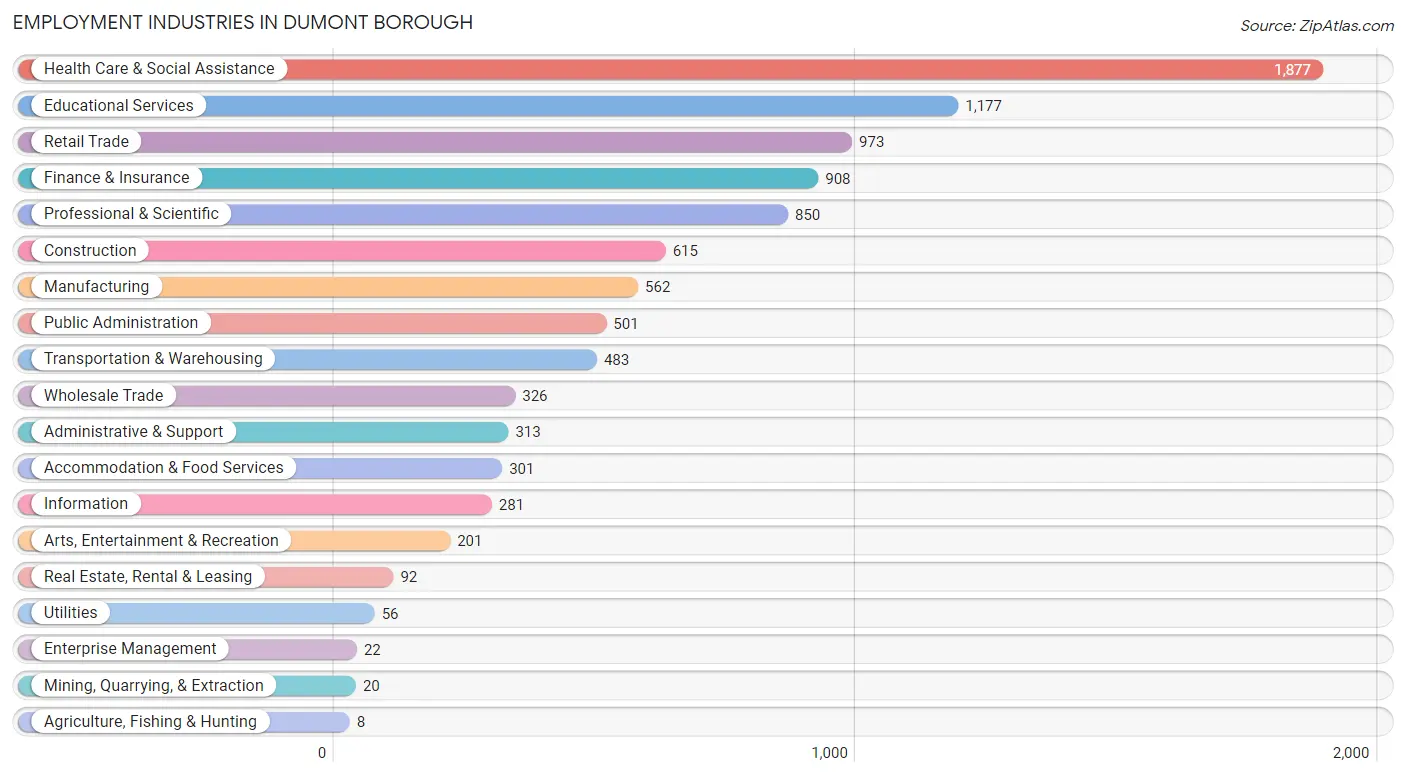
Employment Industries in Dumont borough
The major employment industries in Dumont borough include Health Care & Social Assistance (1,877 | 18.8%), Educational Services (1,177 | 11.8%), Retail Trade (973 | 9.8%), Finance & Insurance (908 | 9.1%), and Professional & Scientific (850 | 8.5%).
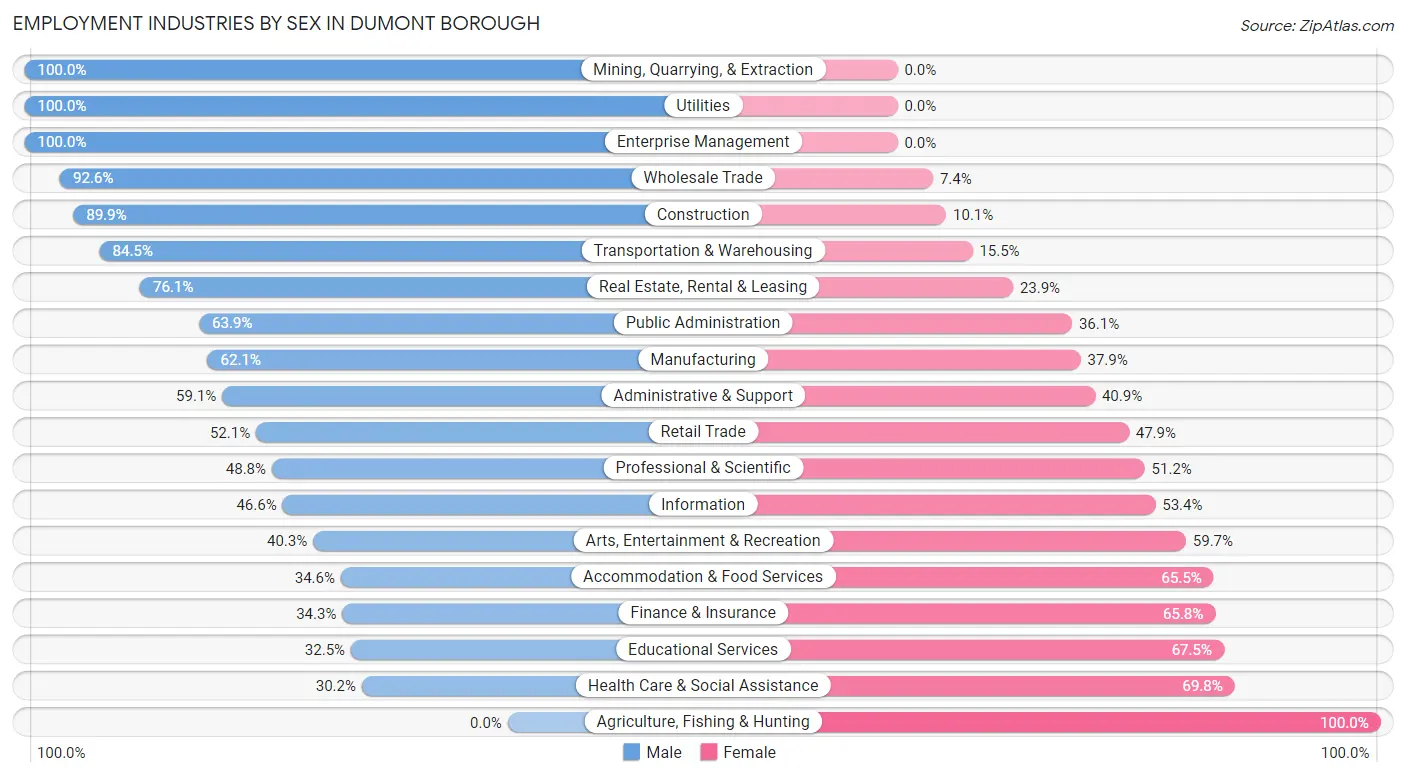
Employment Industries by Sex in Dumont borough
The Dumont borough industries that see more men than women are Mining, Quarrying, & Extraction (100.0%), Utilities (100.0%), and Enterprise Management (100.0%), whereas the industries that tend to have a higher number of women are Agriculture, Fishing & Hunting (100.0%), Health Care & Social Assistance (69.8%), and Educational Services (67.5%).
| Industry | Male | Female |
| Agriculture, Fishing & Hunting | 0 (0.0%) | 8 (100.0%) |
| Mining, Quarrying, & Extraction | 20 (100.0%) | 0 (0.0%) |
| Construction | 553 (89.9%) | 62 (10.1%) |
| Manufacturing | 349 (62.1%) | 213 (37.9%) |
| Wholesale Trade | 302 (92.6%) | 24 (7.4%) |
| Retail Trade | 507 (52.1%) | 466 (47.9%) |
| Transportation & Warehousing | 408 (84.5%) | 75 (15.5%) |
| Utilities | 56 (100.0%) | 0 (0.0%) |
| Information | 131 (46.6%) | 150 (53.4%) |
| Finance & Insurance | 311 (34.3%) | 597 (65.7%) |
| Real Estate, Rental & Leasing | 70 (76.1%) | 22 (23.9%) |
| Professional & Scientific | 415 (48.8%) | 435 (51.2%) |
| Enterprise Management | 22 (100.0%) | 0 (0.0%) |
| Administrative & Support | 185 (59.1%) | 128 (40.9%) |
| Educational Services | 382 (32.5%) | 795 (67.5%) |
| Health Care & Social Assistance | 567 (30.2%) | 1,310 (69.8%) |
| Arts, Entertainment & Recreation | 81 (40.3%) | 120 (59.7%) |
| Accommodation & Food Services | 104 (34.5%) | 197 (65.4%) |
| Public Administration | 320 (63.9%) | 181 (36.1%) |
| Total | 4,872 (48.9%) | 5,094 (51.1%) |
Education in Dumont borough
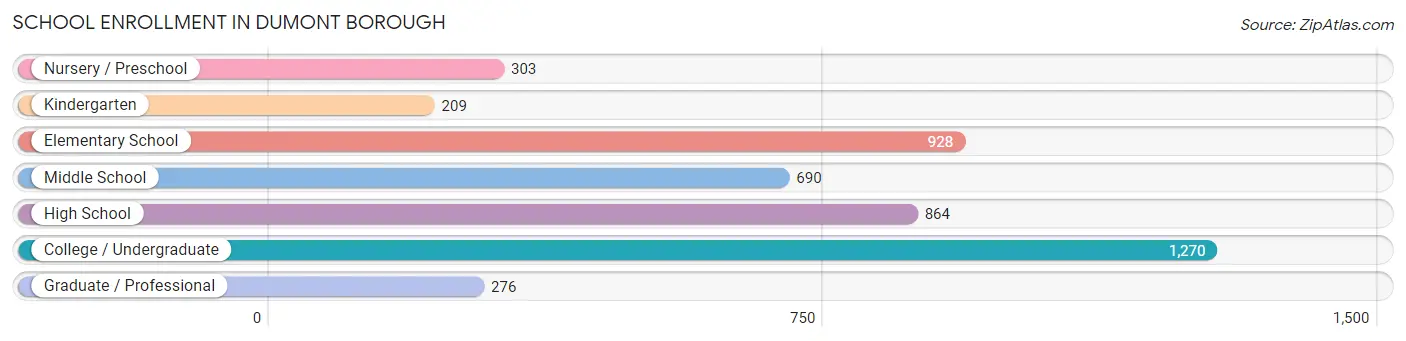
School Enrollment in Dumont borough
The most common levels of schooling among the 4,540 students in Dumont borough are college / undergraduate (1,270 | 28.0%), elementary school (928 | 20.4%), and high school (864 | 19.0%).
| School Level | # Students | % Students |
| Nursery / Preschool | 303 | 6.7% |
| Kindergarten | 209 | 4.6% |
| Elementary School | 928 | 20.4% |
| Middle School | 690 | 15.2% |
| High School | 864 | 19.0% |
| College / Undergraduate | 1,270 | 28.0% |
| Graduate / Professional | 276 | 6.1% |
| Total | 4,540 | 100.0% |
School Enrollment by Age by Funding Source in Dumont borough
Out of a total of 4,540 students who are enrolled in schools in Dumont borough, 867 (19.1%) attend a private institution, while the remaining 3,673 (80.9%) are enrolled in public schools. The age group of 35 years and over has the highest likelihood of being enrolled in private schools, with 180 (61.2% in the age bracket) enrolled. Conversely, the age group of 15 to 17 year olds has the lowest likelihood of being enrolled in a private school, with 693 (100.0% in the age bracket) attending a public institution.
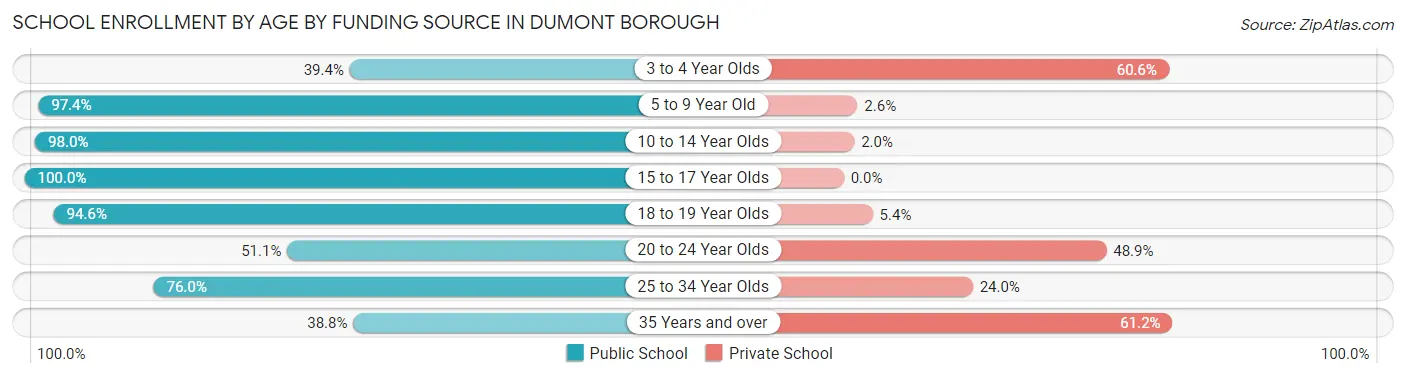
| Age Bracket | Public School | Private School |
| 3 to 4 Year Olds | 112 (39.4%) | 172 (60.6%) |
| 5 to 9 Year Old | 1,027 (97.4%) | 27 (2.6%) |
| 10 to 14 Year Olds | 848 (98.0%) | 17 (2.0%) |
| 15 to 17 Year Olds | 693 (100.0%) | 0 (0.0%) |
| 18 to 19 Year Olds | 263 (94.6%) | 15 (5.4%) |
| 20 to 24 Year Olds | 403 (51.1%) | 386 (48.9%) |
| 25 to 34 Year Olds | 215 (76.0%) | 68 (24.0%) |
| 35 Years and over | 114 (38.8%) | 180 (61.2%) |
| Total | 3,673 (80.9%) | 867 (19.1%) |
Educational Attainment by Field of Study in Dumont borough
Business (1,050 | 16.5%), social sciences (1,033 | 16.2%), science & technology (1,006 | 15.8%), education (757 | 11.9%), and psychology (471 | 7.4%) are the most common fields of study among 6,367 individuals in Dumont borough who have obtained a bachelor's degree or higher.
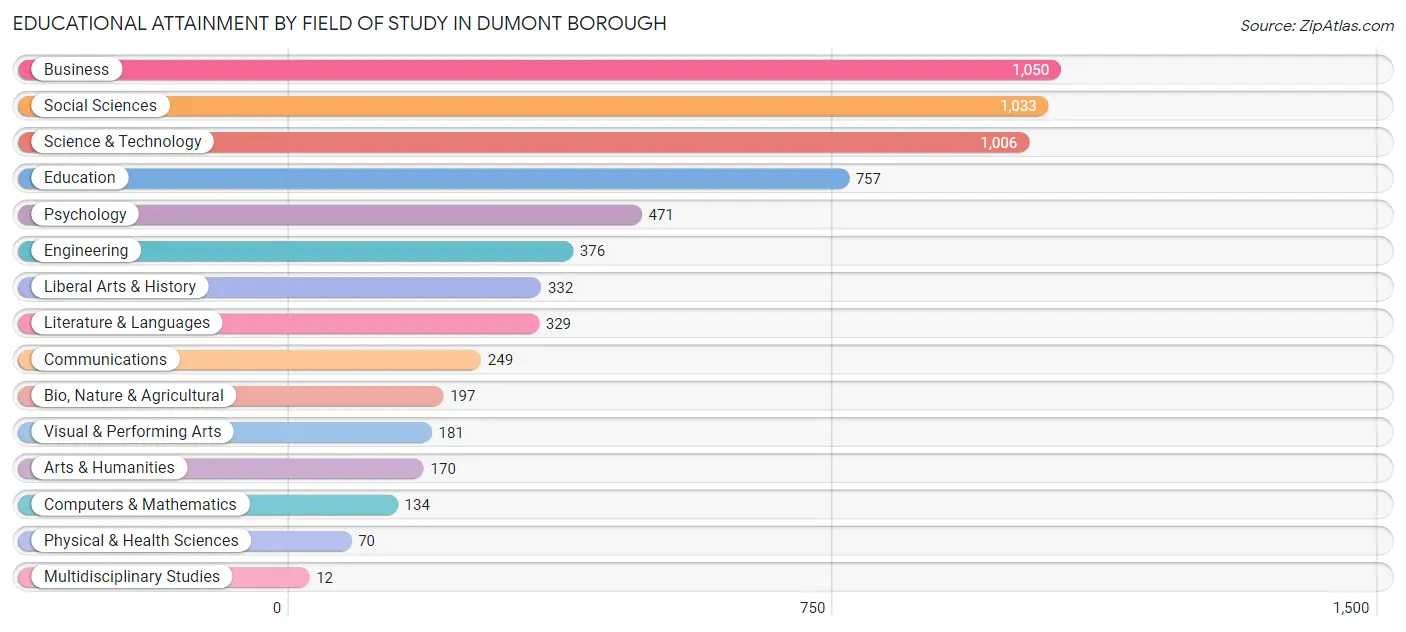
| Field of Study | # Graduates | % Graduates |
| Computers & Mathematics | 134 | 2.1% |
| Bio, Nature & Agricultural | 197 | 3.1% |
| Physical & Health Sciences | 70 | 1.1% |
| Psychology | 471 | 7.4% |
| Social Sciences | 1,033 | 16.2% |
| Engineering | 376 | 5.9% |
| Multidisciplinary Studies | 12 | 0.2% |
| Science & Technology | 1,006 | 15.8% |
| Business | 1,050 | 16.5% |
| Education | 757 | 11.9% |
| Literature & Languages | 329 | 5.2% |
| Liberal Arts & History | 332 | 5.2% |
| Visual & Performing Arts | 181 | 2.8% |
| Communications | 249 | 3.9% |
| Arts & Humanities | 170 | 2.7% |
| Total | 6,367 | 100.0% |
Transportation & Commute in Dumont borough
Vehicle Availability by Sex in Dumont borough
The most prevalent vehicle ownership categories in Dumont borough are males with 2 vehicles (2,123, accounting for 43.8%) and females with 2 vehicles (2,229, making up 42.9%).
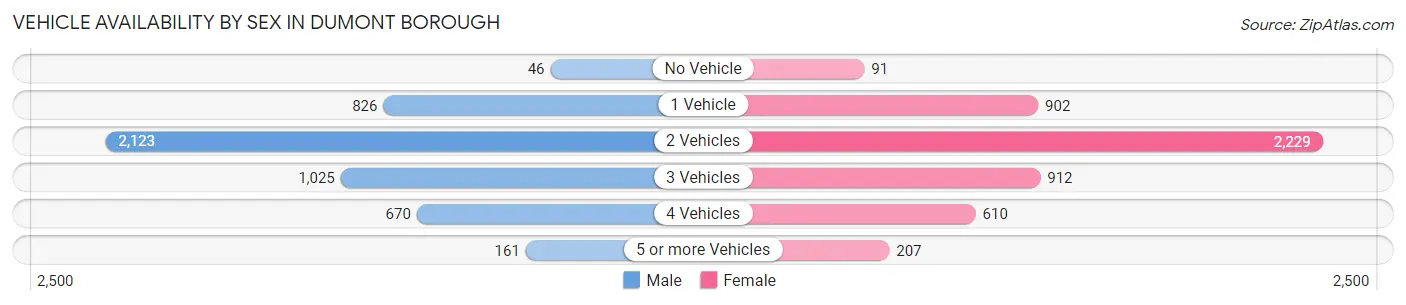
| Vehicles Available | Male | Female |
| No Vehicle | 46 (0.9%) | 91 (1.8%) |
| 1 Vehicle | 826 (17.0%) | 902 (18.2%) |
| 2 Vehicles | 2,123 (43.8%) | 2,229 (45.0%) |
| 3 Vehicles | 1,025 (21.1%) | 912 (18.4%) |
| 4 Vehicles | 670 (13.8%) | 610 (12.3%) |
| 5 or more Vehicles | 161 (3.3%) | 207 (4.2%) |
| Total | 4,851 (100.0%) | 4,951 (100.0%) |
Commute Time in Dumont borough
The most frequently occuring commute durations in Dumont borough are 20 to 24 minutes (1,442 commuters, 16.4%), 30 to 34 minutes (1,184 commuters, 13.5%), and 45 to 59 minutes (1,139 commuters, 13.0%).
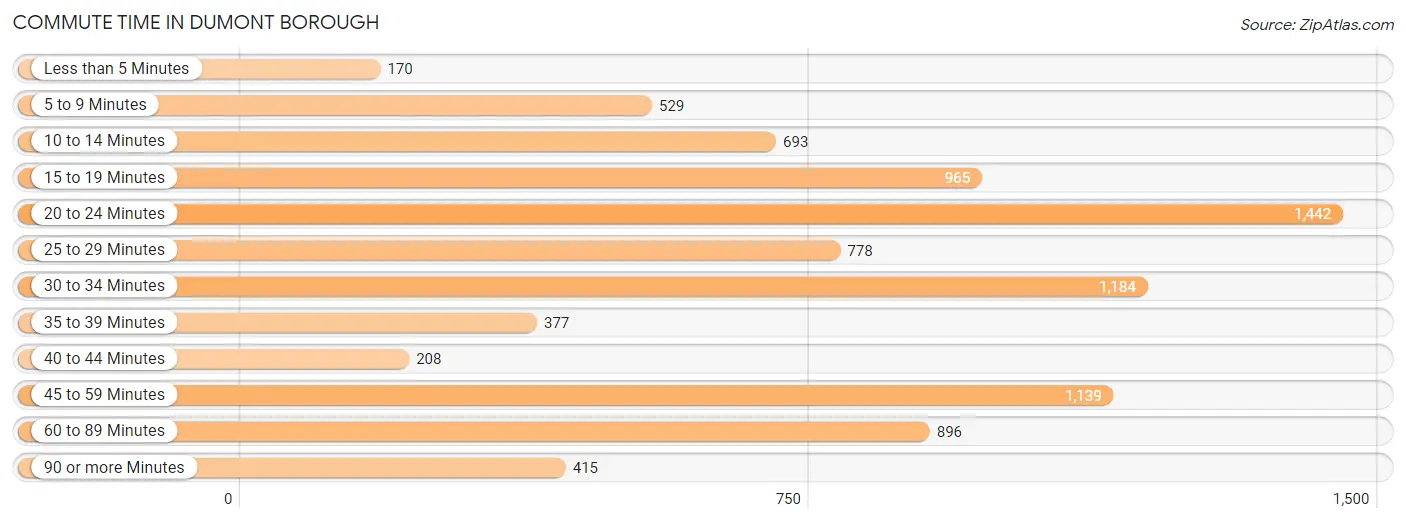
| Commute Time | # Commuters | % Commuters |
| Less than 5 Minutes | 170 | 1.9% |
| 5 to 9 Minutes | 529 | 6.0% |
| 10 to 14 Minutes | 693 | 7.9% |
| 15 to 19 Minutes | 965 | 11.0% |
| 20 to 24 Minutes | 1,442 | 16.4% |
| 25 to 29 Minutes | 778 | 8.8% |
| 30 to 34 Minutes | 1,184 | 13.5% |
| 35 to 39 Minutes | 377 | 4.3% |
| 40 to 44 Minutes | 208 | 2.4% |
| 45 to 59 Minutes | 1,139 | 13.0% |
| 60 to 89 Minutes | 896 | 10.2% |
| 90 or more Minutes | 415 | 4.7% |
Commute Time by Sex in Dumont borough
The most common commute times in Dumont borough are 30 to 34 minutes (776 commuters, 17.3%) for males and 20 to 24 minutes (743 commuters, 17.2%) for females.
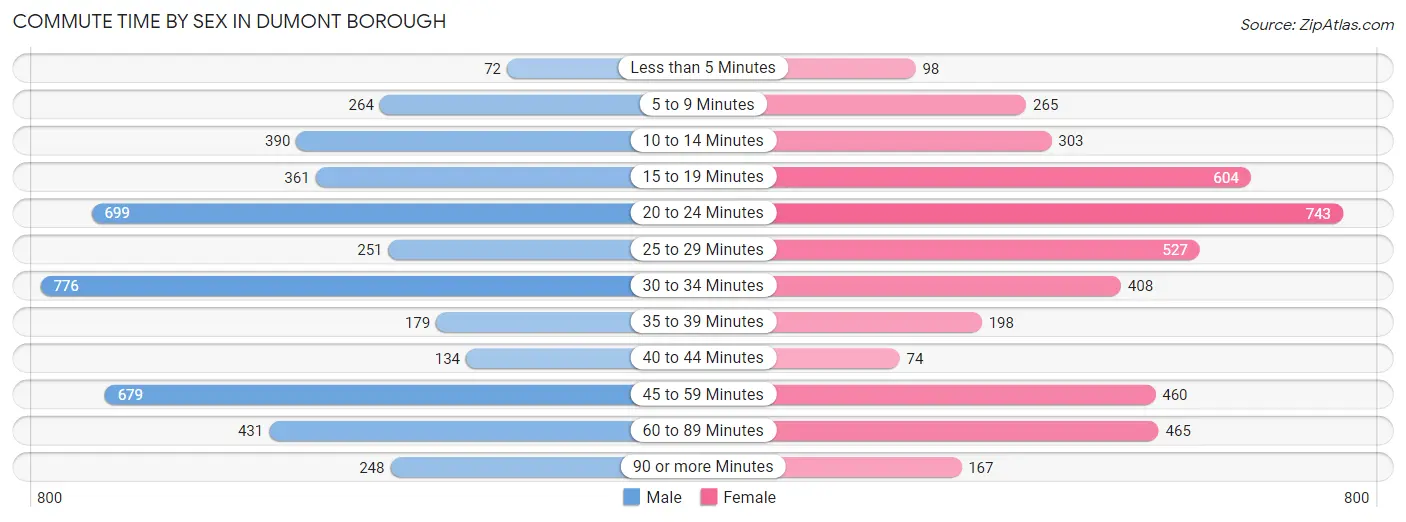
| Commute Time | Male | Female |
| Less than 5 Minutes | 72 (1.6%) | 98 (2.3%) |
| 5 to 9 Minutes | 264 (5.9%) | 265 (6.1%) |
| 10 to 14 Minutes | 390 (8.7%) | 303 (7.0%) |
| 15 to 19 Minutes | 361 (8.1%) | 604 (14.0%) |
| 20 to 24 Minutes | 699 (15.6%) | 743 (17.2%) |
| 25 to 29 Minutes | 251 (5.6%) | 527 (12.2%) |
| 30 to 34 Minutes | 776 (17.3%) | 408 (9.5%) |
| 35 to 39 Minutes | 179 (4.0%) | 198 (4.6%) |
| 40 to 44 Minutes | 134 (3.0%) | 74 (1.7%) |
| 45 to 59 Minutes | 679 (15.1%) | 460 (10.7%) |
| 60 to 89 Minutes | 431 (9.6%) | 465 (10.8%) |
| 90 or more Minutes | 248 (5.5%) | 167 (3.9%) |
Time of Departure to Work by Sex in Dumont borough
The most frequent times of departure to work in Dumont borough are 8:00 AM to 8:29 AM (708, 15.8%) for males and 7:30 AM to 7:59 AM (1,070, 24.8%) for females.
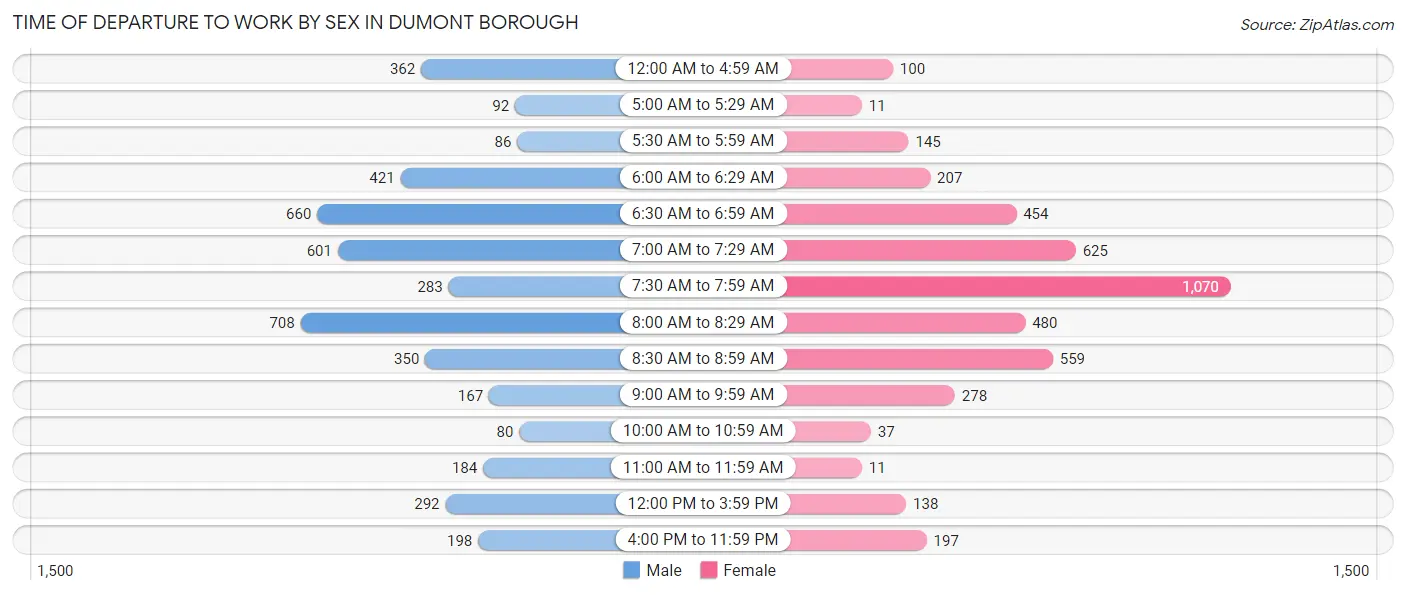
| Time of Departure | Male | Female |
| 12:00 AM to 4:59 AM | 362 (8.1%) | 100 (2.3%) |
| 5:00 AM to 5:29 AM | 92 (2.1%) | 11 (0.3%) |
| 5:30 AM to 5:59 AM | 86 (1.9%) | 145 (3.4%) |
| 6:00 AM to 6:29 AM | 421 (9.4%) | 207 (4.8%) |
| 6:30 AM to 6:59 AM | 660 (14.7%) | 454 (10.5%) |
| 7:00 AM to 7:29 AM | 601 (13.4%) | 625 (14.5%) |
| 7:30 AM to 7:59 AM | 283 (6.3%) | 1,070 (24.8%) |
| 8:00 AM to 8:29 AM | 708 (15.8%) | 480 (11.1%) |
| 8:30 AM to 8:59 AM | 350 (7.8%) | 559 (13.0%) |
| 9:00 AM to 9:59 AM | 167 (3.7%) | 278 (6.5%) |
| 10:00 AM to 10:59 AM | 80 (1.8%) | 37 (0.9%) |
| 11:00 AM to 11:59 AM | 184 (4.1%) | 11 (0.3%) |
| 12:00 PM to 3:59 PM | 292 (6.5%) | 138 (3.2%) |
| 4:00 PM to 11:59 PM | 198 (4.4%) | 197 (4.6%) |
| Total | 4,484 (100.0%) | 4,312 (100.0%) |
Housing Occupancy in Dumont borough
Occupancy by Ownership in Dumont borough
Of the total 6,593 dwellings in Dumont borough, owner-occupied units account for 4,760 (72.2%), while renter-occupied units make up 1,833 (27.8%).
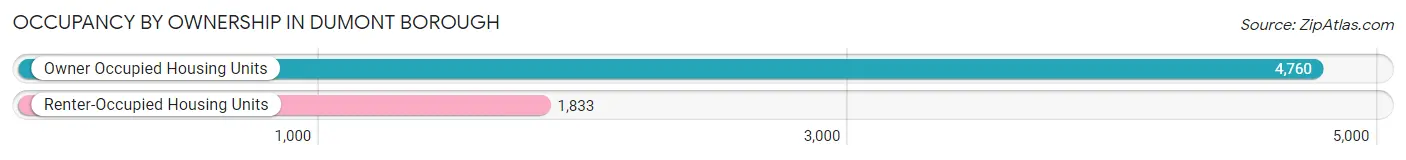
| Occupancy | # Housing Units | % Housing Units |
| Owner Occupied Housing Units | 4,760 | 72.2% |
| Renter-Occupied Housing Units | 1,833 | 27.8% |
| Total Occupied Housing Units | 6,593 | 100.0% |
Occupancy by Household Size in Dumont borough
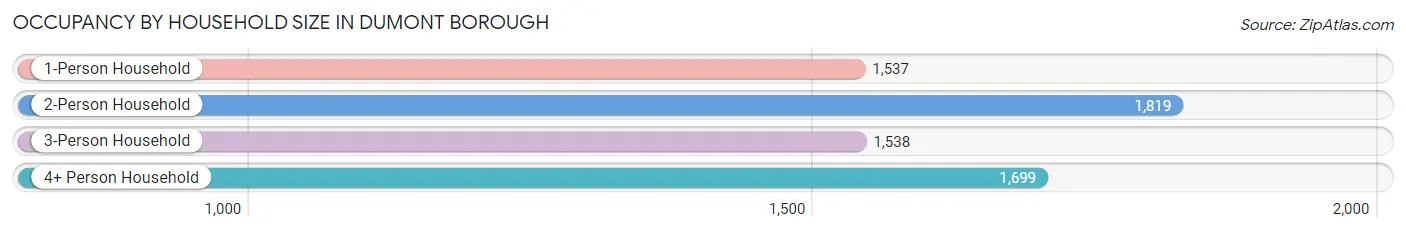
| Household Size | # Housing Units | % Housing Units |
| 1-Person Household | 1,537 | 23.3% |
| 2-Person Household | 1,819 | 27.6% |
| 3-Person Household | 1,538 | 23.3% |
| 4+ Person Household | 1,699 | 25.8% |
| Total Housing Units | 6,593 | 100.0% |
Occupancy by Ownership by Household Size in Dumont borough
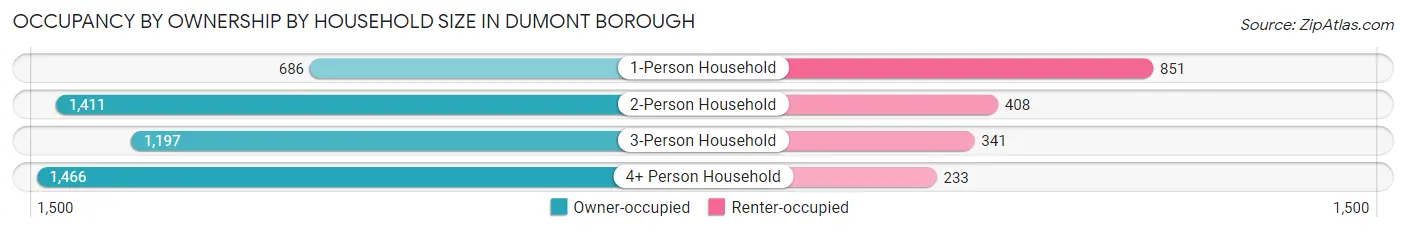
| Household Size | Owner-occupied | Renter-occupied |
| 1-Person Household | 686 (44.6%) | 851 (55.4%) |
| 2-Person Household | 1,411 (77.6%) | 408 (22.4%) |
| 3-Person Household | 1,197 (77.8%) | 341 (22.2%) |
| 4+ Person Household | 1,466 (86.3%) | 233 (13.7%) |
| Total Housing Units | 4,760 (72.2%) | 1,833 (27.8%) |
Occupancy by Educational Attainment in Dumont borough
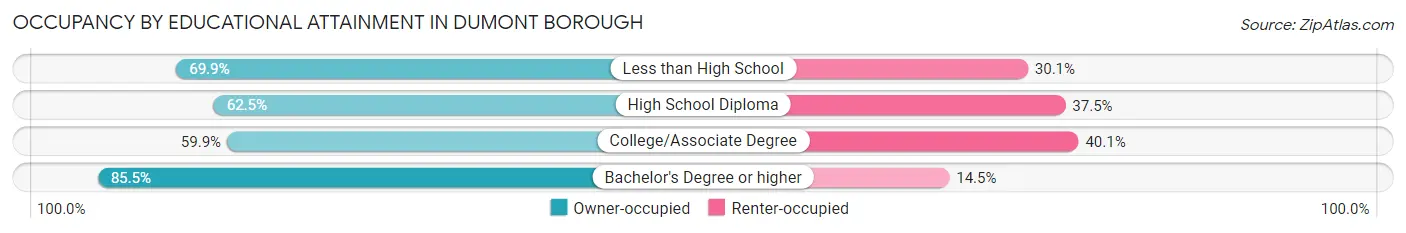
| Household Size | Owner-occupied | Renter-occupied |
| Less than High School | 179 (69.9%) | 77 (30.1%) |
| High School Diploma | 1,024 (62.5%) | 615 (37.5%) |
| College/Associate Degree | 1,075 (59.9%) | 720 (40.1%) |
| Bachelor's Degree or higher | 2,482 (85.5%) | 421 (14.5%) |
Occupancy by Age of Householder in Dumont borough
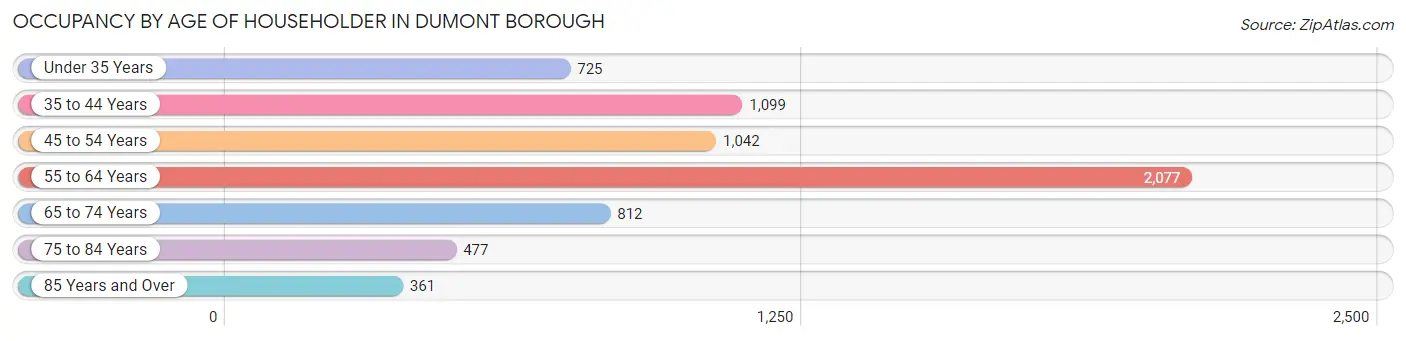
| Age Bracket | # Households | % Households |
| Under 35 Years | 725 | 11.0% |
| 35 to 44 Years | 1,099 | 16.7% |
| 45 to 54 Years | 1,042 | 15.8% |
| 55 to 64 Years | 2,077 | 31.5% |
| 65 to 74 Years | 812 | 12.3% |
| 75 to 84 Years | 477 | 7.2% |
| 85 Years and Over | 361 | 5.5% |
| Total | 6,593 | 100.0% |
Housing Finances in Dumont borough
Median Income by Occupancy in Dumont borough
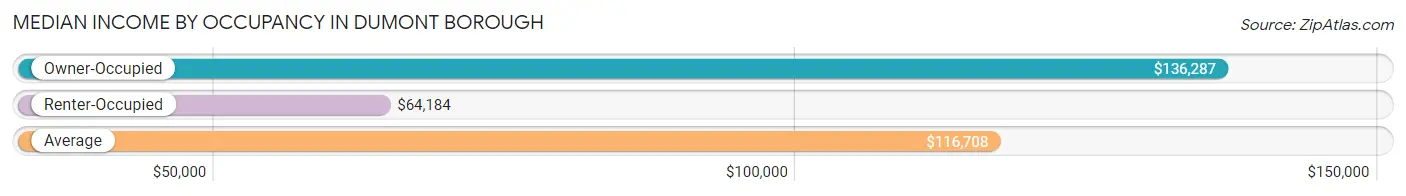
| Occupancy Type | # Households | Median Income |
| Owner-Occupied | 4,760 (72.2%) | $136,287 |
| Renter-Occupied | 1,833 (27.8%) | $64,184 |
| Average | 6,593 (100.0%) | $116,708 |
Occupancy by Householder Income Bracket in Dumont borough
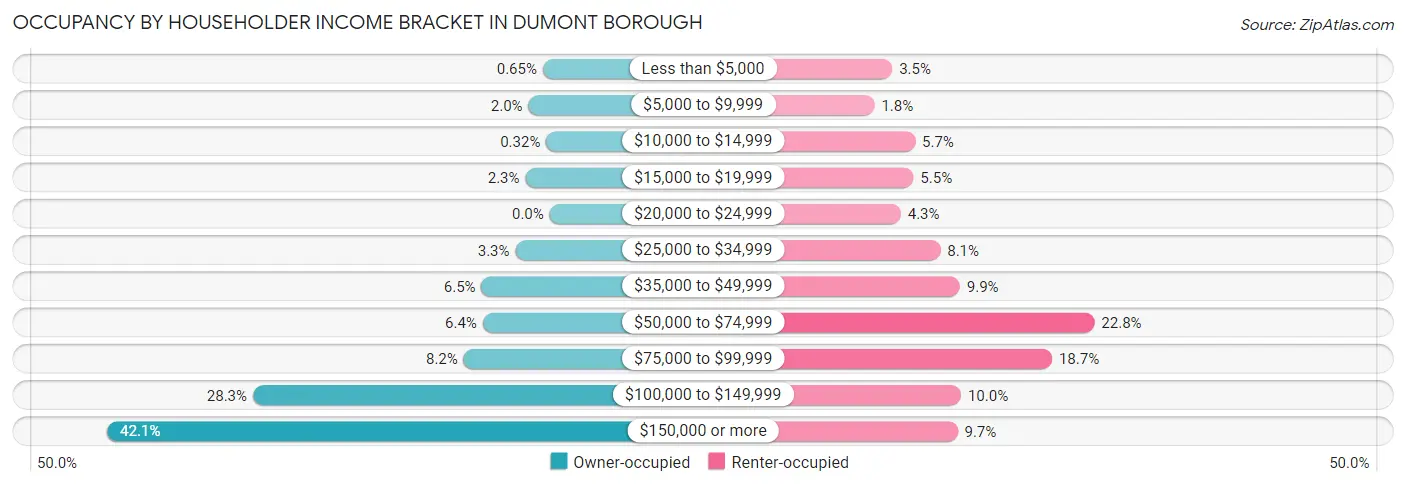
| Income Bracket | Owner-occupied | Renter-occupied |
| Less than $5,000 | 31 (0.6%) | 64 (3.5%) |
| $5,000 to $9,999 | 96 (2.0%) | 33 (1.8%) |
| $10,000 to $14,999 | 15 (0.3%) | 104 (5.7%) |
| $15,000 to $19,999 | 110 (2.3%) | 101 (5.5%) |
| $20,000 to $24,999 | 0 (0.0%) | 79 (4.3%) |
| $25,000 to $34,999 | 155 (3.3%) | 148 (8.1%) |
| $35,000 to $49,999 | 309 (6.5%) | 182 (9.9%) |
| $50,000 to $74,999 | 303 (6.4%) | 417 (22.8%) |
| $75,000 to $99,999 | 390 (8.2%) | 343 (18.7%) |
| $100,000 to $149,999 | 1,345 (28.3%) | 184 (10.0%) |
| $150,000 or more | 2,006 (42.1%) | 178 (9.7%) |
| Total | 4,760 (100.0%) | 1,833 (100.0%) |
Monthly Housing Cost Tiers in Dumont borough
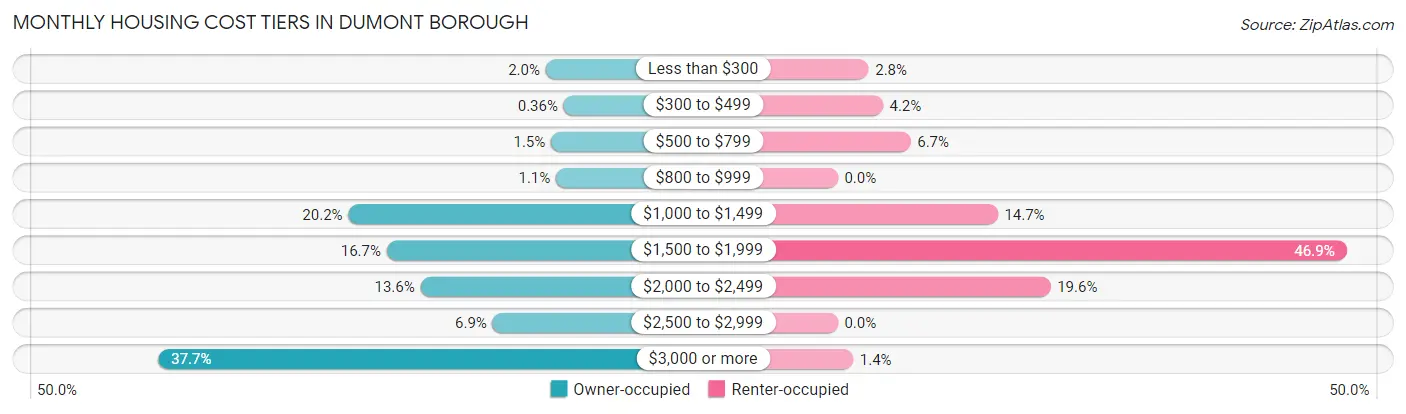
| Monthly Cost | Owner-occupied | Renter-occupied |
| Less than $300 | 96 (2.0%) | 52 (2.8%) |
| $300 to $499 | 17 (0.4%) | 76 (4.2%) |
| $500 to $799 | 73 (1.5%) | 123 (6.7%) |
| $800 to $999 | 51 (1.1%) | 0 (0.0%) |
| $1,000 to $1,499 | 961 (20.2%) | 270 (14.7%) |
| $1,500 to $1,999 | 793 (16.7%) | 859 (46.9%) |
| $2,000 to $2,499 | 645 (13.6%) | 359 (19.6%) |
| $2,500 to $2,999 | 329 (6.9%) | 0 (0.0%) |
| $3,000 or more | 1,795 (37.7%) | 26 (1.4%) |
| Total | 4,760 (100.0%) | 1,833 (100.0%) |
Physical Housing Characteristics in Dumont borough
Housing Structures in Dumont borough
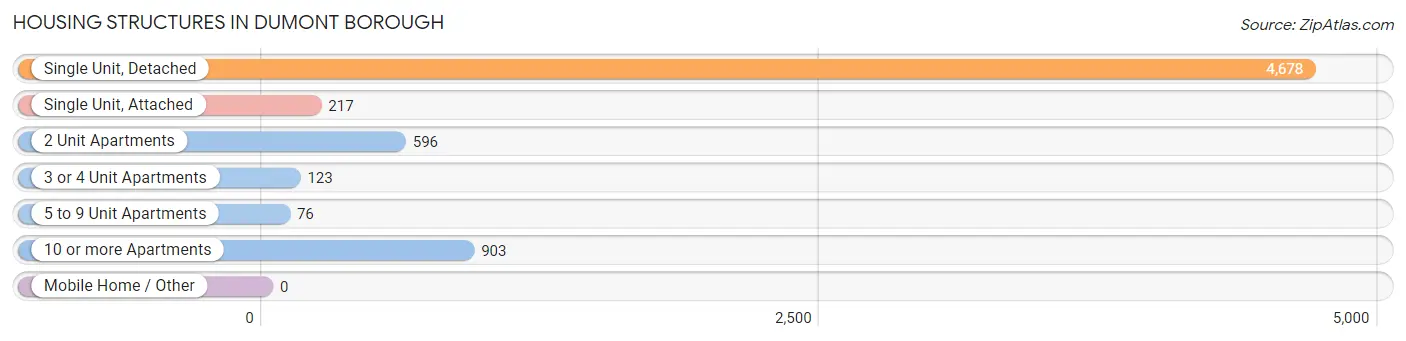
| Structure Type | # Housing Units | % Housing Units |
| Single Unit, Detached | 4,678 | 71.0% |
| Single Unit, Attached | 217 | 3.3% |
| 2 Unit Apartments | 596 | 9.0% |
| 3 or 4 Unit Apartments | 123 | 1.9% |
| 5 to 9 Unit Apartments | 76 | 1.1% |
| 10 or more Apartments | 903 | 13.7% |
| Mobile Home / Other | 0 | 0.0% |
| Total | 6,593 | 100.0% |
Housing Structures by Occupancy in Dumont borough
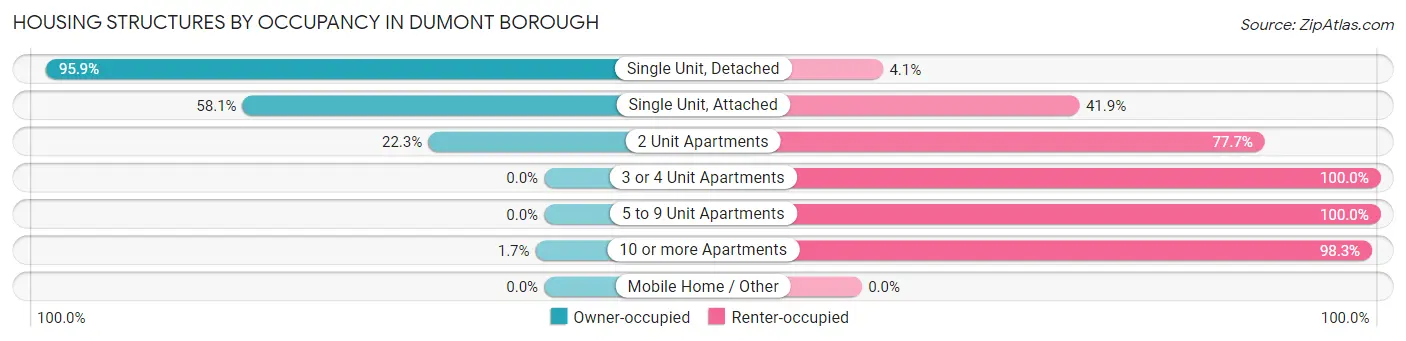
| Structure Type | Owner-occupied | Renter-occupied |
| Single Unit, Detached | 4,486 (95.9%) | 192 (4.1%) |
| Single Unit, Attached | 126 (58.1%) | 91 (41.9%) |
| 2 Unit Apartments | 133 (22.3%) | 463 (77.7%) |
| 3 or 4 Unit Apartments | 0 (0.0%) | 123 (100.0%) |
| 5 to 9 Unit Apartments | 0 (0.0%) | 76 (100.0%) |
| 10 or more Apartments | 15 (1.7%) | 888 (98.3%) |
| Mobile Home / Other | 0 (0.0%) | 0 (0.0%) |
| Total | 4,760 (72.2%) | 1,833 (27.8%) |
Housing Structures by Number of Rooms in Dumont borough
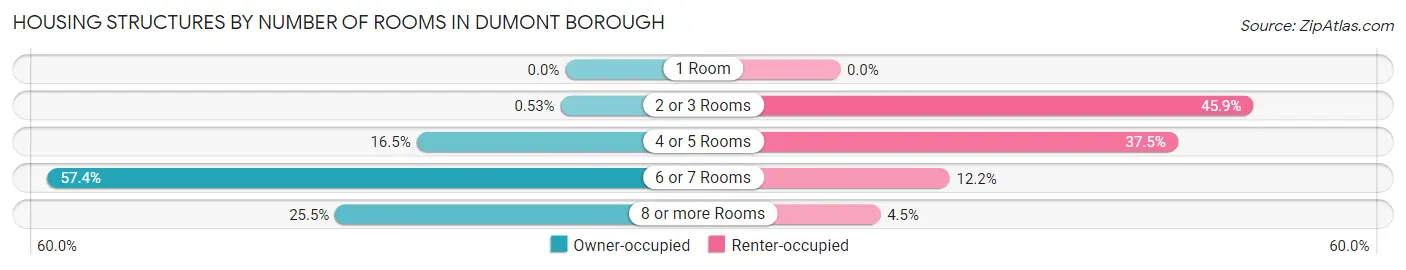
| Number of Rooms | Owner-occupied | Renter-occupied |
| 1 Room | 0 (0.0%) | 0 (0.0%) |
| 2 or 3 Rooms | 25 (0.5%) | 841 (45.9%) |
| 4 or 5 Rooms | 786 (16.5%) | 687 (37.5%) |
| 6 or 7 Rooms | 2,734 (57.4%) | 223 (12.2%) |
| 8 or more Rooms | 1,215 (25.5%) | 82 (4.5%) |
| Total | 4,760 (100.0%) | 1,833 (100.0%) |
Housing Structure by Heating Type in Dumont borough
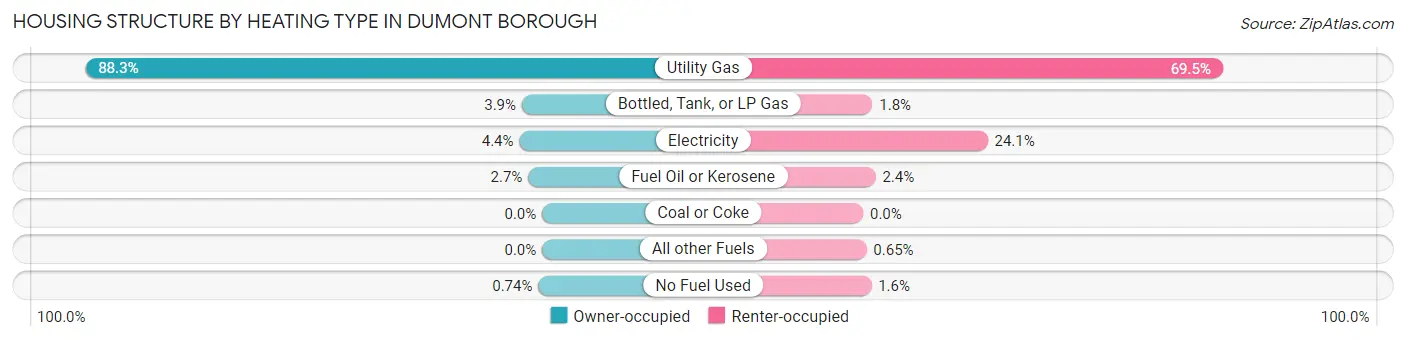
| Heating Type | Owner-occupied | Renter-occupied |
| Utility Gas | 4,202 (88.3%) | 1,274 (69.5%) |
| Bottled, Tank, or LP Gas | 186 (3.9%) | 33 (1.8%) |
| Electricity | 209 (4.4%) | 441 (24.1%) |
| Fuel Oil or Kerosene | 128 (2.7%) | 44 (2.4%) |
| Coal or Coke | 0 (0.0%) | 0 (0.0%) |
| All other Fuels | 0 (0.0%) | 12 (0.6%) |
| No Fuel Used | 35 (0.7%) | 29 (1.6%) |
| Total | 4,760 (100.0%) | 1,833 (100.0%) |
Household Vehicle Usage in Dumont borough
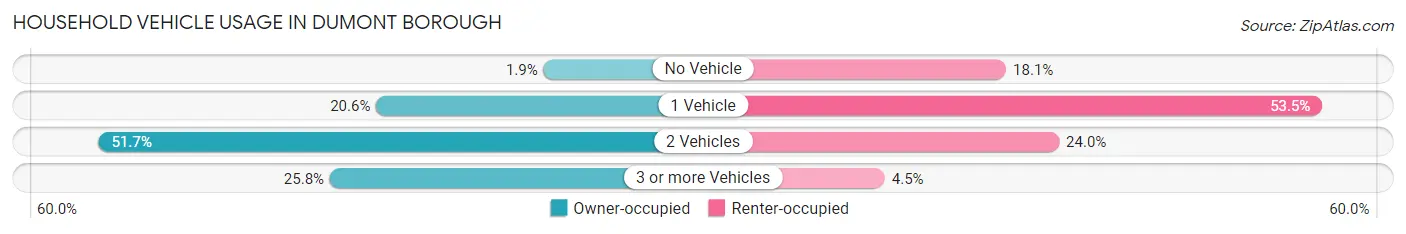
| Vehicles per Household | Owner-occupied | Renter-occupied |
| No Vehicle | 89 (1.9%) | 331 (18.1%) |
| 1 Vehicle | 981 (20.6%) | 980 (53.5%) |
| 2 Vehicles | 2,462 (51.7%) | 440 (24.0%) |
| 3 or more Vehicles | 1,228 (25.8%) | 82 (4.5%) |
| Total | 4,760 (100.0%) | 1,833 (100.0%) |
Real Estate & Mortgages in Dumont borough
Real Estate and Mortgage Overview in Dumont borough
| Characteristic | Without Mortgage | With Mortgage |
| Housing Units | 1,736 | 3,024 |
| Median Property Value | $419,400 | $449,700 |
| Median Household Income | $94,859 | $1,542 |
| Monthly Housing Costs | $1,412 | $1,795 |
| Real Estate Taxes | $10,001 | $98 |
Property Value by Mortgage Status in Dumont borough
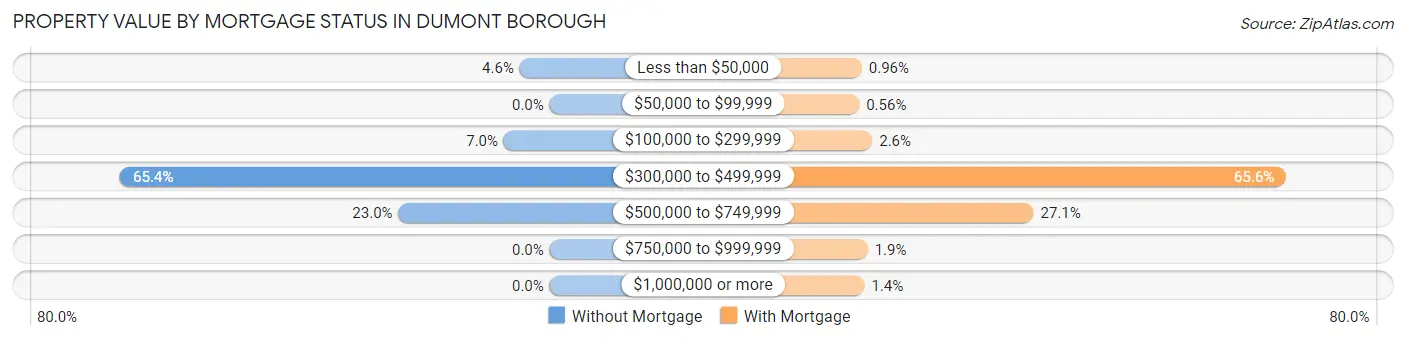
| Property Value | Without Mortgage | With Mortgage |
| Less than $50,000 | 79 (4.5%) | 29 (1.0%) |
| $50,000 to $99,999 | 0 (0.0%) | 17 (0.6%) |
| $100,000 to $299,999 | 121 (7.0%) | 77 (2.5%) |
| $300,000 to $499,999 | 1,136 (65.4%) | 1,984 (65.6%) |
| $500,000 to $749,999 | 400 (23.0%) | 820 (27.1%) |
| $750,000 to $999,999 | 0 (0.0%) | 56 (1.8%) |
| $1,000,000 or more | 0 (0.0%) | 41 (1.4%) |
| Total | 1,736 (100.0%) | 3,024 (100.0%) |
Household Income by Mortgage Status in Dumont borough
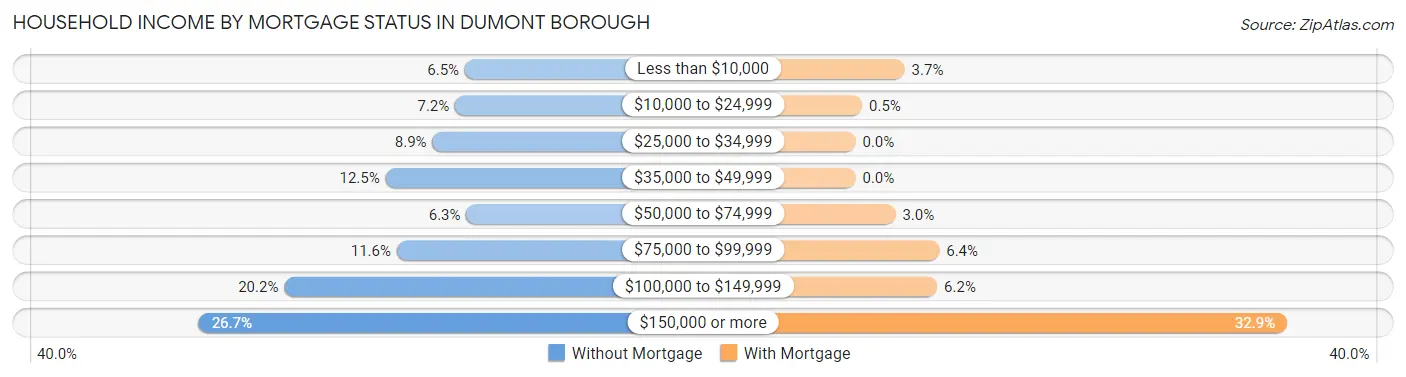
| Household Income | Without Mortgage | With Mortgage |
| Less than $10,000 | 112 (6.5%) | 113 (3.7%) |
| $10,000 to $24,999 | 125 (7.2%) | 15 (0.5%) |
| $25,000 to $34,999 | 155 (8.9%) | 0 (0.0%) |
| $35,000 to $49,999 | 217 (12.5%) | 0 (0.0%) |
| $50,000 to $74,999 | 110 (6.3%) | 92 (3.0%) |
| $75,000 to $99,999 | 202 (11.6%) | 193 (6.4%) |
| $100,000 to $149,999 | 351 (20.2%) | 188 (6.2%) |
| $150,000 or more | 464 (26.7%) | 994 (32.9%) |
| Total | 1,736 (100.0%) | 3,024 (100.0%) |
Property Value to Household Income Ratio in Dumont borough
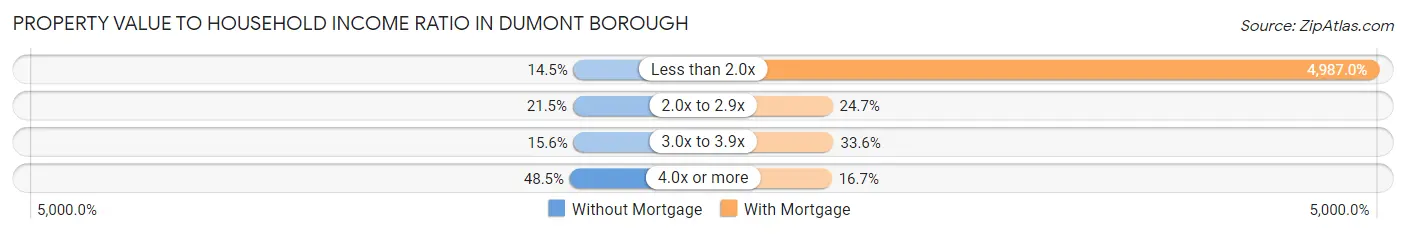
| Value-to-Income Ratio | Without Mortgage | With Mortgage |
| Less than 2.0x | 251 (14.5%) | 150,806 (4,987.0%) |
| 2.0x to 2.9x | 373 (21.5%) | 746 (24.7%) |
| 3.0x to 3.9x | 270 (15.5%) | 1,017 (33.6%) |
| 4.0x or more | 842 (48.5%) | 504 (16.7%) |
| Total | 1,736 (100.0%) | 3,024 (100.0%) |
Real Estate Taxes by Mortgage Status in Dumont borough

| Property Taxes | Without Mortgage | With Mortgage |
| Less than $800 | 79 (4.5%) | 0 (0.0%) |
| $800 to $1,499 | 0 (0.0%) | 17 (0.6%) |
| $800 to $1,499 | 1,620 (93.3%) | 29 (1.0%) |
| Total | 1,736 (100.0%) | 3,024 (100.0%) |
Health & Disability in Dumont borough
Health Insurance Coverage by Age in Dumont borough
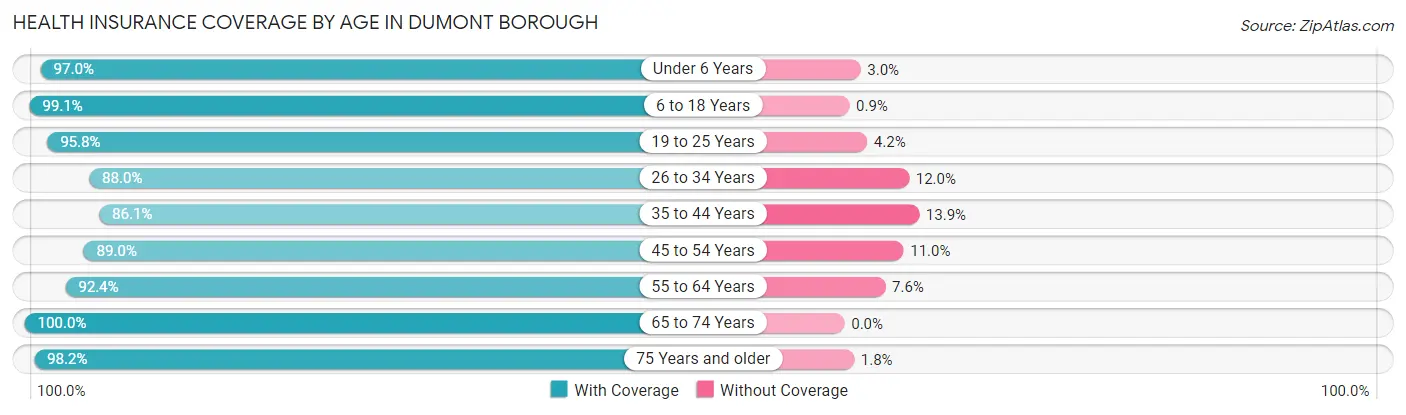
| Age Bracket | With Coverage | Without Coverage |
| Under 6 Years | 807 (97.0%) | 25 (3.0%) |
| 6 to 18 Years | 2,740 (99.1%) | 25 (0.9%) |
| 19 to 25 Years | 1,771 (95.8%) | 78 (4.2%) |
| 26 to 34 Years | 1,616 (88.0%) | 221 (12.0%) |
| 35 to 44 Years | 1,782 (86.1%) | 288 (13.9%) |
| 45 to 54 Years | 1,909 (89.0%) | 236 (11.0%) |
| 55 to 64 Years | 3,461 (92.4%) | 285 (7.6%) |
| 65 to 74 Years | 1,257 (100.0%) | 0 (0.0%) |
| 75 Years and older | 1,486 (98.2%) | 27 (1.8%) |
| Total | 16,829 (93.4%) | 1,185 (6.6%) |
Health Insurance Coverage by Citizenship Status in Dumont borough

| Citizenship Status | With Coverage | Without Coverage |
| Native Born | 807 (97.0%) | 25 (3.0%) |
| Foreign Born, Citizen | 2,740 (99.1%) | 25 (0.9%) |
| Foreign Born, not a Citizen | 1,771 (95.8%) | 78 (4.2%) |
Health Insurance Coverage by Household Income in Dumont borough
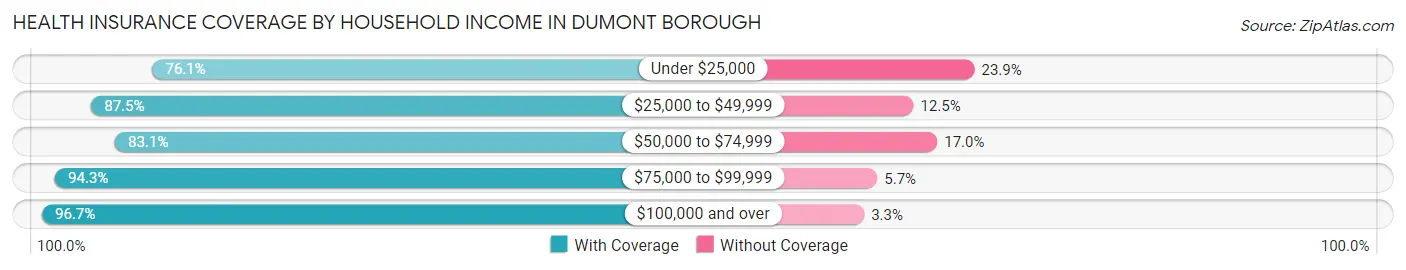
| Household Income | With Coverage | Without Coverage |
| Under $25,000 | 899 (76.1%) | 283 (23.9%) |
| $25,000 to $49,999 | 1,112 (87.5%) | 159 (12.5%) |
| $50,000 to $74,999 | 1,112 (83.1%) | 227 (17.0%) |
| $75,000 to $99,999 | 1,944 (94.3%) | 118 (5.7%) |
| $100,000 and over | 11,746 (96.7%) | 397 (3.3%) |
Public vs Private Health Insurance Coverage by Age in Dumont borough
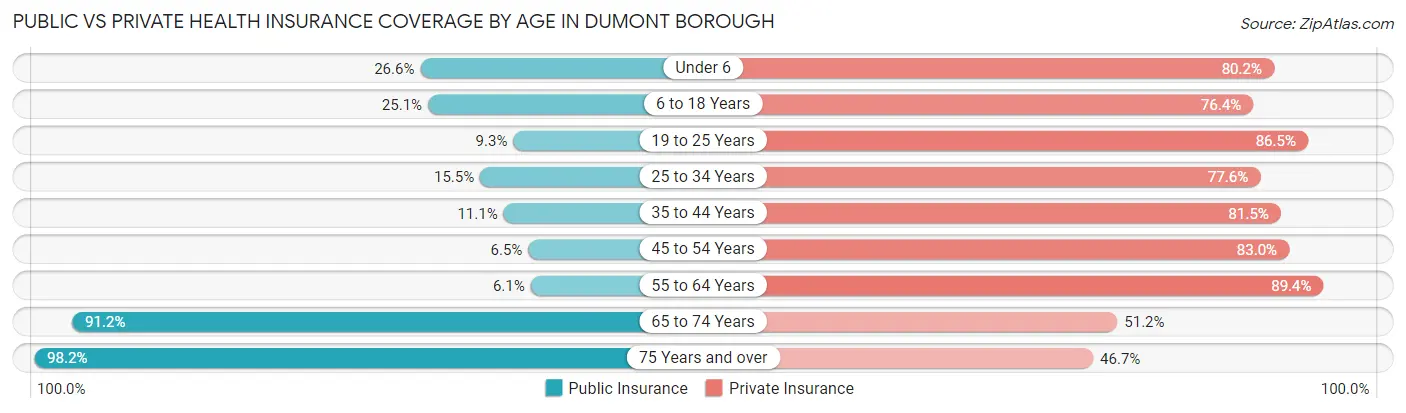
| Age Bracket | Public Insurance | Private Insurance |
| Under 6 | 221 (26.6%) | 667 (80.2%) |
| 6 to 18 Years | 695 (25.1%) | 2,111 (76.3%) |
| 19 to 25 Years | 172 (9.3%) | 1,599 (86.5%) |
| 25 to 34 Years | 284 (15.5%) | 1,426 (77.6%) |
| 35 to 44 Years | 230 (11.1%) | 1,686 (81.5%) |
| 45 to 54 Years | 140 (6.5%) | 1,780 (83.0%) |
| 55 to 64 Years | 228 (6.1%) | 3,348 (89.4%) |
| 65 to 74 Years | 1,146 (91.2%) | 643 (51.1%) |
| 75 Years and over | 1,486 (98.2%) | 706 (46.7%) |
| Total | 4,602 (25.6%) | 13,966 (77.5%) |
Disability Status by Sex by Age in Dumont borough
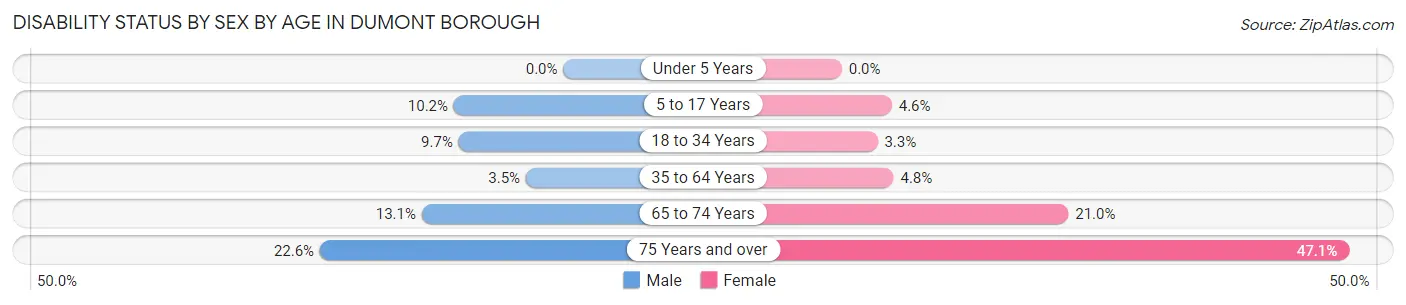
| Age Bracket | Male | Female |
| Under 5 Years | 0 (0.0%) | 0 (0.0%) |
| 5 to 17 Years | 129 (10.2%) | 65 (4.6%) |
| 18 to 34 Years | 195 (9.7%) | 62 (3.3%) |
| 35 to 64 Years | 136 (3.5%) | 194 (4.8%) |
| 65 to 74 Years | 72 (13.1%) | 149 (21.0%) |
| 75 Years and over | 122 (22.6%) | 458 (47.1%) |
Disability Class by Sex by Age in Dumont borough
Disability Class: Hearing Difficulty
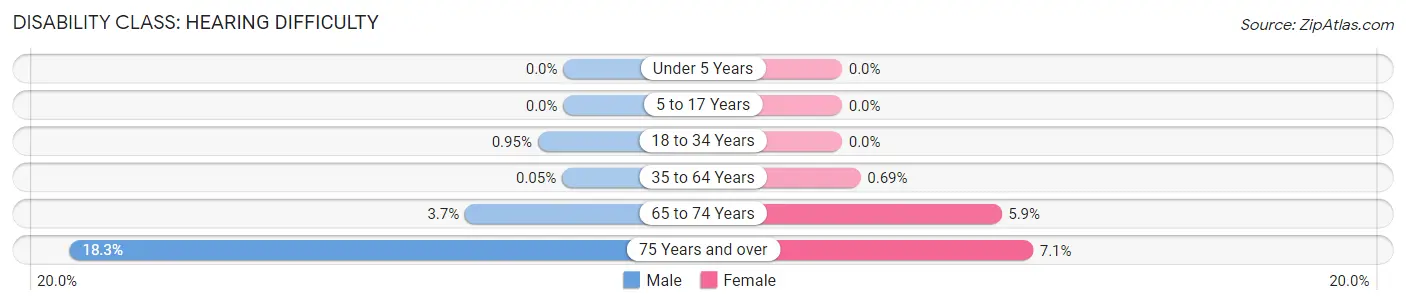
| Age Bracket | Male | Female |
| Under 5 Years | 0 (0.0%) | 0 (0.0%) |
| 5 to 17 Years | 0 (0.0%) | 0 (0.0%) |
| 18 to 34 Years | 19 (0.9%) | 0 (0.0%) |
| 35 to 64 Years | 2 (0.1%) | 28 (0.7%) |
| 65 to 74 Years | 20 (3.6%) | 42 (5.9%) |
| 75 Years and over | 99 (18.3%) | 69 (7.1%) |
Disability Class: Vision Difficulty
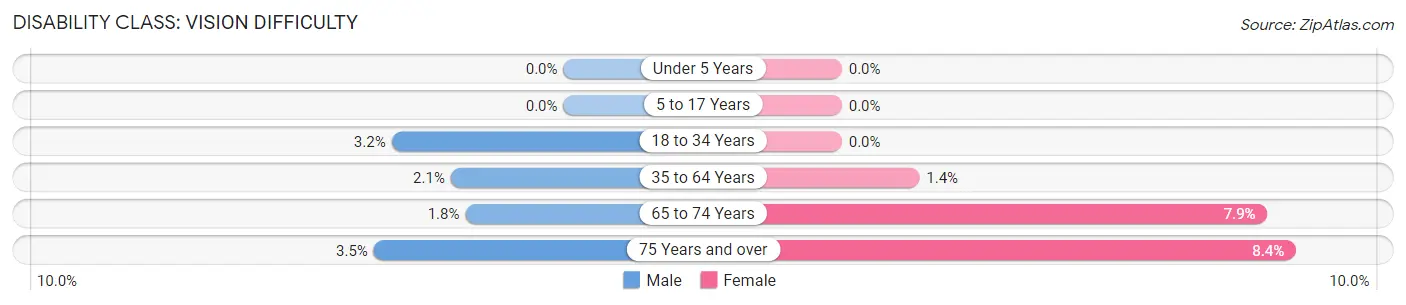
| Age Bracket | Male | Female |
| Under 5 Years | 0 (0.0%) | 0 (0.0%) |
| 5 to 17 Years | 0 (0.0%) | 0 (0.0%) |
| 18 to 34 Years | 64 (3.2%) | 0 (0.0%) |
| 35 to 64 Years | 82 (2.1%) | 58 (1.4%) |
| 65 to 74 Years | 10 (1.8%) | 56 (7.9%) |
| 75 Years and over | 19 (3.5%) | 82 (8.4%) |
Disability Class: Cognitive Difficulty
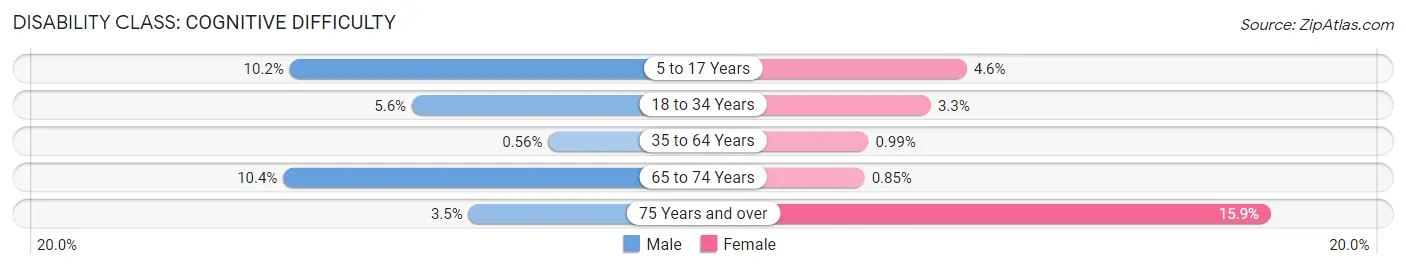
| Age Bracket | Male | Female |
| 5 to 17 Years | 129 (10.2%) | 65 (4.6%) |
| 18 to 34 Years | 113 (5.6%) | 62 (3.3%) |
| 35 to 64 Years | 22 (0.6%) | 40 (1.0%) |
| 65 to 74 Years | 57 (10.4%) | 6 (0.9%) |
| 75 Years and over | 19 (3.5%) | 155 (15.9%) |
Disability Class: Ambulatory Difficulty
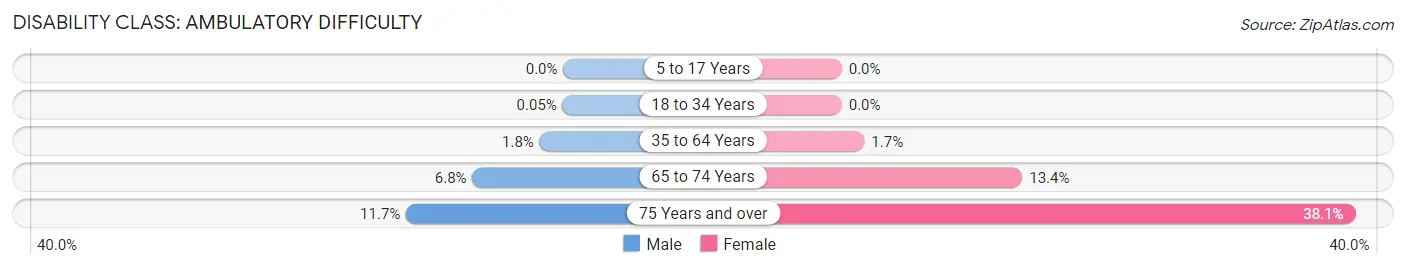
| Age Bracket | Male | Female |
| 5 to 17 Years | 0 (0.0%) | 0 (0.0%) |
| 18 to 34 Years | 1 (0.1%) | 0 (0.0%) |
| 35 to 64 Years | 69 (1.8%) | 68 (1.7%) |
| 65 to 74 Years | 37 (6.8%) | 95 (13.4%) |
| 75 Years and over | 63 (11.7%) | 371 (38.1%) |
Disability Class: Self-Care Difficulty
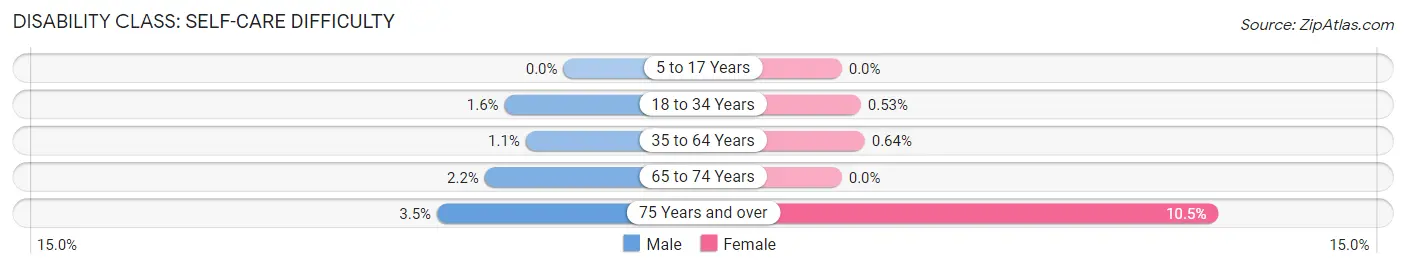
| Age Bracket | Male | Female |
| 5 to 17 Years | 0 (0.0%) | 0 (0.0%) |
| 18 to 34 Years | 33 (1.6%) | 10 (0.5%) |
| 35 to 64 Years | 41 (1.1%) | 26 (0.6%) |
| 65 to 74 Years | 12 (2.2%) | 0 (0.0%) |
| 75 Years and over | 19 (3.5%) | 102 (10.5%) |
Technology Access in Dumont borough
Computing Device Access in Dumont borough
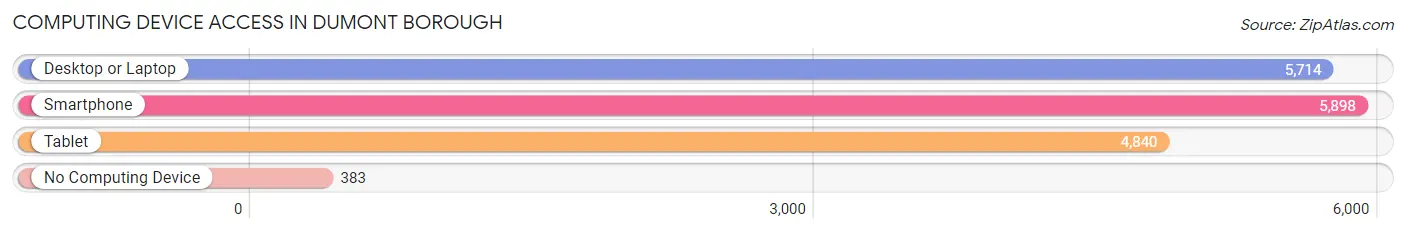
| Device Type | # Households | % Households |
| Desktop or Laptop | 5,714 | 86.7% |
| Smartphone | 5,898 | 89.5% |
| Tablet | 4,840 | 73.4% |
| No Computing Device | 383 | 5.8% |
| Total | 6,593 | 100.0% |
Internet Access in Dumont borough
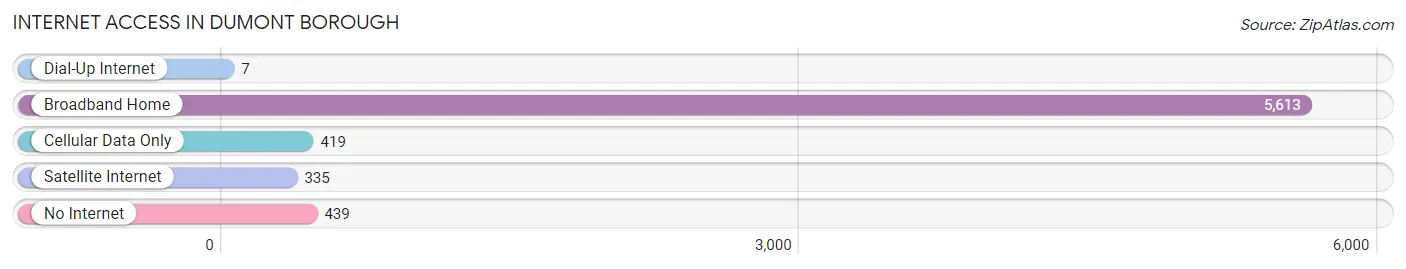
| Internet Type | # Households | % Households |
| Dial-Up Internet | 7 | 0.1% |
| Broadband Home | 5,613 | 85.1% |
| Cellular Data Only | 419 | 6.4% |
| Satellite Internet | 335 | 5.1% |
| No Internet | 439 | 6.7% |
| Total | 6,593 | 100.0% |
Dumont borough Summary
Dumont Borough is a small borough located in Bergen County, New Jersey. It is situated in the northern part of the state, just west of the Hudson River. The borough is bordered by the towns of Bergenfield, New Milford, and Tenafly. As of the 2010 United States Census, the borough had a population of 17,479, making it the second-smallest municipality in Bergen County.
History
The area that is now Dumont was originally inhabited by the Lenni Lenape Native Americans. The first European settlers arrived in the area in the late 17th century, and the area was officially incorporated as a borough in 1894. The borough was named after the Dumont family, who were among the first settlers in the area.
The borough was primarily a rural farming community until the early 20th century, when it began to experience rapid growth due to its proximity to New York City. The borough was home to several factories, including a silk mill, a paper mill, and a brickyard. The borough also had a thriving dairy industry, with several farms located in the area.
Geography
Dumont Borough is located in the northern part of Bergen County, just west of the Hudson River. It is bordered by the towns of Bergenfield, New Milford, and Tenafly. The borough covers an area of 2.3 square miles, with a population density of 7,541 people per square mile.
The borough is located in the Hackensack River watershed, and is home to several small streams, including the Oradell River, the Hackensack River, and the Saddle River. The borough is also home to several parks, including the Dumont Memorial Park, the Oradell Reservoir, and the Tenafly Nature Center.
Economy
Dumont Borough has a diverse economy, with a mix of retail, manufacturing, and service-based businesses. The borough is home to several large employers, including the Bergen County Technical School, the Bergen County Utilities Authority, and the Bergen County Sheriff’s Office.
The borough is also home to several small businesses, including restaurants, retail stores, and professional services. The borough is also home to several industrial parks, which are home to a variety of manufacturing and service-based businesses.
Demographics
As of the 2010 United States Census, the borough had a population of 17,479, with a population density of 7,541 people per square mile. The racial makeup of the borough was 79.2% White, 8.2% African American, 0.3% Native American, 6.7% Asian, and 4.6% from other races. Hispanic or Latino of any race were 15.2% of the population.
The median household income in the borough was $76,845, and the median family income was $90,945. The per capita income was $35,945. About 4.3% of families and 5.7% of the population were below the poverty line, including 6.7% of those under age 18 and 5.2% of those age 65 or over.
The borough is served by the Dumont Public Schools, which consists of four elementary schools, one middle school, and one high school. The borough is also home to several private schools, including the Bergen County Technical School and the Tenafly Montessori School.
Common Questions
What is Per Capita Income in Dumont borough?
Per Capita income in Dumont borough is $52,142.
What is the Median Family Income in Dumont borough?
Median Family Income in Dumont borough is $135,125.
What is the Median Household income in Dumont borough?
Median Household Income in Dumont borough is $116,708.
What is Income or Wage Gap in Dumont borough?
Income or Wage Gap in Dumont borough is 39.5%.
Women in Dumont borough earn 60.5 cents for every dollar earned by a man.
What is Family Income Deficit in Dumont borough?
Family Income Deficit in Dumont borough is $10,113.
Families that are below poverty line in Dumont borough earn $10,113 less on average than the poverty threshold level.
What is Inequality or Gini Index in Dumont borough?
Inequality or Gini Index in Dumont borough is 0.43.
What is the Total Population of Dumont borough?
Total Population of Dumont borough is 18,014.
What is the Total Male Population of Dumont borough?
Total Male Population of Dumont borough is 8,561.
What is the Total Female Population of Dumont borough?
Total Female Population of Dumont borough is 9,453.
What is the Ratio of Males per 100 Females in Dumont borough?
There are 90.56 Males per 100 Females in Dumont borough.
What is the Ratio of Females per 100 Males in Dumont borough?
There are 110.42 Females per 100 Males in Dumont borough.
What is the Median Population Age in Dumont borough?
Median Population Age in Dumont borough is 42.3 Years.
What is the Average Family Size in Dumont borough
Average Family Size in Dumont borough is 3.3 People.
What is the Average Household Size in Dumont borough
Average Household Size in Dumont borough is 2.7 People.
How Large is the Labor Force in Dumont borough?
There are 10,499 People in the Labor Forcein in Dumont borough.
What is the Percentage of People in the Labor Force in Dumont borough?
69.3% of People are in the Labor Force in Dumont borough.
What is the Unemployment Rate in Dumont borough?
Unemployment Rate in Dumont borough is 5.1%.