Cities with the Highest Percentage of Asian Population in Kentucky
RELATED REPORTS & OPTIONS
Asian
Kentucky
Compare Cities
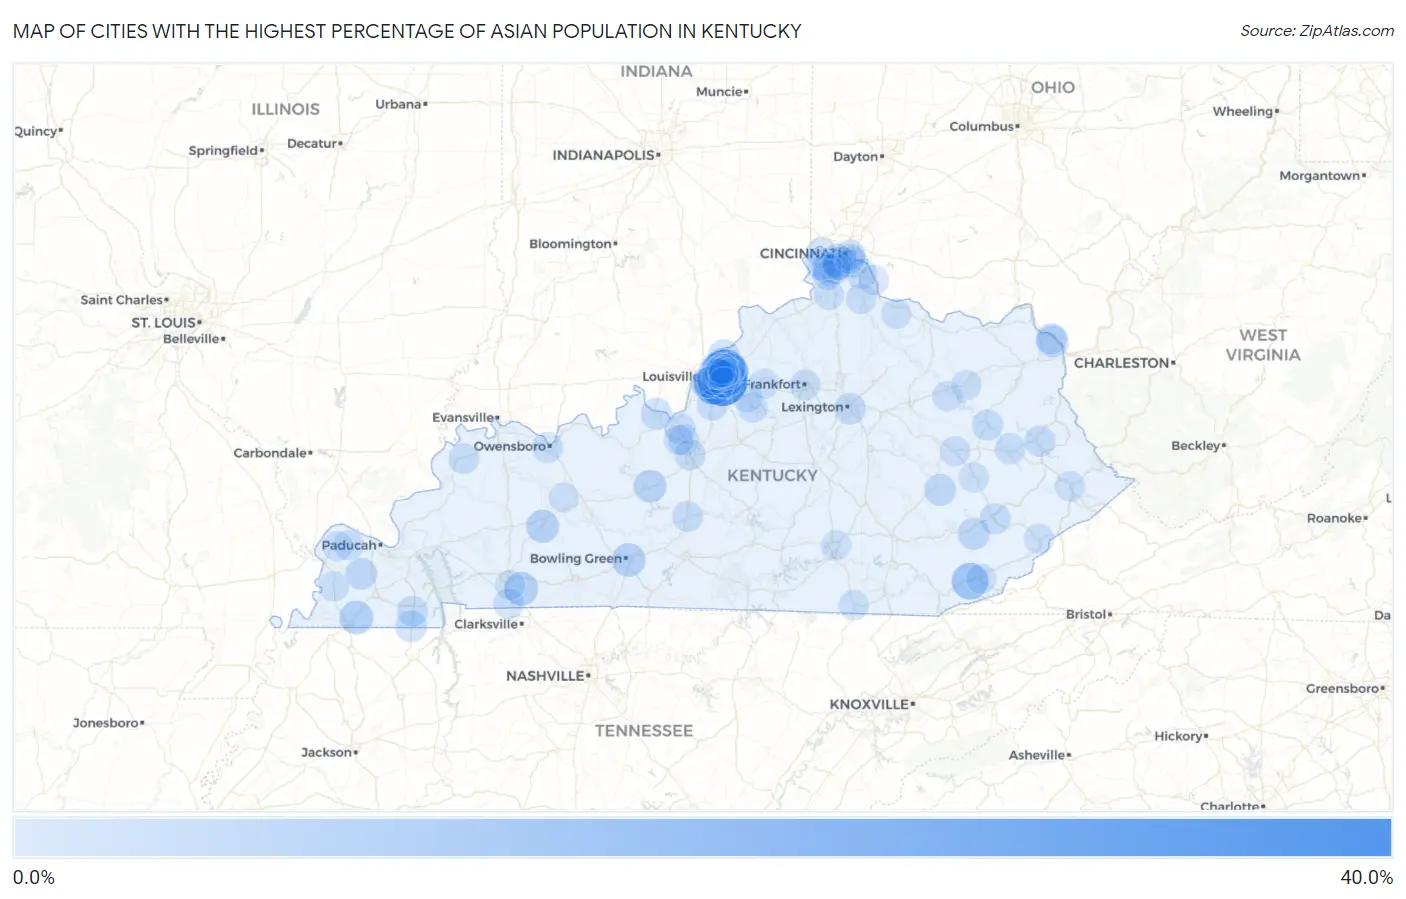
Map of Cities with the Highest Percentage of Asian Population in Kentucky
0.0%
40.0%
Cities with the Highest Percentage of Asian Population in Kentucky
| City | Asian | vs State | vs National | |
| 1. | Hurstbourne Acres | 38.1% | 1.5%(+36.6)#1 | 5.8%(+32.3)#166 |
| 2. | Meadow Vale | 31.7% | 1.5%(+30.1)#2 | 5.8%(+25.9)#241 |
| 3. | Hurstbourne | 22.9% | 1.5%(+21.3)#3 | 5.8%(+17.1)#428 |
| 4. | West Buechel | 18.2% | 1.5%(+16.6)#4 | 5.8%(+12.4)#621 |
| 5. | Wallins Creek | 13.5% | 1.5%(+12.0)#5 | 5.8%(+7.75)#953 |
| 6. | Beechwood Village | 11.9% | 1.5%(+10.4)#6 | 5.8%(+6.13)#1,134 |
| 7. | Langdon Place | 11.6% | 1.5%(+10.0)#7 | 5.8%(+5.80)#1,176 |
| 8. | Hickory Hill | 9.2% | 1.5%(+7.71)#8 | 5.8%(+3.47)#1,550 |
| 9. | Hills And Dales | 8.6% | 1.5%(+7.06)#9 | 5.8%(+2.82)#1,683 |
| 10. | Pembroke | 8.2% | 1.5%(+6.69)#10 | 5.8%(+2.45)#1,758 |
| 11. | Meadowview Estates | 8.1% | 1.5%(+6.52)#11 | 5.8%(+2.28)#1,797 |
| 12. | Water Valley | 8.0% | 1.5%(+6.42)#12 | 5.8%(+2.18)#1,820 |
| 13. | Bowling Green | 7.7% | 1.5%(+6.21)#13 | 5.8%(+1.98)#1,873 |
| 14. | St. Joseph | 7.0% | 1.5%(+5.46)#14 | 5.8%(+1.22)#2,089 |
| 15. | Middletown | 6.9% | 1.5%(+5.34)#15 | 5.8%(+1.11)#2,136 |
| 16. | Greenville | 6.8% | 1.5%(+5.28)#16 | 5.8%(+1.04)#2,164 |
| 17. | Clarkson | 6.2% | 1.5%(+4.70)#17 | 5.8%(+0.467)#2,374 |
| 18. | Fincastle | 5.6% | 1.5%(+4.08)#18 | 5.8%(-0.160)#2,661 |
| 19. | Bellefonte | 5.3% | 1.5%(+3.81)#19 | 5.8%(-0.427)#2,809 |
| 20. | Crescent Springs | 4.9% | 1.5%(+3.36)#20 | 5.8%(-0.876)#3,045 |
| 21. | Lakeside Park | 4.9% | 1.5%(+3.34)#21 | 5.8%(-0.896)#3,056 |
| 22. | Hyden | 4.8% | 1.5%(+3.22)#22 | 5.8%(-1.02)#3,112 |
| 23. | Glenview | 4.7% | 1.5%(+3.17)#23 | 5.8%(-1.07)#3,151 |
| 24. | Coldstream | 4.7% | 1.5%(+3.12)#24 | 5.8%(-1.11)#3,186 |
| 25. | Lowes | 4.5% | 1.5%(+3.01)#25 | 5.8%(-1.23)#3,273 |
| 26. | Jeffersontown | 4.4% | 1.5%(+2.85)#26 | 5.8%(-1.39)#3,382 |
| 27. | Booneville | 4.3% | 1.5%(+2.78)#27 | 5.8%(-1.46)#3,431 |
| 28. | Lexington | 4.1% | 1.5%(+2.59)#28 | 5.8%(-1.65)#3,593 |
| 29. | Ten Broeck | 4.1% | 1.5%(+2.57)#29 | 5.8%(-1.66)#3,605 |
| 30. | Hazel | 4.0% | 1.5%(+2.48)#30 | 5.8%(-1.75)#3,673 |
| 31. | Indian Hills | 3.9% | 1.5%(+2.41)#31 | 5.8%(-1.83)#3,742 |
| 32. | Brandenburg | 3.9% | 1.5%(+2.33)#32 | 5.8%(-1.91)#3,817 |
| 33. | Northfield | 3.8% | 1.5%(+2.26)#33 | 5.8%(-1.98)#3,864 |
| 34. | Wildwood | 3.8% | 1.5%(+2.25)#34 | 5.8%(-1.99)#3,876 |
| 35. | Goshen | 3.8% | 1.5%(+2.22)#35 | 5.8%(-2.01)#3,893 |
| 36. | West Van Lear | 3.8% | 1.5%(+2.22)#36 | 5.8%(-2.01)#3,897 |
| 37. | Prospect | 3.7% | 1.5%(+2.14)#37 | 5.8%(-2.10)#3,969 |
| 38. | Worthington Hills | 3.7% | 1.5%(+2.14)#38 | 5.8%(-2.10)#3,971 |
| 39. | Hazard | 3.5% | 1.5%(+2.01)#39 | 5.8%(-2.23)#4,099 |
| 40. | Parkway Village | 3.5% | 1.5%(+2.00)#40 | 5.8%(-2.24)#4,106 |
| 41. | West Liberty | 3.4% | 1.5%(+1.85)#41 | 5.8%(-2.38)#4,265 |
| 42. | Old Brownsboro Place | 3.4% | 1.5%(+1.85)#42 | 5.8%(-2.39)#4,269 |
| 43. | Paintsville | 3.3% | 1.5%(+1.76)#43 | 5.8%(-2.48)#4,366 |
| 44. | Hillview | 3.3% | 1.5%(+1.76)#44 | 5.8%(-2.48)#4,367 |
| 45. | Radcliff | 3.3% | 1.5%(+1.76)#45 | 5.8%(-2.48)#4,369 |
| 46. | Highland Heights | 3.2% | 1.5%(+1.68)#46 | 5.8%(-2.56)#4,470 |
| 47. | St Matthews | 3.2% | 1.5%(+1.64)#47 | 5.8%(-2.60)#4,510 |
| 48. | Florence | 3.2% | 1.5%(+1.64)#48 | 5.8%(-2.60)#4,514 |
| 49. | Murray | 3.1% | 1.5%(+1.52)#49 | 5.8%(-2.72)#4,666 |
| 50. | Owensboro | 2.9% | 1.5%(+1.37)#50 | 5.8%(-2.87)#4,865 |
| 51. | Russell | 2.9% | 1.5%(+1.33)#51 | 5.8%(-2.91)#4,924 |
| 52. | Alexandria | 2.8% | 1.5%(+1.30)#52 | 5.8%(-2.93)#4,959 |
| 53. | Fort Knox | 2.8% | 1.5%(+1.28)#53 | 5.8%(-2.95)#4,982 |
| 54. | Munfordville | 2.8% | 1.5%(+1.27)#54 | 5.8%(-2.97)#5,002 |
| 55. | Elizabethtown | 2.8% | 1.5%(+1.26)#55 | 5.8%(-2.97)#5,012 |
| 56. | Woodlawn | 2.8% | 1.5%(+1.26)#56 | 5.8%(-2.98)#5,030 |
| 57. | Creekside | 2.7% | 1.5%(+1.21)#57 | 5.8%(-3.03)#5,094 |
| 58. | Anchorage | 2.7% | 1.5%(+1.19)#58 | 5.8%(-3.04)#5,117 |
| 59. | Burlington | 2.7% | 1.5%(+1.16)#59 | 5.8%(-3.07)#5,149 |
| 60. | Louisville | 2.7% | 1.5%(+1.14)#60 | 5.8%(-3.10)#5,180 |
| 61. | Francisville | 2.6% | 1.5%(+1.10)#61 | 5.8%(-3.13)#5,240 |
| 62. | Elsmere | 2.6% | 1.5%(+1.04)#62 | 5.8%(-3.20)#5,330 |
| 63. | Salyersville | 2.6% | 1.5%(+1.02)#63 | 5.8%(-3.22)#5,357 |
| 64. | Breckinridge Center | 2.5% | 1.5%(+1.01)#64 | 5.8%(-3.23)#5,371 |
| 65. | Frankfort | 2.5% | 1.5%(+1.00)#65 | 5.8%(-3.24)#5,381 |
| 66. | Fort Campbell North | 2.5% | 1.5%(+0.927)#66 | 5.8%(-3.31)#5,478 |
| 67. | Bancroft | 2.2% | 1.5%(+0.668)#67 | 5.8%(-3.57)#5,956 |
| 68. | Salt Lick | 2.1% | 1.5%(+0.591)#68 | 5.8%(-3.64)#6,108 |
| 69. | Campton | 2.1% | 1.5%(+0.573)#69 | 5.8%(-3.66)#6,148 |
| 70. | Seneca Gardens | 2.1% | 1.5%(+0.569)#70 | 5.8%(-3.67)#6,160 |
| 71. | Kevil | 2.1% | 1.5%(+0.514)#71 | 5.8%(-3.72)#6,272 |
| 72. | Taylorsville | 2.0% | 1.5%(+0.501)#72 | 5.8%(-3.74)#6,297 |
| 73. | Oakbrook | 2.0% | 1.5%(+0.474)#73 | 5.8%(-3.76)#6,348 |
| 74. | La Center | 2.0% | 1.5%(+0.473)#74 | 5.8%(-3.76)#6,353 |
| 75. | Butler | 2.0% | 1.5%(+0.453)#75 | 5.8%(-3.78)#6,409 |
| 76. | Pikeville | 2.0% | 1.5%(+0.447)#76 | 5.8%(-3.79)#6,415 |
| 77. | Lyndon | 2.0% | 1.5%(+0.446)#77 | 5.8%(-3.79)#6,420 |
| 78. | Graymoor Devondale | 2.0% | 1.5%(+0.432)#78 | 5.8%(-3.80)#6,453 |
| 79. | Windy Hills | 2.0% | 1.5%(+0.424)#79 | 5.8%(-3.81)#6,466 |
| 80. | California | 1.9% | 1.5%(+0.387)#80 | 5.8%(-3.85)#6,546 |
| 81. | Verona | 1.9% | 1.5%(+0.383)#81 | 5.8%(-3.85)#6,550 |
| 82. | Arlington | 1.9% | 1.5%(+0.343)#82 | 5.8%(-3.89)#6,638 |
| 83. | Brooksville | 1.8% | 1.5%(+0.296)#83 | 5.8%(-3.94)#6,738 |
| 84. | Pine Knot | 1.8% | 1.5%(+0.284)#84 | 5.8%(-3.95)#6,766 |
| 85. | Brownsboro Farm | 1.8% | 1.5%(+0.272)#85 | 5.8%(-3.96)#6,800 |
| 86. | Union | 1.8% | 1.5%(+0.268)#86 | 5.8%(-3.97)#6,815 |
| 87. | Shelbyville | 1.8% | 1.5%(+0.268)#87 | 5.8%(-3.97)#6,819 |
| 88. | Jackson | 1.8% | 1.5%(+0.257)#88 | 5.8%(-3.98)#6,842 |
| 89. | Whitesburg | 1.7% | 1.5%(+0.182)#89 | 5.8%(-4.05)#7,017 |
| 90. | Southgate | 1.7% | 1.5%(+0.122)#90 | 5.8%(-4.11)#7,180 |
| 91. | Vine Grove | 1.6% | 1.5%(+0.112)#91 | 5.8%(-4.12)#7,200 |
| 92. | Centertown | 1.6% | 1.5%(+0.069)#92 | 5.8%(-4.17)#7,321 |
| 93. | Erlanger | 1.6% | 1.5%(+0.067)#93 | 5.8%(-4.17)#7,329 |
| 94. | Forest Hills | 1.6% | 1.5%(+0.054)#94 | 5.8%(-4.18)#7,368 |
| 95. | Harlan | 1.6% | 1.5%(+0.036)#95 | 5.8%(-4.20)#7,419 |
| 96. | Elk Creek | 1.6% | 1.5%(+0.032)#96 | 5.8%(-4.20)#7,433 |
| 97. | Somerset | 1.5% | 1.5%(-0.020)#97 | 5.8%(-4.26)#7,577 |
| 98. | Morehead | 1.5% | 1.5%(-0.037)#98 | 5.8%(-4.27)#7,633 |
| 99. | Rolling Hills | 1.5% | 1.5%(-0.038)#99 | 5.8%(-4.27)#7,637 |
| 100. | Hopkinsville | 1.5% | 1.5%(-0.045)#100 | 5.8%(-4.28)#7,662 |
Common Questions
What are the Top 10 Cities with the Highest Percentage of Asian Population in Kentucky?
Top 10 Cities with the Highest Percentage of Asian Population in Kentucky are:
#1
38.1%
#2
31.7%
#3
22.9%
#4
18.2%
#5
13.5%
#6
11.9%
#7
11.6%
#8
9.2%
#9
8.6%
#10
8.2%
What city has the Highest Percentage of Asian Population in Kentucky?
Hurstbourne Acres has the Highest Percentage of Asian Population in Kentucky with 38.1%.
What is the Percentage of Asian Population in the State of Kentucky?
Percentage of Asian Population in Kentucky is 1.5%.
What is the Percentage of Asian Population in the United States?
Percentage of Asian Population in the United States is 5.8%.