Madison Park, NJ Map & Demographics
Madison Park Map
Madison Park Overview
$35,824
PER CAPITA INCOME
$79,912
AVG FAMILY INCOME
$74,651
AVG HOUSEHOLD INCOME
22.7%
WAGE / INCOME GAP [ % ]
77.3¢/ $1
WAGE / INCOME GAP [ $ ]
$8,426
FAMILY INCOME DEFICIT
0.46
INEQUALITY / GINI INDEX
8,291
TOTAL POPULATION
3,744
MALE POPULATION
4,547
FEMALE POPULATION
82.34
MALES / 100 FEMALES
121.45
FEMALES / 100 MALES
33.8
MEDIAN AGE
3.5
AVG FAMILY SIZE
3.0
AVG HOUSEHOLD SIZE
4,241
LABOR FORCE [ PEOPLE ]
69.1%
PERCENT IN LABOR FORCE
5.0%
UNEMPLOYMENT RATE
Income in Madison Park
Income Overview in Madison Park
Per Capita Income in Madison Park is $35,824, while median incomes of families and households are $79,912 and $74,651 respectively.
| Characteristic | Number | Measure |
| Per Capita Income | 8,291 | $35,824 |
| Median Family Income | 2,104 | $79,912 |
| Mean Family Income | 2,104 | $120,010 |
| Median Household Income | 2,782 | $74,651 |
| Mean Household Income | 2,782 | $106,612 |
| Income Deficit | 2,104 | $8,426 |
| Wage / Income Gap (%) | 8,291 | 22.72% |
| Wage / Income Gap ($) | 8,291 | 77.28¢ per $1 |
| Gini / Inequality Index | 8,291 | 0.46 |
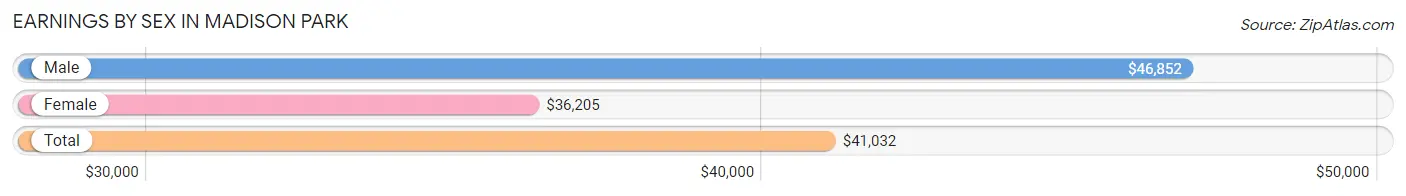
Earnings by Sex in Madison Park
Average Earnings in Madison Park are $41,032, $46,852 for men and $36,205 for women, a difference of 22.7%.
| Sex | Number | Average Earnings |
| Male | 2,118 (49.5%) | $46,852 |
| Female | 2,157 (50.5%) | $36,205 |
| Total | 4,275 (100.0%) | $41,032 |
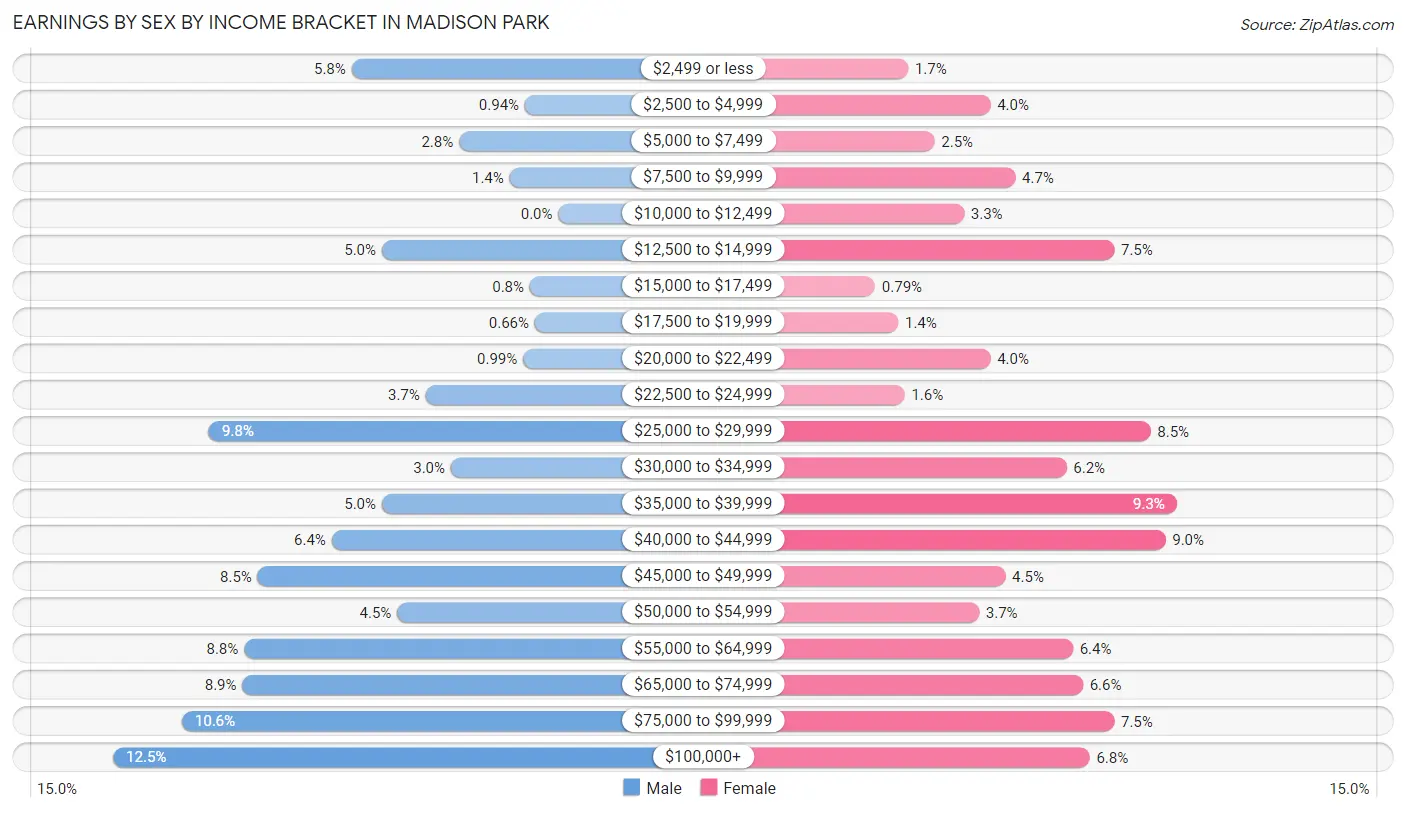
Earnings by Sex by Income Bracket in Madison Park
The most common earnings brackets in Madison Park are $100,000+ for men (265 | 12.5%) and $35,000 to $39,999 for women (200 | 9.3%).
| Income | Male | Female |
| $2,499 or less | 123 (5.8%) | 37 (1.7%) |
| $2,500 to $4,999 | 20 (0.9%) | 87 (4.0%) |
| $5,000 to $7,499 | 59 (2.8%) | 53 (2.5%) |
| $7,500 to $9,999 | 29 (1.4%) | 102 (4.7%) |
| $10,000 to $12,499 | 0 (0.0%) | 71 (3.3%) |
| $12,500 to $14,999 | 105 (5.0%) | 162 (7.5%) |
| $15,000 to $17,499 | 17 (0.8%) | 17 (0.8%) |
| $17,500 to $19,999 | 14 (0.7%) | 31 (1.4%) |
| $20,000 to $22,499 | 21 (1.0%) | 87 (4.0%) |
| $22,500 to $24,999 | 79 (3.7%) | 35 (1.6%) |
| $25,000 to $29,999 | 208 (9.8%) | 184 (8.5%) |
| $30,000 to $34,999 | 64 (3.0%) | 133 (6.2%) |
| $35,000 to $39,999 | 105 (5.0%) | 200 (9.3%) |
| $40,000 to $44,999 | 135 (6.4%) | 193 (8.9%) |
| $45,000 to $49,999 | 179 (8.5%) | 96 (4.4%) |
| $50,000 to $54,999 | 96 (4.5%) | 80 (3.7%) |
| $55,000 to $64,999 | 187 (8.8%) | 137 (6.4%) |
| $65,000 to $74,999 | 188 (8.9%) | 143 (6.6%) |
| $75,000 to $99,999 | 224 (10.6%) | 162 (7.5%) |
| $100,000+ | 265 (12.5%) | 147 (6.8%) |
| Total | 2,118 (100.0%) | 2,157 (100.0%) |
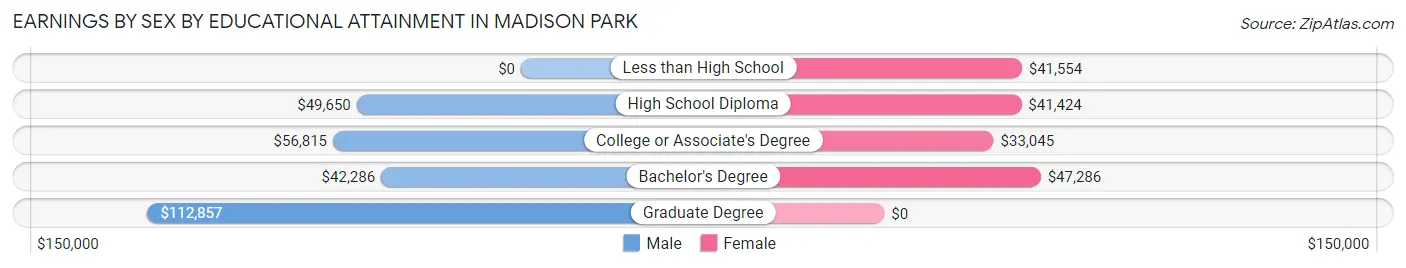
Earnings by Sex by Educational Attainment in Madison Park
Average earnings in Madison Park are $50,039 for men and $38,250 for women, a difference of 23.6%. Men with an educational attainment of graduate degree enjoy the highest average annual earnings of $112,857, while those with bachelor's degree education earn the least with $42,286. Women with an educational attainment of bachelor's degree earn the most with the average annual earnings of $47,286, while those with college or associate's degree education have the smallest earnings of $33,045.
| Educational Attainment | Male Income | Female Income |
| Less than High School | - | - |
| High School Diploma | $49,650 | $41,424 |
| College or Associate's Degree | $56,815 | $33,045 |
| Bachelor's Degree | $42,286 | $47,286 |
| Graduate Degree | $112,857 | $0 |
| Total | $50,039 | $38,250 |
Family Income in Madison Park
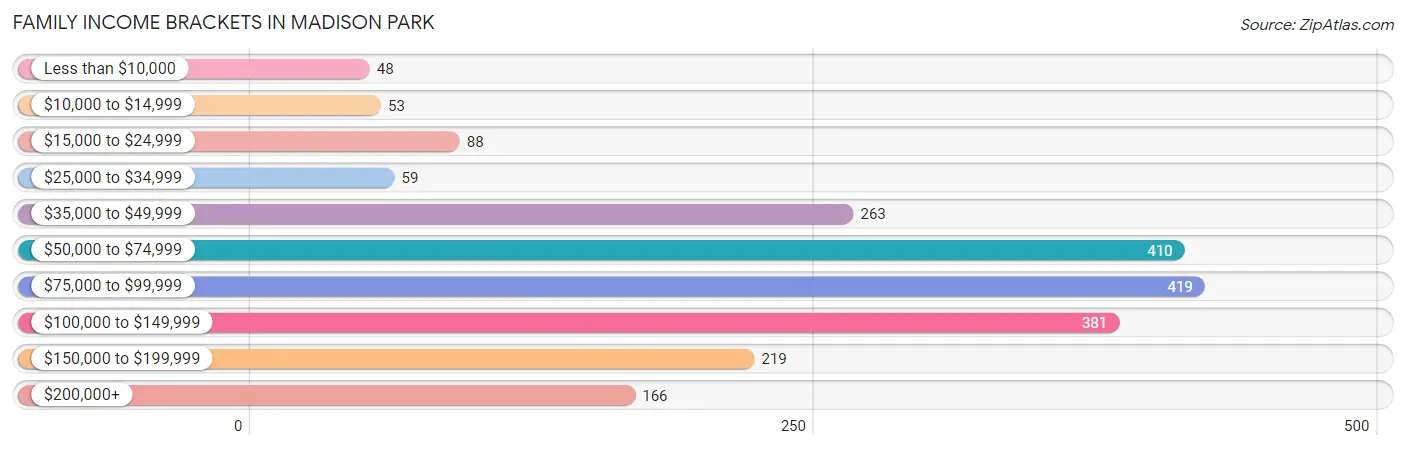
Family Income Brackets in Madison Park
According to the Madison Park family income data, there are 419 families falling into the $75,000 to $99,999 income range, which is the most common income bracket and makes up 19.9% of all families. Conversely, the less than $10,000 income bracket is the least frequent group with only 48 families (2.3%) belonging to this category.
| Income Bracket | # Families | % Families |
| Less than $10,000 | 48 | 2.3% |
| $10,000 to $14,999 | 53 | 2.5% |
| $15,000 to $24,999 | 88 | 4.2% |
| $25,000 to $34,999 | 59 | 2.8% |
| $35,000 to $49,999 | 263 | 12.5% |
| $50,000 to $74,999 | 410 | 19.5% |
| $75,000 to $99,999 | 419 | 19.9% |
| $100,000 to $149,999 | 381 | 18.1% |
| $150,000 to $199,999 | 219 | 10.4% |
| $200,000+ | 166 | 7.9% |
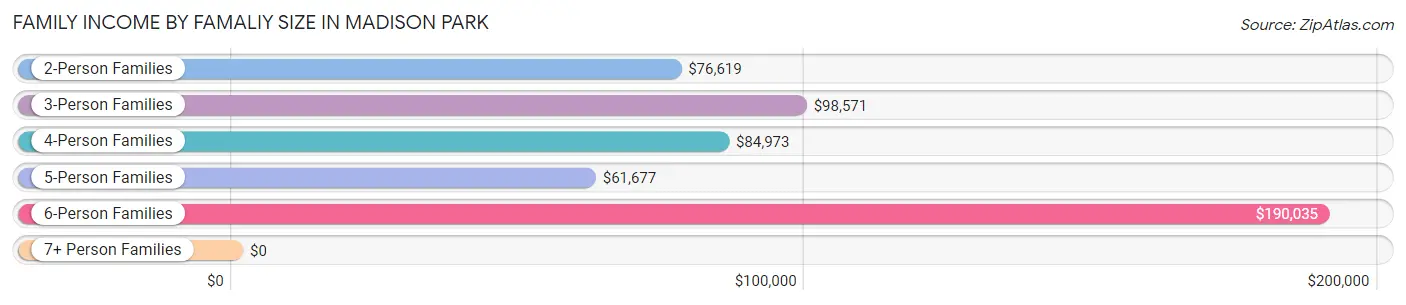
Family Income by Famaliy Size in Madison Park
6-person families (140 | 6.7%) account for the highest median family income in Madison Park with $190,035 per family, while 2-person families (645 | 30.7%) have the highest median income of $38,310 per family member.
| Income Bracket | # Families | Median Income |
| 2-Person Families | 645 (30.7%) | $76,619 |
| 3-Person Families | 632 (30.0%) | $98,571 |
| 4-Person Families | 377 (17.9%) | $84,973 |
| 5-Person Families | 292 (13.9%) | $61,677 |
| 6-Person Families | 140 (6.7%) | $190,035 |
| 7+ Person Families | 18 (0.9%) | $0 |
| Total | 2,104 (100.0%) | $79,912 |
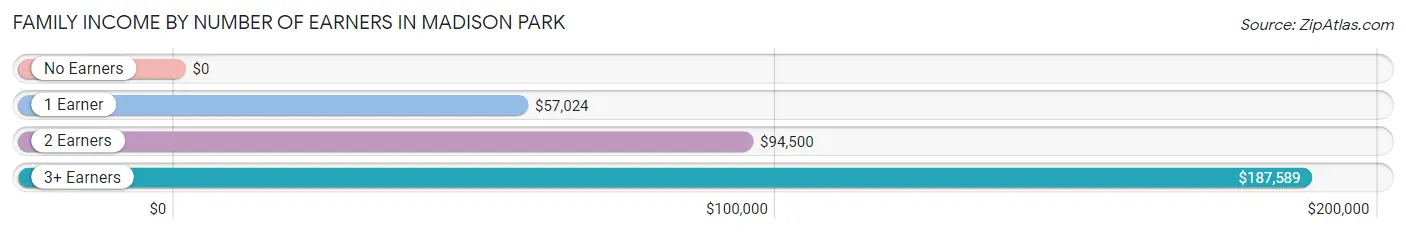
Family Income by Number of Earners in Madison Park
| Number of Earners | # Families | Median Income |
| No Earners | 127 (6.0%) | $0 |
| 1 Earner | 748 (35.5%) | $57,024 |
| 2 Earners | 1,018 (48.4%) | $94,500 |
| 3+ Earners | 211 (10.0%) | $187,589 |
| Total | 2,104 (100.0%) | $79,912 |
Household Income in Madison Park
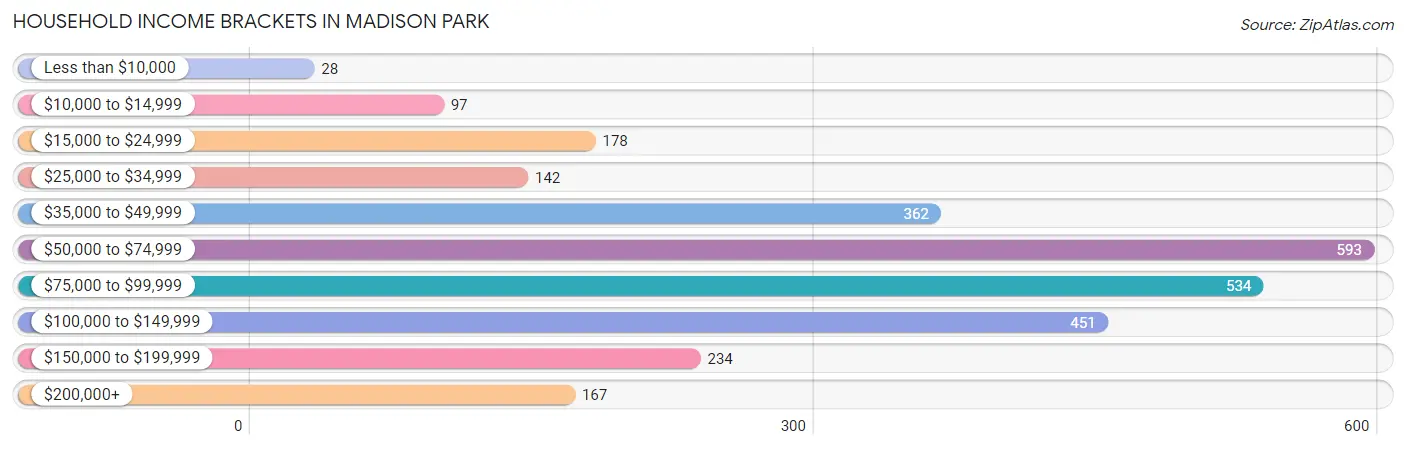
Household Income Brackets in Madison Park
With 593 households falling in the category, the $50,000 to $74,999 income range is the most frequent in Madison Park, accounting for 21.3% of all households. In contrast, only 28 households (1.0%) fall into the less than $10,000 income bracket, making it the least populous group.
| Income Bracket | # Households | % Households |
| Less than $10,000 | 28 | 1.0% |
| $10,000 to $14,999 | 97 | 3.5% |
| $15,000 to $24,999 | 178 | 6.4% |
| $25,000 to $34,999 | 142 | 5.1% |
| $35,000 to $49,999 | 362 | 13.0% |
| $50,000 to $74,999 | 593 | 21.3% |
| $75,000 to $99,999 | 534 | 19.2% |
| $100,000 to $149,999 | 451 | 16.2% |
| $150,000 to $199,999 | 234 | 8.4% |
| $200,000+ | 167 | 6.0% |
Household Income by Householder Age in Madison Park
The median household income in Madison Park is $74,651, with the highest median household income of $79,500 found in the 45 to 64 years age bracket for the primary householder. A total of 1,222 households (43.9%) fall into this category. Meanwhile, the 15 to 24 years age bracket for the primary householder has the lowest median household income of $0, with 44 households (1.6%) in this group.
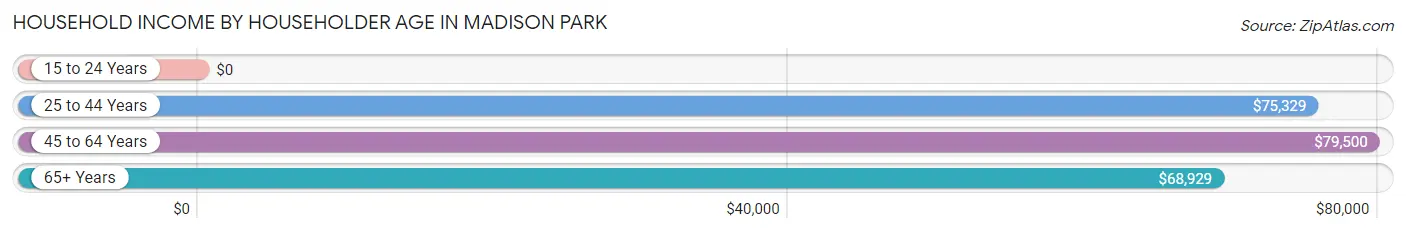
| Income Bracket | # Households | Median Income |
| 15 to 24 Years | 44 (1.6%) | $0 |
| 25 to 44 Years | 982 (35.3%) | $75,329 |
| 45 to 64 Years | 1,222 (43.9%) | $79,500 |
| 65+ Years | 534 (19.2%) | $68,929 |
| Total | 2,782 (100.0%) | $74,651 |
Poverty in Madison Park
Income Below Poverty by Sex and Age in Madison Park
With 12.1% poverty level for males and 11.8% for females among the residents of Madison Park, 5 year old males and 35 to 44 year old females are the most vulnerable to poverty, with 34 males (72.3%) and 99 females (22.1%) in their respective age groups living below the poverty level.
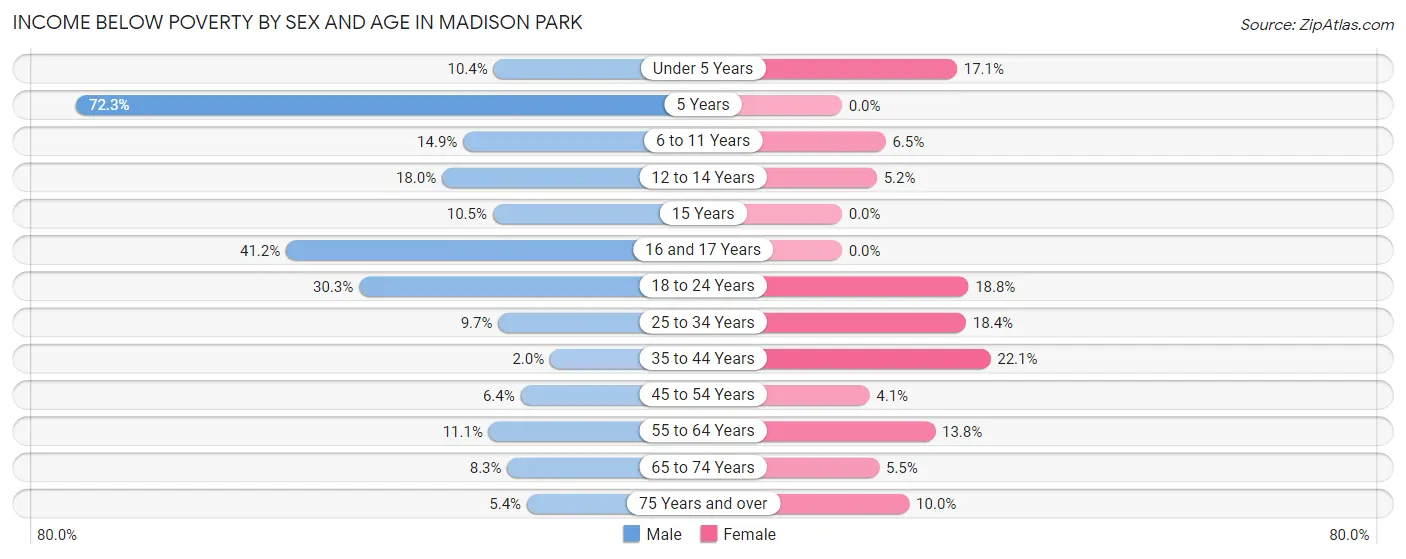
| Age Bracket | Male | Female |
| Under 5 Years | 23 (10.4%) | 48 (17.1%) |
| 5 Years | 34 (72.3%) | 0 (0.0%) |
| 6 to 11 Years | 68 (14.9%) | 28 (6.5%) |
| 12 to 14 Years | 40 (18.0%) | 10 (5.2%) |
| 15 Years | 9 (10.5%) | 0 (0.0%) |
| 16 and 17 Years | 14 (41.2%) | 0 (0.0%) |
| 18 to 24 Years | 98 (30.3%) | 58 (18.8%) |
| 25 to 34 Years | 49 (9.7%) | 150 (18.4%) |
| 35 to 44 Years | 10 (2.0%) | 99 (22.1%) |
| 45 to 54 Years | 33 (6.4%) | 22 (4.1%) |
| 55 to 64 Years | 44 (11.1%) | 79 (13.8%) |
| 65 to 74 Years | 29 (8.3%) | 23 (5.5%) |
| 75 Years and over | 4 (5.4%) | 19 (10.0%) |
| Total | 455 (12.1%) | 536 (11.8%) |
Income Above Poverty by Sex and Age in Madison Park
According to the poverty statistics in Madison Park, males aged 35 to 44 years and females aged 5 years are the age groups that are most secure financially, with 98.0% of males and 100.0% of females in these age groups living above the poverty line.
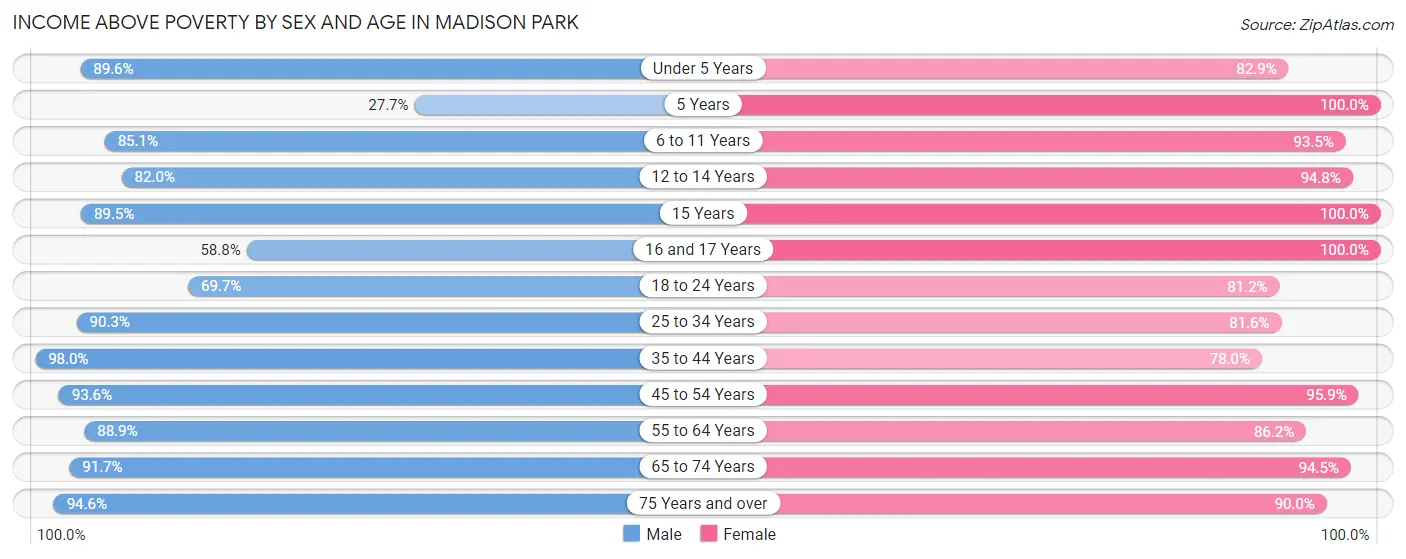
| Age Bracket | Male | Female |
| Under 5 Years | 199 (89.6%) | 233 (82.9%) |
| 5 Years | 13 (27.7%) | 59 (100.0%) |
| 6 to 11 Years | 389 (85.1%) | 404 (93.5%) |
| 12 to 14 Years | 182 (82.0%) | 183 (94.8%) |
| 15 Years | 77 (89.5%) | 154 (100.0%) |
| 16 and 17 Years | 20 (58.8%) | 141 (100.0%) |
| 18 to 24 Years | 225 (69.7%) | 251 (81.2%) |
| 25 to 34 Years | 458 (90.3%) | 664 (81.6%) |
| 35 to 44 Years | 497 (98.0%) | 350 (77.9%) |
| 45 to 54 Years | 486 (93.6%) | 516 (95.9%) |
| 55 to 64 Years | 353 (88.9%) | 492 (86.2%) |
| 65 to 74 Years | 320 (91.7%) | 393 (94.5%) |
| 75 Years and over | 70 (94.6%) | 171 (90.0%) |
| Total | 3,289 (87.8%) | 4,011 (88.2%) |
Income Below Poverty Among Married-Couple Families in Madison Park
The poverty statistics for married-couple families in Madison Park show that 8.3% or 117 of the total 1,405 families live below the poverty line. Families with no children have the highest poverty rate of 10.4%, comprising of 78 families. On the other hand, families with 5 or more children have the lowest poverty rate of 0.0%, which includes 0 families.
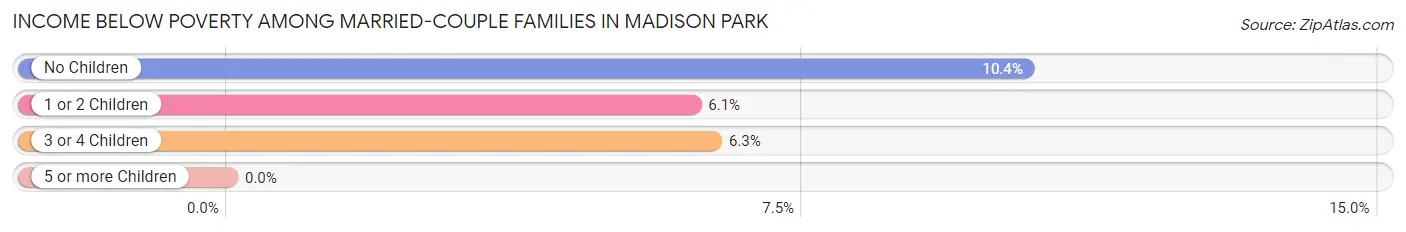
| Children | Above Poverty | Below Poverty |
| No Children | 672 (89.6%) | 78 (10.4%) |
| 1 or 2 Children | 435 (94.0%) | 28 (6.0%) |
| 3 or 4 Children | 163 (93.7%) | 11 (6.3%) |
| 5 or more Children | 18 (100.0%) | 0 (0.0%) |
| Total | 1,288 (91.7%) | 117 (8.3%) |
Income Below Poverty Among Single-Parent Households in Madison Park
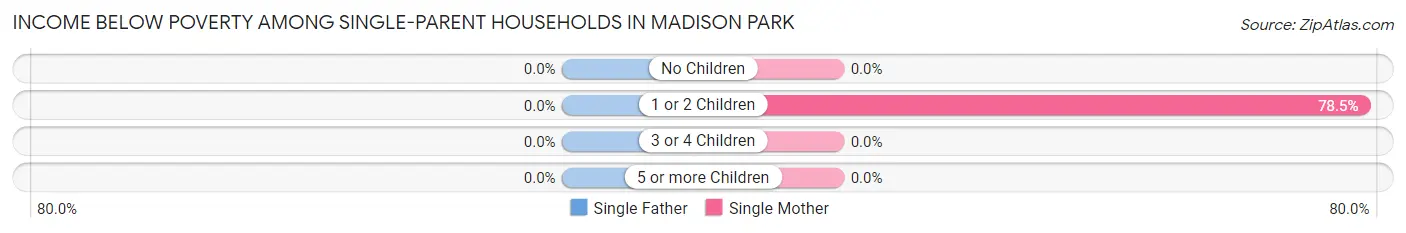
| Children | Single Father | Single Mother |
| No Children | 0 (0.0%) | 0 (0.0%) |
| 1 or 2 Children | 0 (0.0%) | 102 (78.5%) |
| 3 or 4 Children | 0 (0.0%) | 0 (0.0%) |
| 5 or more Children | 0 (0.0%) | 0 (0.0%) |
| Total | 0 (0.0%) | 102 (21.7%) |
Income Below Poverty Among Married-Couple vs Single-Parent Households in Madison Park
The poverty data for Madison Park shows that 117 of the married-couple family households (8.3%) and 102 of the single-parent households (14.6%) are living below the poverty level. Within the married-couple family households, those with no children have the highest poverty rate, with 78 households (10.4%) falling below the poverty line. Among the single-parent households, those with 1 or 2 children have the highest poverty rate, with 102 household (34.9%) living below poverty.
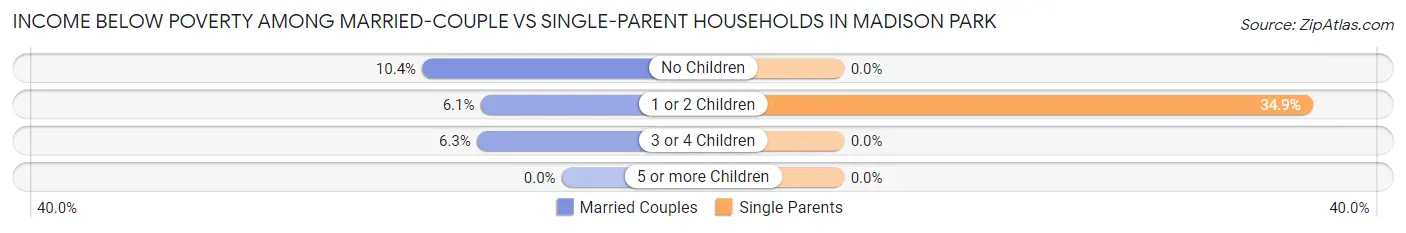
| Children | Married-Couple Families | Single-Parent Households |
| No Children | 78 (10.4%) | 0 (0.0%) |
| 1 or 2 Children | 28 (6.0%) | 102 (34.9%) |
| 3 or 4 Children | 11 (6.3%) | 0 (0.0%) |
| 5 or more Children | 0 (0.0%) | 0 (0.0%) |
| Total | 117 (8.3%) | 102 (14.6%) |
Race in Madison Park
The most populous races in Madison Park are White / Caucasian (2,702 | 32.6%), Black / African American (2,433 | 29.3%), and Asian (1,757 | 21.2%).
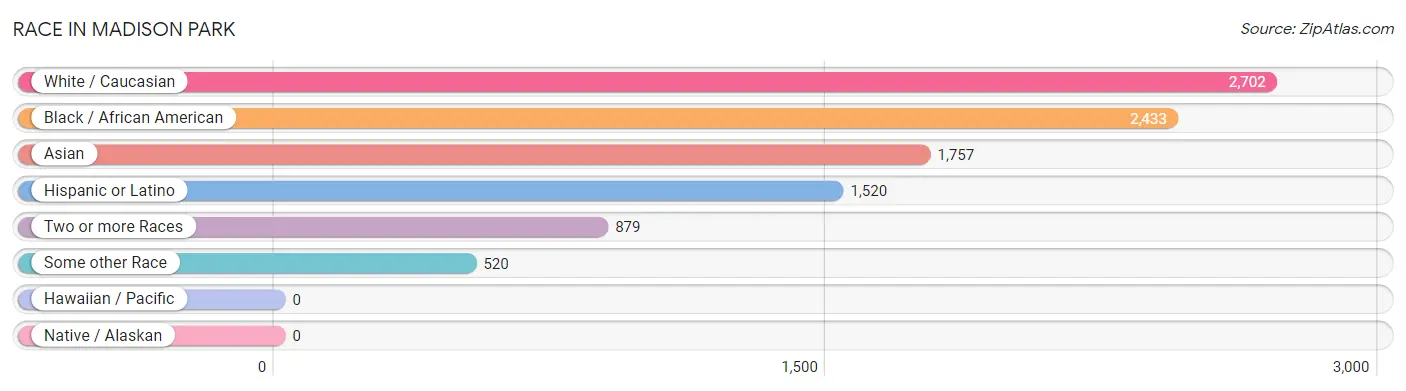
| Race | # Population | % Population |
| Asian | 1,757 | 21.2% |
| Black / African American | 2,433 | 29.3% |
| Hawaiian / Pacific | 0 | 0.0% |
| Hispanic or Latino | 1,520 | 18.3% |
| Native / Alaskan | 0 | 0.0% |
| White / Caucasian | 2,702 | 32.6% |
| Two or more Races | 879 | 10.6% |
| Some other Race | 520 | 6.3% |
| Total | 8,291 | 100.0% |
Ancestry in Madison Park
The most populous ancestries reported in Madison Park are Thai (1,208 | 14.6%), Italian (667 | 8.0%), Irish (587 | 7.1%), Puerto Rican (587 | 7.1%), and Polish (437 | 5.3%), together accounting for 42.0% of all Madison Park residents.
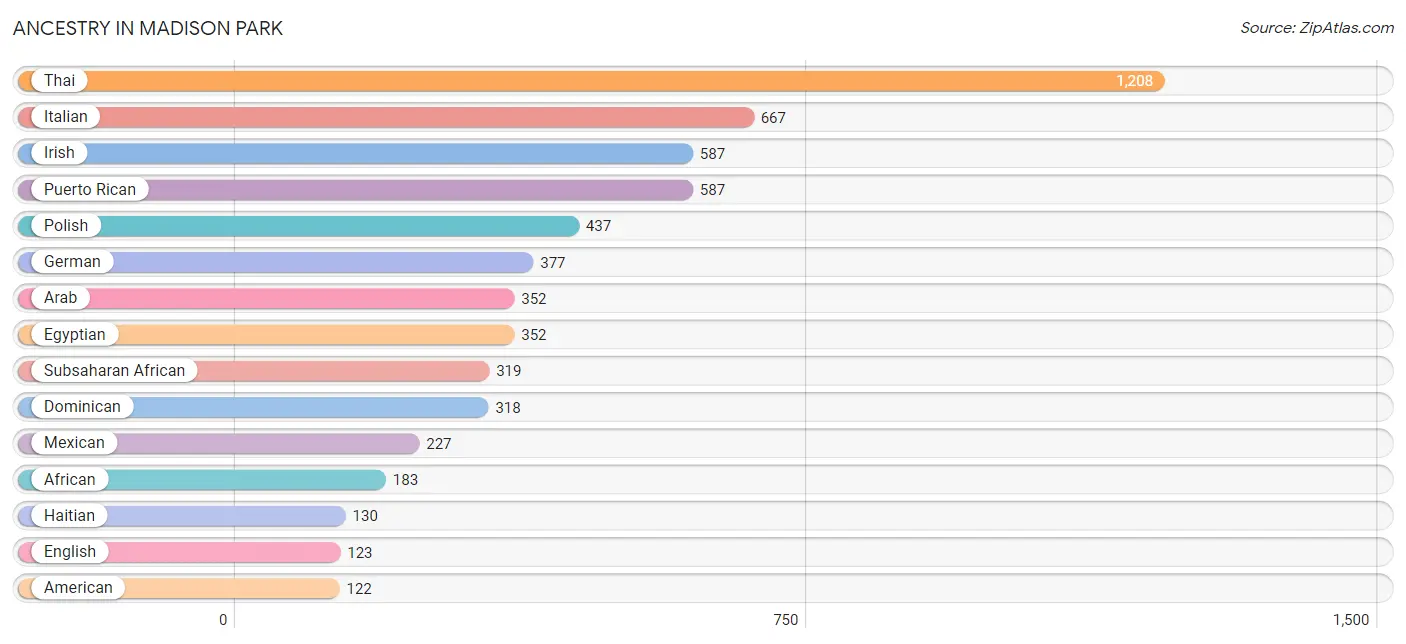
| Ancestry | # Population | % Population |
| African | 183 | 2.2% |
| Albanian | 28 | 0.3% |
| American | 122 | 1.5% |
| Arab | 352 | 4.3% |
| Argentinean | 28 | 0.3% |
| British | 18 | 0.2% |
| British West Indian | 14 | 0.2% |
| Central American | 51 | 0.6% |
| Colombian | 26 | 0.3% |
| Cuban | 42 | 0.5% |
| Dominican | 318 | 3.8% |
| Eastern European | 6 | 0.1% |
| Egyptian | 352 | 4.3% |
| English | 123 | 1.5% |
| Estonian | 11 | 0.1% |
| European | 15 | 0.2% |
| French | 7 | 0.1% |
| German | 377 | 4.5% |
| Ghanaian | 72 | 0.9% |
| Greek | 11 | 0.1% |
| Haitian | 130 | 1.6% |
| Honduran | 22 | 0.3% |
| Hungarian | 33 | 0.4% |
| Indian (Asian) | 10 | 0.1% |
| Irish | 587 | 7.1% |
| Italian | 667 | 8.0% |
| Jamaican | 99 | 1.2% |
| Korean | 83 | 1.0% |
| Mexican | 227 | 2.7% |
| Nigerian | 42 | 0.5% |
| Panamanian | 29 | 0.4% |
| Polish | 437 | 5.3% |
| Portuguese | 9 | 0.1% |
| Puerto Rican | 587 | 7.1% |
| Romanian | 6 | 0.1% |
| Russian | 12 | 0.1% |
| Scotch-Irish | 13 | 0.2% |
| Scottish | 18 | 0.2% |
| Sierra Leonean | 22 | 0.3% |
| Slavic | 55 | 0.7% |
| Slovak | 76 | 0.9% |
| South American | 116 | 1.4% |
| Spanish | 58 | 0.7% |
| Subsaharan African | 319 | 3.8% |
| Thai | 1,208 | 14.6% |
| Ukrainian | 88 | 1.1% |
| Uruguayan | 62 | 0.7% |
| Yugoslavian | 4 | 0.1% | View All 48 Rows |
Immigrants in Madison Park
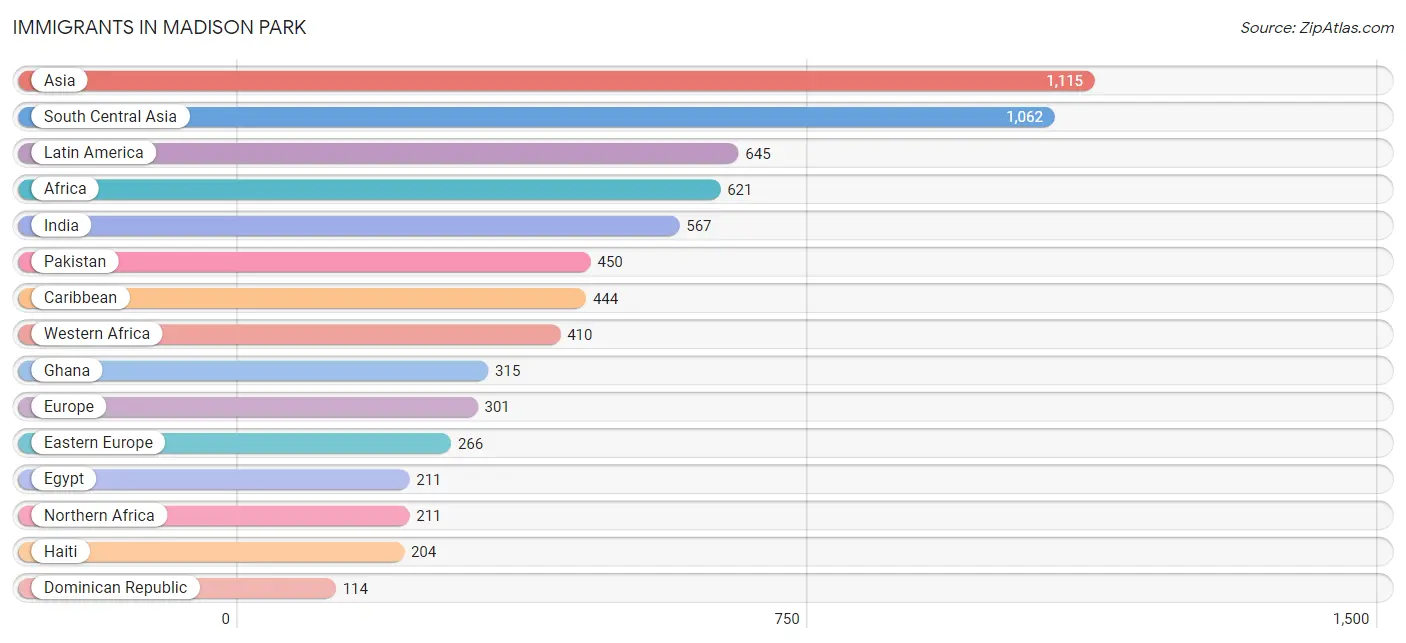
The most numerous immigrant groups reported in Madison Park came from Asia (1,115 | 13.5%), South Central Asia (1,062 | 12.8%), Latin America (645 | 7.8%), Africa (621 | 7.5%), and India (567 | 6.8%), together accounting for 48.4% of all Madison Park residents.
| Immigration Origin | # Population | % Population |
| Africa | 621 | 7.5% |
| Argentina | 13 | 0.2% |
| Asia | 1,115 | 13.5% |
| Bangladesh | 38 | 0.5% |
| Caribbean | 444 | 5.4% |
| Central America | 100 | 1.2% |
| Chile | 11 | 0.1% |
| China | 5 | 0.1% |
| Colombia | 26 | 0.3% |
| Cuba | 13 | 0.2% |
| Czechoslovakia | 49 | 0.6% |
| Dominican Republic | 114 | 1.4% |
| Eastern Asia | 5 | 0.1% |
| Eastern Europe | 266 | 3.2% |
| Egypt | 211 | 2.5% |
| England | 12 | 0.1% |
| Europe | 301 | 3.6% |
| Germany | 4 | 0.1% |
| Ghana | 315 | 3.8% |
| Haiti | 204 | 2.5% |
| Hong Kong | 5 | 0.1% |
| India | 567 | 6.8% |
| Ireland | 4 | 0.1% |
| Italy | 8 | 0.1% |
| Jamaica | 99 | 1.2% |
| Latin America | 645 | 7.8% |
| Mexico | 71 | 0.9% |
| Nigeria | 42 | 0.5% |
| North Macedonia | 7 | 0.1% |
| Northern Africa | 211 | 2.5% |
| Northern Europe | 23 | 0.3% |
| Pakistan | 450 | 5.4% |
| Panama | 29 | 0.4% |
| Peru | 27 | 0.3% |
| Philippines | 43 | 0.5% |
| Poland | 108 | 1.3% |
| Senegal | 46 | 0.5% |
| Sierra Leone | 7 | 0.1% |
| South America | 101 | 1.2% |
| South Central Asia | 1,062 | 12.8% |
| South Eastern Asia | 43 | 0.5% |
| Southern Europe | 8 | 0.1% |
| Ukraine | 102 | 1.2% |
| Uruguay | 13 | 0.2% |
| Venezuela | 11 | 0.1% |
| Western Africa | 410 | 5.0% |
| Western Asia | 5 | 0.1% |
| Western Europe | 4 | 0.1% | View All 48 Rows |
Sex and Age in Madison Park
Sex and Age in Madison Park
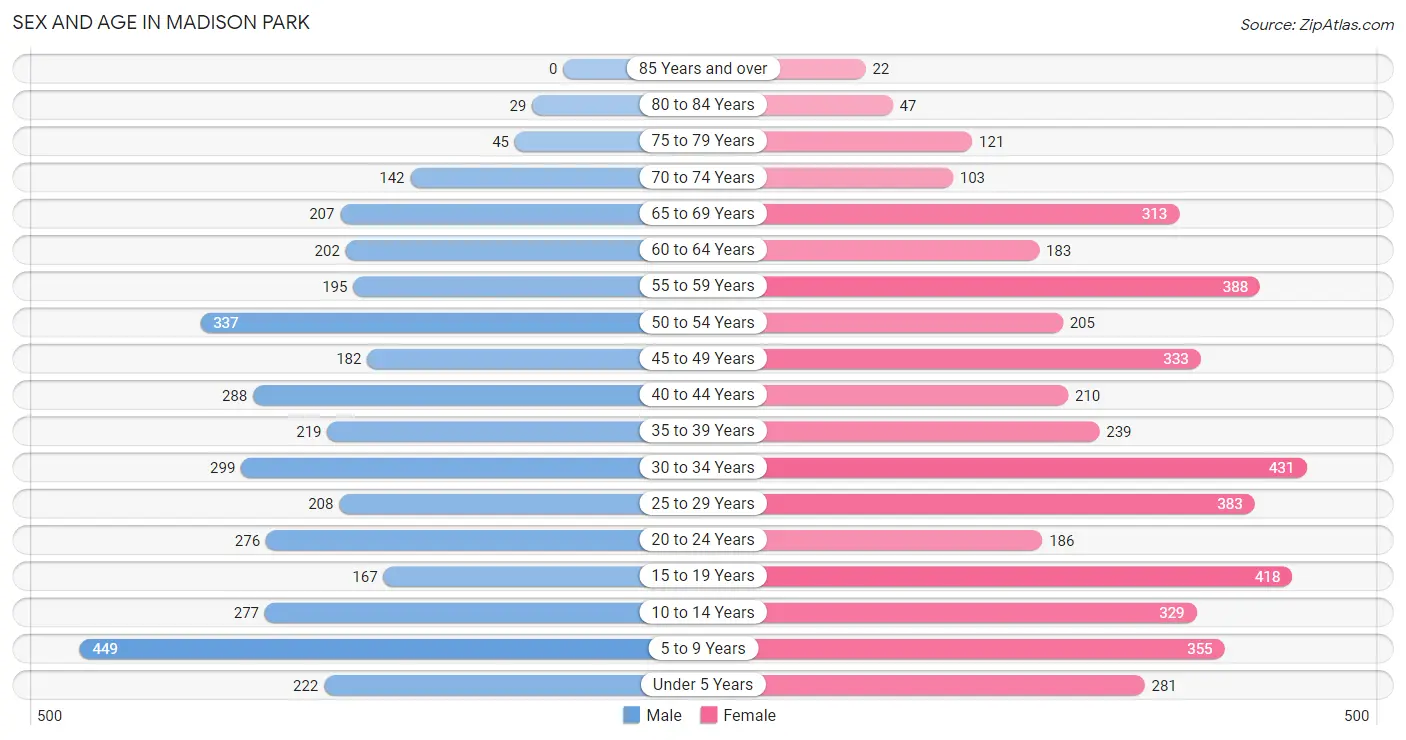
The most populous age groups in Madison Park are 5 to 9 Years (449 | 12.0%) for men and 30 to 34 Years (431 | 9.5%) for women.
| Age Bracket | Male | Female |
| Under 5 Years | 222 (5.9%) | 281 (6.2%) |
| 5 to 9 Years | 449 (12.0%) | 355 (7.8%) |
| 10 to 14 Years | 277 (7.4%) | 329 (7.2%) |
| 15 to 19 Years | 167 (4.5%) | 418 (9.2%) |
| 20 to 24 Years | 276 (7.4%) | 186 (4.1%) |
| 25 to 29 Years | 208 (5.6%) | 383 (8.4%) |
| 30 to 34 Years | 299 (8.0%) | 431 (9.5%) |
| 35 to 39 Years | 219 (5.9%) | 239 (5.3%) |
| 40 to 44 Years | 288 (7.7%) | 210 (4.6%) |
| 45 to 49 Years | 182 (4.9%) | 333 (7.3%) |
| 50 to 54 Years | 337 (9.0%) | 205 (4.5%) |
| 55 to 59 Years | 195 (5.2%) | 388 (8.5%) |
| 60 to 64 Years | 202 (5.4%) | 183 (4.0%) |
| 65 to 69 Years | 207 (5.5%) | 313 (6.9%) |
| 70 to 74 Years | 142 (3.8%) | 103 (2.3%) |
| 75 to 79 Years | 45 (1.2%) | 121 (2.7%) |
| 80 to 84 Years | 29 (0.8%) | 47 (1.0%) |
| 85 Years and over | 0 (0.0%) | 22 (0.5%) |
| Total | 3,744 (100.0%) | 4,547 (100.0%) |
Families and Households in Madison Park
Median Family Size in Madison Park
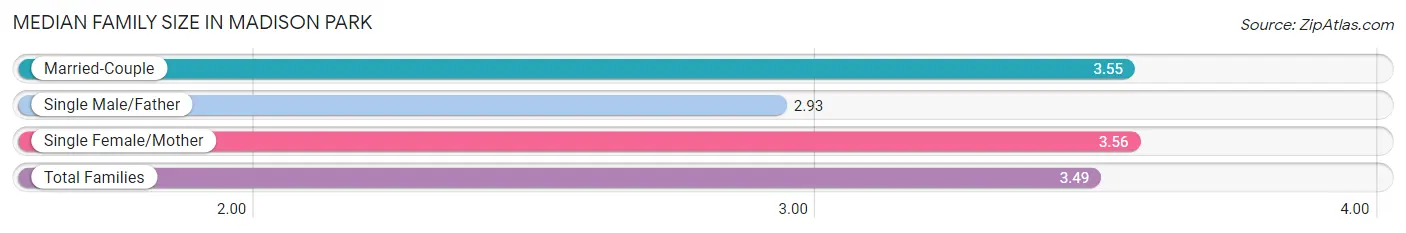
The median family size in Madison Park is 3.49 persons per family, with single female/mother families (470 | 22.3%) accounting for the largest median family size of 3.56 persons per family. On the other hand, single male/father families (229 | 10.9%) represent the smallest median family size with 2.93 persons per family.
| Family Type | # Families | Family Size |
| Married-Couple | 1,405 (66.8%) | 3.55 |
| Single Male/Father | 229 (10.9%) | 2.93 |
| Single Female/Mother | 470 (22.3%) | 3.56 |
| Total Families | 2,104 (100.0%) | 3.49 |
Median Household Size in Madison Park
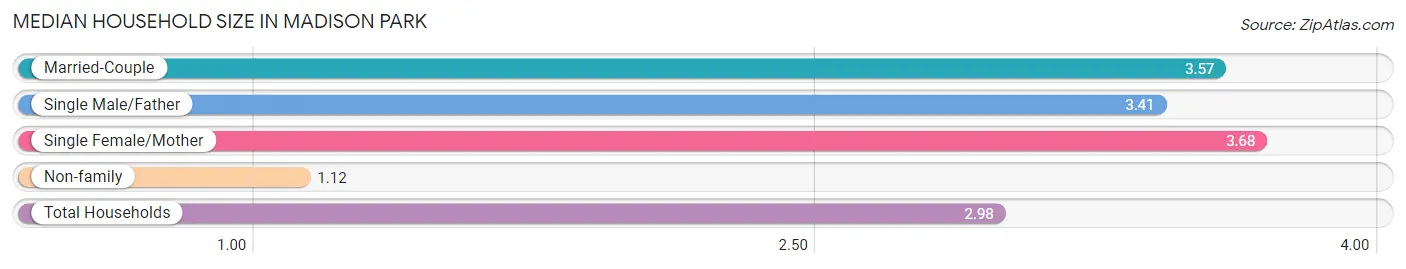
The median household size in Madison Park is 2.98 persons per household, with single female/mother households (470 | 16.9%) accounting for the largest median household size of 3.68 persons per household. non-family households (678 | 24.4%) represent the smallest median household size with 1.12 persons per household.
| Household Type | # Households | Household Size |
| Married-Couple | 1,405 (50.5%) | 3.57 |
| Single Male/Father | 229 (8.2%) | 3.41 |
| Single Female/Mother | 470 (16.9%) | 3.68 |
| Non-family | 678 (24.4%) | 1.12 |
| Total Households | 2,782 (100.0%) | 2.98 |
Household Size by Marriage Status in Madison Park
Out of a total of 2,782 households in Madison Park, 2,104 (75.6%) are family households, while 678 (24.4%) are nonfamily households. The most numerous type of family households are 3-person households, comprising 640, and the most common type of nonfamily households are 1-person households, comprising 601.
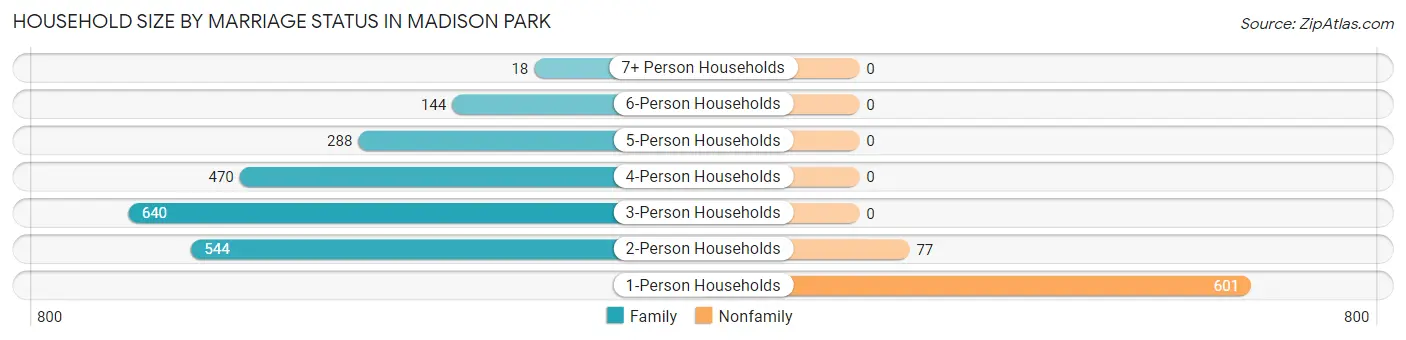
| Household Size | Family Households | Nonfamily Households |
| 1-Person Households | - | 601 (21.6%) |
| 2-Person Households | 544 (19.6%) | 77 (2.8%) |
| 3-Person Households | 640 (23.0%) | 0 (0.0%) |
| 4-Person Households | 470 (16.9%) | 0 (0.0%) |
| 5-Person Households | 288 (10.3%) | 0 (0.0%) |
| 6-Person Households | 144 (5.2%) | 0 (0.0%) |
| 7+ Person Households | 18 (0.6%) | 0 (0.0%) |
| Total | 2,104 (75.6%) | 678 (24.4%) |
Female Fertility in Madison Park
Fertility by Age in Madison Park
Average fertility rate in Madison Park is 78.0 births per 1,000 women. Women in the age bracket of 20 to 34 years have the highest fertility rate with 99.0 births per 1,000 women. Women in the age bracket of 20 to 34 years acount for 55.6% of all women with births.
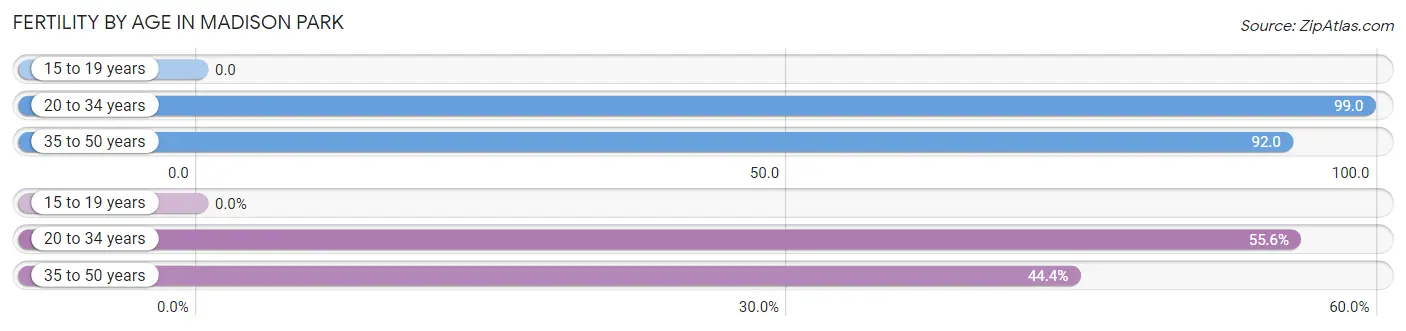
| Age Bracket | Women with Births | Births / 1,000 Women |
| 15 to 19 years | 0 (0.0%) | 0.0 |
| 20 to 34 years | 99 (55.6%) | 99.0 |
| 35 to 50 years | 79 (44.4%) | 92.0 |
| Total | 178 (100.0%) | 78.0 |
Fertility by Age by Marriage Status in Madison Park
29.8% of women with births (178) in Madison Park are married. The highest percentage of unmarried women with births falls into 20 to 34 years age bracket with 89.9% of them unmarried at the time of birth, while the lowest percentage of unmarried women with births belong to 35 to 50 years age bracket with 45.6% of them unmarried.
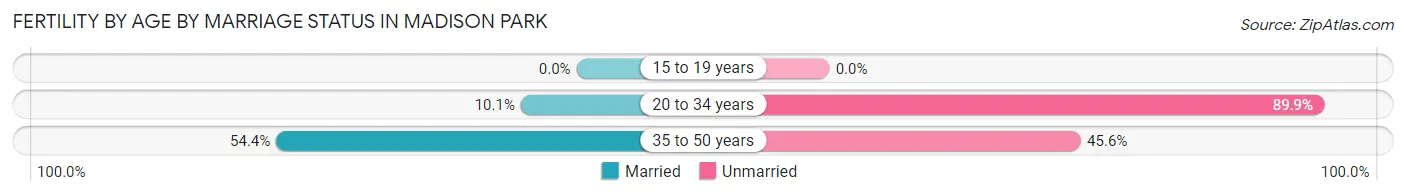
| Age Bracket | Married | Unmarried |
| 15 to 19 years | 0 (0.0%) | 0 (0.0%) |
| 20 to 34 years | 10 (10.1%) | 89 (89.9%) |
| 35 to 50 years | 43 (54.4%) | 36 (45.6%) |
| Total | 53 (29.8%) | 125 (70.2%) |
Fertility by Education in Madison Park
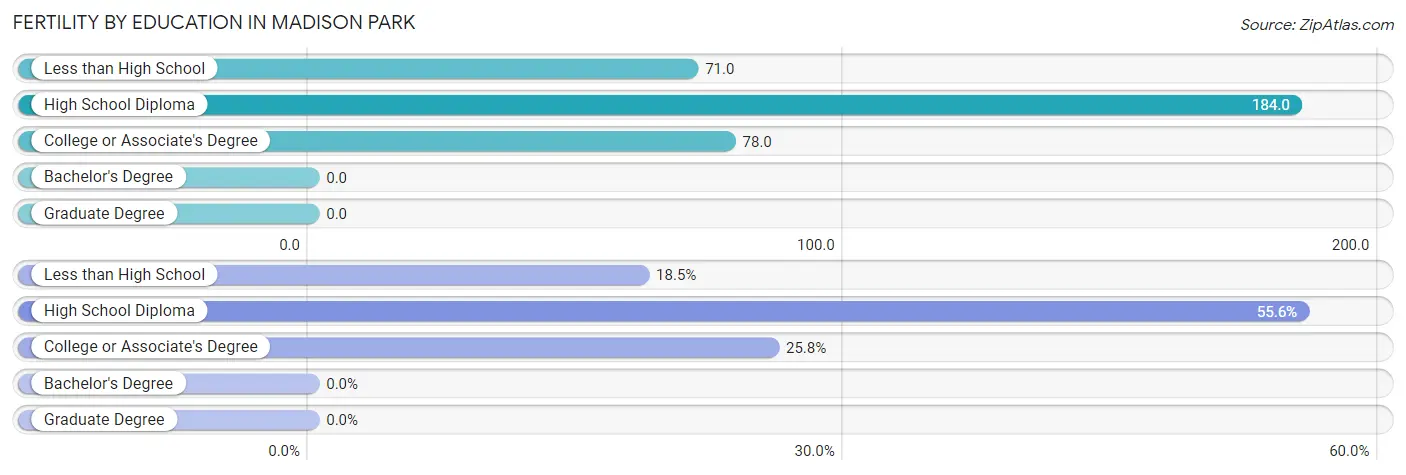
| Educational Attainment | Women with Births | Births / 1,000 Women |
| Less than High School | 33 (18.5%) | 71.0 |
| High School Diploma | 99 (55.6%) | 184.0 |
| College or Associate's Degree | 46 (25.8%) | 78.0 |
| Bachelor's Degree | 0 (0.0%) | 0.0 |
| Graduate Degree | 0 (0.0%) | 0.0 |
| Total | 178 (100.0%) | 78.0 |
Fertility by Education by Marriage Status in Madison Park
70.2% of women with births in Madison Park are unmarried. Women with the educational attainment of less than high school are most likely to be married with 100.0% of them married at childbirth, while women with the educational attainment of high school diploma are least likely to be married with 89.9% of them unmarried at childbirth.
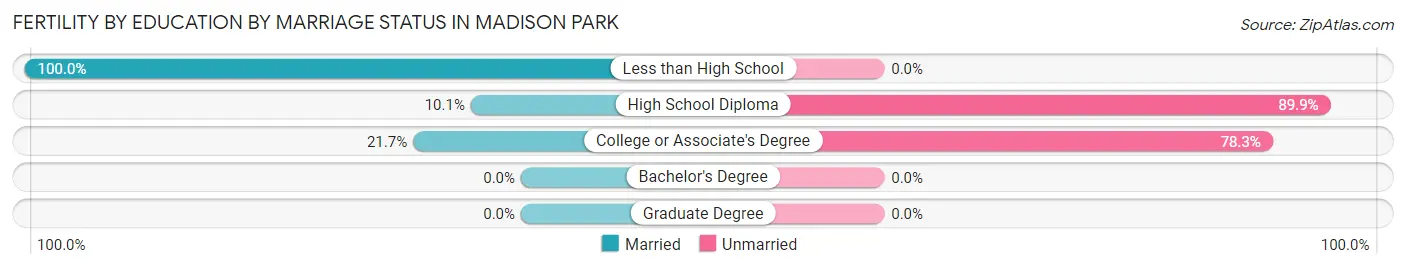
| Educational Attainment | Married | Unmarried |
| Less than High School | 33 (100.0%) | 0 (0.0%) |
| High School Diploma | 10 (10.1%) | 89 (89.9%) |
| College or Associate's Degree | 10 (21.7%) | 36 (78.3%) |
| Bachelor's Degree | 0 (0.0%) | 0 (0.0%) |
| Graduate Degree | 0 (0.0%) | 0 (0.0%) |
| Total | 53 (29.8%) | 125 (70.2%) |
Employment Characteristics in Madison Park
Employment by Class of Employer in Madison Park
Among the 3,933 employed individuals in Madison Park, private company employees (3,059 | 77.8%), self-employed (not incorporated) (270 | 6.9%), and not-for-profit organizations (212 | 5.4%) make up the most common classes of employment.
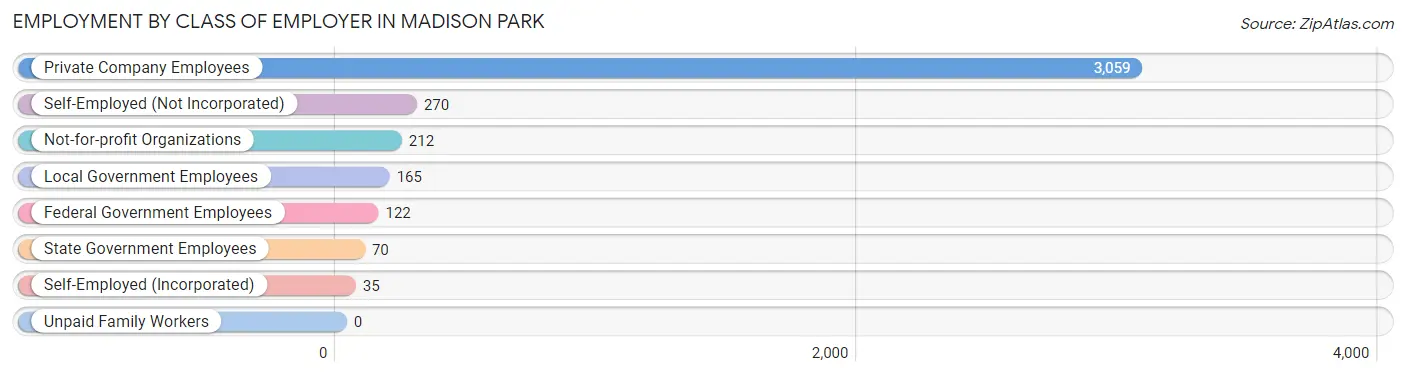
| Employer Class | # Employees | % Employees |
| Private Company Employees | 3,059 | 77.8% |
| Self-Employed (Incorporated) | 35 | 0.9% |
| Self-Employed (Not Incorporated) | 270 | 6.9% |
| Not-for-profit Organizations | 212 | 5.4% |
| Local Government Employees | 165 | 4.2% |
| State Government Employees | 70 | 1.8% |
| Federal Government Employees | 122 | 3.1% |
| Unpaid Family Workers | 0 | 0.0% |
| Total | 3,933 | 100.0% |
Employment Status by Age in Madison Park
According to the labor force statistics for Madison Park, out of the total population over 16 years of age (6,138), 69.1% or 4,241 individuals are in the labor force, with 5.0% or 212 of them unemployed. The age group with the highest labor force participation rate is 55 to 59 years, with 86.6% or 505 individuals in the labor force. Within the labor force, the 20 to 24 years age range has the highest percentage of unemployed individuals, with 14.9% or 44 of them being unemployed.
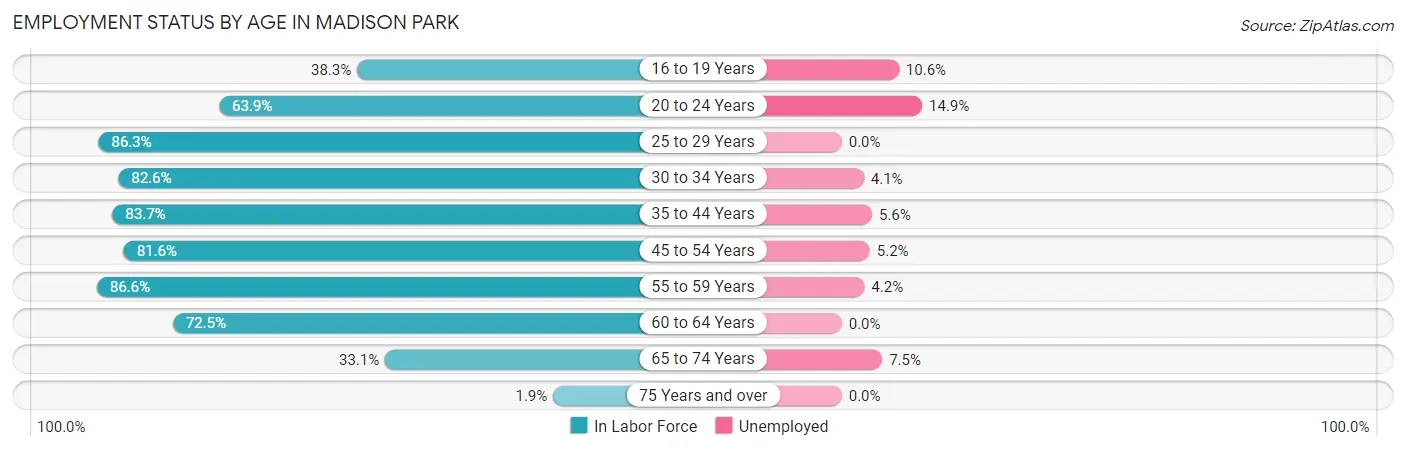
| Age Bracket | In Labor Force | Unemployed |
| 16 to 19 Years | 132 (38.3%) | 14 (10.6%) |
| 20 to 24 Years | 295 (63.9%) | 44 (14.9%) |
| 25 to 29 Years | 510 (86.3%) | 0 (0.0%) |
| 30 to 34 Years | 603 (82.6%) | 25 (4.1%) |
| 35 to 44 Years | 800 (83.7%) | 45 (5.6%) |
| 45 to 54 Years | 863 (81.6%) | 45 (5.2%) |
| 55 to 59 Years | 505 (86.6%) | 21 (4.2%) |
| 60 to 64 Years | 279 (72.5%) | 0 (0.0%) |
| 65 to 74 Years | 253 (33.1%) | 19 (7.5%) |
| 75 Years and over | 5 (1.9%) | 0 (0.0%) |
| Total | 4,241 (69.1%) | 212 (5.0%) |
Employment Status by Educational Attainment in Madison Park
According to labor force statistics for Madison Park, 82.7% of individuals (3,558) out of the total population between 25 and 64 years of age (4,302) are in the labor force, with 3.8% or 135 of them being unemployed. The group with the highest labor force participation rate are those with the educational attainment of high school diploma, with 94.3% or 1,156 individuals in the labor force. Within the labor force, individuals with bachelor's degree or higher education have the highest percentage of unemployment, with 7.9% or 91 of them being unemployed.
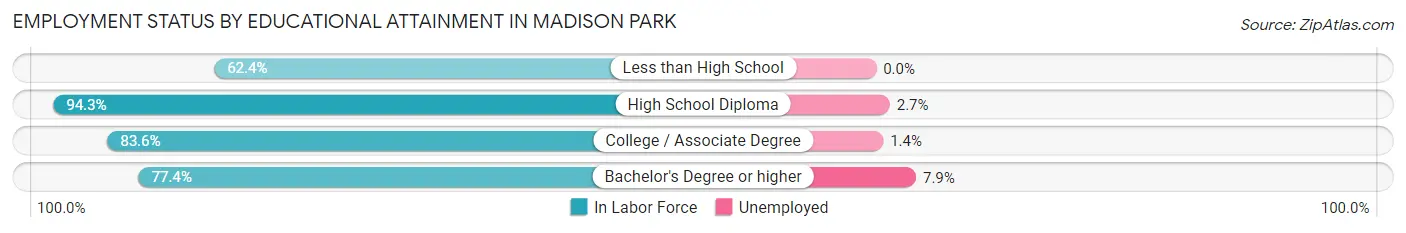
| Educational Attainment | In Labor Force | Unemployed |
| Less than High School | 226 (62.4%) | 0 (0.0%) |
| High School Diploma | 1,156 (94.3%) | 33 (2.7%) |
| College / Associate Degree | 1,021 (83.6%) | 17 (1.4%) |
| Bachelor's Degree or higher | 1,156 (77.4%) | 118 (7.9%) |
| Total | 3,558 (82.7%) | 163 (3.8%) |
Employment Occupations by Sex in Madison Park
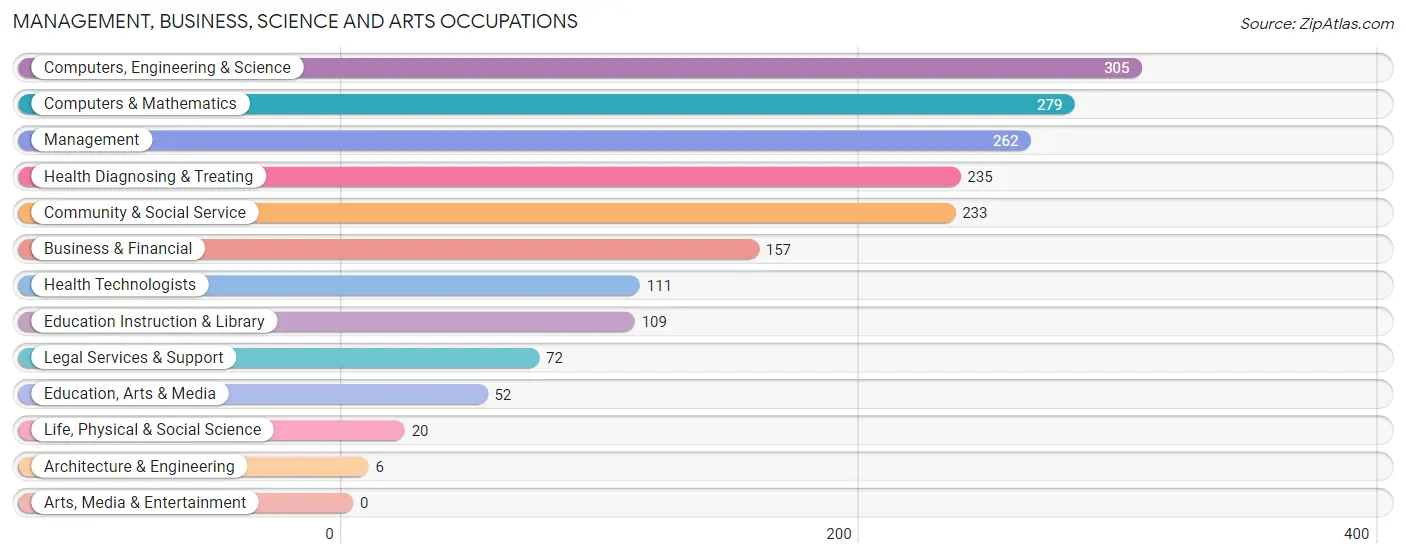
Management, Business, Science and Arts Occupations
The most common Management, Business, Science and Arts occupations in Madison Park are Computers, Engineering & Science (305 | 7.6%), Computers & Mathematics (279 | 6.9%), Management (262 | 6.5%), Health Diagnosing & Treating (235 | 5.8%), and Community & Social Service (233 | 5.8%).
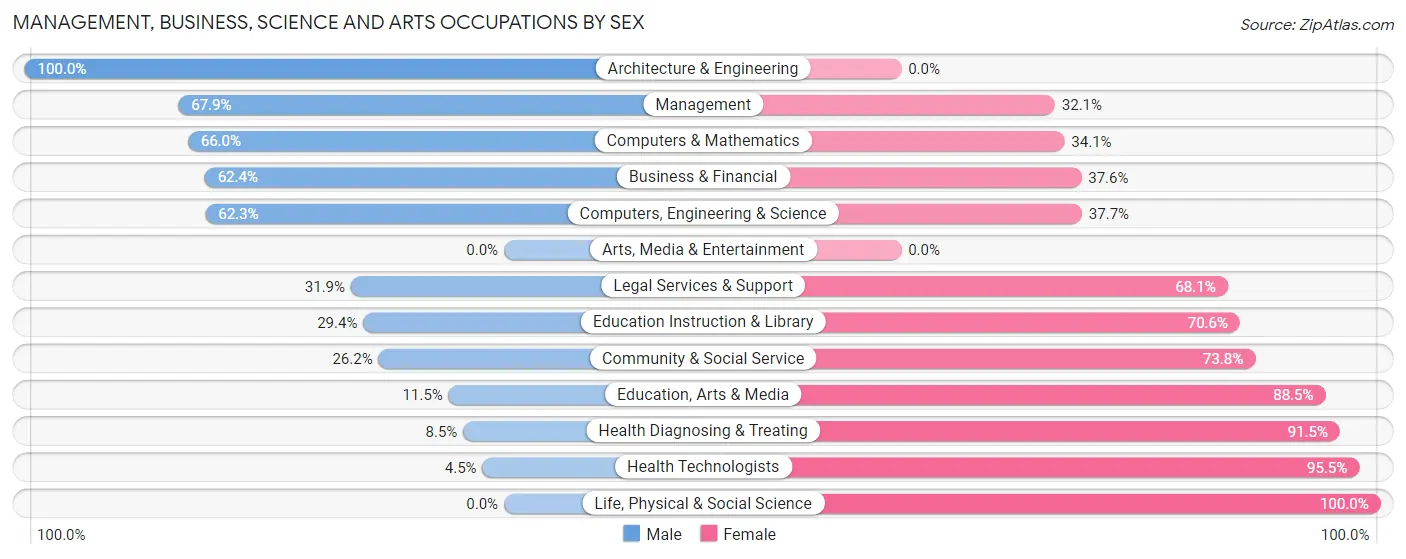
Management, Business, Science and Arts Occupations by Sex
Within the Management, Business, Science and Arts occupations in Madison Park, the most male-oriented occupations are Architecture & Engineering (100.0%), Management (67.9%), and Computers & Mathematics (65.9%), while the most female-oriented occupations are Life, Physical & Social Science (100.0%), Health Technologists (95.5%), and Health Diagnosing & Treating (91.5%).
| Occupation | Male | Female |
| Management | 178 (67.9%) | 84 (32.1%) |
| Business & Financial | 98 (62.4%) | 59 (37.6%) |
| Computers, Engineering & Science | 190 (62.3%) | 115 (37.7%) |
| Computers & Mathematics | 184 (65.9%) | 95 (34.1%) |
| Architecture & Engineering | 6 (100.0%) | 0 (0.0%) |
| Life, Physical & Social Science | 0 (0.0%) | 20 (100.0%) |
| Community & Social Service | 61 (26.2%) | 172 (73.8%) |
| Education, Arts & Media | 6 (11.5%) | 46 (88.5%) |
| Legal Services & Support | 23 (31.9%) | 49 (68.1%) |
| Education Instruction & Library | 32 (29.4%) | 77 (70.6%) |
| Arts, Media & Entertainment | 0 (0.0%) | 0 (0.0%) |
| Health Diagnosing & Treating | 20 (8.5%) | 215 (91.5%) |
| Health Technologists | 5 (4.5%) | 106 (95.5%) |
| Total (Category) | 547 (45.9%) | 645 (54.1%) |
| Total (Overall) | 1,986 (49.3%) | 2,045 (50.7%) |
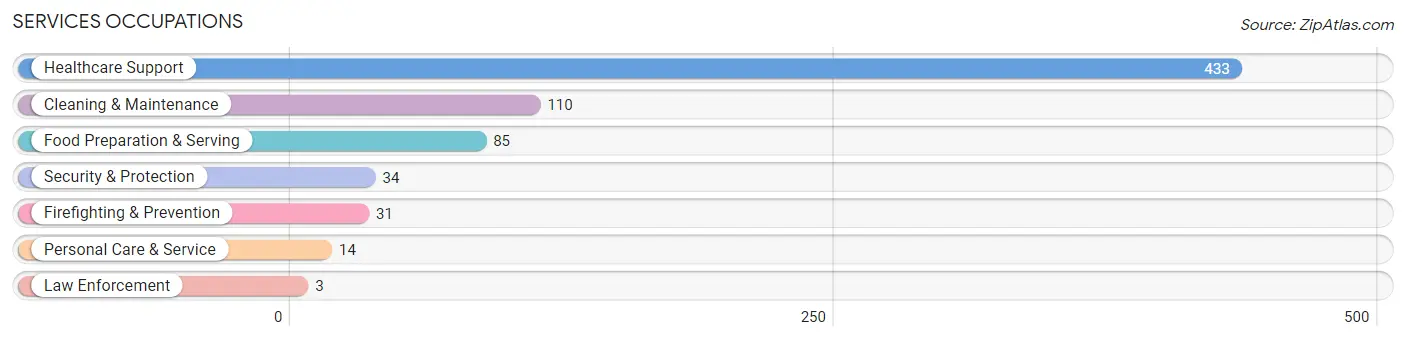
Services Occupations
The most common Services occupations in Madison Park are Healthcare Support (433 | 10.7%), Cleaning & Maintenance (110 | 2.7%), Food Preparation & Serving (85 | 2.1%), Security & Protection (34 | 0.8%), and Firefighting & Prevention (31 | 0.8%).
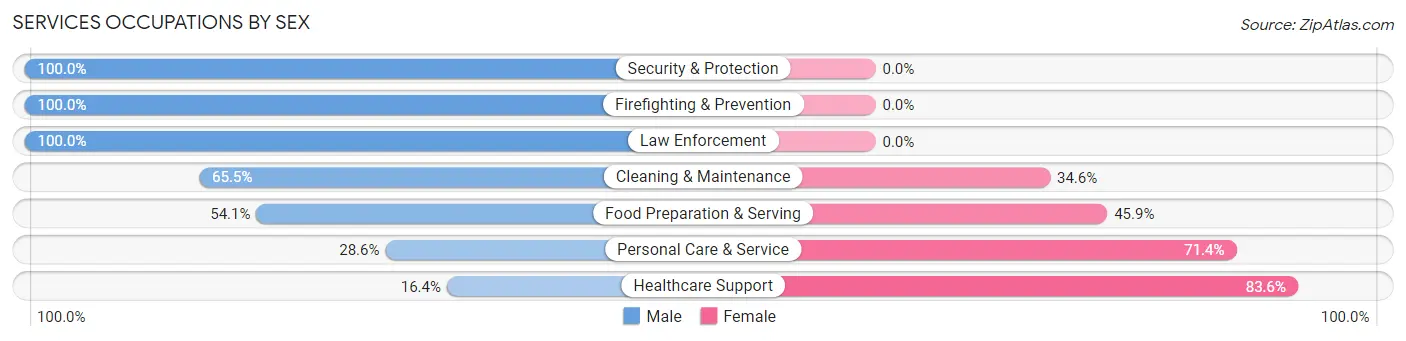
Services Occupations by Sex
Within the Services occupations in Madison Park, the most male-oriented occupations are Security & Protection (100.0%), Firefighting & Prevention (100.0%), and Law Enforcement (100.0%), while the most female-oriented occupations are Healthcare Support (83.6%), Personal Care & Service (71.4%), and Food Preparation & Serving (45.9%).
| Occupation | Male | Female |
| Healthcare Support | 71 (16.4%) | 362 (83.6%) |
| Security & Protection | 34 (100.0%) | 0 (0.0%) |
| Firefighting & Prevention | 31 (100.0%) | 0 (0.0%) |
| Law Enforcement | 3 (100.0%) | 0 (0.0%) |
| Food Preparation & Serving | 46 (54.1%) | 39 (45.9%) |
| Cleaning & Maintenance | 72 (65.4%) | 38 (34.5%) |
| Personal Care & Service | 4 (28.6%) | 10 (71.4%) |
| Total (Category) | 227 (33.6%) | 449 (66.4%) |
| Total (Overall) | 1,986 (49.3%) | 2,045 (50.7%) |
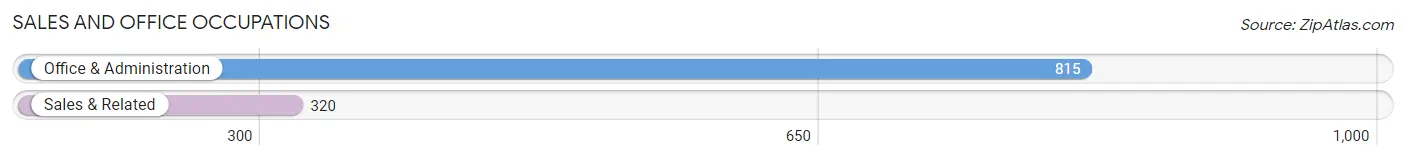
Sales and Office Occupations
The most common Sales and Office occupations in Madison Park are Office & Administration (815 | 20.2%), and Sales & Related (320 | 7.9%).
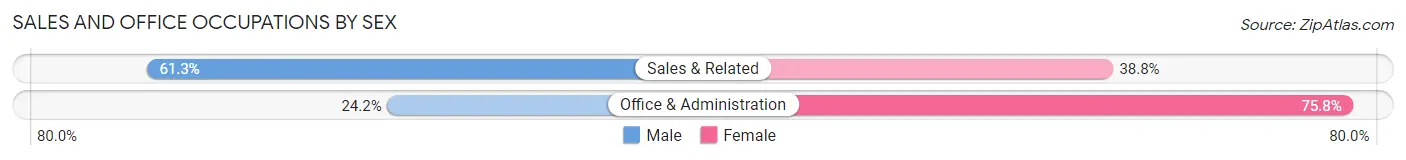
Sales and Office Occupations by Sex
| Occupation | Male | Female |
| Sales & Related | 196 (61.3%) | 124 (38.8%) |
| Office & Administration | 197 (24.2%) | 618 (75.8%) |
| Total (Category) | 393 (34.6%) | 742 (65.4%) |
| Total (Overall) | 1,986 (49.3%) | 2,045 (50.7%) |
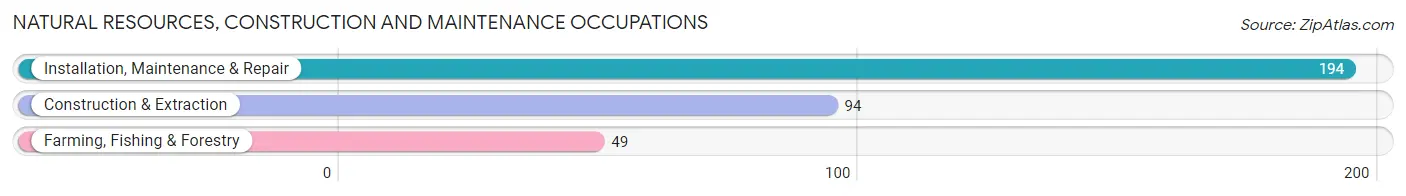
Natural Resources, Construction and Maintenance Occupations
The most common Natural Resources, Construction and Maintenance occupations in Madison Park are Installation, Maintenance & Repair (194 | 4.8%), Construction & Extraction (94 | 2.3%), and Farming, Fishing & Forestry (49 | 1.2%).
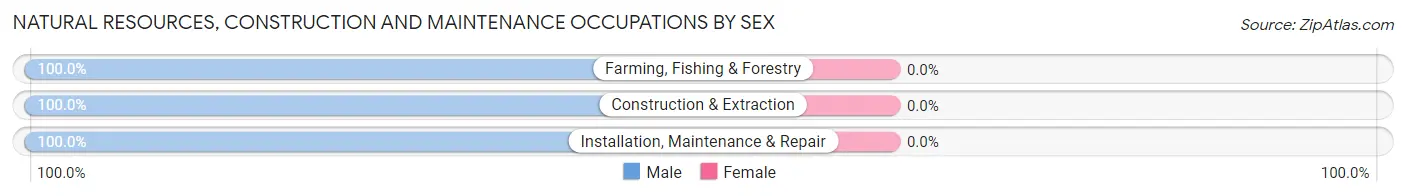
Natural Resources, Construction and Maintenance Occupations by Sex
| Occupation | Male | Female |
| Farming, Fishing & Forestry | 49 (100.0%) | 0 (0.0%) |
| Construction & Extraction | 94 (100.0%) | 0 (0.0%) |
| Installation, Maintenance & Repair | 194 (100.0%) | 0 (0.0%) |
| Total (Category) | 337 (100.0%) | 0 (0.0%) |
| Total (Overall) | 1,986 (49.3%) | 2,045 (50.7%) |
Production, Transportation and Moving Occupations
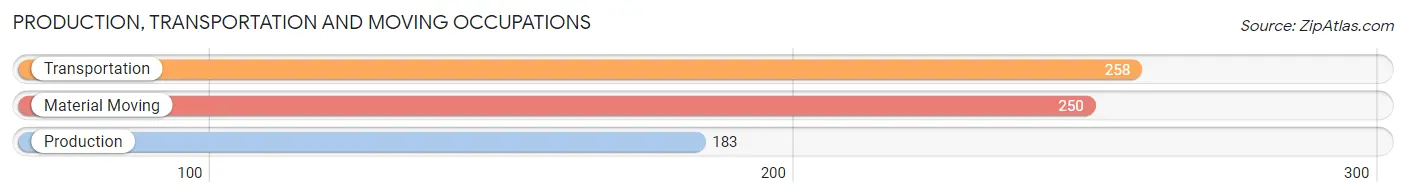
The most common Production, Transportation and Moving occupations in Madison Park are Transportation (258 | 6.4%), Material Moving (250 | 6.2%), and Production (183 | 4.5%).
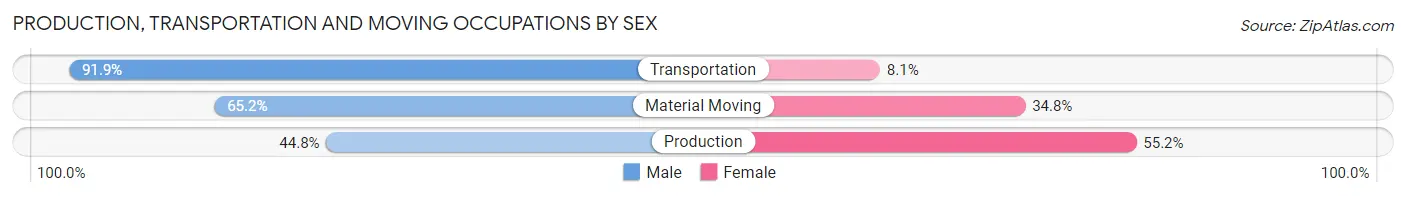
Production, Transportation and Moving Occupations by Sex
| Occupation | Male | Female |
| Production | 82 (44.8%) | 101 (55.2%) |
| Transportation | 237 (91.9%) | 21 (8.1%) |
| Material Moving | 163 (65.2%) | 87 (34.8%) |
| Total (Category) | 482 (69.8%) | 209 (30.2%) |
| Total (Overall) | 1,986 (49.3%) | 2,045 (50.7%) |
Employment Industries by Sex in Madison Park
Employment Industries in Madison Park
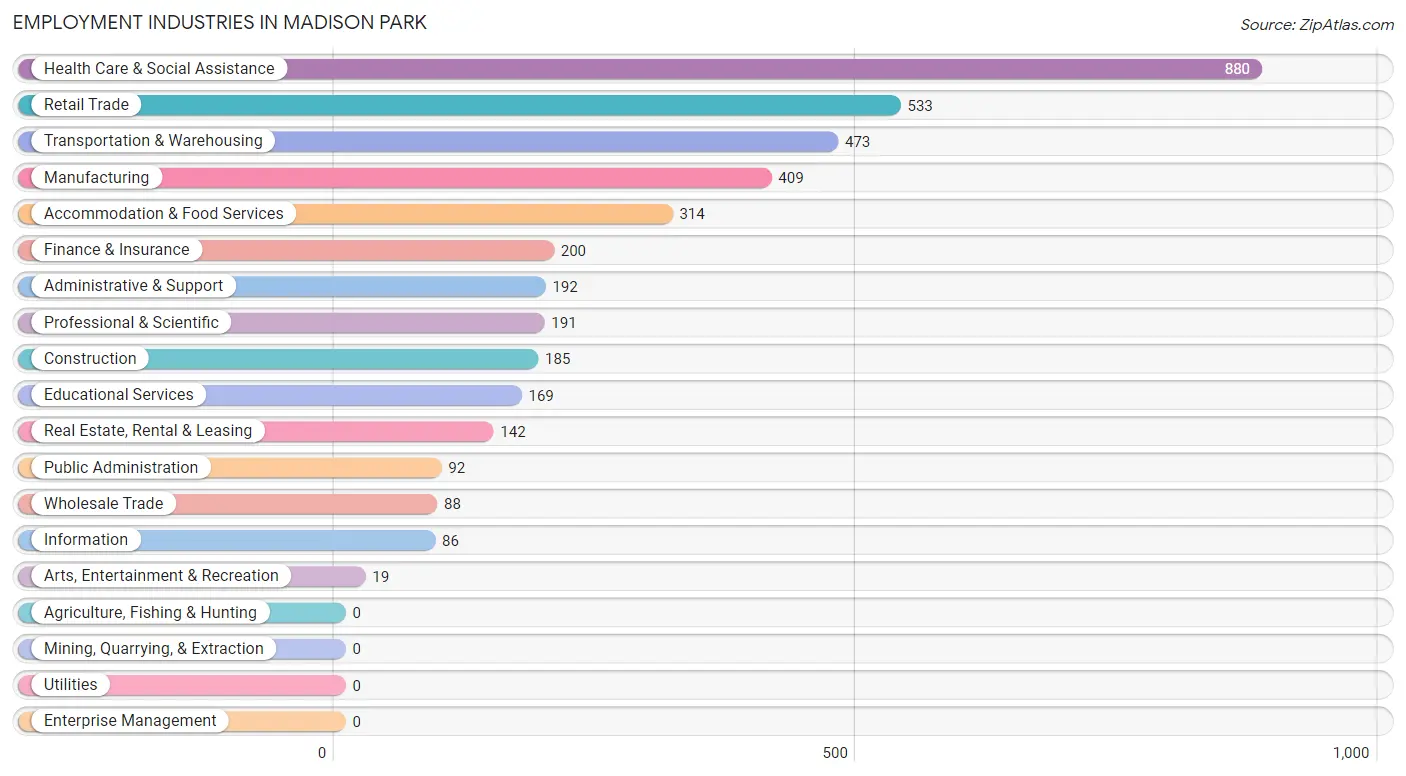
The major employment industries in Madison Park include Health Care & Social Assistance (880 | 21.8%), Retail Trade (533 | 13.2%), Transportation & Warehousing (473 | 11.7%), Manufacturing (409 | 10.2%), and Accommodation & Food Services (314 | 7.8%).
Employment Industries by Sex in Madison Park
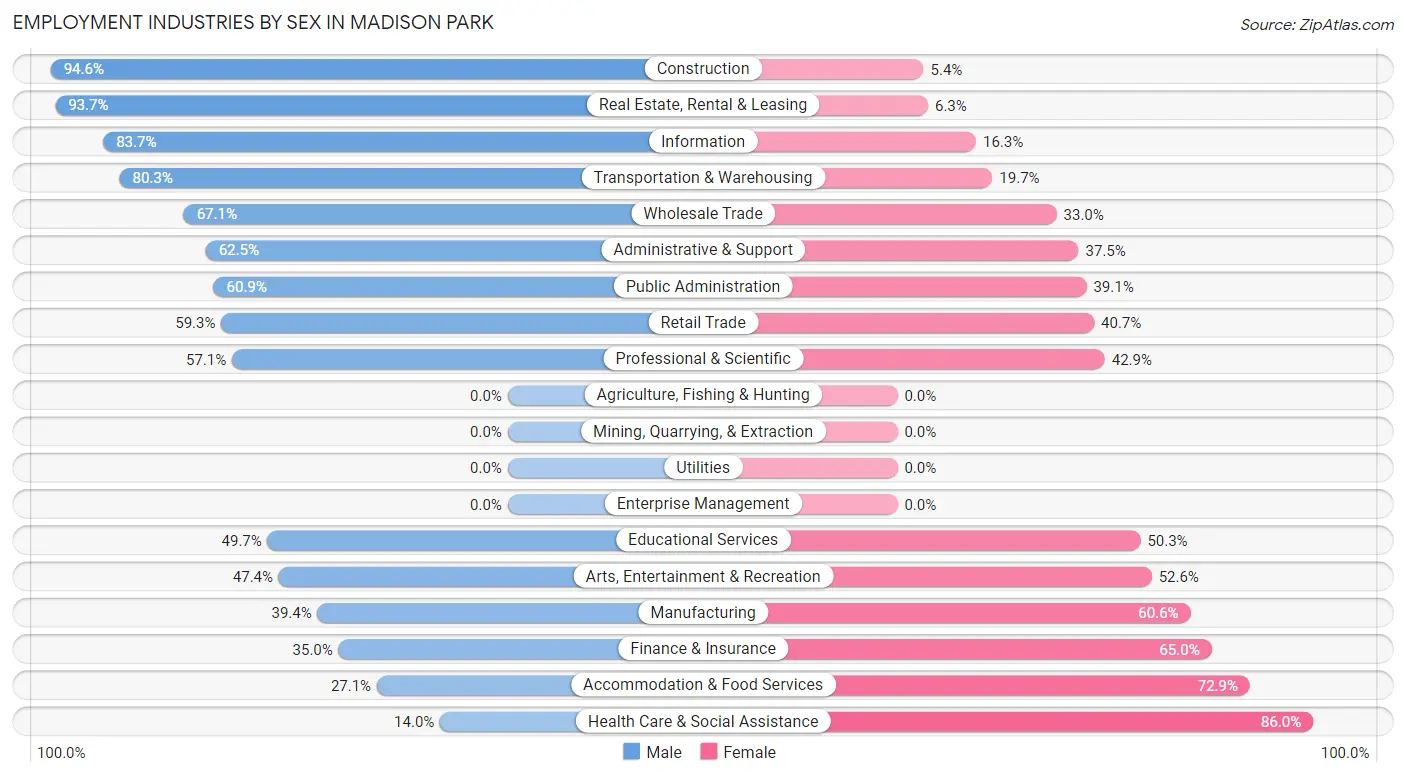
The Madison Park industries that see more men than women are Construction (94.6%), Real Estate, Rental & Leasing (93.7%), and Information (83.7%), whereas the industries that tend to have a higher number of women are Health Care & Social Assistance (86.0%), Accommodation & Food Services (72.9%), and Finance & Insurance (65.0%).
| Industry | Male | Female |
| Agriculture, Fishing & Hunting | 0 (0.0%) | 0 (0.0%) |
| Mining, Quarrying, & Extraction | 0 (0.0%) | 0 (0.0%) |
| Construction | 175 (94.6%) | 10 (5.4%) |
| Manufacturing | 161 (39.4%) | 248 (60.6%) |
| Wholesale Trade | 59 (67.0%) | 29 (33.0%) |
| Retail Trade | 316 (59.3%) | 217 (40.7%) |
| Transportation & Warehousing | 380 (80.3%) | 93 (19.7%) |
| Utilities | 0 (0.0%) | 0 (0.0%) |
| Information | 72 (83.7%) | 14 (16.3%) |
| Finance & Insurance | 70 (35.0%) | 130 (65.0%) |
| Real Estate, Rental & Leasing | 133 (93.7%) | 9 (6.3%) |
| Professional & Scientific | 109 (57.1%) | 82 (42.9%) |
| Enterprise Management | 0 (0.0%) | 0 (0.0%) |
| Administrative & Support | 120 (62.5%) | 72 (37.5%) |
| Educational Services | 84 (49.7%) | 85 (50.3%) |
| Health Care & Social Assistance | 123 (14.0%) | 757 (86.0%) |
| Arts, Entertainment & Recreation | 9 (47.4%) | 10 (52.6%) |
| Accommodation & Food Services | 85 (27.1%) | 229 (72.9%) |
| Public Administration | 56 (60.9%) | 36 (39.1%) |
| Total | 1,986 (49.3%) | 2,045 (50.7%) |
Education in Madison Park
School Enrollment in Madison Park
The most common levels of schooling among the 2,633 students in Madison Park are elementary school (688 | 26.1%), college / undergraduate (596 | 22.6%), and middle school (577 | 21.9%).
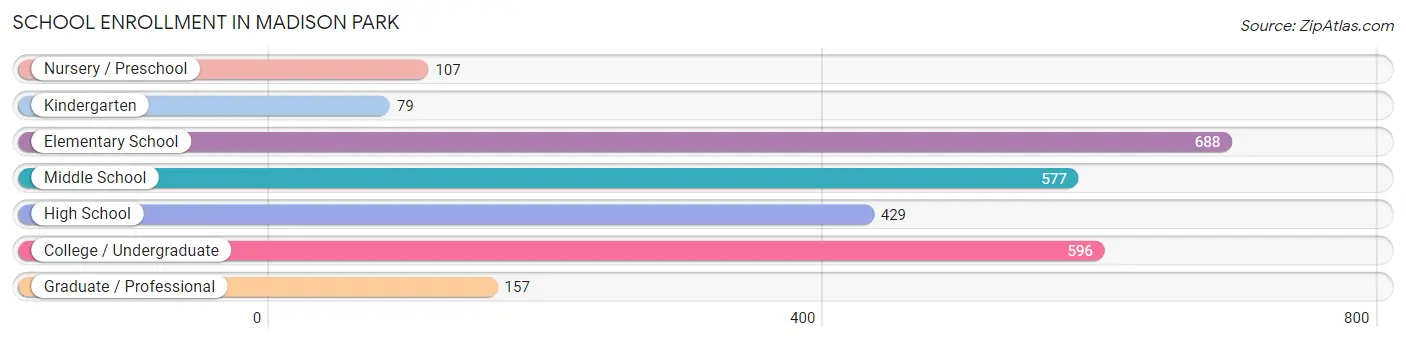
| School Level | # Students | % Students |
| Nursery / Preschool | 107 | 4.1% |
| Kindergarten | 79 | 3.0% |
| Elementary School | 688 | 26.1% |
| Middle School | 577 | 21.9% |
| High School | 429 | 16.3% |
| College / Undergraduate | 596 | 22.6% |
| Graduate / Professional | 157 | 6.0% |
| Total | 2,633 | 100.0% |
School Enrollment by Age by Funding Source in Madison Park
Out of a total of 2,633 students who are enrolled in schools in Madison Park, 487 (18.5%) attend a private institution, while the remaining 2,146 (81.5%) are enrolled in public schools. The age group of 3 to 4 year olds has the highest likelihood of being enrolled in private schools, with 93 (86.9% in the age bracket) enrolled. Conversely, the age group of 15 to 17 year olds has the lowest likelihood of being enrolled in a private school, with 415 (100.0% in the age bracket) attending a public institution.
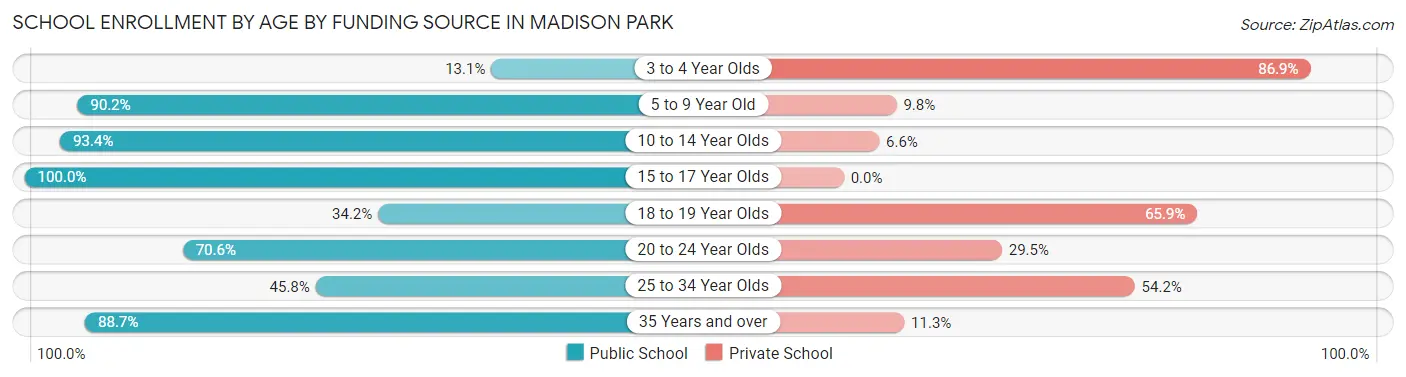
| Age Bracket | Public School | Private School |
| 3 to 4 Year Olds | 14 (13.1%) | 93 (86.9%) |
| 5 to 9 Year Old | 651 (90.2%) | 71 (9.8%) |
| 10 to 14 Year Olds | 566 (93.4%) | 40 (6.6%) |
| 15 to 17 Year Olds | 415 (100.0%) | 0 (0.0%) |
| 18 to 19 Year Olds | 56 (34.2%) | 108 (65.8%) |
| 20 to 24 Year Olds | 194 (70.6%) | 81 (29.4%) |
| 25 to 34 Year Olds | 60 (45.8%) | 71 (54.2%) |
| 35 Years and over | 189 (88.7%) | 24 (11.3%) |
| Total | 2,146 (81.5%) | 487 (18.5%) |
Educational Attainment by Field of Study in Madison Park
Business (417 | 23.4%), science & technology (245 | 13.8%), education (185 | 10.4%), engineering (177 | 10.0%), and arts & humanities (133 | 7.5%) are the most common fields of study among 1,779 individuals in Madison Park who have obtained a bachelor's degree or higher.
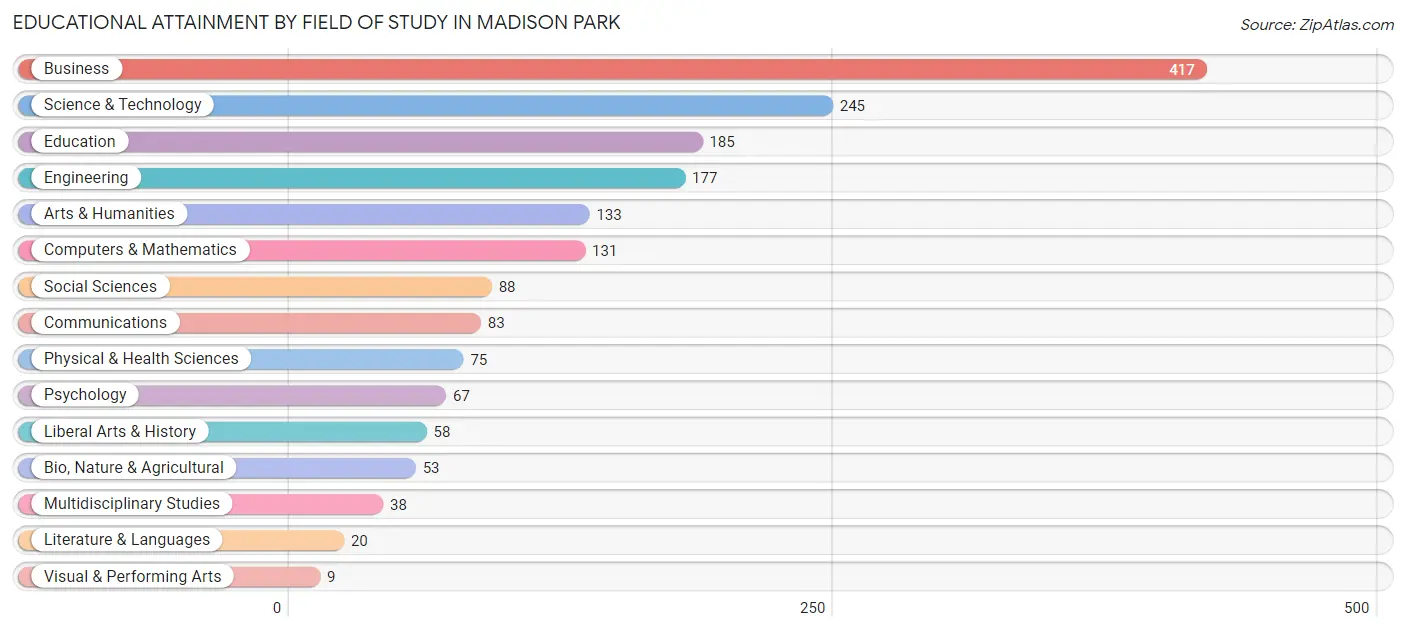
| Field of Study | # Graduates | % Graduates |
| Computers & Mathematics | 131 | 7.4% |
| Bio, Nature & Agricultural | 53 | 3.0% |
| Physical & Health Sciences | 75 | 4.2% |
| Psychology | 67 | 3.8% |
| Social Sciences | 88 | 5.0% |
| Engineering | 177 | 10.0% |
| Multidisciplinary Studies | 38 | 2.1% |
| Science & Technology | 245 | 13.8% |
| Business | 417 | 23.4% |
| Education | 185 | 10.4% |
| Literature & Languages | 20 | 1.1% |
| Liberal Arts & History | 58 | 3.3% |
| Visual & Performing Arts | 9 | 0.5% |
| Communications | 83 | 4.7% |
| Arts & Humanities | 133 | 7.5% |
| Total | 1,779 | 100.0% |
Transportation & Commute in Madison Park
Vehicle Availability by Sex in Madison Park
The most prevalent vehicle ownership categories in Madison Park are males with 2 vehicles (786, accounting for 40.5%) and females with 2 vehicles (769, making up 39.5%).
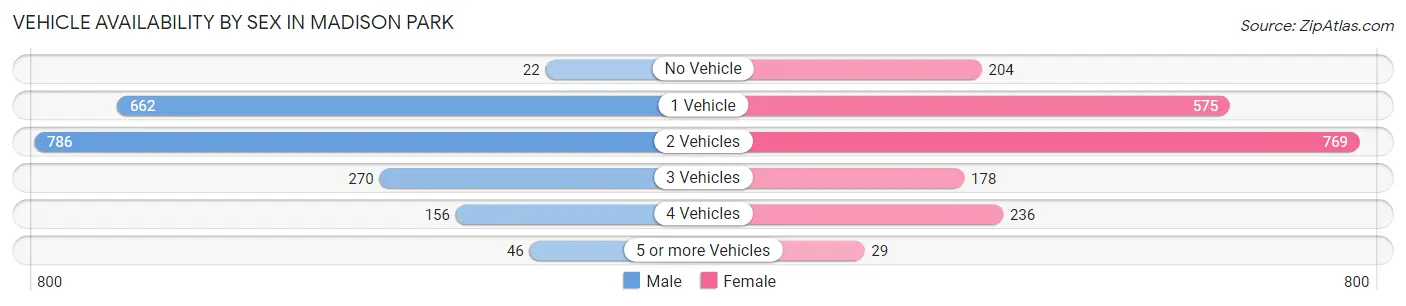
| Vehicles Available | Male | Female |
| No Vehicle | 22 (1.1%) | 204 (10.2%) |
| 1 Vehicle | 662 (34.1%) | 575 (28.9%) |
| 2 Vehicles | 786 (40.5%) | 769 (38.6%) |
| 3 Vehicles | 270 (13.9%) | 178 (8.9%) |
| 4 Vehicles | 156 (8.0%) | 236 (11.8%) |
| 5 or more Vehicles | 46 (2.4%) | 29 (1.5%) |
| Total | 1,942 (100.0%) | 1,991 (100.0%) |
Commute Time in Madison Park
The most frequently occuring commute durations in Madison Park are 30 to 34 minutes (569 commuters, 15.3%), 45 to 59 minutes (472 commuters, 12.7%), and 5 to 9 minutes (418 commuters, 11.3%).
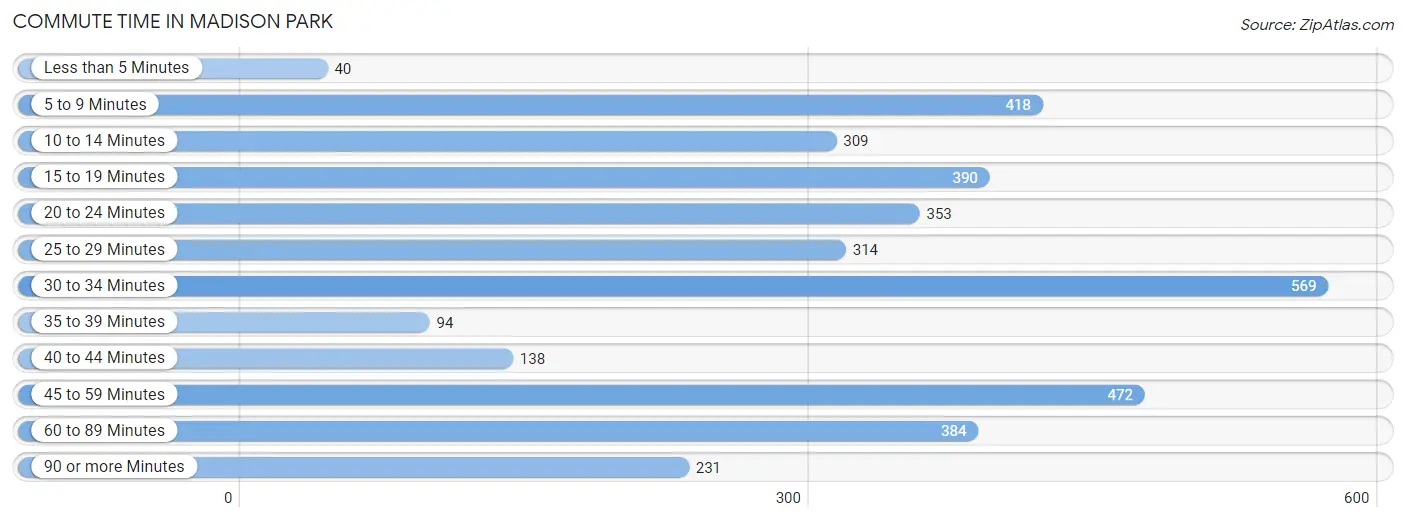
| Commute Time | # Commuters | % Commuters |
| Less than 5 Minutes | 40 | 1.1% |
| 5 to 9 Minutes | 418 | 11.3% |
| 10 to 14 Minutes | 309 | 8.3% |
| 15 to 19 Minutes | 390 | 10.5% |
| 20 to 24 Minutes | 353 | 9.5% |
| 25 to 29 Minutes | 314 | 8.5% |
| 30 to 34 Minutes | 569 | 15.3% |
| 35 to 39 Minutes | 94 | 2.5% |
| 40 to 44 Minutes | 138 | 3.7% |
| 45 to 59 Minutes | 472 | 12.7% |
| 60 to 89 Minutes | 384 | 10.3% |
| 90 or more Minutes | 231 | 6.2% |
Commute Time by Sex in Madison Park
The most common commute times in Madison Park are 30 to 34 minutes (336 commuters, 17.5%) for males and 45 to 59 minutes (272 commuters, 15.2%) for females.
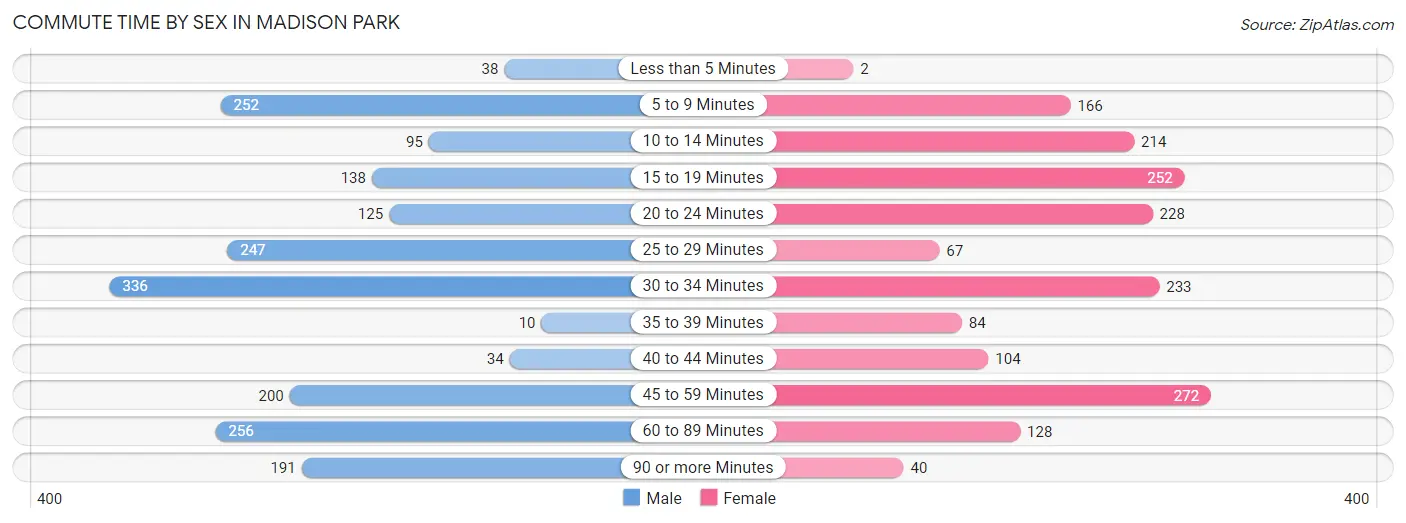
| Commute Time | Male | Female |
| Less than 5 Minutes | 38 (2.0%) | 2 (0.1%) |
| 5 to 9 Minutes | 252 (13.1%) | 166 (9.3%) |
| 10 to 14 Minutes | 95 (4.9%) | 214 (12.0%) |
| 15 to 19 Minutes | 138 (7.2%) | 252 (14.1%) |
| 20 to 24 Minutes | 125 (6.5%) | 228 (12.7%) |
| 25 to 29 Minutes | 247 (12.9%) | 67 (3.7%) |
| 30 to 34 Minutes | 336 (17.5%) | 233 (13.0%) |
| 35 to 39 Minutes | 10 (0.5%) | 84 (4.7%) |
| 40 to 44 Minutes | 34 (1.8%) | 104 (5.8%) |
| 45 to 59 Minutes | 200 (10.4%) | 272 (15.2%) |
| 60 to 89 Minutes | 256 (13.3%) | 128 (7.1%) |
| 90 or more Minutes | 191 (9.9%) | 40 (2.2%) |
Time of Departure to Work by Sex in Madison Park
The most frequent times of departure to work in Madison Park are 7:30 AM to 7:59 AM (291, 15.1%) for males and 7:00 AM to 7:29 AM (361, 20.2%) for females.
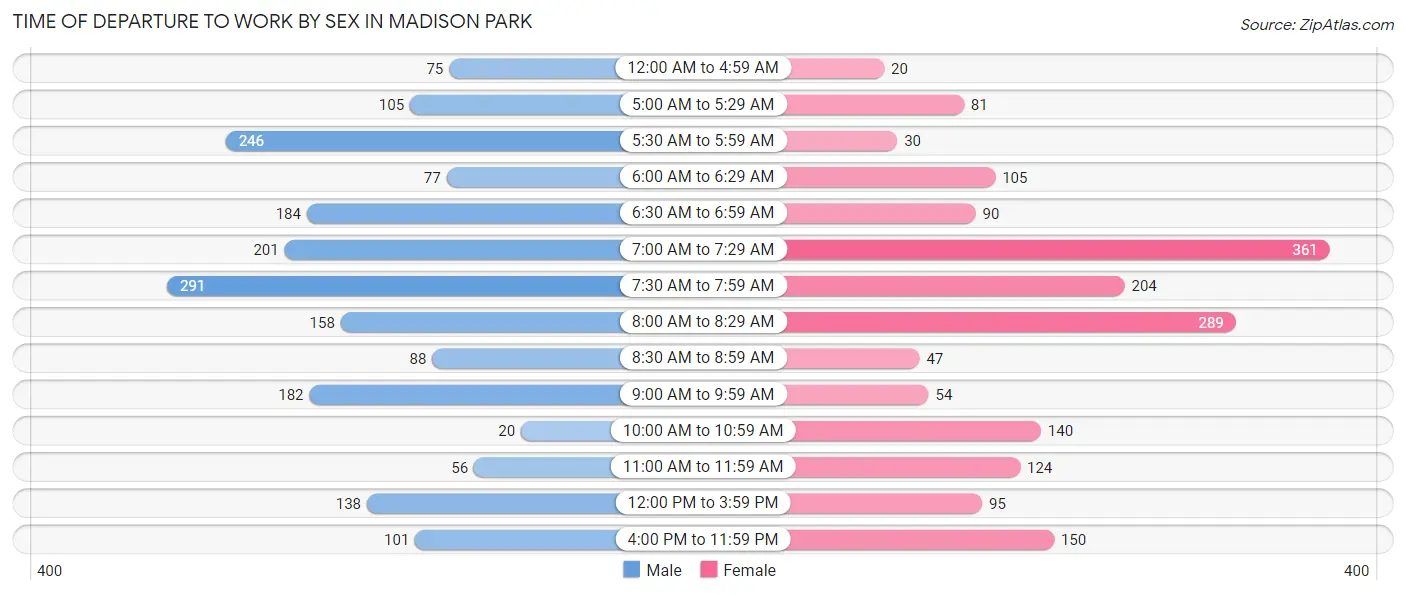
| Time of Departure | Male | Female |
| 12:00 AM to 4:59 AM | 75 (3.9%) | 20 (1.1%) |
| 5:00 AM to 5:29 AM | 105 (5.5%) | 81 (4.5%) |
| 5:30 AM to 5:59 AM | 246 (12.8%) | 30 (1.7%) |
| 6:00 AM to 6:29 AM | 77 (4.0%) | 105 (5.9%) |
| 6:30 AM to 6:59 AM | 184 (9.6%) | 90 (5.0%) |
| 7:00 AM to 7:29 AM | 201 (10.5%) | 361 (20.2%) |
| 7:30 AM to 7:59 AM | 291 (15.1%) | 204 (11.4%) |
| 8:00 AM to 8:29 AM | 158 (8.2%) | 289 (16.2%) |
| 8:30 AM to 8:59 AM | 88 (4.6%) | 47 (2.6%) |
| 9:00 AM to 9:59 AM | 182 (9.5%) | 54 (3.0%) |
| 10:00 AM to 10:59 AM | 20 (1.0%) | 140 (7.8%) |
| 11:00 AM to 11:59 AM | 56 (2.9%) | 124 (6.9%) |
| 12:00 PM to 3:59 PM | 138 (7.2%) | 95 (5.3%) |
| 4:00 PM to 11:59 PM | 101 (5.2%) | 150 (8.4%) |
| Total | 1,922 (100.0%) | 1,790 (100.0%) |
Housing Occupancy in Madison Park
Occupancy by Ownership in Madison Park
Of the total 2,782 dwellings in Madison Park, owner-occupied units account for 864 (31.1%), while renter-occupied units make up 1,918 (68.9%).
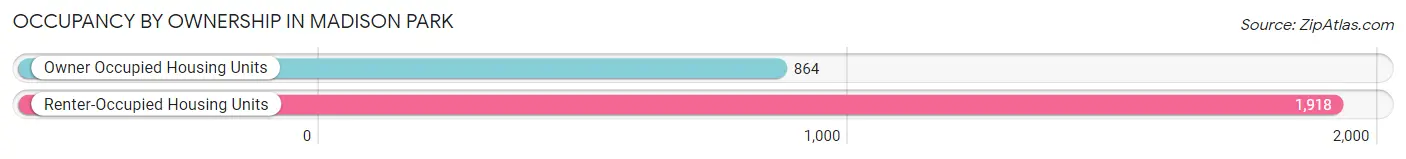
| Occupancy | # Housing Units | % Housing Units |
| Owner Occupied Housing Units | 864 | 31.1% |
| Renter-Occupied Housing Units | 1,918 | 68.9% |
| Total Occupied Housing Units | 2,782 | 100.0% |
Occupancy by Household Size in Madison Park
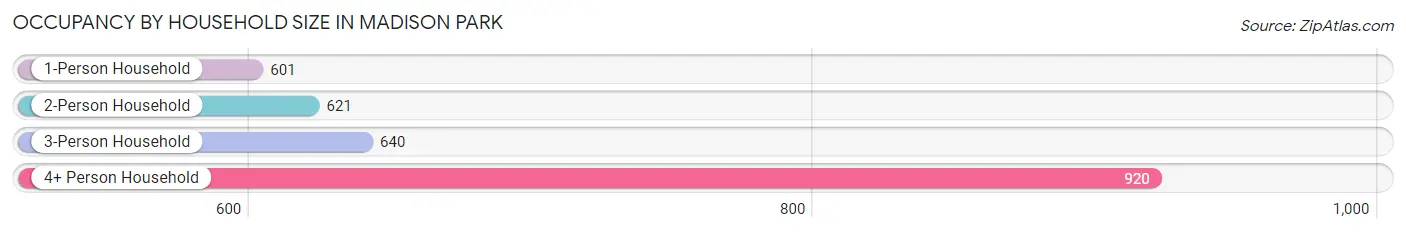
| Household Size | # Housing Units | % Housing Units |
| 1-Person Household | 601 | 21.6% |
| 2-Person Household | 621 | 22.3% |
| 3-Person Household | 640 | 23.0% |
| 4+ Person Household | 920 | 33.1% |
| Total Housing Units | 2,782 | 100.0% |
Occupancy by Ownership by Household Size in Madison Park
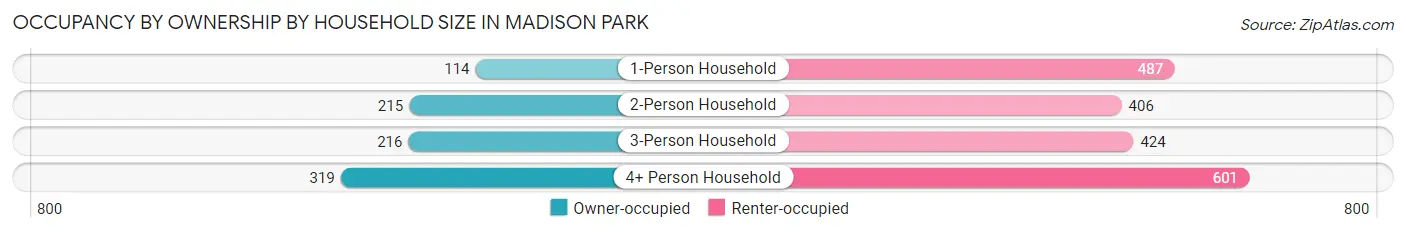
| Household Size | Owner-occupied | Renter-occupied |
| 1-Person Household | 114 (19.0%) | 487 (81.0%) |
| 2-Person Household | 215 (34.6%) | 406 (65.4%) |
| 3-Person Household | 216 (33.8%) | 424 (66.2%) |
| 4+ Person Household | 319 (34.7%) | 601 (65.3%) |
| Total Housing Units | 864 (31.1%) | 1,918 (68.9%) |
Occupancy by Educational Attainment in Madison Park
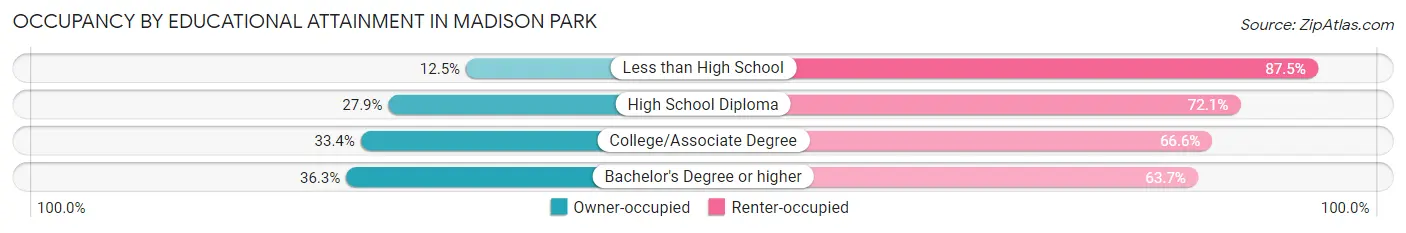
| Household Size | Owner-occupied | Renter-occupied |
| Less than High School | 23 (12.5%) | 161 (87.5%) |
| High School Diploma | 266 (27.9%) | 688 (72.1%) |
| College/Associate Degree | 246 (33.4%) | 491 (66.6%) |
| Bachelor's Degree or higher | 329 (36.3%) | 578 (63.7%) |
Occupancy by Age of Householder in Madison Park
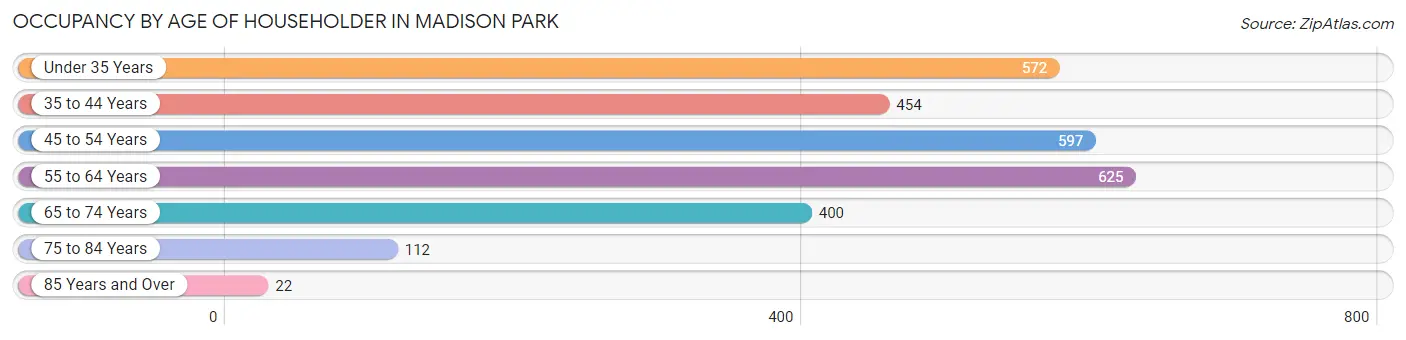
| Age Bracket | # Households | % Households |
| Under 35 Years | 572 | 20.6% |
| 35 to 44 Years | 454 | 16.3% |
| 45 to 54 Years | 597 | 21.5% |
| 55 to 64 Years | 625 | 22.5% |
| 65 to 74 Years | 400 | 14.4% |
| 75 to 84 Years | 112 | 4.0% |
| 85 Years and Over | 22 | 0.8% |
| Total | 2,782 | 100.0% |
Housing Finances in Madison Park
Median Income by Occupancy in Madison Park
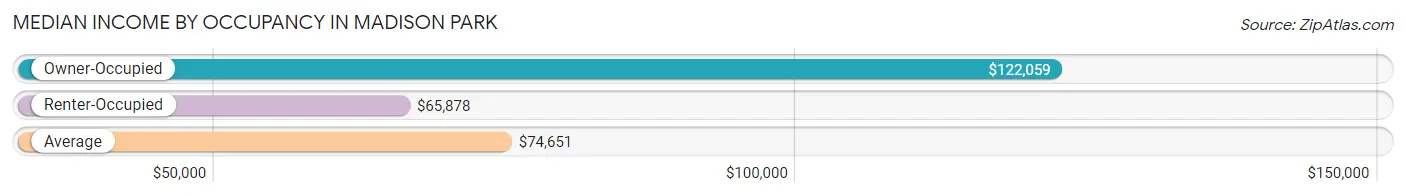
| Occupancy Type | # Households | Median Income |
| Owner-Occupied | 864 (31.1%) | $122,059 |
| Renter-Occupied | 1,918 (68.9%) | $65,878 |
| Average | 2,782 (100.0%) | $74,651 |
Occupancy by Householder Income Bracket in Madison Park
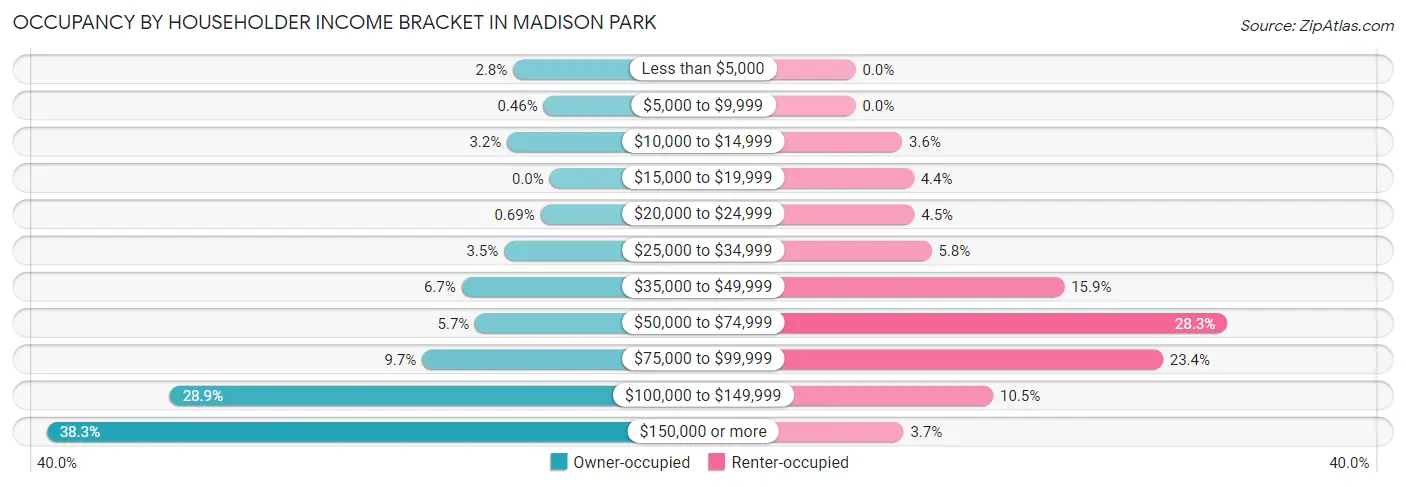
| Income Bracket | Owner-occupied | Renter-occupied |
| Less than $5,000 | 24 (2.8%) | 0 (0.0%) |
| $5,000 to $9,999 | 4 (0.5%) | 0 (0.0%) |
| $10,000 to $14,999 | 28 (3.2%) | 68 (3.5%) |
| $15,000 to $19,999 | 0 (0.0%) | 85 (4.4%) |
| $20,000 to $24,999 | 6 (0.7%) | 86 (4.5%) |
| $25,000 to $34,999 | 30 (3.5%) | 111 (5.8%) |
| $35,000 to $49,999 | 58 (6.7%) | 305 (15.9%) |
| $50,000 to $74,999 | 49 (5.7%) | 543 (28.3%) |
| $75,000 to $99,999 | 84 (9.7%) | 449 (23.4%) |
| $100,000 to $149,999 | 250 (28.9%) | 201 (10.5%) |
| $150,000 or more | 331 (38.3%) | 70 (3.6%) |
| Total | 864 (100.0%) | 1,918 (100.0%) |
Monthly Housing Cost Tiers in Madison Park
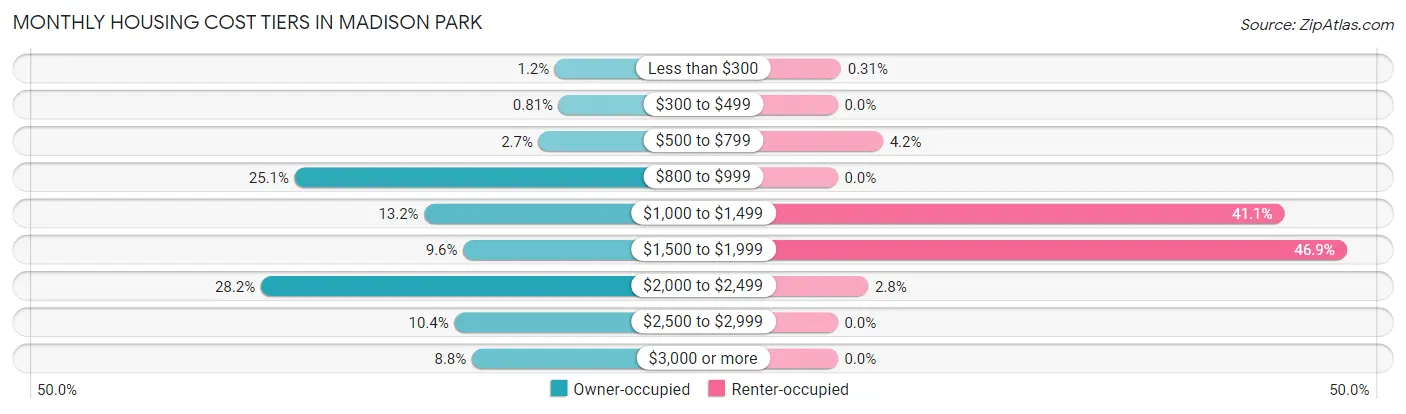
| Monthly Cost | Owner-occupied | Renter-occupied |
| Less than $300 | 10 (1.2%) | 6 (0.3%) |
| $300 to $499 | 7 (0.8%) | 0 (0.0%) |
| $500 to $799 | 23 (2.7%) | 80 (4.2%) |
| $800 to $999 | 217 (25.1%) | 0 (0.0%) |
| $1,000 to $1,499 | 114 (13.2%) | 789 (41.1%) |
| $1,500 to $1,999 | 83 (9.6%) | 899 (46.9%) |
| $2,000 to $2,499 | 244 (28.2%) | 54 (2.8%) |
| $2,500 to $2,999 | 90 (10.4%) | 0 (0.0%) |
| $3,000 or more | 76 (8.8%) | 0 (0.0%) |
| Total | 864 (100.0%) | 1,918 (100.0%) |
Physical Housing Characteristics in Madison Park
Housing Structures in Madison Park
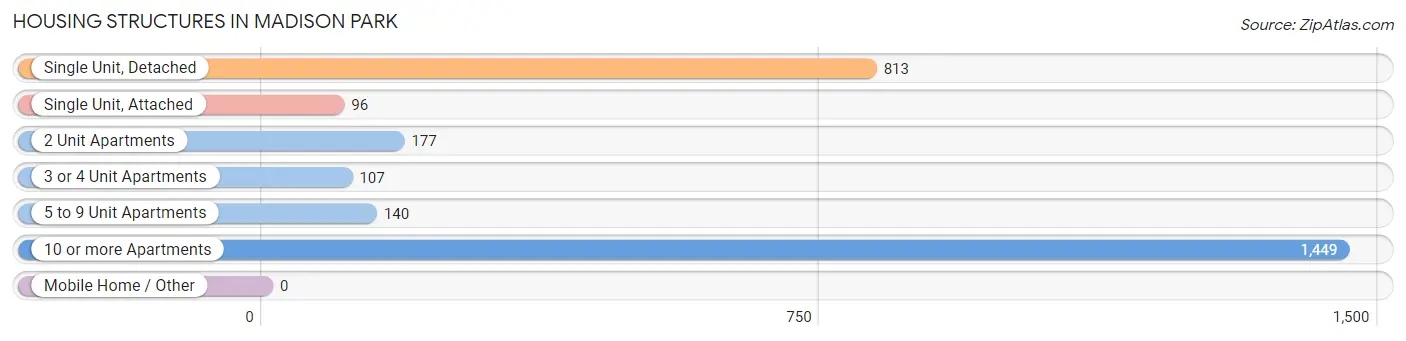
| Structure Type | # Housing Units | % Housing Units |
| Single Unit, Detached | 813 | 29.2% |
| Single Unit, Attached | 96 | 3.5% |
| 2 Unit Apartments | 177 | 6.4% |
| 3 or 4 Unit Apartments | 107 | 3.8% |
| 5 to 9 Unit Apartments | 140 | 5.0% |
| 10 or more Apartments | 1,449 | 52.1% |
| Mobile Home / Other | 0 | 0.0% |
| Total | 2,782 | 100.0% |
Housing Structures by Occupancy in Madison Park
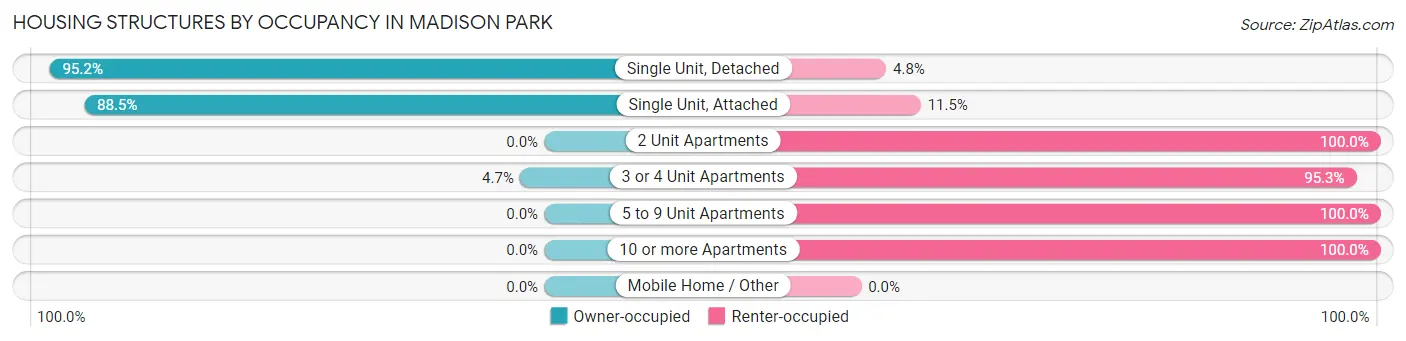
| Structure Type | Owner-occupied | Renter-occupied |
| Single Unit, Detached | 774 (95.2%) | 39 (4.8%) |
| Single Unit, Attached | 85 (88.5%) | 11 (11.5%) |
| 2 Unit Apartments | 0 (0.0%) | 177 (100.0%) |
| 3 or 4 Unit Apartments | 5 (4.7%) | 102 (95.3%) |
| 5 to 9 Unit Apartments | 0 (0.0%) | 140 (100.0%) |
| 10 or more Apartments | 0 (0.0%) | 1,449 (100.0%) |
| Mobile Home / Other | 0 (0.0%) | 0 (0.0%) |
| Total | 864 (31.1%) | 1,918 (68.9%) |
Housing Structures by Number of Rooms in Madison Park
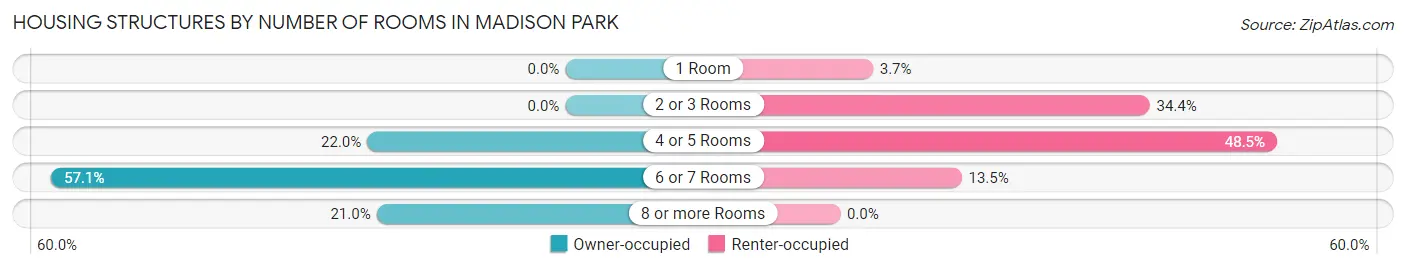
| Number of Rooms | Owner-occupied | Renter-occupied |
| 1 Room | 0 (0.0%) | 70 (3.6%) |
| 2 or 3 Rooms | 0 (0.0%) | 659 (34.4%) |
| 4 or 5 Rooms | 190 (22.0%) | 930 (48.5%) |
| 6 or 7 Rooms | 493 (57.1%) | 259 (13.5%) |
| 8 or more Rooms | 181 (20.9%) | 0 (0.0%) |
| Total | 864 (100.0%) | 1,918 (100.0%) |
Housing Structure by Heating Type in Madison Park
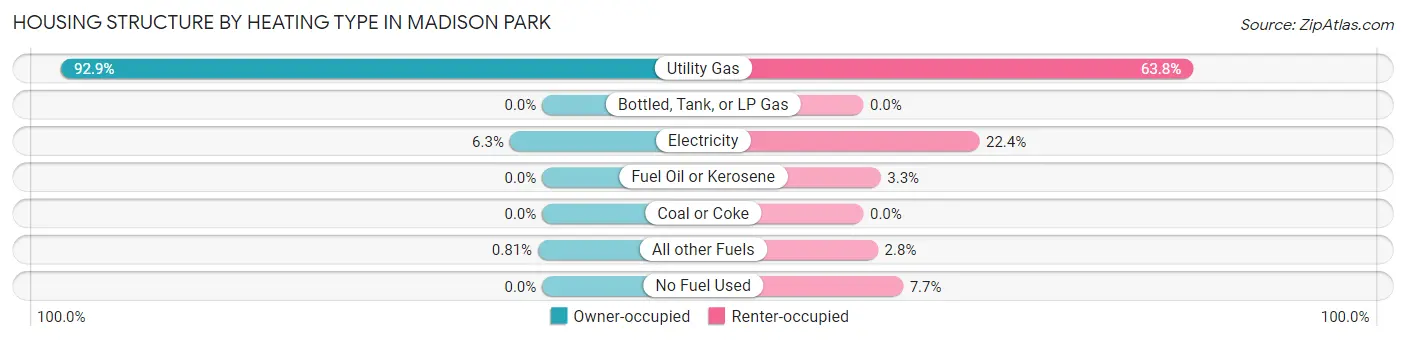
| Heating Type | Owner-occupied | Renter-occupied |
| Utility Gas | 803 (92.9%) | 1,223 (63.8%) |
| Bottled, Tank, or LP Gas | 0 (0.0%) | 0 (0.0%) |
| Electricity | 54 (6.2%) | 430 (22.4%) |
| Fuel Oil or Kerosene | 0 (0.0%) | 64 (3.3%) |
| Coal or Coke | 0 (0.0%) | 0 (0.0%) |
| All other Fuels | 7 (0.8%) | 54 (2.8%) |
| No Fuel Used | 0 (0.0%) | 147 (7.7%) |
| Total | 864 (100.0%) | 1,918 (100.0%) |
Household Vehicle Usage in Madison Park
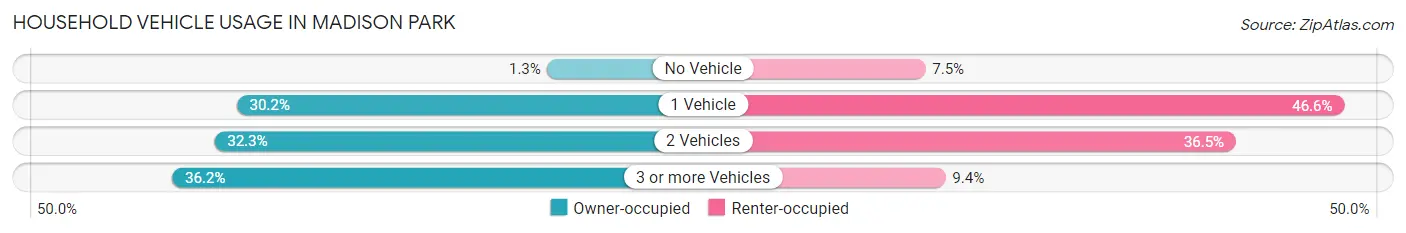
| Vehicles per Household | Owner-occupied | Renter-occupied |
| No Vehicle | 11 (1.3%) | 144 (7.5%) |
| 1 Vehicle | 261 (30.2%) | 894 (46.6%) |
| 2 Vehicles | 279 (32.3%) | 700 (36.5%) |
| 3 or more Vehicles | 313 (36.2%) | 180 (9.4%) |
| Total | 864 (100.0%) | 1,918 (100.0%) |
Real Estate & Mortgages in Madison Park
Real Estate and Mortgage Overview in Madison Park
| Characteristic | Without Mortgage | With Mortgage |
| Housing Units | 296 | 568 |
| Median Property Value | $348,600 | $356,900 |
| Median Household Income | $107,500 | $274 |
| Monthly Housing Costs | $951 | $76 |
| Real Estate Taxes | $6,938 | $37 |
Property Value by Mortgage Status in Madison Park
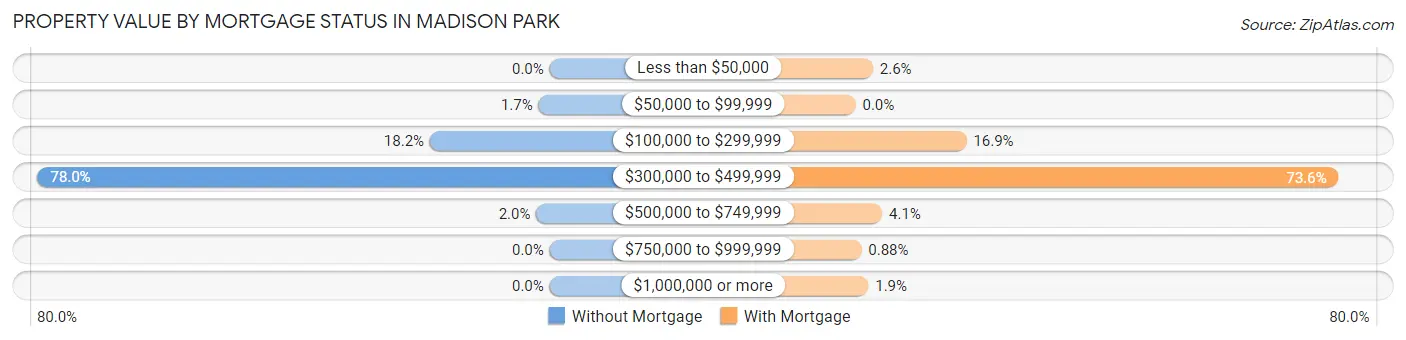
| Property Value | Without Mortgage | With Mortgage |
| Less than $50,000 | 0 (0.0%) | 15 (2.6%) |
| $50,000 to $99,999 | 5 (1.7%) | 0 (0.0%) |
| $100,000 to $299,999 | 54 (18.2%) | 96 (16.9%) |
| $300,000 to $499,999 | 231 (78.0%) | 418 (73.6%) |
| $500,000 to $749,999 | 6 (2.0%) | 23 (4.1%) |
| $750,000 to $999,999 | 0 (0.0%) | 5 (0.9%) |
| $1,000,000 or more | 0 (0.0%) | 11 (1.9%) |
| Total | 296 (100.0%) | 568 (100.0%) |
Household Income by Mortgage Status in Madison Park
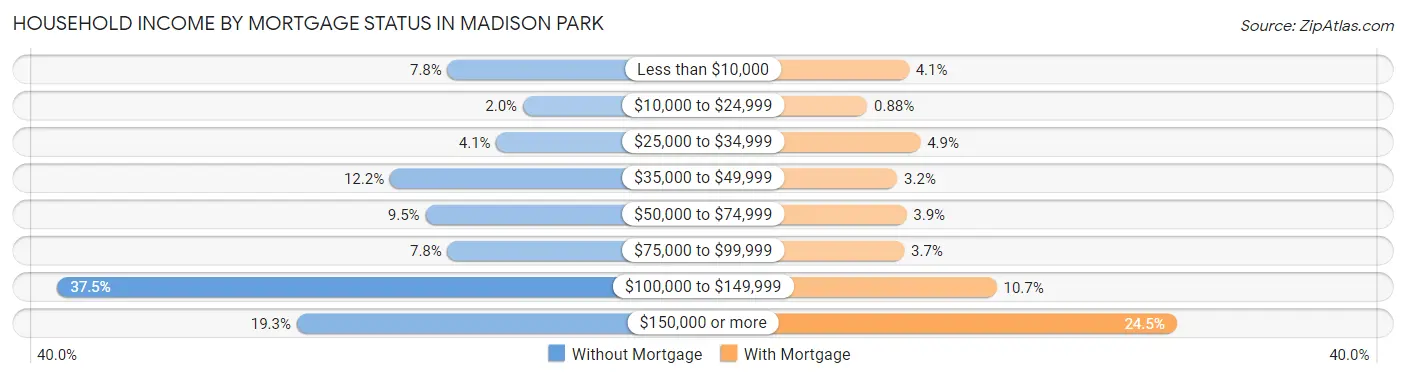
| Household Income | Without Mortgage | With Mortgage |
| Less than $10,000 | 23 (7.8%) | 23 (4.1%) |
| $10,000 to $24,999 | 6 (2.0%) | 5 (0.9%) |
| $25,000 to $34,999 | 12 (4.1%) | 28 (4.9%) |
| $35,000 to $49,999 | 36 (12.2%) | 18 (3.2%) |
| $50,000 to $74,999 | 28 (9.5%) | 22 (3.9%) |
| $75,000 to $99,999 | 23 (7.8%) | 21 (3.7%) |
| $100,000 to $149,999 | 111 (37.5%) | 61 (10.7%) |
| $150,000 or more | 57 (19.3%) | 139 (24.5%) |
| Total | 296 (100.0%) | 568 (100.0%) |
Property Value to Household Income Ratio in Madison Park
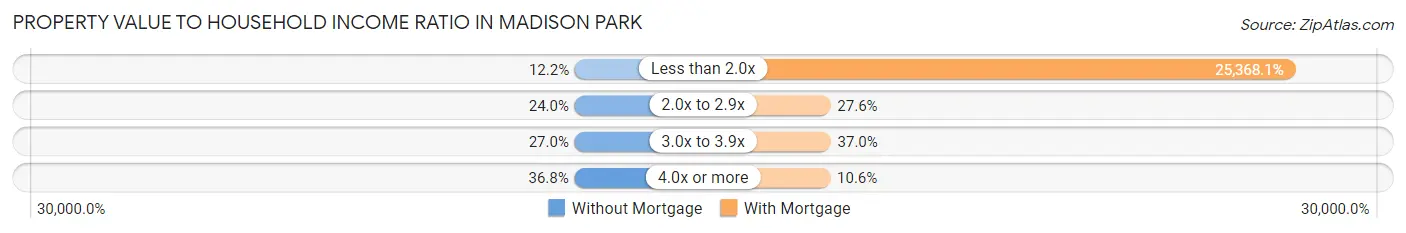
| Value-to-Income Ratio | Without Mortgage | With Mortgage |
| Less than 2.0x | 36 (12.2%) | 144,091 (25,368.1%) |
| 2.0x to 2.9x | 71 (24.0%) | 157 (27.6%) |
| 3.0x to 3.9x | 80 (27.0%) | 210 (37.0%) |
| 4.0x or more | 109 (36.8%) | 60 (10.6%) |
| Total | 296 (100.0%) | 568 (100.0%) |
Real Estate Taxes by Mortgage Status in Madison Park
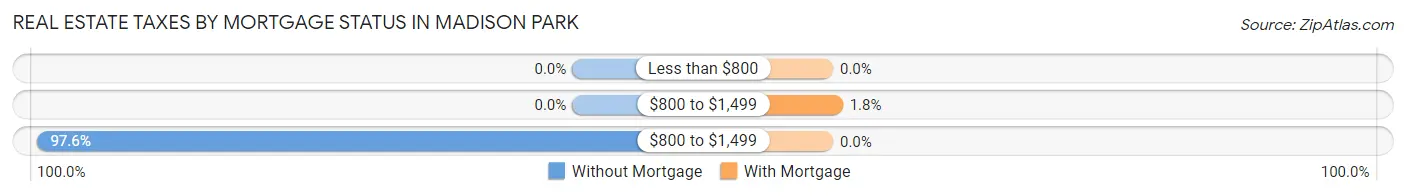
| Property Taxes | Without Mortgage | With Mortgage |
| Less than $800 | 0 (0.0%) | 0 (0.0%) |
| $800 to $1,499 | 0 (0.0%) | 10 (1.8%) |
| $800 to $1,499 | 289 (97.6%) | 0 (0.0%) |
| Total | 296 (100.0%) | 568 (100.0%) |
Health & Disability in Madison Park
Health Insurance Coverage by Age in Madison Park
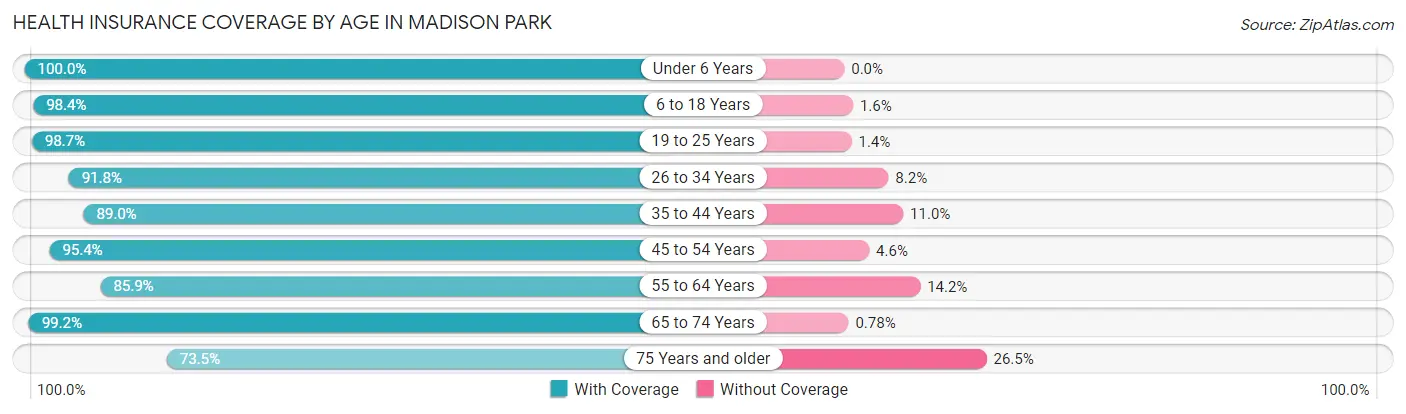
| Age Bracket | With Coverage | Without Coverage |
| Under 6 Years | 609 (100.0%) | 0 (0.0%) |
| 6 to 18 Years | 1,714 (98.4%) | 28 (1.6%) |
| 19 to 25 Years | 801 (98.7%) | 11 (1.3%) |
| 26 to 34 Years | 1,026 (91.8%) | 92 (8.2%) |
| 35 to 44 Years | 851 (89.0%) | 105 (11.0%) |
| 45 to 54 Years | 1,008 (95.4%) | 49 (4.6%) |
| 55 to 64 Years | 831 (85.9%) | 137 (14.1%) |
| 65 to 74 Years | 759 (99.2%) | 6 (0.8%) |
| 75 Years and older | 194 (73.5%) | 70 (26.5%) |
| Total | 7,793 (94.0%) | 498 (6.0%) |
Health Insurance Coverage by Citizenship Status in Madison Park
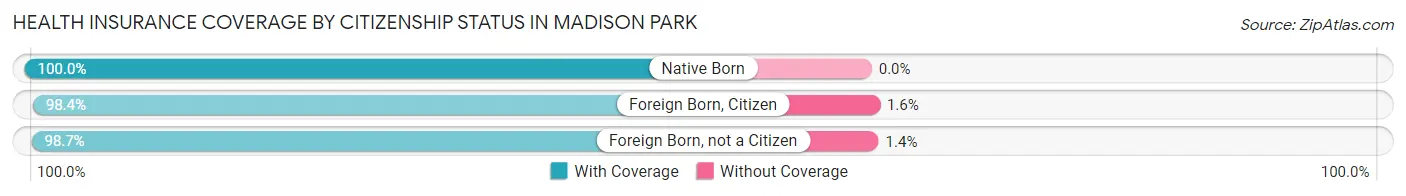
| Citizenship Status | With Coverage | Without Coverage |
| Native Born | 609 (100.0%) | 0 (0.0%) |
| Foreign Born, Citizen | 1,714 (98.4%) | 28 (1.6%) |
| Foreign Born, not a Citizen | 801 (98.7%) | 11 (1.3%) |
Health Insurance Coverage by Household Income in Madison Park
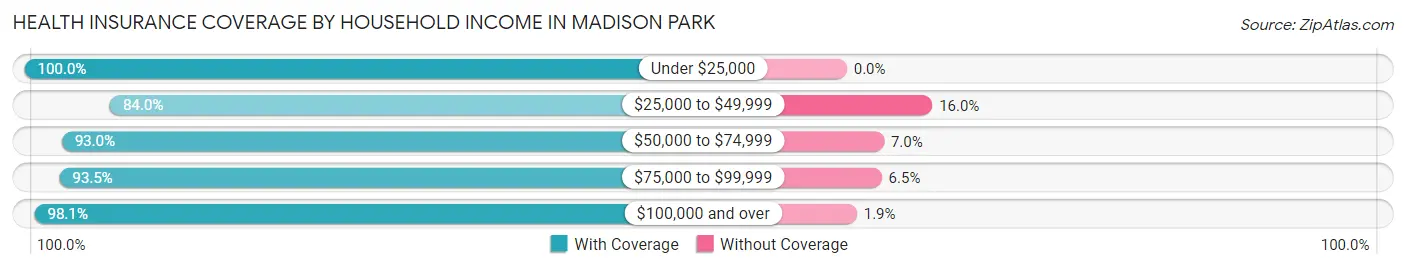
| Household Income | With Coverage | Without Coverage |
| Under $25,000 | 740 (100.0%) | 0 (0.0%) |
| $25,000 to $49,999 | 1,176 (84.0%) | 224 (16.0%) |
| $50,000 to $74,999 | 1,604 (93.0%) | 120 (7.0%) |
| $75,000 to $99,999 | 1,432 (93.5%) | 100 (6.5%) |
| $100,000 and over | 2,836 (98.1%) | 54 (1.9%) |
Public vs Private Health Insurance Coverage by Age in Madison Park
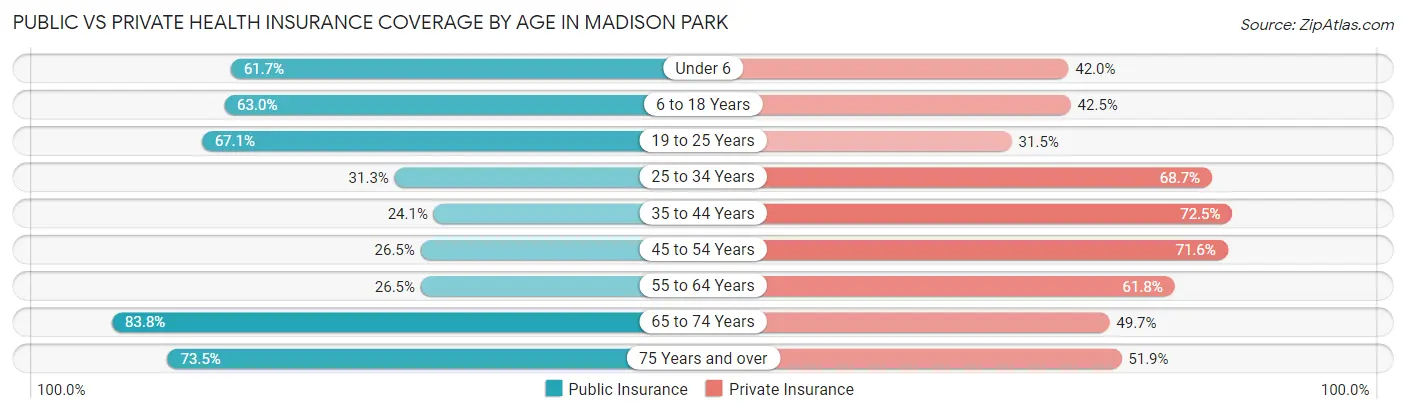
| Age Bracket | Public Insurance | Private Insurance |
| Under 6 | 376 (61.7%) | 256 (42.0%) |
| 6 to 18 Years | 1,097 (63.0%) | 740 (42.5%) |
| 19 to 25 Years | 545 (67.1%) | 256 (31.5%) |
| 25 to 34 Years | 350 (31.3%) | 768 (68.7%) |
| 35 to 44 Years | 230 (24.1%) | 693 (72.5%) |
| 45 to 54 Years | 280 (26.5%) | 757 (71.6%) |
| 55 to 64 Years | 256 (26.5%) | 598 (61.8%) |
| 65 to 74 Years | 641 (83.8%) | 380 (49.7%) |
| 75 Years and over | 194 (73.5%) | 137 (51.9%) |
| Total | 3,969 (47.9%) | 4,585 (55.3%) |
Disability Status by Sex by Age in Madison Park
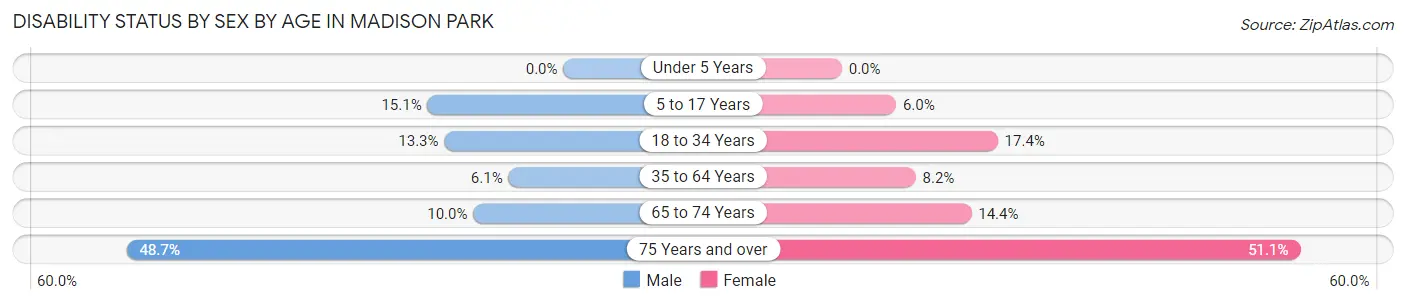
| Age Bracket | Male | Female |
| Under 5 Years | 0 (0.0%) | 0 (0.0%) |
| 5 to 17 Years | 128 (15.1%) | 59 (6.0%) |
| 18 to 34 Years | 110 (13.3%) | 195 (17.4%) |
| 35 to 64 Years | 87 (6.1%) | 128 (8.2%) |
| 65 to 74 Years | 35 (10.0%) | 60 (14.4%) |
| 75 Years and over | 36 (48.6%) | 97 (51.0%) |
Disability Class by Sex by Age in Madison Park
Disability Class: Hearing Difficulty
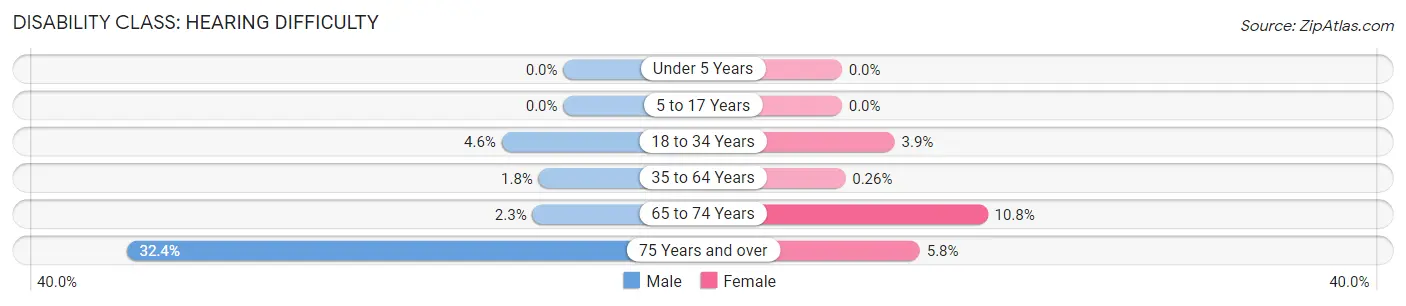
| Age Bracket | Male | Female |
| Under 5 Years | 0 (0.0%) | 0 (0.0%) |
| 5 to 17 Years | 0 (0.0%) | 0 (0.0%) |
| 18 to 34 Years | 38 (4.6%) | 44 (3.9%) |
| 35 to 64 Years | 26 (1.8%) | 4 (0.3%) |
| 65 to 74 Years | 8 (2.3%) | 45 (10.8%) |
| 75 Years and over | 24 (32.4%) | 11 (5.8%) |
Disability Class: Vision Difficulty
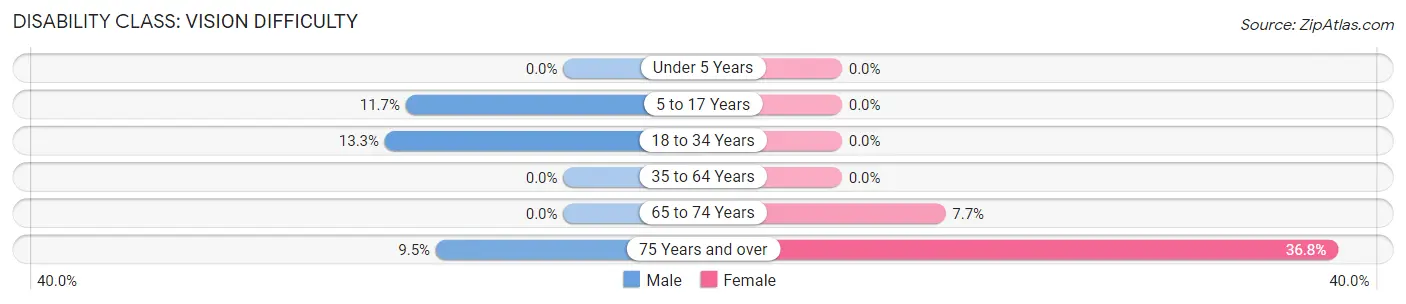
| Age Bracket | Male | Female |
| Under 5 Years | 0 (0.0%) | 0 (0.0%) |
| 5 to 17 Years | 99 (11.7%) | 0 (0.0%) |
| 18 to 34 Years | 110 (13.3%) | 0 (0.0%) |
| 35 to 64 Years | 0 (0.0%) | 0 (0.0%) |
| 65 to 74 Years | 0 (0.0%) | 32 (7.7%) |
| 75 Years and over | 7 (9.5%) | 70 (36.8%) |
Disability Class: Cognitive Difficulty
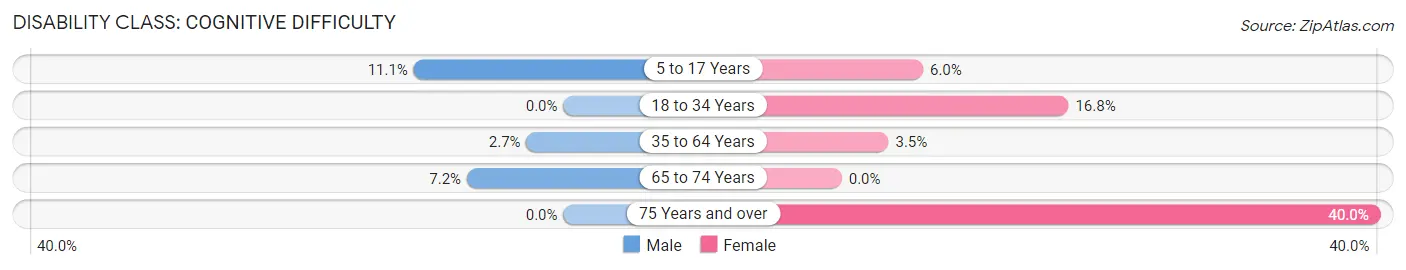
| Age Bracket | Male | Female |
| 5 to 17 Years | 94 (11.1%) | 59 (6.0%) |
| 18 to 34 Years | 0 (0.0%) | 189 (16.8%) |
| 35 to 64 Years | 39 (2.7%) | 54 (3.5%) |
| 65 to 74 Years | 25 (7.2%) | 0 (0.0%) |
| 75 Years and over | 0 (0.0%) | 76 (40.0%) |
Disability Class: Ambulatory Difficulty
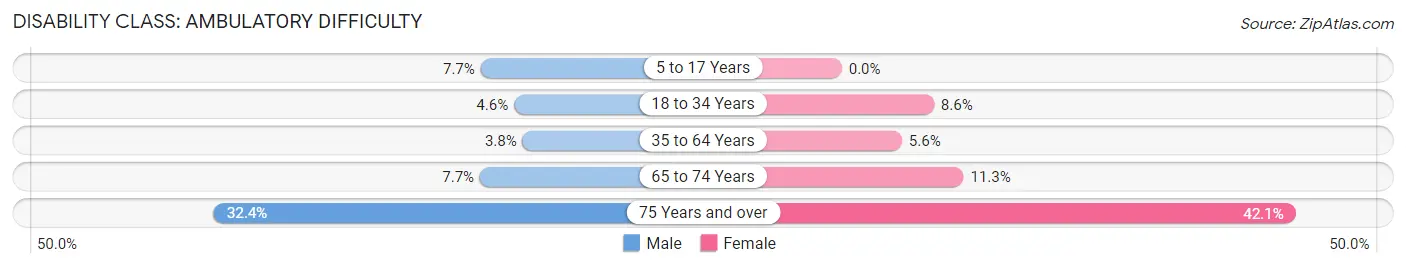
| Age Bracket | Male | Female |
| 5 to 17 Years | 65 (7.7%) | 0 (0.0%) |
| 18 to 34 Years | 38 (4.6%) | 96 (8.6%) |
| 35 to 64 Years | 54 (3.8%) | 87 (5.6%) |
| 65 to 74 Years | 27 (7.7%) | 47 (11.3%) |
| 75 Years and over | 24 (32.4%) | 80 (42.1%) |
Disability Class: Self-Care Difficulty
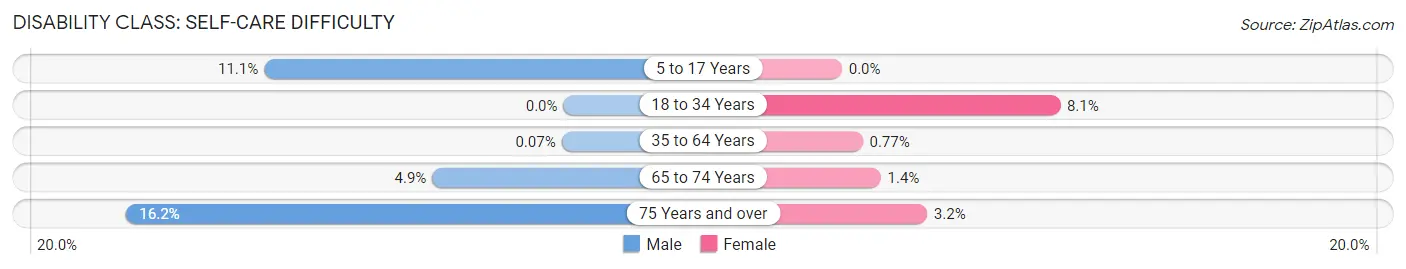
| Age Bracket | Male | Female |
| 5 to 17 Years | 94 (11.1%) | 0 (0.0%) |
| 18 to 34 Years | 0 (0.0%) | 91 (8.1%) |
| 35 to 64 Years | 1 (0.1%) | 12 (0.8%) |
| 65 to 74 Years | 17 (4.9%) | 6 (1.4%) |
| 75 Years and over | 12 (16.2%) | 6 (3.2%) |
Technology Access in Madison Park
Computing Device Access in Madison Park
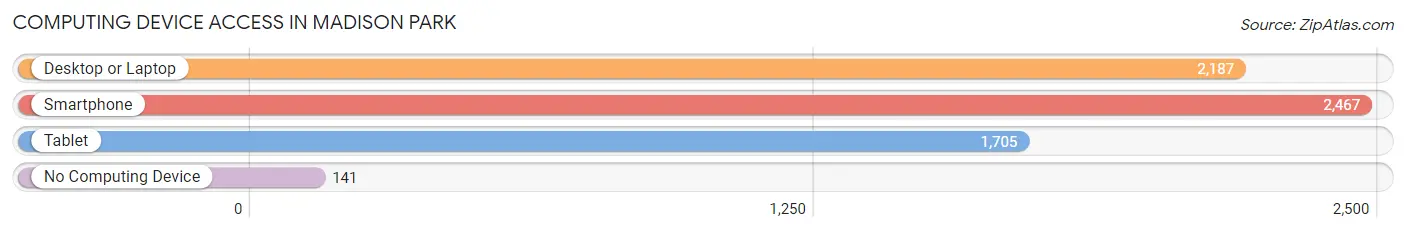
| Device Type | # Households | % Households |
| Desktop or Laptop | 2,187 | 78.6% |
| Smartphone | 2,467 | 88.7% |
| Tablet | 1,705 | 61.3% |
| No Computing Device | 141 | 5.1% |
| Total | 2,782 | 100.0% |
Internet Access in Madison Park
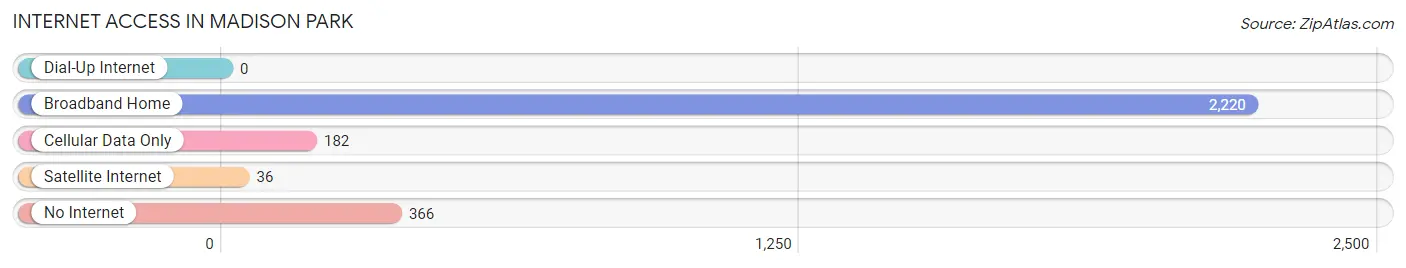
| Internet Type | # Households | % Households |
| Dial-Up Internet | 0 | 0.0% |
| Broadband Home | 2,220 | 79.8% |
| Cellular Data Only | 182 | 6.5% |
| Satellite Internet | 36 | 1.3% |
| No Internet | 366 | 13.2% |
| Total | 2,782 | 100.0% |
Madison Park Summary
Introduction
Madison Park is a small, unincorporated community located in Monmouth County, New Jersey. It is situated on the banks of the Manasquan River, just south of the borough of Brielle. The community is home to a diverse population of approximately 1,000 people, and is known for its small-town charm and close-knit community.
History
Madison Park was originally part of the Township of Wall, which was established in 1851. The area was first settled in the late 1700s by a group of Dutch settlers, who named the area “Middelburg” after their hometown in the Netherlands. The name was later changed to Madison Park in 1875, after the nearby town of Madison.
The area was primarily used for farming until the early 1900s, when the Manasquan River was dredged and the area became a popular spot for fishing and boating. In the 1920s, the area began to develop as a summer resort, with several hotels and cottages being built along the river.
In the 1950s, the area began to transition from a summer resort to a year-round community. The population grew steadily throughout the 1960s and 1970s, and the area began to develop more residential and commercial properties.
Geography
Madison Park is located in Monmouth County, New Jersey, on the banks of the Manasquan River. The community is situated just south of the borough of Brielle, and is bordered by the townships of Wall and Manasquan.
The area is characterized by its flat terrain and sandy soil, which is typical of the Jersey Shore. The Manasquan River is the main waterway in the area, and is a popular spot for fishing and boating.
Economy
The economy of Madison Park is largely based on tourism and recreation. The area is home to several marinas, which attract visitors from all over the region. The area is also popular for its fishing and boating opportunities, as well as its proximity to the Jersey Shore.
In addition to tourism and recreation, Madison Park is home to several small businesses, including restaurants, retail stores, and professional services. The area is also home to a number of small manufacturing companies, which produce a variety of products, including furniture, clothing, and electronics.
Demographics
As of the 2010 census, the population of Madison Park was 1,000. The population is largely white (90%), with small percentages of African American (4%), Hispanic (3%), and Asian (2%) residents. The median household income is $68,000, and the median age is 44.
Conclusion
Madison Park is a small, unincorporated community located in Monmouth County, New Jersey. The area is known for its small-town charm and close-knit community, and is home to a diverse population of approximately 1,000 people. The economy of Madison Park is largely based on tourism and recreation, and the area is also home to several small businesses. The population is largely white, with small percentages of African American, Hispanic, and Asian residents.
Common Questions
What is Per Capita Income in Madison Park?
Per Capita income in Madison Park is $35,824.
What is the Median Family Income in Madison Park?
Median Family Income in Madison Park is $79,912.
What is the Median Household income in Madison Park?
Median Household Income in Madison Park is $74,651.
What is Income or Wage Gap in Madison Park?
Income or Wage Gap in Madison Park is 22.7%.
Women in Madison Park earn 77.3 cents for every dollar earned by a man.
What is Family Income Deficit in Madison Park?
Family Income Deficit in Madison Park is $8,426.
Families that are below poverty line in Madison Park earn $8,426 less on average than the poverty threshold level.
What is Inequality or Gini Index in Madison Park?
Inequality or Gini Index in Madison Park is 0.46.
What is the Total Population of Madison Park?
Total Population of Madison Park is 8,291.
What is the Total Male Population of Madison Park?
Total Male Population of Madison Park is 3,744.
What is the Total Female Population of Madison Park?
Total Female Population of Madison Park is 4,547.
What is the Ratio of Males per 100 Females in Madison Park?
There are 82.34 Males per 100 Females in Madison Park.
What is the Ratio of Females per 100 Males in Madison Park?
There are 121.45 Females per 100 Males in Madison Park.
What is the Median Population Age in Madison Park?
Median Population Age in Madison Park is 33.8 Years.
What is the Average Family Size in Madison Park
Average Family Size in Madison Park is 3.5 People.
What is the Average Household Size in Madison Park
Average Household Size in Madison Park is 3.0 People.
How Large is the Labor Force in Madison Park?
There are 4,241 People in the Labor Forcein in Madison Park.
What is the Percentage of People in the Labor Force in Madison Park?
69.1% of People are in the Labor Force in Madison Park.
What is the Unemployment Rate in Madison Park?
Unemployment Rate in Madison Park is 5.0%.