Cities with the Highest Percentage of Asian Population in Ohio
RELATED REPORTS & OPTIONS
Asian
Ohio
Compare Cities
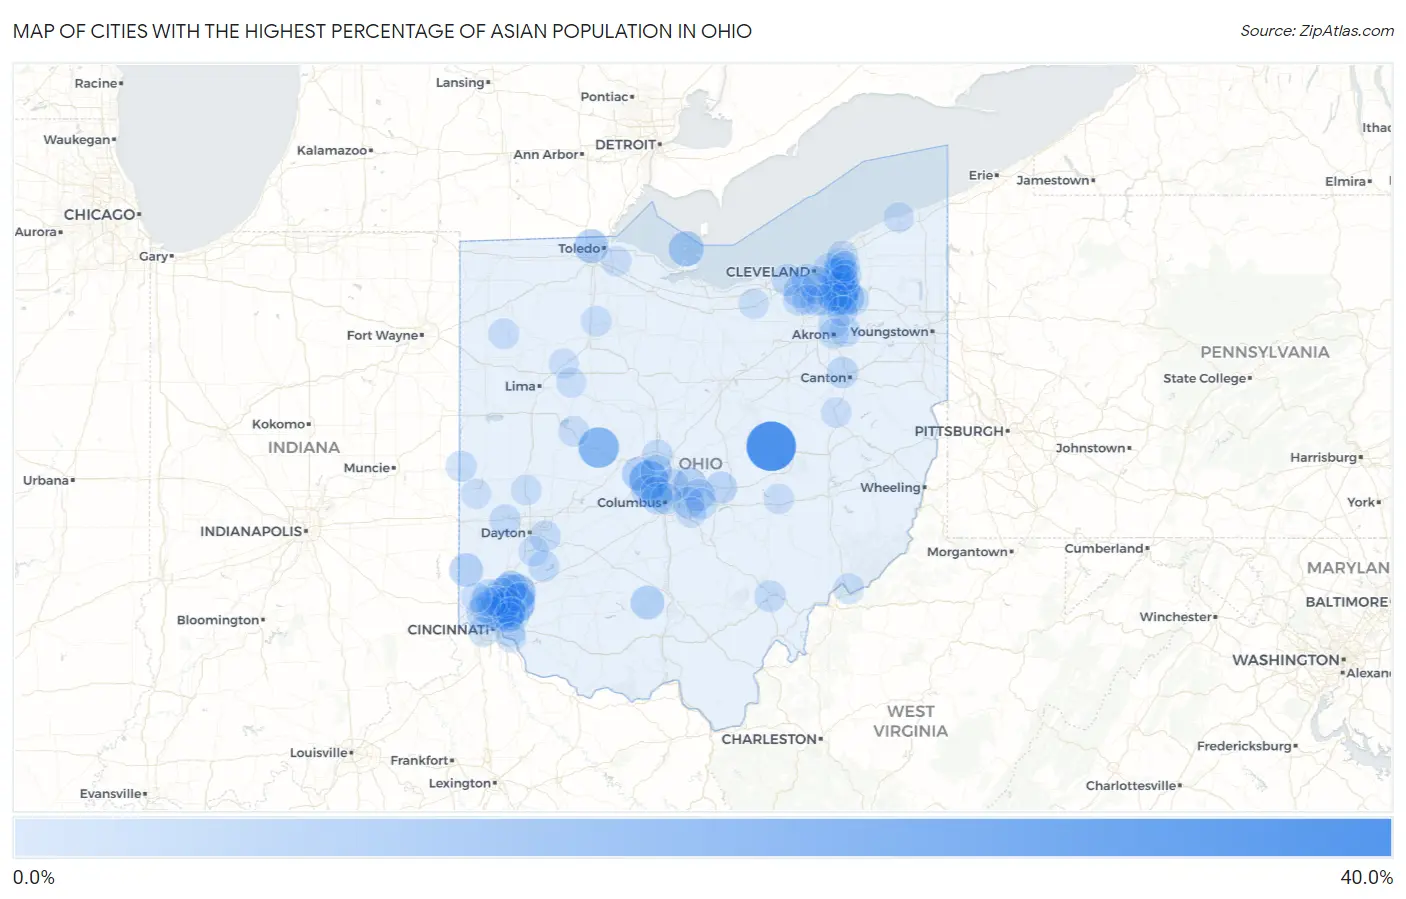
Map of Cities with the Highest Percentage of Asian Population in Ohio
0.0%
40.0%
Cities with the Highest Percentage of Asian Population in Ohio
| City | Asian | vs State | vs National | |
| 1. | Nellie | 39.1% | 2.4%(+36.7)#1 | 5.8%(+33.3)#152 |
| 2. | East Liberty | 22.0% | 2.4%(+19.6)#2 | 5.8%(+16.3)#462 |
| 3. | Sixteen Mile Stand | 20.2% | 2.4%(+17.8)#3 | 5.8%(+14.4)#521 |
| 4. | Dublin | 19.0% | 2.4%(+16.6)#4 | 5.8%(+13.3)#581 |
| 5. | Glenwillow | 17.3% | 2.4%(+14.9)#5 | 5.8%(+11.5)#684 |
| 6. | Mason | 14.8% | 2.4%(+12.4)#6 | 5.8%(+9.00)#848 |
| 7. | Reminderville | 13.5% | 2.4%(+11.1)#7 | 5.8%(+7.72)#954 |
| 8. | Solon | 13.5% | 2.4%(+11.1)#8 | 5.8%(+7.69)#957 |
| 9. | Blue Ash | 12.6% | 2.4%(+10.2)#9 | 5.8%(+6.79)#1,050 |
| 10. | Put In Bay | 12.4% | 2.4%(+9.95)#10 | 5.8%(+6.59)#1,074 |
| 11. | Pepper Pike | 12.0% | 2.4%(+9.60)#11 | 5.8%(+6.24)#1,119 |
| 12. | Wetherington | 11.1% | 2.4%(+8.67)#12 | 5.8%(+5.30)#1,255 |
| 13. | Ottawa Hills | 10.7% | 2.4%(+8.30)#13 | 5.8%(+4.93)#1,307 |
| 14. | Bourneville | 10.1% | 2.4%(+7.67)#14 | 5.8%(+4.30)#1,398 |
| 15. | New California | 9.7% | 2.4%(+7.29)#15 | 5.8%(+3.92)#1,475 |
| 16. | Four Bridges | 9.7% | 2.4%(+7.28)#16 | 5.8%(+3.91)#1,478 |
| 17. | Oxford | 9.7% | 2.4%(+7.24)#17 | 5.8%(+3.88)#1,487 |
| 18. | Middleburg Heights | 8.9% | 2.4%(+6.47)#18 | 5.8%(+3.10)#1,629 |
| 19. | Beachwood | 8.5% | 2.4%(+6.12)#19 | 5.8%(+2.76)#1,695 |
| 20. | Kenwood | 8.3% | 2.4%(+5.91)#20 | 5.8%(+2.54)#1,739 |
| 21. | New Albany | 8.2% | 2.4%(+5.82)#21 | 5.8%(+2.45)#1,757 |
| 22. | Minerva Park | 8.0% | 2.4%(+5.62)#22 | 5.8%(+2.25)#1,804 |
| 23. | Orange | 7.8% | 2.4%(+5.40)#23 | 5.8%(+2.04)#1,852 |
| 24. | Brooklyn | 7.8% | 2.4%(+5.39)#24 | 5.8%(+2.03)#1,856 |
| 25. | Twinsburg | 7.4% | 2.4%(+5.02)#25 | 5.8%(+1.66)#1,958 |
| 26. | Hilliard | 7.4% | 2.4%(+5.02)#26 | 5.8%(+1.65)#1,962 |
| 27. | White Oak | 7.3% | 2.4%(+4.91)#27 | 5.8%(+1.55)#1,987 |
| 28. | Powell | 7.3% | 2.4%(+4.86)#28 | 5.8%(+1.50)#2,001 |
| 29. | Beckett Ridge | 7.3% | 2.4%(+4.86)#29 | 5.8%(+1.49)#2,002 |
| 30. | Pataskala | 7.2% | 2.4%(+4.83)#30 | 5.8%(+1.46)#2,010 |
| 31. | Maria Stein | 7.2% | 2.4%(+4.79)#31 | 5.8%(+1.42)#2,020 |
| 32. | Macedonia | 7.0% | 2.4%(+4.64)#32 | 5.8%(+1.27)#2,071 |
| 33. | Upper Arlington | 7.0% | 2.4%(+4.63)#33 | 5.8%(+1.26)#2,073 |
| 34. | Granville | 7.0% | 2.4%(+4.59)#34 | 5.8%(+1.22)#2,092 |
| 35. | Golf Manor | 6.8% | 2.4%(+4.41)#35 | 5.8%(+1.04)#2,161 |
| 36. | The Village Of Indian Hill | 6.7% | 2.4%(+4.29)#36 | 5.8%(+0.920)#2,199 |
| 37. | Sharon Center | 6.7% | 2.4%(+4.27)#37 | 5.8%(+0.904)#2,206 |
| 38. | Westlake | 6.7% | 2.4%(+4.27)#38 | 5.8%(+0.899)#2,211 |
| 39. | Reynoldsburg | 6.4% | 2.4%(+4.02)#39 | 5.8%(+0.656)#2,292 |
| 40. | Hills And Dales | 6.3% | 2.4%(+3.89)#40 | 5.8%(+0.527)#2,344 |
| 41. | Strongsville | 6.1% | 2.4%(+3.71)#41 | 5.8%(+0.345)#2,421 |
| 42. | Mayfield Heights | 6.1% | 2.4%(+3.69)#42 | 5.8%(+0.324)#2,429 |
| 43. | Marble Cliff | 6.0% | 2.4%(+3.64)#43 | 5.8%(+0.273)#2,447 |
| 44. | Athens | 6.0% | 2.4%(+3.63)#44 | 5.8%(+0.259)#2,455 |
| 45. | Highland Heights | 5.9% | 2.4%(+3.53)#45 | 5.8%(+0.168)#2,492 |
| 46. | Broadview Heights | 5.8% | 2.4%(+3.43)#46 | 5.8%(+0.066)#2,547 |
| 47. | Columbus | 5.8% | 2.4%(+3.40)#47 | 5.8%(+0.029)#2,564 |
| 48. | Brookville | 5.8% | 2.4%(+3.39)#48 | 5.8%(+0.027)#2,565 |
| 49. | Corwin | 5.8% | 2.4%(+3.38)#49 | 5.8%(+0.011)#2,572 |
| 50. | Fairfield | 5.8% | 2.4%(+3.36)#50 | 5.8%(-0.006)#2,581 |
| 51. | Tallmadge | 5.7% | 2.4%(+3.31)#51 | 5.8%(-0.059)#2,601 |
| 52. | Finneytown | 5.6% | 2.4%(+3.22)#52 | 5.8%(-0.147)#2,653 |
| 53. | Cuyahoga Falls | 5.6% | 2.4%(+3.15)#53 | 5.8%(-0.220)#2,691 |
| 54. | Etna | 5.5% | 2.4%(+3.13)#54 | 5.8%(-0.240)#2,697 |
| 55. | Beavercreek | 5.5% | 2.4%(+3.11)#55 | 5.8%(-0.253)#2,707 |
| 56. | Amberley | 5.4% | 2.4%(+2.98)#56 | 5.8%(-0.386)#2,774 |
| 57. | Cleveland Heights | 5.3% | 2.4%(+2.94)#57 | 5.8%(-0.428)#2,810 |
| 58. | Seven Hills | 5.3% | 2.4%(+2.92)#58 | 5.8%(-0.448)#2,825 |
| 59. | Delshire | 5.3% | 2.4%(+2.88)#59 | 5.8%(-0.486)#2,844 |
| 60. | Willoughby Hills | 5.3% | 2.4%(+2.87)#60 | 5.8%(-0.498)#2,846 |
| 61. | Union City | 5.2% | 2.4%(+2.83)#61 | 5.8%(-0.537)#2,863 |
| 62. | Aurora | 5.2% | 2.4%(+2.78)#62 | 5.8%(-0.583)#2,893 |
| 63. | Delaware | 5.2% | 2.4%(+2.77)#63 | 5.8%(-0.602)#2,904 |
| 64. | Brecksville | 5.1% | 2.4%(+2.65)#64 | 5.8%(-0.720)#2,963 |
| 65. | Northbrook | 5.0% | 2.4%(+2.59)#65 | 5.8%(-0.772)#2,986 |
| 66. | Evendale | 5.0% | 2.4%(+2.55)#66 | 5.8%(-0.816)#3,007 |
| 67. | Sharonville | 4.9% | 2.4%(+2.51)#67 | 5.8%(-0.852)#3,030 |
| 68. | Melrose | 4.9% | 2.4%(+2.49)#68 | 5.8%(-0.876)#3,044 |
| 69. | Hunting Valley | 4.9% | 2.4%(+2.47)#69 | 5.8%(-0.898)#3,058 |
| 70. | Reno | 4.9% | 2.4%(+2.46)#70 | 5.8%(-0.908)#3,064 |
| 71. | Huntsville | 4.8% | 2.4%(+2.43)#71 | 5.8%(-0.941)#3,079 |
| 72. | Pickerington | 4.6% | 2.4%(+2.21)#72 | 5.8%(-1.15)#3,214 |
| 73. | Bairdstown | 4.6% | 2.4%(+2.18)#73 | 5.8%(-1.19)#3,237 |
| 74. | Troy | 4.6% | 2.4%(+2.16)#74 | 5.8%(-1.21)#3,258 |
| 75. | Northfield | 4.5% | 2.4%(+2.11)#75 | 5.8%(-1.26)#3,294 |
| 76. | Akron | 4.5% | 2.4%(+2.10)#76 | 5.8%(-1.26)#3,295 |
| 77. | Parral | 4.5% | 2.4%(+2.08)#77 | 5.8%(-1.29)#3,320 |
| 78. | Centerville | 4.5% | 2.4%(+2.06)#78 | 5.8%(-1.31)#3,337 |
| 79. | North Royalton | 4.5% | 2.4%(+2.04)#79 | 5.8%(-1.32)#3,350 |
| 80. | Gates Mills | 4.4% | 2.4%(+2.04)#80 | 5.8%(-1.32)#3,353 |
| 81. | Sherwood | 4.4% | 2.4%(+2.00)#81 | 5.8%(-1.37)#3,373 |
| 82. | Springdale | 4.4% | 2.4%(+1.97)#82 | 5.8%(-1.40)#3,389 |
| 83. | Hudson | 4.3% | 2.4%(+1.88)#83 | 5.8%(-1.49)#3,456 |
| 84. | Millbury | 4.2% | 2.4%(+1.84)#84 | 5.8%(-1.53)#3,502 |
| 85. | North Zanesville | 4.2% | 2.4%(+1.81)#85 | 5.8%(-1.56)#3,521 |
| 86. | Forest Park | 4.2% | 2.4%(+1.77)#86 | 5.8%(-1.59)#3,552 |
| 87. | Pleasant Run | 4.1% | 2.4%(+1.70)#87 | 5.8%(-1.66)#3,607 |
| 88. | Landen | 4.0% | 2.4%(+1.64)#88 | 5.8%(-1.72)#3,652 |
| 89. | Oberlin | 4.0% | 2.4%(+1.63)#89 | 5.8%(-1.73)#3,659 |
| 90. | Cuyahoga Heights | 4.0% | 2.4%(+1.58)#90 | 5.8%(-1.79)#3,704 |
| 91. | Geneva On The Lake | 4.0% | 2.4%(+1.56)#91 | 5.8%(-1.81)#3,727 |
| 92. | Madeira | 3.9% | 2.4%(+1.51)#92 | 5.8%(-1.86)#3,768 |
| 93. | Bluffton | 3.9% | 2.4%(+1.49)#93 | 5.8%(-1.87)#3,785 |
| 94. | Concorde Hills | 3.9% | 2.4%(+1.47)#94 | 5.8%(-1.90)#3,812 |
| 95. | Guilford Lake | 3.9% | 2.4%(+1.46)#95 | 5.8%(-1.90)#3,815 |
| 96. | Ross | 3.9% | 2.4%(+1.46)#96 | 5.8%(-1.91)#3,821 |
| 97. | Ada | 3.8% | 2.4%(+1.41)#97 | 5.8%(-1.96)#3,858 |
| 98. | Wayne Lakes | 3.7% | 2.4%(+1.34)#98 | 5.8%(-2.02)#3,906 |
| 99. | Coldstream | 3.7% | 2.4%(+1.26)#99 | 5.8%(-2.11)#3,980 |
| 100. | Moreland Hills | 3.6% | 2.4%(+1.20)#100 | 5.8%(-2.17)#4,037 |
Common Questions
What are the Top 10 Cities with the Highest Percentage of Asian Population in Ohio?
Top 10 Cities with the Highest Percentage of Asian Population in Ohio are:
#1
39.1%
#2
22.0%
#3
20.2%
#4
19.0%
#5
17.3%
#6
14.8%
#7
13.5%
#8
13.5%
#9
12.6%
#10
12.4%
What city has the Highest Percentage of Asian Population in Ohio?
Nellie has the Highest Percentage of Asian Population in Ohio with 39.1%.
What is the Percentage of Asian Population in the State of Ohio?
Percentage of Asian Population in Ohio is 2.4%.
What is the Percentage of Asian Population in the United States?
Percentage of Asian Population in the United States is 5.8%.