New Milford borough, NJ Map & Demographics
New Milford borough Overview
$51,889
PER CAPITA INCOME
$136,336
AVG FAMILY INCOME
$107,976
AVG HOUSEHOLD INCOME
9.5%
WAGE / INCOME GAP [ % ]
90.5¢/ $1
WAGE / INCOME GAP [ $ ]
0.42
INEQUALITY / GINI INDEX
16,888
TOTAL POPULATION
8,226
MALE POPULATION
8,662
FEMALE POPULATION
94.97
MALES / 100 FEMALES
105.30
FEMALES / 100 MALES
40.3
MEDIAN AGE
3.4
AVG FAMILY SIZE
2.7
AVG HOUSEHOLD SIZE
9,599
LABOR FORCE [ PEOPLE ]
72.3%
PERCENT IN LABOR FORCE
6.1%
UNEMPLOYMENT RATE
Income in New Milford borough
Income Overview in New Milford borough
Per Capita Income in New Milford borough is $51,889, while median incomes of families and households are $136,336 and $107,976 respectively.
| Characteristic | Number | Measure |
| Per Capita Income | 16,888 | $51,889 |
| Median Family Income | 4,313 | $136,336 |
| Mean Family Income | 4,313 | $165,658 |
| Median Household Income | 6,170 | $107,976 |
| Mean Household Income | 6,170 | $139,521 |
| Income Deficit | 4,313 | $0 |
| Wage / Income Gap (%) | 16,888 | 9.52% |
| Wage / Income Gap ($) | 16,888 | 90.48¢ per $1 |
| Gini / Inequality Index | 16,888 | 0.42 |
Earnings by Sex in New Milford borough
Average Earnings in New Milford borough are $60,903, $64,063 for men and $57,965 for women, a difference of 9.5%.
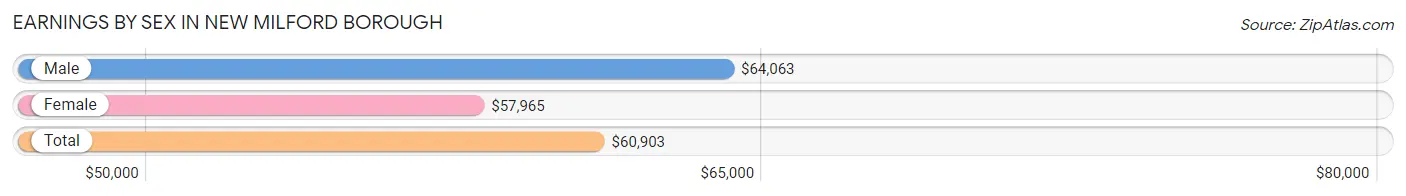
| Sex | Number | Average Earnings |
| Male | 5,085 (52.6%) | $64,063 |
| Female | 4,581 (47.4%) | $57,965 |
| Total | 9,666 (100.0%) | $60,903 |
Earnings by Sex by Income Bracket in New Milford borough
The most common earnings brackets in New Milford borough are $100,000+ for men (1,468 | 28.9%) and $100,000+ for women (1,124 | 24.5%).
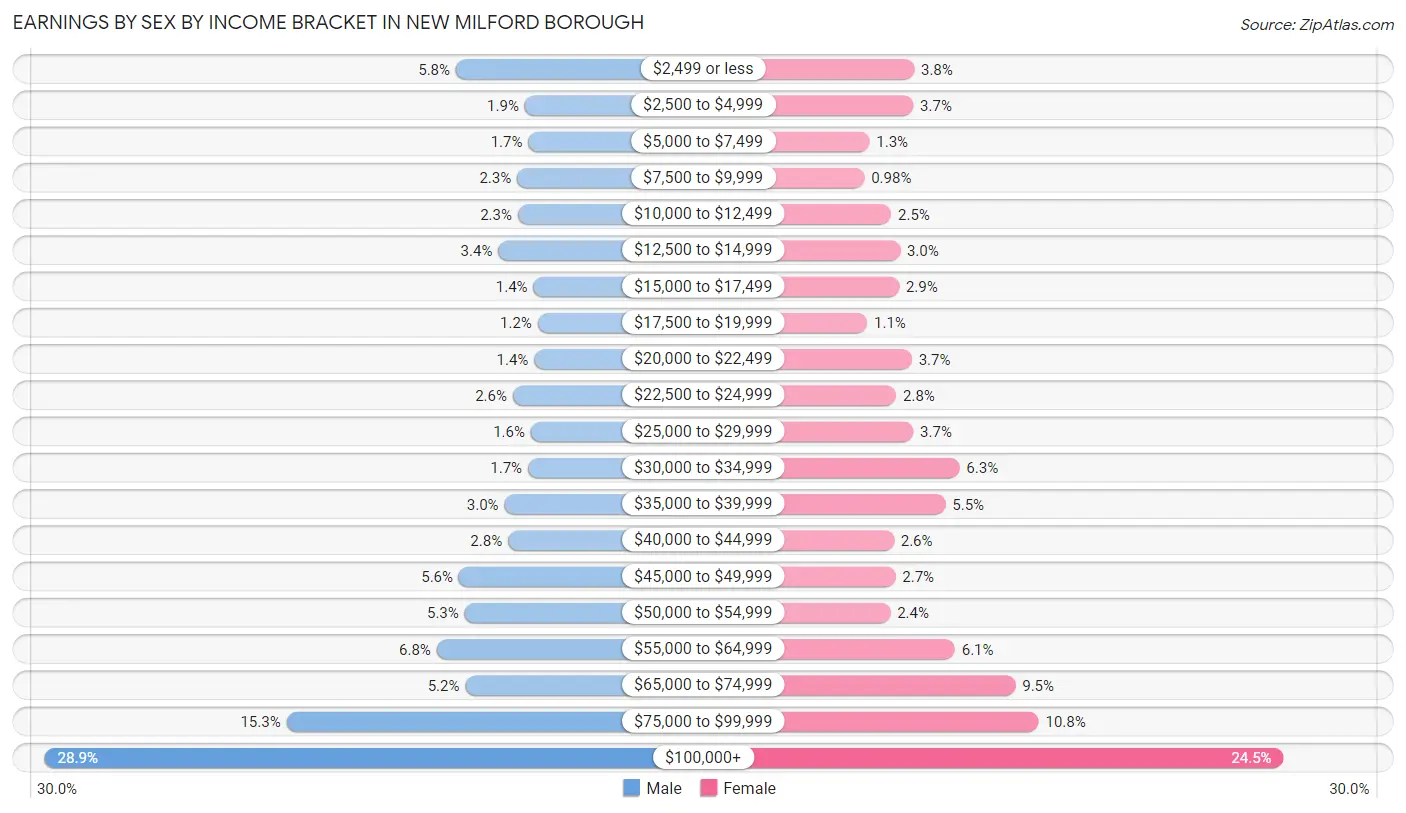
| Income | Male | Female |
| $2,499 or less | 293 (5.8%) | 173 (3.8%) |
| $2,500 to $4,999 | 96 (1.9%) | 171 (3.7%) |
| $5,000 to $7,499 | 86 (1.7%) | 58 (1.3%) |
| $7,500 to $9,999 | 118 (2.3%) | 45 (1.0%) |
| $10,000 to $12,499 | 116 (2.3%) | 114 (2.5%) |
| $12,500 to $14,999 | 172 (3.4%) | 137 (3.0%) |
| $15,000 to $17,499 | 71 (1.4%) | 134 (2.9%) |
| $17,500 to $19,999 | 59 (1.2%) | 52 (1.1%) |
| $20,000 to $22,499 | 69 (1.4%) | 167 (3.6%) |
| $22,500 to $24,999 | 130 (2.6%) | 127 (2.8%) |
| $25,000 to $29,999 | 79 (1.5%) | 171 (3.7%) |
| $30,000 to $34,999 | 87 (1.7%) | 290 (6.3%) |
| $35,000 to $39,999 | 154 (3.0%) | 254 (5.5%) |
| $40,000 to $44,999 | 144 (2.8%) | 121 (2.6%) |
| $45,000 to $49,999 | 284 (5.6%) | 125 (2.7%) |
| $50,000 to $54,999 | 268 (5.3%) | 112 (2.4%) |
| $55,000 to $64,999 | 348 (6.8%) | 278 (6.1%) |
| $65,000 to $74,999 | 266 (5.2%) | 434 (9.5%) |
| $75,000 to $99,999 | 777 (15.3%) | 494 (10.8%) |
| $100,000+ | 1,468 (28.9%) | 1,124 (24.5%) |
| Total | 5,085 (100.0%) | 4,581 (100.0%) |
Earnings by Sex by Educational Attainment in New Milford borough
Average earnings in New Milford borough are $71,627 for men and $63,777 for women, a difference of 11.0%. Men with an educational attainment of graduate degree enjoy the highest average annual earnings of $92,478, while those with high school diploma education earn the least with $47,174. Women with an educational attainment of graduate degree earn the most with the average annual earnings of $88,777, while those with high school diploma education have the smallest earnings of $39,615.
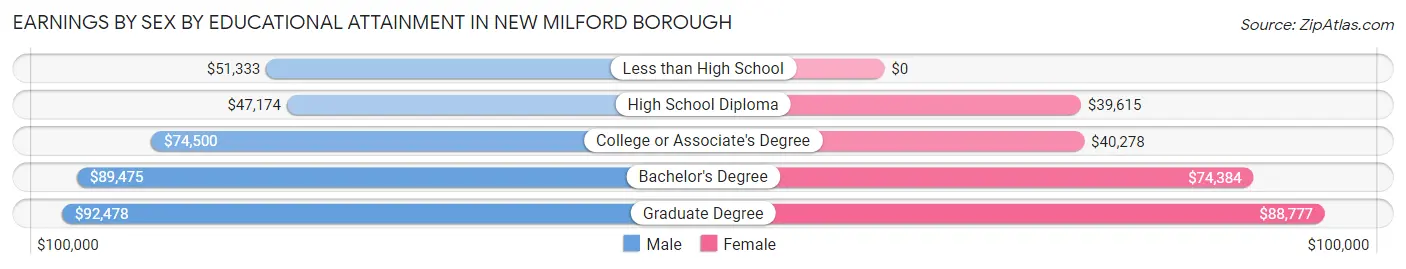
| Educational Attainment | Male Income | Female Income |
| Less than High School | $51,333 | $0 |
| High School Diploma | $47,174 | $39,615 |
| College or Associate's Degree | $74,500 | $40,278 |
| Bachelor's Degree | $89,475 | $74,384 |
| Graduate Degree | $92,478 | $88,777 |
| Total | $71,627 | $63,777 |
Family Income in New Milford borough
Family Income Brackets in New Milford borough
According to the New Milford borough family income data, there are 1,384 families falling into the $200,000+ income range, which is the most common income bracket and makes up 32.1% of all families. Conversely, the less than $10,000 income bracket is the least frequent group with only 9 families (0.2%) belonging to this category.
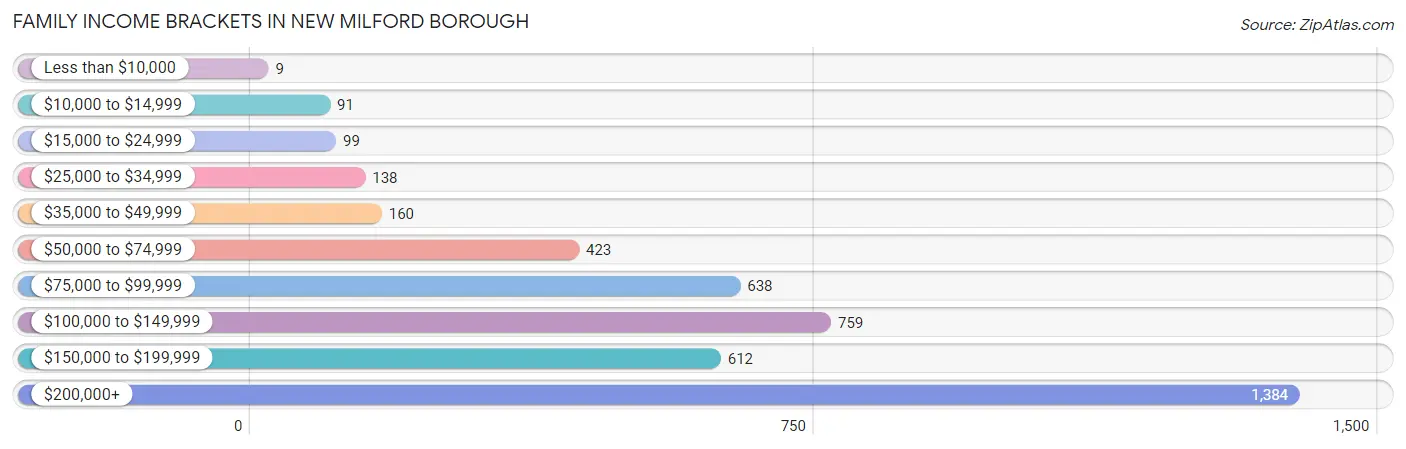
| Income Bracket | # Families | % Families |
| Less than $10,000 | 9 | 0.2% |
| $10,000 to $14,999 | 91 | 2.1% |
| $15,000 to $24,999 | 99 | 2.3% |
| $25,000 to $34,999 | 138 | 3.2% |
| $35,000 to $49,999 | 160 | 3.7% |
| $50,000 to $74,999 | 423 | 9.8% |
| $75,000 to $99,999 | 638 | 14.8% |
| $100,000 to $149,999 | 759 | 17.6% |
| $150,000 to $199,999 | 612 | 14.2% |
| $200,000+ | 1,384 | 32.1% |
Family Income by Famaliy Size in New Milford borough
6-person families (125 | 2.9%) account for the highest median family income in New Milford borough with $250,001 per family, while 3-person families (936 | 21.7%) have the highest median income of $56,333 per family member.
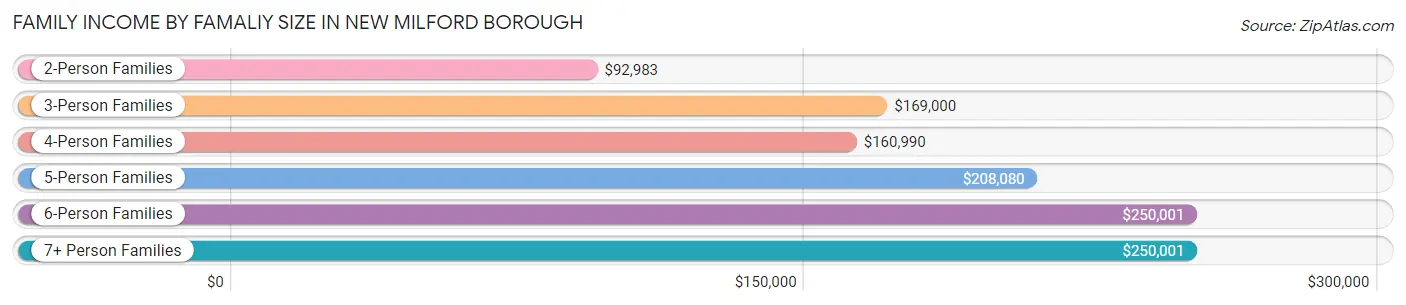
| Income Bracket | # Families | Median Income |
| 2-Person Families | 1,643 (38.1%) | $92,983 |
| 3-Person Families | 936 (21.7%) | $169,000 |
| 4-Person Families | 1,155 (26.8%) | $160,990 |
| 5-Person Families | 391 (9.1%) | $208,080 |
| 6-Person Families | 125 (2.9%) | $250,001 |
| 7+ Person Families | 63 (1.5%) | $250,001 |
| Total | 4,313 (100.0%) | $136,336 |
Family Income by Number of Earners in New Milford borough
The median family income in New Milford borough is $136,336, with families comprising 3+ earners (718) having the highest median family income of $229,615, while families with no earners (416) have the lowest median family income of $50,625, accounting for 16.7% and 9.7% of families, respectively.
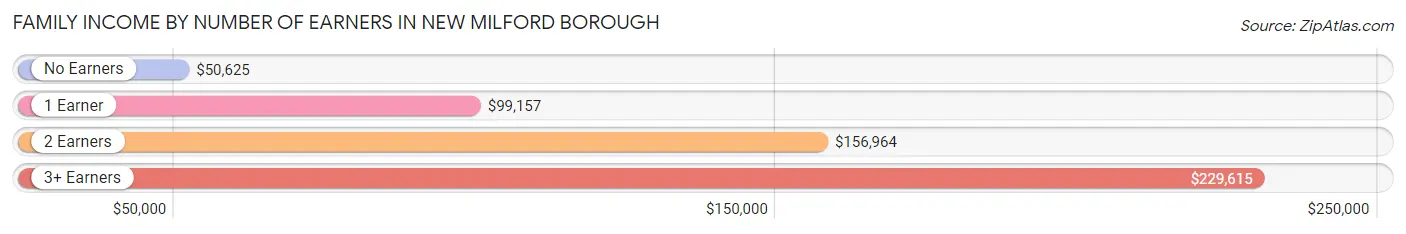
| Number of Earners | # Families | Median Income |
| No Earners | 416 (9.7%) | $50,625 |
| 1 Earner | 993 (23.0%) | $99,157 |
| 2 Earners | 2,186 (50.7%) | $156,964 |
| 3+ Earners | 718 (16.7%) | $229,615 |
| Total | 4,313 (100.0%) | $136,336 |
Household Income in New Milford borough
Household Income Brackets in New Milford borough
With 1,468 households falling in the category, the $200,000+ income range is the most frequent in New Milford borough, accounting for 23.8% of all households. In contrast, only 111 households (1.8%) fall into the less than $10,000 income bracket, making it the least populous group.
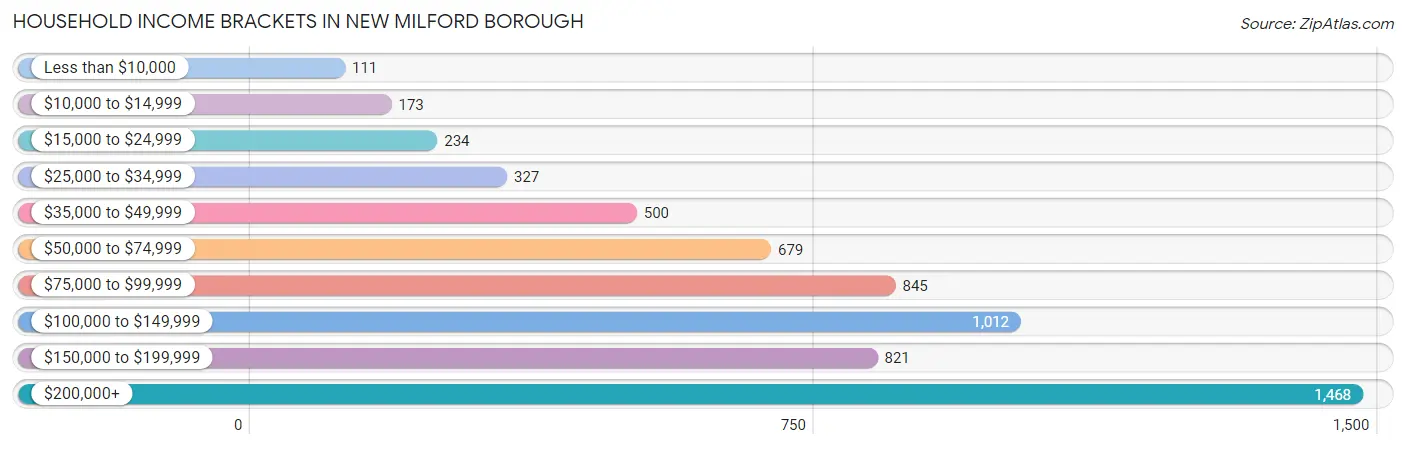
| Income Bracket | # Households | % Households |
| Less than $10,000 | 111 | 1.8% |
| $10,000 to $14,999 | 173 | 2.8% |
| $15,000 to $24,999 | 234 | 3.8% |
| $25,000 to $34,999 | 327 | 5.3% |
| $35,000 to $49,999 | 500 | 8.1% |
| $50,000 to $74,999 | 679 | 11.0% |
| $75,000 to $99,999 | 845 | 13.7% |
| $100,000 to $149,999 | 1,012 | 16.4% |
| $150,000 to $199,999 | 821 | 13.3% |
| $200,000+ | 1,468 | 23.8% |
Household Income by Householder Age in New Milford borough
The median household income in New Milford borough is $107,976, with the highest median household income of $127,518 found in the 45 to 64 years age bracket for the primary householder. A total of 2,597 households (42.1%) fall into this category. Meanwhile, the 15 to 24 years age bracket for the primary householder has the lowest median household income of $0, with 32 households (0.5%) in this group.
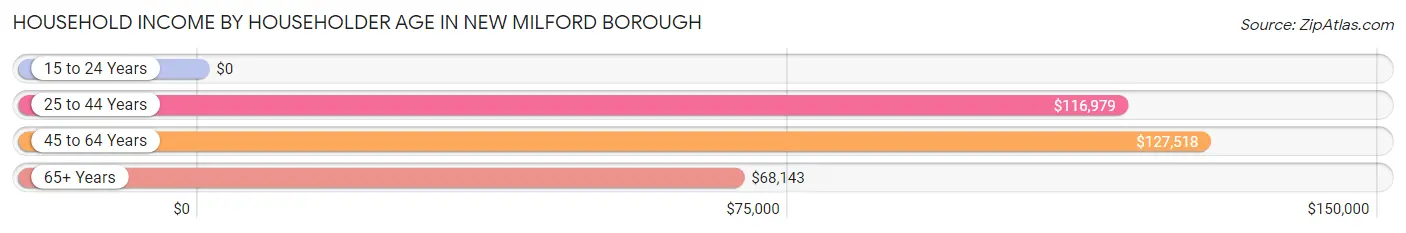
| Income Bracket | # Households | Median Income |
| 15 to 24 Years | 32 (0.5%) | $0 |
| 25 to 44 Years | 1,963 (31.8%) | $116,979 |
| 45 to 64 Years | 2,597 (42.1%) | $127,518 |
| 65+ Years | 1,578 (25.6%) | $68,143 |
| Total | 6,170 (100.0%) | $107,976 |
Poverty in New Milford borough
Income Below Poverty by Sex and Age in New Milford borough
With 3.9% poverty level for males and 5.1% for females among the residents of New Milford borough, 75 year old and over males and 16 and 17 year old females are the most vulnerable to poverty, with 85 males (16.5%) and 68 females (24.8%) in their respective age groups living below the poverty level.
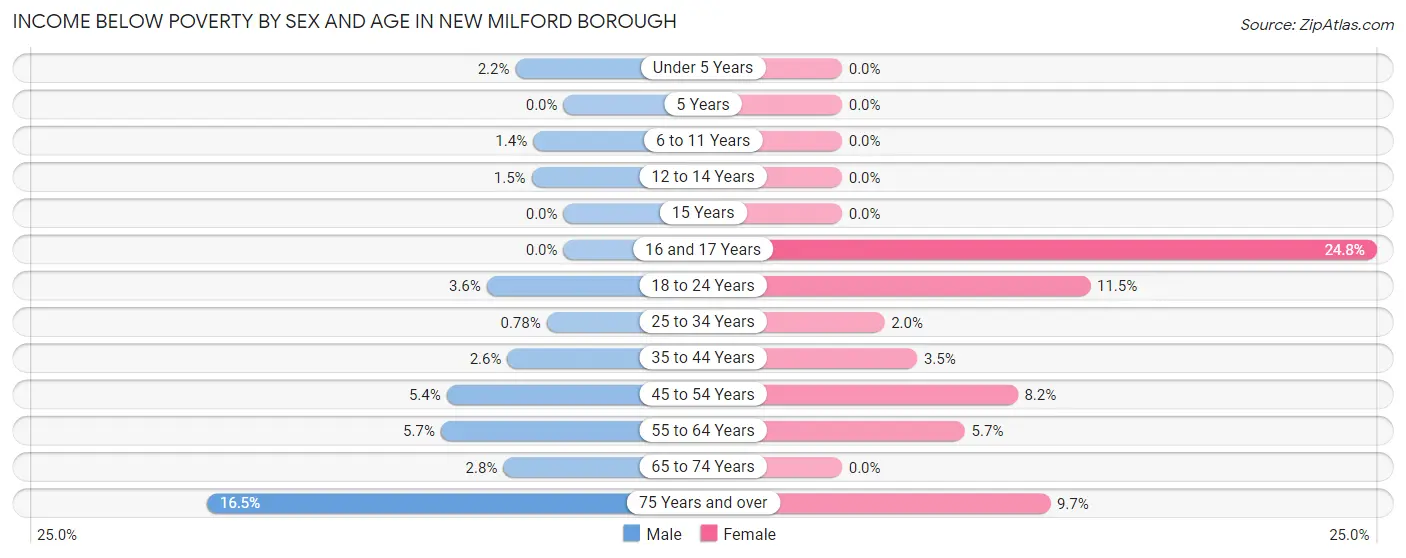
| Age Bracket | Male | Female |
| Under 5 Years | 13 (2.2%) | 0 (0.0%) |
| 5 Years | 0 (0.0%) | 0 (0.0%) |
| 6 to 11 Years | 11 (1.4%) | 0 (0.0%) |
| 12 to 14 Years | 6 (1.5%) | 0 (0.0%) |
| 15 Years | 0 (0.0%) | 0 (0.0%) |
| 16 and 17 Years | 0 (0.0%) | 68 (24.8%) |
| 18 to 24 Years | 18 (3.6%) | 72 (11.5%) |
| 25 to 34 Years | 8 (0.8%) | 19 (2.0%) |
| 35 to 44 Years | 34 (2.6%) | 40 (3.5%) |
| 45 to 54 Years | 63 (5.4%) | 100 (8.2%) |
| 55 to 64 Years | 61 (5.7%) | 68 (5.7%) |
| 65 to 74 Years | 18 (2.8%) | 0 (0.0%) |
| 75 Years and over | 85 (16.5%) | 66 (9.7%) |
| Total | 317 (3.9%) | 433 (5.1%) |
Income Above Poverty by Sex and Age in New Milford borough
According to the poverty statistics in New Milford borough, males aged 5 years and females aged under 5 years are the age groups that are most secure financially, with 100.0% of males and 100.0% of females in these age groups living above the poverty line.
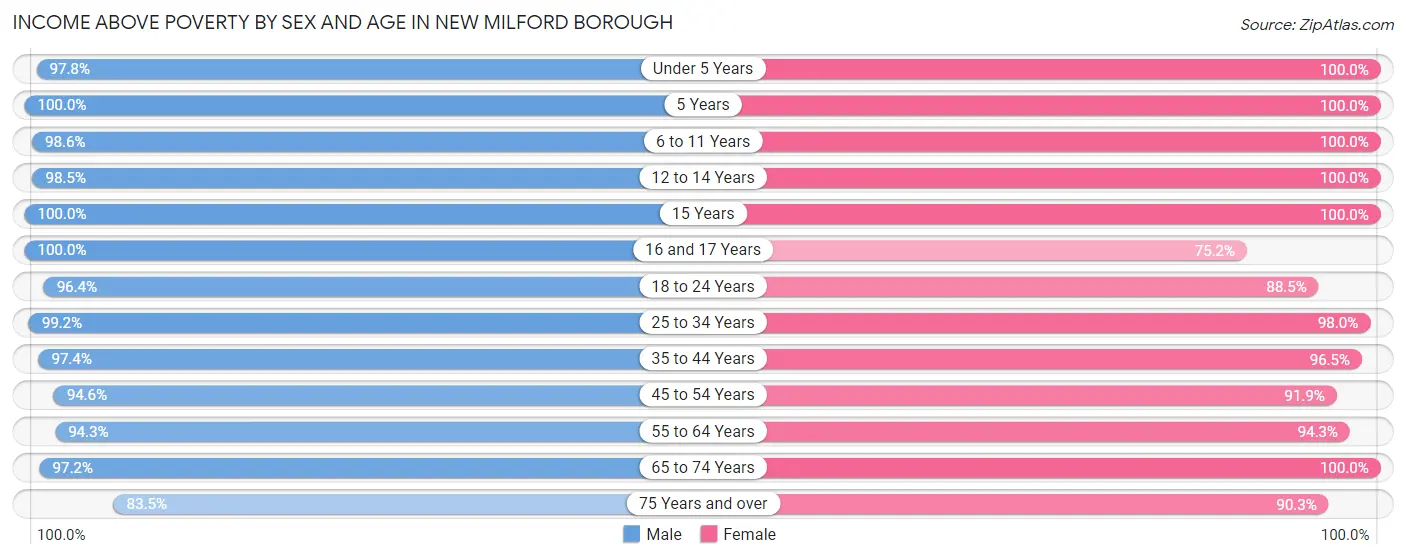
| Age Bracket | Male | Female |
| Under 5 Years | 571 (97.8%) | 687 (100.0%) |
| 5 Years | 20 (100.0%) | 124 (100.0%) |
| 6 to 11 Years | 770 (98.6%) | 528 (100.0%) |
| 12 to 14 Years | 400 (98.5%) | 264 (100.0%) |
| 15 Years | 76 (100.0%) | 141 (100.0%) |
| 16 and 17 Years | 57 (100.0%) | 206 (75.2%) |
| 18 to 24 Years | 488 (96.4%) | 553 (88.5%) |
| 25 to 34 Years | 1,021 (99.2%) | 947 (98.0%) |
| 35 to 44 Years | 1,272 (97.4%) | 1,105 (96.5%) |
| 45 to 54 Years | 1,100 (94.6%) | 1,127 (91.8%) |
| 55 to 64 Years | 1,011 (94.3%) | 1,125 (94.3%) |
| 65 to 74 Years | 628 (97.2%) | 685 (100.0%) |
| 75 Years and over | 429 (83.5%) | 617 (90.3%) |
| Total | 7,843 (96.1%) | 8,109 (94.9%) |
Income Below Poverty Among Married-Couple Families in New Milford borough
The poverty statistics for married-couple families in New Milford borough show that 3.7% or 132 of the total 3,568 families live below the poverty line. Families with no children have the highest poverty rate of 6.3%, comprising of 114 families. On the other hand, families with 5 or more children have the lowest poverty rate of 0.0%, which includes 0 families.
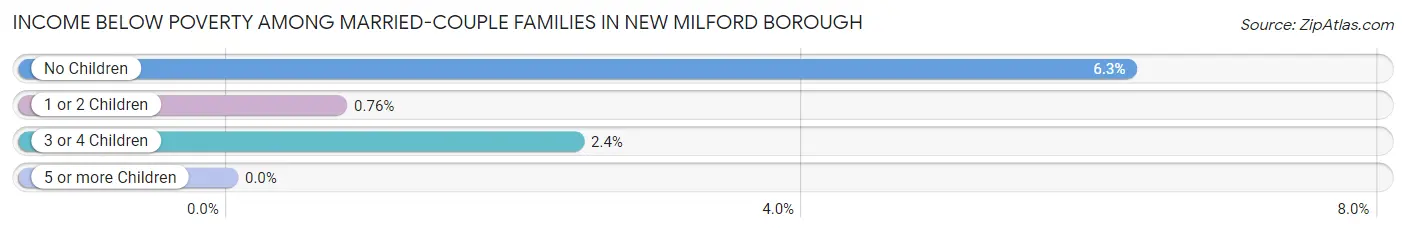
| Children | Above Poverty | Below Poverty |
| No Children | 1,708 (93.7%) | 114 (6.3%) |
| 1 or 2 Children | 1,432 (99.2%) | 11 (0.8%) |
| 3 or 4 Children | 284 (97.6%) | 7 (2.4%) |
| 5 or more Children | 12 (100.0%) | 0 (0.0%) |
| Total | 3,436 (96.3%) | 132 (3.7%) |
Income Below Poverty Among Single-Parent Households in New Milford borough
According to the poverty data in New Milford borough, 5.4% or 8 single-father households and 9.9% or 59 single-mother households are living below the poverty line. Among single-father households, those with no children have the highest poverty rate, with 8 households (6.0%) experiencing poverty. Likewise, among single-mother households, those with 1 or 2 children have the highest poverty rate, with 59 households (18.8%) falling below the poverty line.
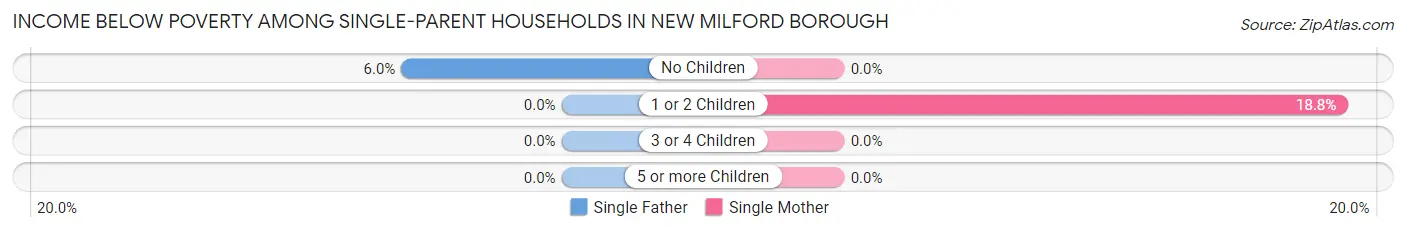
| Children | Single Father | Single Mother |
| No Children | 8 (6.0%) | 0 (0.0%) |
| 1 or 2 Children | 0 (0.0%) | 59 (18.8%) |
| 3 or 4 Children | 0 (0.0%) | 0 (0.0%) |
| 5 or more Children | 0 (0.0%) | 0 (0.0%) |
| Total | 8 (5.4%) | 59 (9.9%) |
Income Below Poverty Among Married-Couple vs Single-Parent Households in New Milford borough
The poverty data for New Milford borough shows that 132 of the married-couple family households (3.7%) and 67 of the single-parent households (9.0%) are living below the poverty level. Within the married-couple family households, those with no children have the highest poverty rate, with 114 households (6.3%) falling below the poverty line. Among the single-parent households, those with 1 or 2 children have the highest poverty rate, with 59 household (18.0%) living below poverty.
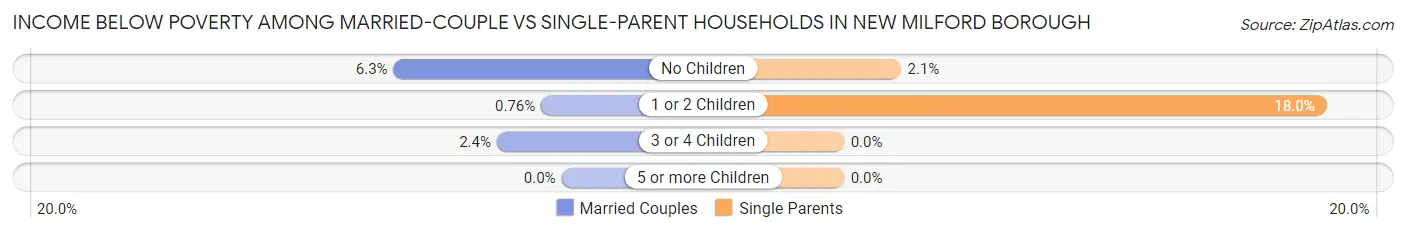
| Children | Married-Couple Families | Single-Parent Households |
| No Children | 114 (6.3%) | 8 (2.1%) |
| 1 or 2 Children | 11 (0.8%) | 59 (18.0%) |
| 3 or 4 Children | 7 (2.4%) | 0 (0.0%) |
| 5 or more Children | 0 (0.0%) | 0 (0.0%) |
| Total | 132 (3.7%) | 67 (9.0%) |
Race in New Milford borough
The most populous races in New Milford borough are White / Caucasian (9,597 | 56.8%), Asian (3,410 | 20.2%), and Hispanic or Latino (3,321 | 19.7%).
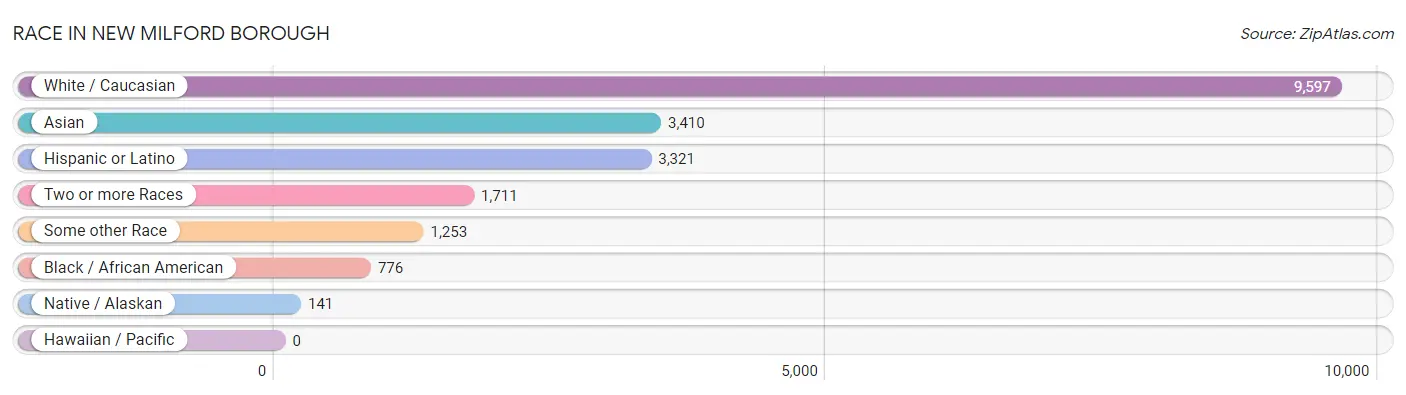
| Race | # Population | % Population |
| Asian | 3,410 | 20.2% |
| Black / African American | 776 | 4.6% |
| Hawaiian / Pacific | 0 | 0.0% |
| Hispanic or Latino | 3,321 | 19.7% |
| Native / Alaskan | 141 | 0.8% |
| White / Caucasian | 9,597 | 56.8% |
| Two or more Races | 1,711 | 10.1% |
| Some other Race | 1,253 | 7.4% |
| Total | 16,888 | 100.0% |
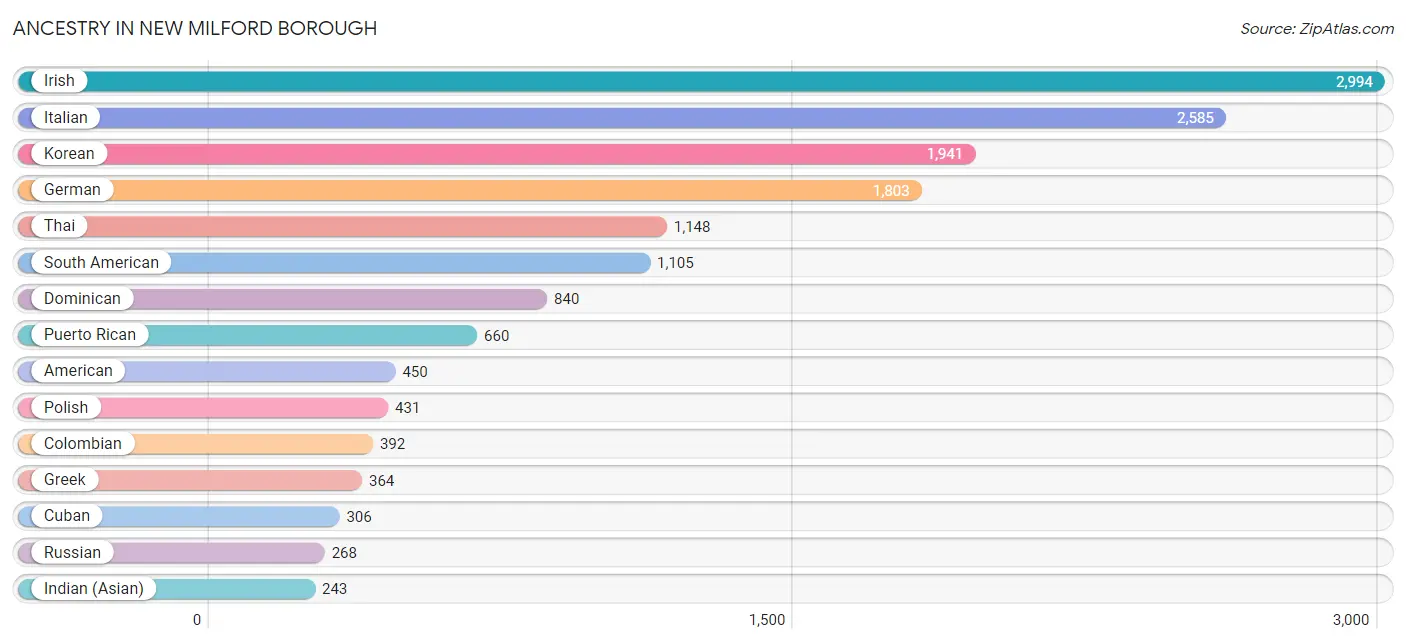
Ancestry in New Milford borough
The most populous ancestries reported in New Milford borough are Irish (2,994 | 17.7%), Italian (2,585 | 15.3%), Korean (1,941 | 11.5%), German (1,803 | 10.7%), and Thai (1,148 | 6.8%), together accounting for 62.0% of all New Milford borough residents.
| Ancestry | # Population | % Population |
| African | 47 | 0.3% |
| American | 450 | 2.7% |
| Arab | 111 | 0.7% |
| Armenian | 242 | 1.4% |
| Assyrian / Chaldean / Syriac | 93 | 0.5% |
| Austrian | 35 | 0.2% |
| Barbadian | 5 | 0.0% |
| Bhutanese | 52 | 0.3% |
| Blackfeet | 50 | 0.3% |
| Brazilian | 71 | 0.4% |
| British | 22 | 0.1% |
| Burmese | 166 | 1.0% |
| Central American | 142 | 0.8% |
| Cherokee | 58 | 0.3% |
| Chilean | 48 | 0.3% |
| Colombian | 392 | 2.3% |
| Croatian | 13 | 0.1% |
| Cuban | 306 | 1.8% |
| Czech | 36 | 0.2% |
| Czechoslovakian | 21 | 0.1% |
| Danish | 33 | 0.2% |
| Delaware | 22 | 0.1% |
| Dominican | 840 | 5.0% |
| Dutch | 77 | 0.5% |
| Eastern European | 127 | 0.7% |
| Ecuadorian | 204 | 1.2% |
| Egyptian | 47 | 0.3% |
| English | 229 | 1.4% |
| Ethiopian | 21 | 0.1% |
| European | 218 | 1.3% |
| Finnish | 51 | 0.3% |
| French | 49 | 0.3% |
| French Canadian | 13 | 0.1% |
| German | 1,803 | 10.7% |
| Greek | 364 | 2.2% |
| Guatemalan | 25 | 0.2% |
| Guyanese | 96 | 0.6% |
| Haitian | 13 | 0.1% |
| Honduran | 25 | 0.2% |
| Hungarian | 67 | 0.4% |
| Indian (Asian) | 243 | 1.4% |
| Irish | 2,994 | 17.7% |
| Israeli | 93 | 0.5% |
| Italian | 2,585 | 15.3% |
| Jamaican | 104 | 0.6% |
| Japanese | 27 | 0.2% |
| Korean | 1,941 | 11.5% |
| Laotian | 41 | 0.2% |
| Latvian | 10 | 0.1% |
| Lebanese | 17 | 0.1% |
| Lithuanian | 30 | 0.2% |
| Mexican | 140 | 0.8% |
| Mexican American Indian | 21 | 0.1% |
| Moroccan | 35 | 0.2% |
| Nigerian | 58 | 0.3% |
| Northern European | 15 | 0.1% |
| Norwegian | 71 | 0.4% |
| Palestinian | 12 | 0.1% |
| Peruvian | 218 | 1.3% |
| Polish | 431 | 2.5% |
| Portuguese | 52 | 0.3% |
| Puerto Rican | 660 | 3.9% |
| Romanian | 10 | 0.1% |
| Russian | 268 | 1.6% |
| Salvadoran | 37 | 0.2% |
| Scandinavian | 14 | 0.1% |
| Scottish | 199 | 1.2% |
| Slovak | 23 | 0.1% |
| South American | 1,105 | 6.5% |
| South American Indian | 73 | 0.4% |
| Spaniard | 55 | 0.3% |
| Spanish | 29 | 0.2% |
| Sri Lankan | 149 | 0.9% |
| Subsaharan African | 165 | 1.0% |
| Swedish | 135 | 0.8% |
| Swiss | 38 | 0.2% |
| Thai | 1,148 | 6.8% |
| Trinidadian and Tobagonian | 22 | 0.1% |
| Turkish | 195 | 1.1% |
| Ukrainian | 179 | 1.1% |
| Uruguayan | 100 | 0.6% |
| Venezuelan | 143 | 0.9% |
| Vietnamese | 8 | 0.1% |
| Welsh | 15 | 0.1% |
| West Indian | 20 | 0.1% |
| Yugoslavian | 46 | 0.3% | View All 86 Rows |
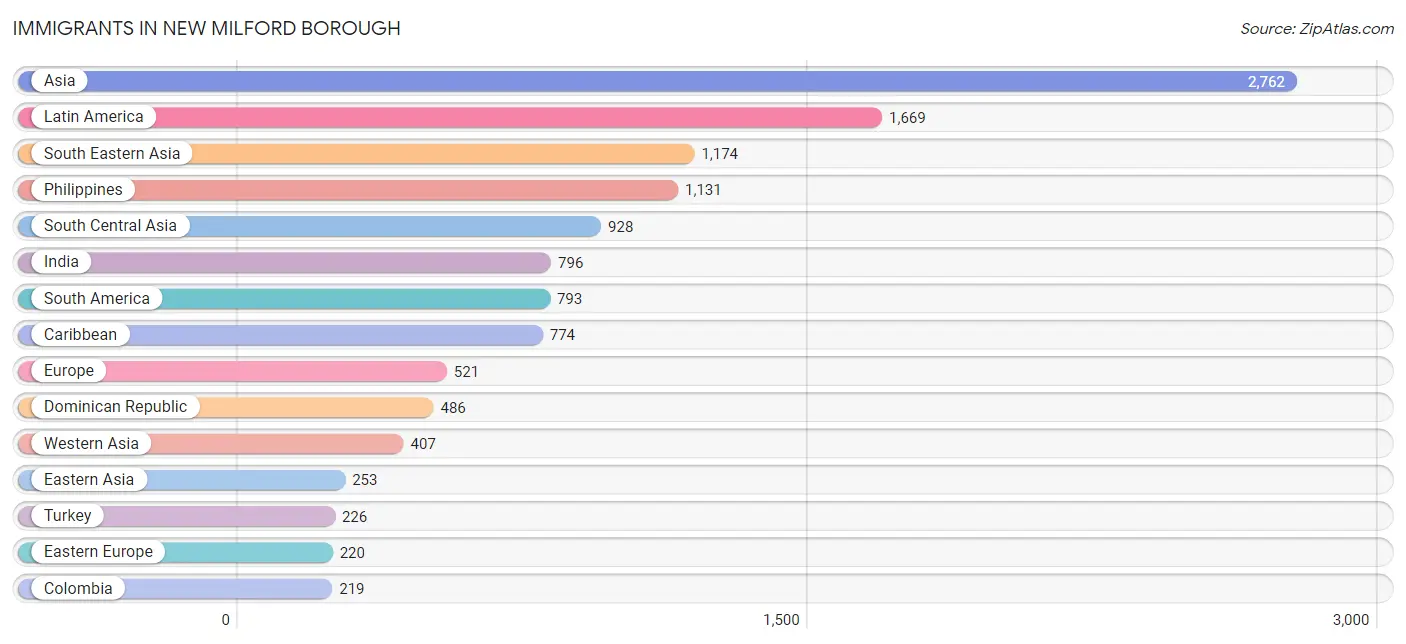
Immigrants in New Milford borough
The most numerous immigrant groups reported in New Milford borough came from Asia (2,762 | 16.4%), Latin America (1,669 | 9.9%), South Eastern Asia (1,174 | 7.0%), Philippines (1,131 | 6.7%), and South Central Asia (928 | 5.5%), together accounting for 45.4% of all New Milford borough residents.
| Immigration Origin | # Population | % Population |
| Africa | 155 | 0.9% |
| Argentina | 13 | 0.1% |
| Armenia | 94 | 0.6% |
| Asia | 2,762 | 16.4% |
| Bangladesh | 58 | 0.3% |
| Brazil | 38 | 0.2% |
| Cameroon | 39 | 0.2% |
| Canada | 5 | 0.0% |
| Caribbean | 774 | 4.6% |
| Central America | 102 | 0.6% |
| China | 93 | 0.5% |
| Colombia | 219 | 1.3% |
| Cuba | 51 | 0.3% |
| Dominican Republic | 486 | 2.9% |
| Eastern Africa | 34 | 0.2% |
| Eastern Asia | 253 | 1.5% |
| Eastern Europe | 220 | 1.3% |
| Ecuador | 83 | 0.5% |
| Egypt | 37 | 0.2% |
| El Salvador | 29 | 0.2% |
| England | 36 | 0.2% |
| Ethiopia | 21 | 0.1% |
| Europe | 521 | 3.1% |
| Germany | 93 | 0.5% |
| Greece | 32 | 0.2% |
| Guyana | 110 | 0.6% |
| Haiti | 55 | 0.3% |
| Honduras | 11 | 0.1% |
| Hong Kong | 15 | 0.1% |
| Hungary | 19 | 0.1% |
| India | 796 | 4.7% |
| Ireland | 99 | 0.6% |
| Israel | 18 | 0.1% |
| Italy | 31 | 0.2% |
| Jamaica | 69 | 0.4% |
| Japan | 46 | 0.3% |
| Korea | 114 | 0.7% |
| Latin America | 1,669 | 9.9% |
| Lebanon | 17 | 0.1% |
| Mexico | 62 | 0.4% |
| Middle Africa | 39 | 0.2% |
| Morocco | 22 | 0.1% |
| Netherlands | 10 | 0.1% |
| Nigeria | 14 | 0.1% |
| Northern Africa | 68 | 0.4% |
| Northern Europe | 135 | 0.8% |
| Pakistan | 47 | 0.3% |
| Peru | 70 | 0.4% |
| Philippines | 1,131 | 6.7% |
| Poland | 42 | 0.3% |
| Russia | 43 | 0.3% |
| Singapore | 22 | 0.1% |
| South America | 793 | 4.7% |
| South Central Asia | 928 | 5.5% |
| South Eastern Asia | 1,174 | 7.0% |
| Southern Europe | 63 | 0.4% |
| Sri Lanka | 27 | 0.2% |
| Syria | 52 | 0.3% |
| Trinidad and Tobago | 26 | 0.2% |
| Turkey | 226 | 1.3% |
| Uganda | 13 | 0.1% |
| Ukraine | 116 | 0.7% |
| Uruguay | 190 | 1.1% |
| Venezuela | 70 | 0.4% |
| Vietnam | 9 | 0.1% |
| Western Africa | 14 | 0.1% |
| Western Asia | 407 | 2.4% |
| Western Europe | 103 | 0.6% | View All 68 Rows |
Sex and Age in New Milford borough
Sex and Age in New Milford borough
The most populous age groups in New Milford borough are 10 to 14 Years (792 | 9.6%) for men and Under 5 Years (687 | 7.9%) for women.
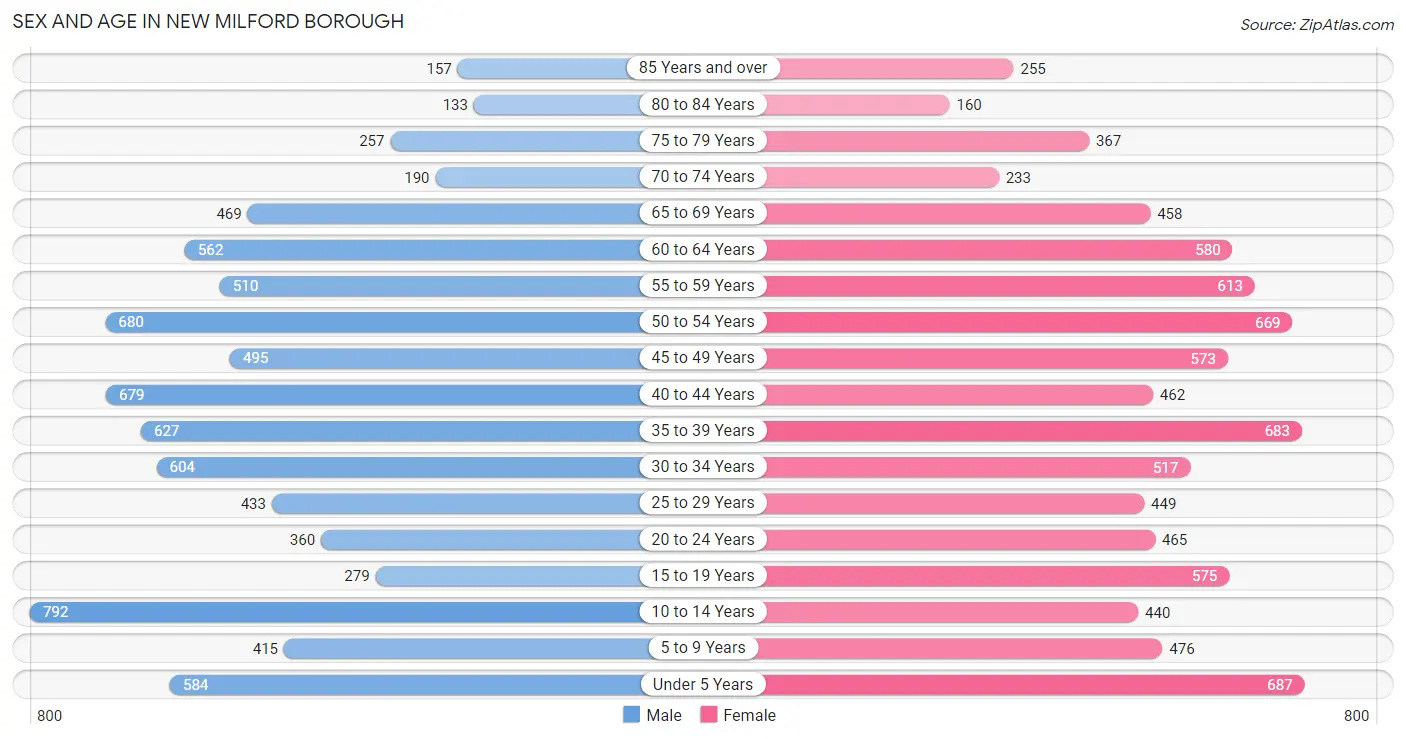
| Age Bracket | Male | Female |
| Under 5 Years | 584 (7.1%) | 687 (7.9%) |
| 5 to 9 Years | 415 (5.0%) | 476 (5.5%) |
| 10 to 14 Years | 792 (9.6%) | 440 (5.1%) |
| 15 to 19 Years | 279 (3.4%) | 575 (6.6%) |
| 20 to 24 Years | 360 (4.4%) | 465 (5.4%) |
| 25 to 29 Years | 433 (5.3%) | 449 (5.2%) |
| 30 to 34 Years | 604 (7.3%) | 517 (6.0%) |
| 35 to 39 Years | 627 (7.6%) | 683 (7.9%) |
| 40 to 44 Years | 679 (8.3%) | 462 (5.3%) |
| 45 to 49 Years | 495 (6.0%) | 573 (6.6%) |
| 50 to 54 Years | 680 (8.3%) | 669 (7.7%) |
| 55 to 59 Years | 510 (6.2%) | 613 (7.1%) |
| 60 to 64 Years | 562 (6.8%) | 580 (6.7%) |
| 65 to 69 Years | 469 (5.7%) | 458 (5.3%) |
| 70 to 74 Years | 190 (2.3%) | 233 (2.7%) |
| 75 to 79 Years | 257 (3.1%) | 367 (4.2%) |
| 80 to 84 Years | 133 (1.6%) | 160 (1.8%) |
| 85 Years and over | 157 (1.9%) | 255 (2.9%) |
| Total | 8,226 (100.0%) | 8,662 (100.0%) |
Families and Households in New Milford borough
Median Family Size in New Milford borough
The median family size in New Milford borough is 3.35 persons per family, with married-couple families (3,568 | 82.7%) accounting for the largest median family size of 3.44 persons per family. On the other hand, single male/father families (148 | 3.4%) represent the smallest median family size with 2.35 persons per family.
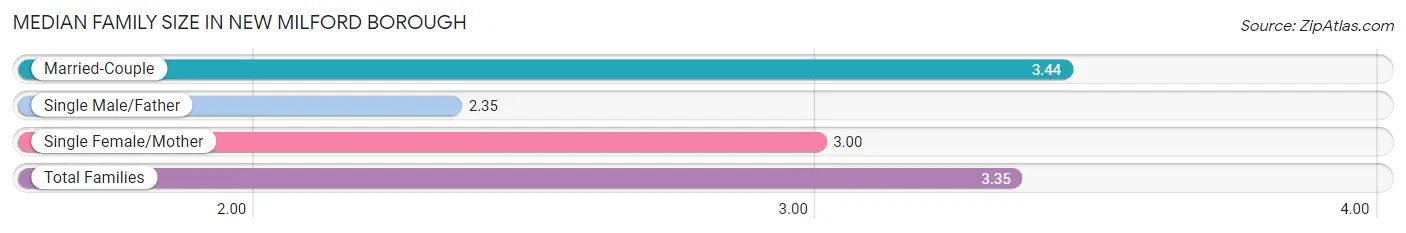
| Family Type | # Families | Family Size |
| Married-Couple | 3,568 (82.7%) | 3.44 |
| Single Male/Father | 148 (3.4%) | 2.35 |
| Single Female/Mother | 597 (13.8%) | 3.00 |
| Total Families | 4,313 (100.0%) | 3.35 |
Median Household Size in New Milford borough
The median household size in New Milford borough is 2.70 persons per household, with married-couple households (3,568 | 57.8%) accounting for the largest median household size of 3.46 persons per household. non-family households (1,857 | 30.1%) represent the smallest median household size with 1.14 persons per household.
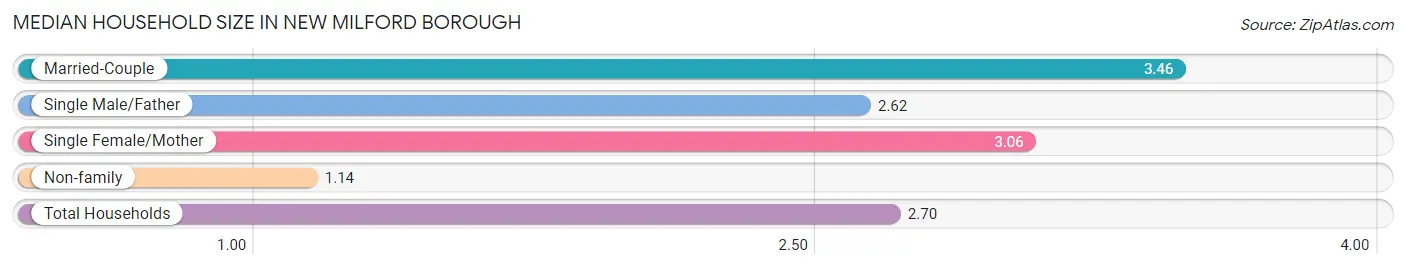
| Household Type | # Households | Household Size |
| Married-Couple | 3,568 (57.8%) | 3.46 |
| Single Male/Father | 148 (2.4%) | 2.62 |
| Single Female/Mother | 597 (9.7%) | 3.06 |
| Non-family | 1,857 (30.1%) | 1.14 |
| Total Households | 6,170 (100.0%) | 2.70 |
Household Size by Marriage Status in New Milford borough
Out of a total of 6,170 households in New Milford borough, 4,313 (69.9%) are family households, while 1,857 (30.1%) are nonfamily households. The most numerous type of family households are 2-person households, comprising 1,559, and the most common type of nonfamily households are 1-person households, comprising 1,602.
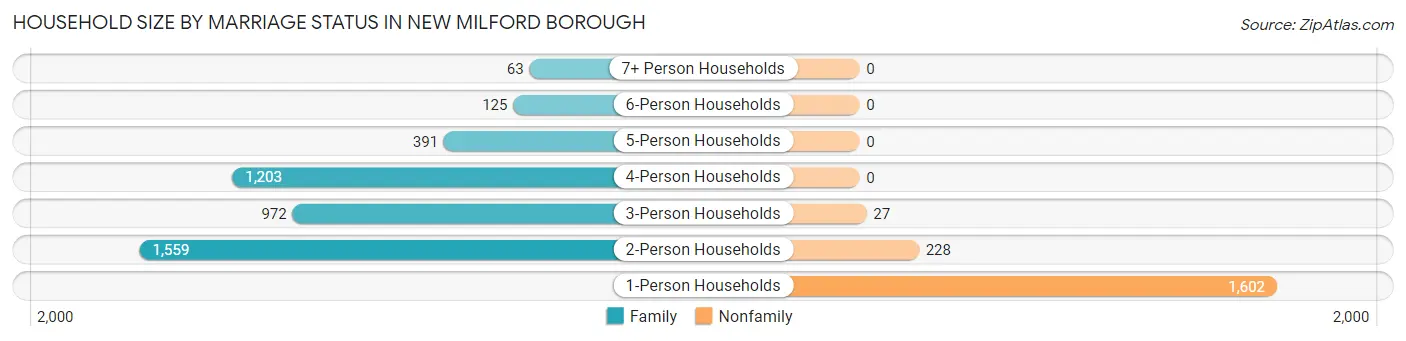
| Household Size | Family Households | Nonfamily Households |
| 1-Person Households | - | 1,602 (26.0%) |
| 2-Person Households | 1,559 (25.3%) | 228 (3.7%) |
| 3-Person Households | 972 (15.8%) | 27 (0.4%) |
| 4-Person Households | 1,203 (19.5%) | 0 (0.0%) |
| 5-Person Households | 391 (6.3%) | 0 (0.0%) |
| 6-Person Households | 125 (2.0%) | 0 (0.0%) |
| 7+ Person Households | 63 (1.0%) | 0 (0.0%) |
| Total | 4,313 (69.9%) | 1,857 (30.1%) |
Female Fertility in New Milford borough
Fertility by Age in New Milford borough
Average fertility rate in New Milford borough is 85.0 births per 1,000 women. Women in the age bracket of 35 to 50 years have the highest fertility rate with 94.0 births per 1,000 women. Women in the age bracket of 35 to 50 years acount for 52.7% of all women with births.
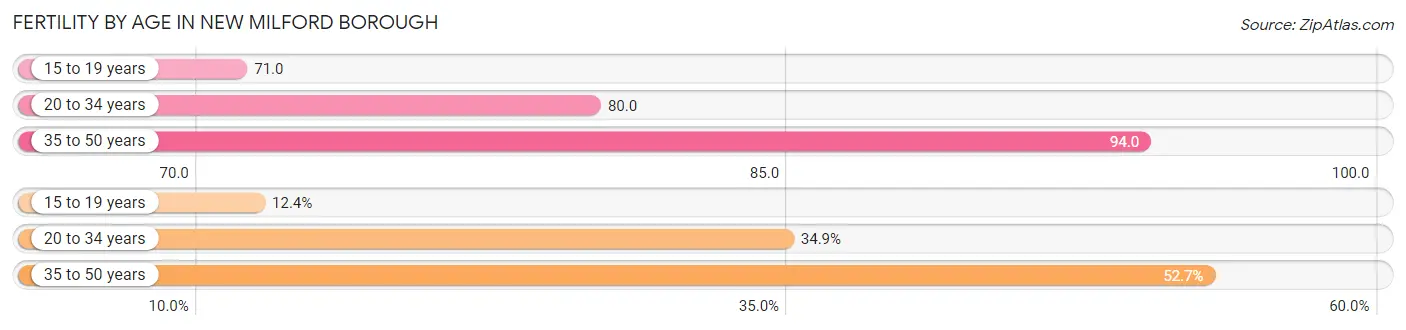
| Age Bracket | Women with Births | Births / 1,000 Women |
| 15 to 19 years | 41 (12.4%) | 71.0 |
| 20 to 34 years | 115 (34.8%) | 80.0 |
| 35 to 50 years | 174 (52.7%) | 94.0 |
| Total | 330 (100.0%) | 85.0 |
Fertility by Age by Marriage Status in New Milford borough
65.2% of women with births (330) in New Milford borough are married. The highest percentage of unmarried women with births falls into 15 to 19 years age bracket with 100.0% of them unmarried at the time of birth, while the lowest percentage of unmarried women with births belong to 35 to 50 years age bracket with 16.1% of them unmarried.
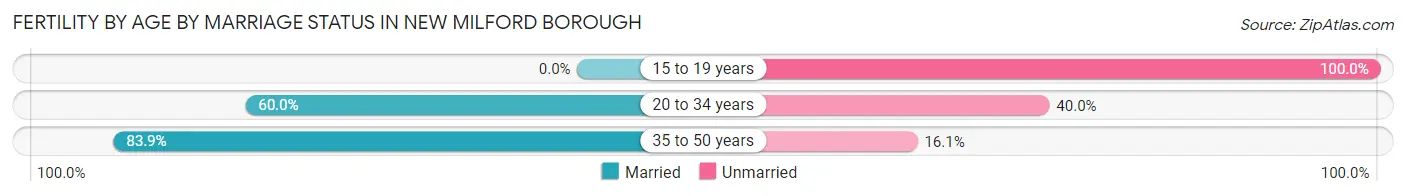
| Age Bracket | Married | Unmarried |
| 15 to 19 years | 0 (0.0%) | 41 (100.0%) |
| 20 to 34 years | 69 (60.0%) | 46 (40.0%) |
| 35 to 50 years | 146 (83.9%) | 28 (16.1%) |
| Total | 215 (65.1%) | 115 (34.8%) |
Fertility by Education in New Milford borough
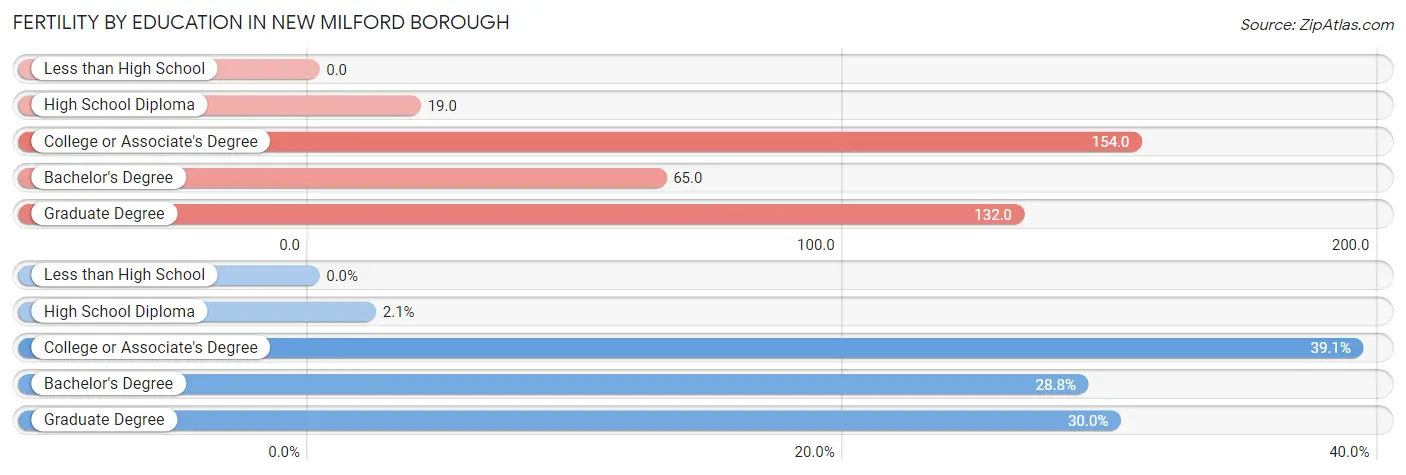
| Educational Attainment | Women with Births | Births / 1,000 Women |
| Less than High School | 0 (0.0%) | 0.0 |
| High School Diploma | 7 (2.1%) | 19.0 |
| College or Associate's Degree | 129 (39.1%) | 154.0 |
| Bachelor's Degree | 95 (28.8%) | 65.0 |
| Graduate Degree | 99 (30.0%) | 132.0 |
| Total | 330 (100.0%) | 85.0 |
Fertility by Education by Marriage Status in New Milford borough
34.8% of women with births in New Milford borough are unmarried. Women with the educational attainment of high school diploma are most likely to be married with 100.0% of them married at childbirth, while women with the educational attainment of college or associate's degree are least likely to be married with 67.4% of them unmarried at childbirth.
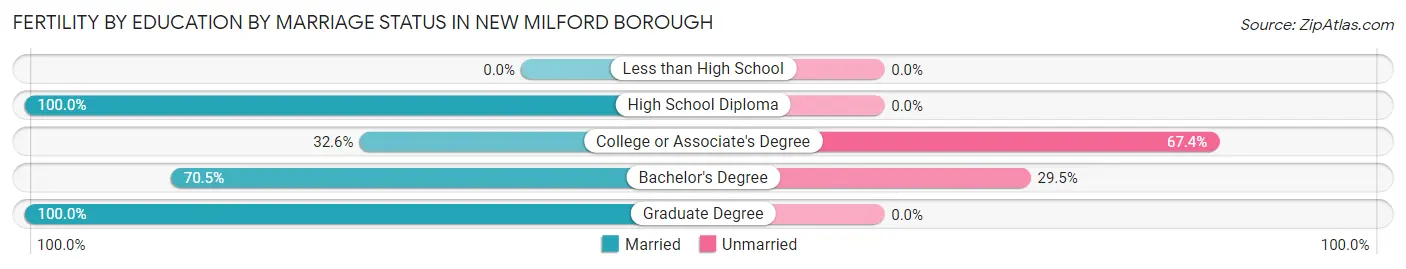
| Educational Attainment | Married | Unmarried |
| Less than High School | 0 (0.0%) | 0 (0.0%) |
| High School Diploma | 7 (100.0%) | 0 (0.0%) |
| College or Associate's Degree | 42 (32.6%) | 87 (67.4%) |
| Bachelor's Degree | 67 (70.5%) | 28 (29.5%) |
| Graduate Degree | 99 (100.0%) | 0 (0.0%) |
| Total | 215 (65.1%) | 115 (34.8%) |
Employment Characteristics in New Milford borough
Employment by Class of Employer in New Milford borough
Among the 8,725 employed individuals in New Milford borough, private company employees (5,825 | 66.8%), local government employees (955 | 11.0%), and not-for-profit organizations (704 | 8.1%) make up the most common classes of employment.
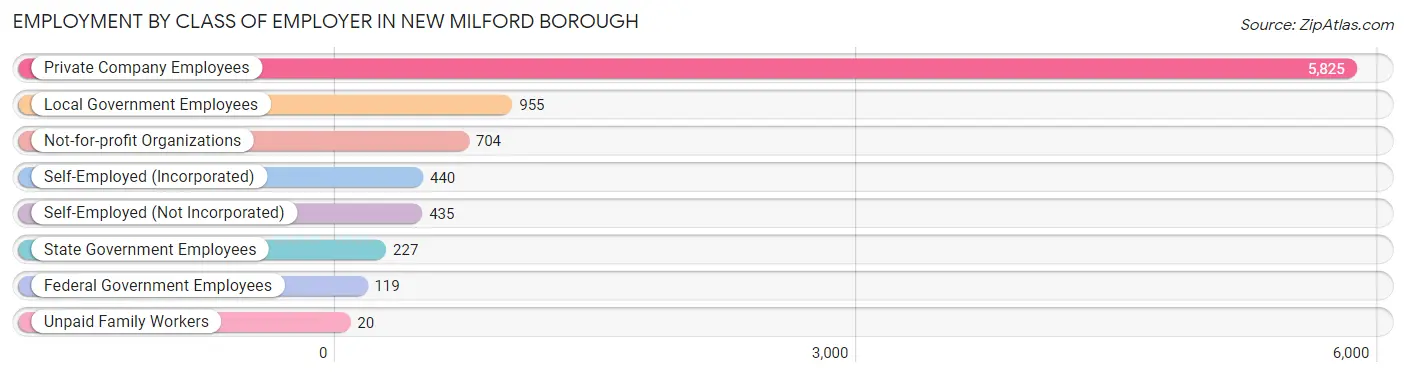
| Employer Class | # Employees | % Employees |
| Private Company Employees | 5,825 | 66.8% |
| Self-Employed (Incorporated) | 440 | 5.0% |
| Self-Employed (Not Incorporated) | 435 | 5.0% |
| Not-for-profit Organizations | 704 | 8.1% |
| Local Government Employees | 955 | 11.0% |
| State Government Employees | 227 | 2.6% |
| Federal Government Employees | 119 | 1.4% |
| Unpaid Family Workers | 20 | 0.2% |
| Total | 8,725 | 100.0% |
Employment Status by Age in New Milford borough
According to the labor force statistics for New Milford borough, out of the total population over 16 years of age (13,277), 72.3% or 9,599 individuals are in the labor force, with 6.1% or 586 of them unemployed. The age group with the highest labor force participation rate is 30 to 34 years, with 93.9% or 1,053 individuals in the labor force. Within the labor force, the 20 to 24 years age range has the highest percentage of unemployed individuals, with 22.7% or 145 of them being unemployed.
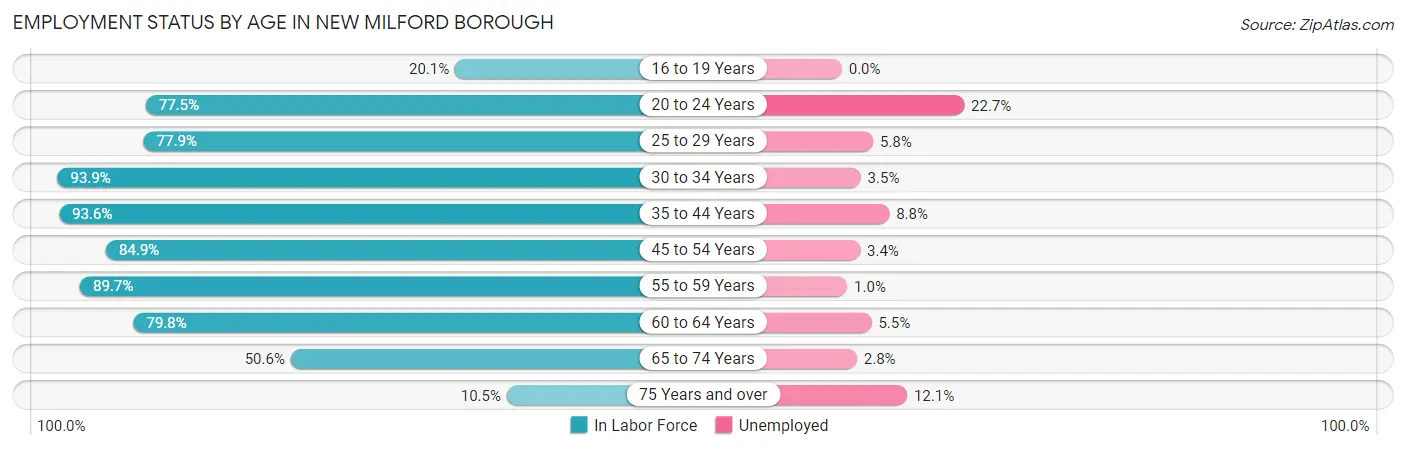
| Age Bracket | In Labor Force | Unemployed |
| 16 to 19 Years | 128 (20.1%) | 0 (0.0%) |
| 20 to 24 Years | 639 (77.5%) | 145 (22.7%) |
| 25 to 29 Years | 687 (77.9%) | 40 (5.8%) |
| 30 to 34 Years | 1,053 (93.9%) | 37 (3.5%) |
| 35 to 44 Years | 2,294 (93.6%) | 202 (8.8%) |
| 45 to 54 Years | 2,052 (84.9%) | 70 (3.4%) |
| 55 to 59 Years | 1,007 (89.7%) | 10 (1.0%) |
| 60 to 64 Years | 911 (79.8%) | 50 (5.5%) |
| 65 to 74 Years | 683 (50.6%) | 19 (2.8%) |
| 75 Years and over | 140 (10.5%) | 17 (12.1%) |
| Total | 9,599 (72.3%) | 586 (6.1%) |
Employment Status by Educational Attainment in New Milford borough
According to labor force statistics for New Milford borough, 87.6% of individuals (8,003) out of the total population between 25 and 64 years of age (9,136) are in the labor force, with 5.1% or 408 of them being unemployed. The group with the highest labor force participation rate are those with the educational attainment of bachelor's degree or higher, with 90.9% or 4,539 individuals in the labor force. Within the labor force, individuals with bachelor's degree or higher education have the highest percentage of unemployment, with 6.1% or 277 of them being unemployed.
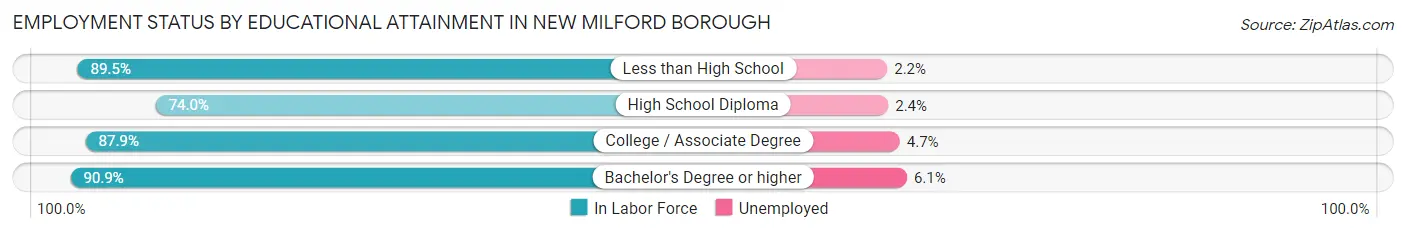
| Educational Attainment | In Labor Force | Unemployed |
| Less than High School | 418 (89.5%) | 10 (2.2%) |
| High School Diploma | 972 (74.0%) | 32 (2.4%) |
| College / Associate Degree | 2,076 (87.9%) | 111 (4.7%) |
| Bachelor's Degree or higher | 4,539 (90.9%) | 305 (6.1%) |
| Total | 8,003 (87.6%) | 466 (5.1%) |
Employment Occupations by Sex in New Milford borough
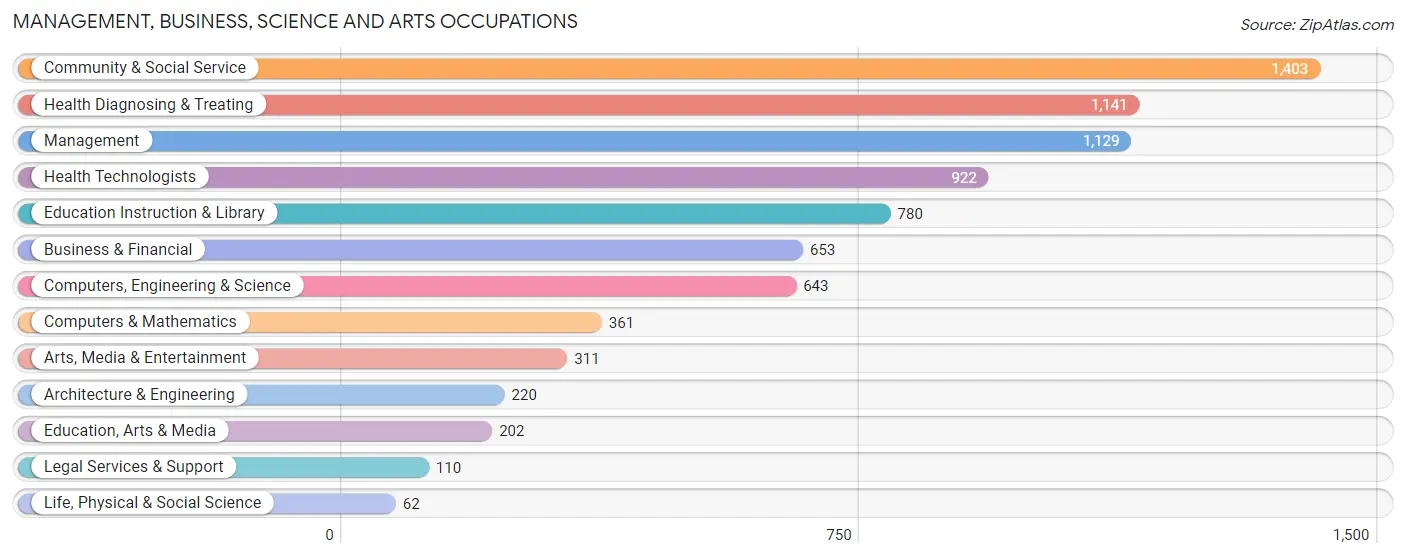
Management, Business, Science and Arts Occupations
The most common Management, Business, Science and Arts occupations in New Milford borough are Community & Social Service (1,403 | 15.6%), Health Diagnosing & Treating (1,141 | 12.7%), Management (1,129 | 12.5%), Health Technologists (922 | 10.2%), and Education Instruction & Library (780 | 8.7%).
Management, Business, Science and Arts Occupations by Sex
Within the Management, Business, Science and Arts occupations in New Milford borough, the most male-oriented occupations are Computers & Mathematics (78.9%), Computers, Engineering & Science (73.3%), and Architecture & Engineering (70.9%), while the most female-oriented occupations are Education Instruction & Library (74.9%), Health Technologists (73.1%), and Education, Arts & Media (71.8%).
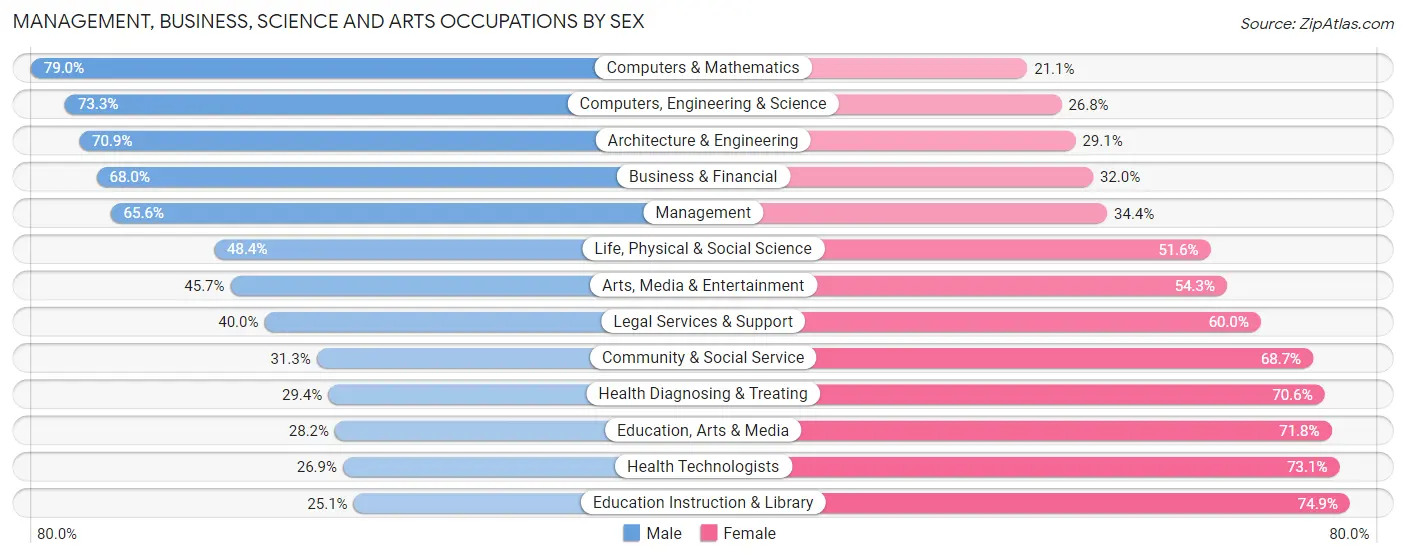
| Occupation | Male | Female |
| Management | 741 (65.6%) | 388 (34.4%) |
| Business & Financial | 444 (68.0%) | 209 (32.0%) |
| Computers, Engineering & Science | 471 (73.3%) | 172 (26.8%) |
| Computers & Mathematics | 285 (78.9%) | 76 (21.0%) |
| Architecture & Engineering | 156 (70.9%) | 64 (29.1%) |
| Life, Physical & Social Science | 30 (48.4%) | 32 (51.6%) |
| Community & Social Service | 439 (31.3%) | 964 (68.7%) |
| Education, Arts & Media | 57 (28.2%) | 145 (71.8%) |
| Legal Services & Support | 44 (40.0%) | 66 (60.0%) |
| Education Instruction & Library | 196 (25.1%) | 584 (74.9%) |
| Arts, Media & Entertainment | 142 (45.7%) | 169 (54.3%) |
| Health Diagnosing & Treating | 335 (29.4%) | 806 (70.6%) |
| Health Technologists | 248 (26.9%) | 674 (73.1%) |
| Total (Category) | 2,430 (48.9%) | 2,539 (51.1%) |
| Total (Overall) | 4,710 (52.3%) | 4,295 (47.7%) |
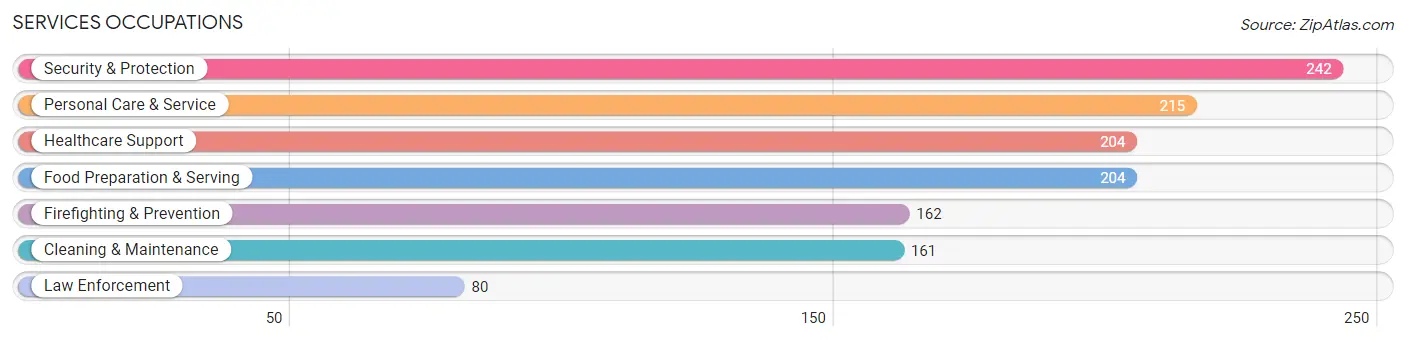
Services Occupations
The most common Services occupations in New Milford borough are Security & Protection (242 | 2.7%), Personal Care & Service (215 | 2.4%), Healthcare Support (204 | 2.3%), Food Preparation & Serving (204 | 2.3%), and Firefighting & Prevention (162 | 1.8%).
Services Occupations by Sex
Within the Services occupations in New Milford borough, the most male-oriented occupations are Firefighting & Prevention (89.5%), Food Preparation & Serving (77.9%), and Security & Protection (74.8%), while the most female-oriented occupations are Healthcare Support (84.8%), Law Enforcement (55.0%), and Personal Care & Service (45.6%).
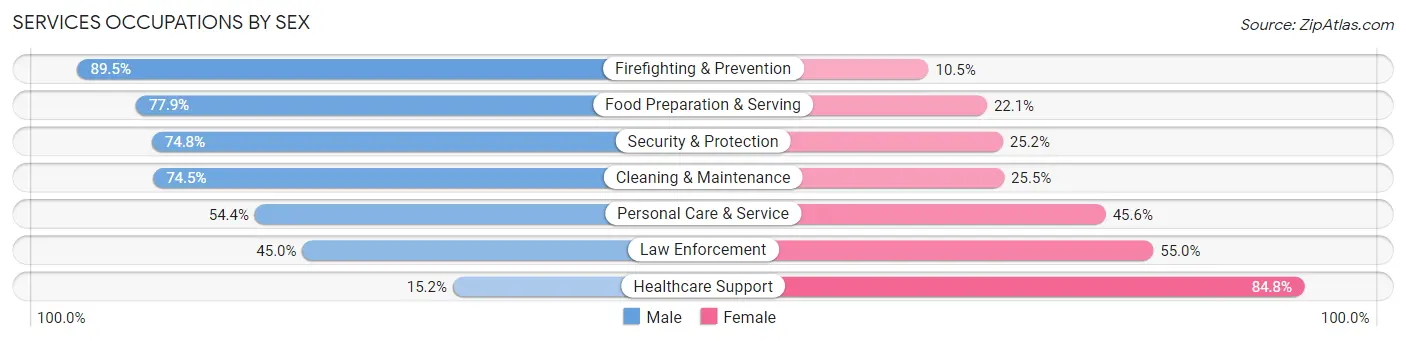
| Occupation | Male | Female |
| Healthcare Support | 31 (15.2%) | 173 (84.8%) |
| Security & Protection | 181 (74.8%) | 61 (25.2%) |
| Firefighting & Prevention | 145 (89.5%) | 17 (10.5%) |
| Law Enforcement | 36 (45.0%) | 44 (55.0%) |
| Food Preparation & Serving | 159 (77.9%) | 45 (22.1%) |
| Cleaning & Maintenance | 120 (74.5%) | 41 (25.5%) |
| Personal Care & Service | 117 (54.4%) | 98 (45.6%) |
| Total (Category) | 608 (59.3%) | 418 (40.7%) |
| Total (Overall) | 4,710 (52.3%) | 4,295 (47.7%) |
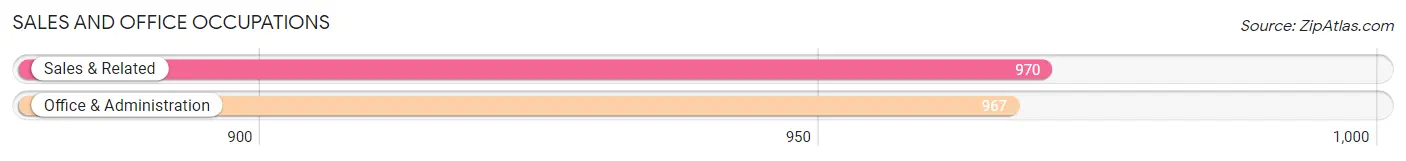
Sales and Office Occupations
The most common Sales and Office occupations in New Milford borough are Sales & Related (970 | 10.8%), and Office & Administration (967 | 10.7%).
Sales and Office Occupations by Sex

| Occupation | Male | Female |
| Sales & Related | 524 (54.0%) | 446 (46.0%) |
| Office & Administration | 170 (17.6%) | 797 (82.4%) |
| Total (Category) | 694 (35.8%) | 1,243 (64.2%) |
| Total (Overall) | 4,710 (52.3%) | 4,295 (47.7%) |
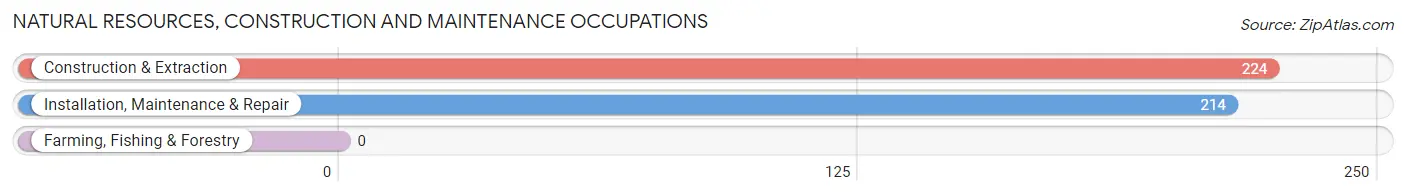
Natural Resources, Construction and Maintenance Occupations
The most common Natural Resources, Construction and Maintenance occupations in New Milford borough are Construction & Extraction (224 | 2.5%), and Installation, Maintenance & Repair (214 | 2.4%).
Natural Resources, Construction and Maintenance Occupations by Sex
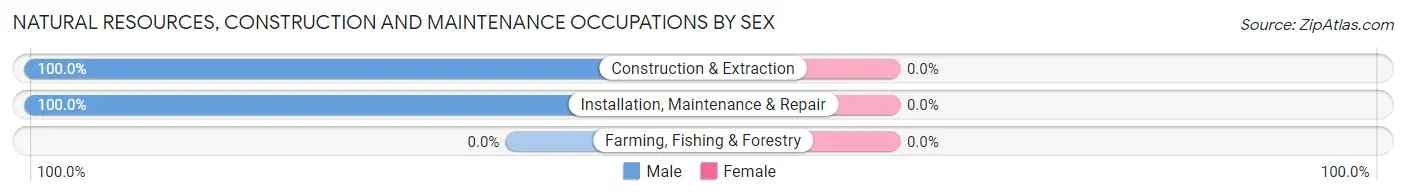
| Occupation | Male | Female |
| Farming, Fishing & Forestry | 0 (0.0%) | 0 (0.0%) |
| Construction & Extraction | 224 (100.0%) | 0 (0.0%) |
| Installation, Maintenance & Repair | 214 (100.0%) | 0 (0.0%) |
| Total (Category) | 438 (100.0%) | 0 (0.0%) |
| Total (Overall) | 4,710 (52.3%) | 4,295 (47.7%) |
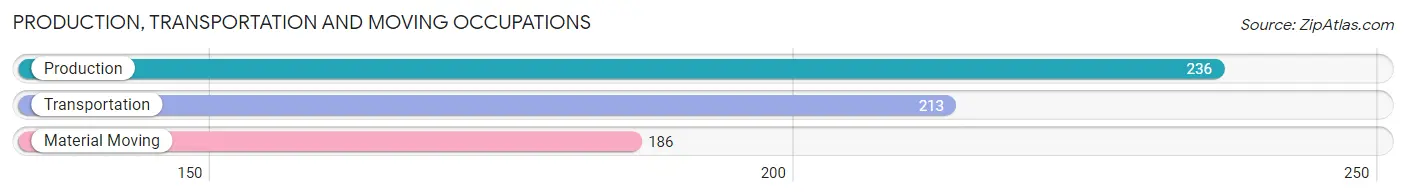
Production, Transportation and Moving Occupations
The most common Production, Transportation and Moving occupations in New Milford borough are Production (236 | 2.6%), Transportation (213 | 2.4%), and Material Moving (186 | 2.1%).
Production, Transportation and Moving Occupations by Sex
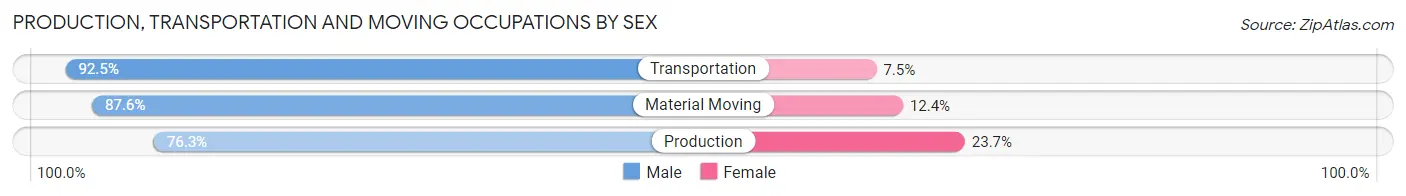
| Occupation | Male | Female |
| Production | 180 (76.3%) | 56 (23.7%) |
| Transportation | 197 (92.5%) | 16 (7.5%) |
| Material Moving | 163 (87.6%) | 23 (12.4%) |
| Total (Category) | 540 (85.0%) | 95 (15.0%) |
| Total (Overall) | 4,710 (52.3%) | 4,295 (47.7%) |
Employment Industries by Sex in New Milford borough
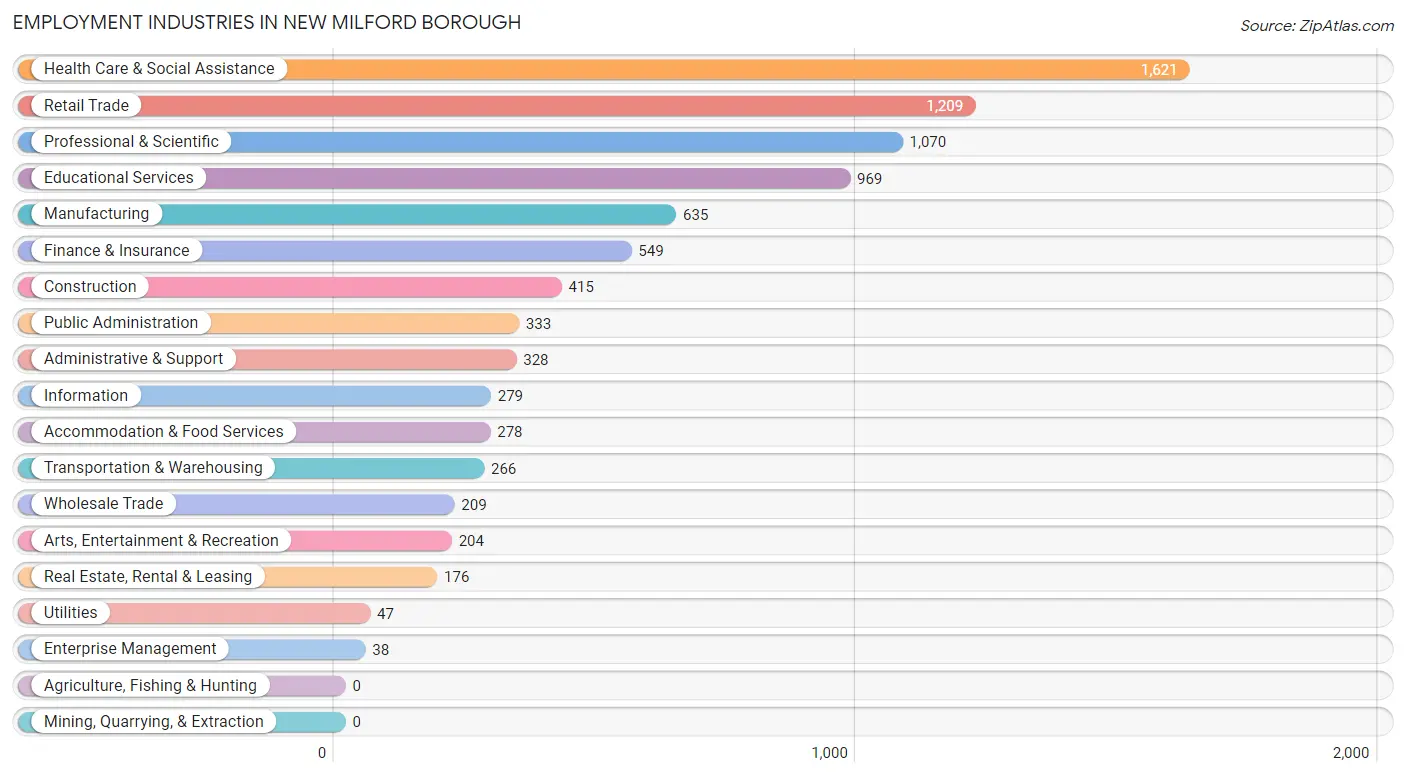
Employment Industries in New Milford borough
The major employment industries in New Milford borough include Health Care & Social Assistance (1,621 | 18.0%), Retail Trade (1,209 | 13.4%), Professional & Scientific (1,070 | 11.9%), Educational Services (969 | 10.8%), and Manufacturing (635 | 7.0%).
Employment Industries by Sex in New Milford borough
The New Milford borough industries that see more men than women are Utilities (100.0%), Enterprise Management (100.0%), and Construction (94.7%), whereas the industries that tend to have a higher number of women are Educational Services (73.7%), Health Care & Social Assistance (69.6%), and Finance & Insurance (59.9%).
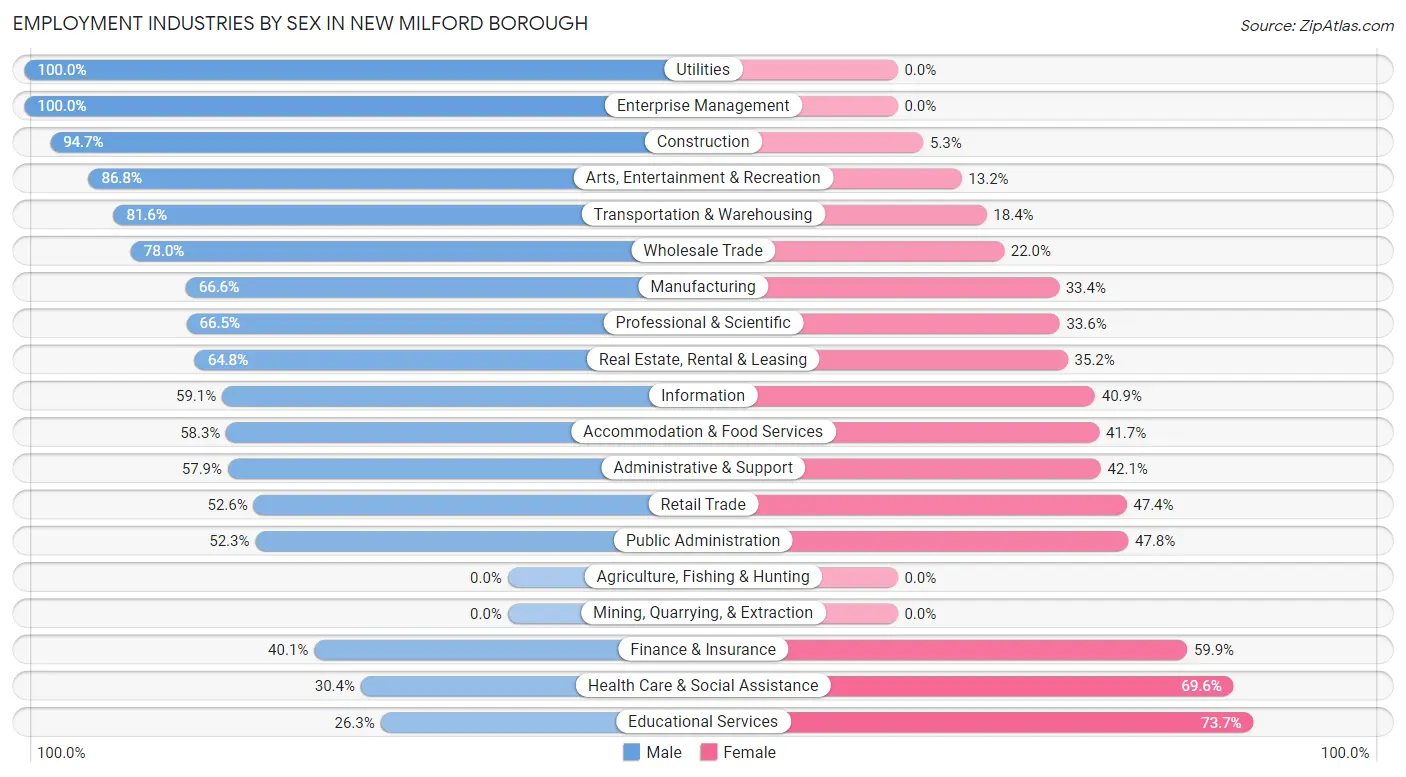
| Industry | Male | Female |
| Agriculture, Fishing & Hunting | 0 (0.0%) | 0 (0.0%) |
| Mining, Quarrying, & Extraction | 0 (0.0%) | 0 (0.0%) |
| Construction | 393 (94.7%) | 22 (5.3%) |
| Manufacturing | 423 (66.6%) | 212 (33.4%) |
| Wholesale Trade | 163 (78.0%) | 46 (22.0%) |
| Retail Trade | 636 (52.6%) | 573 (47.4%) |
| Transportation & Warehousing | 217 (81.6%) | 49 (18.4%) |
| Utilities | 47 (100.0%) | 0 (0.0%) |
| Information | 165 (59.1%) | 114 (40.9%) |
| Finance & Insurance | 220 (40.1%) | 329 (59.9%) |
| Real Estate, Rental & Leasing | 114 (64.8%) | 62 (35.2%) |
| Professional & Scientific | 711 (66.4%) | 359 (33.6%) |
| Enterprise Management | 38 (100.0%) | 0 (0.0%) |
| Administrative & Support | 190 (57.9%) | 138 (42.1%) |
| Educational Services | 255 (26.3%) | 714 (73.7%) |
| Health Care & Social Assistance | 493 (30.4%) | 1,128 (69.6%) |
| Arts, Entertainment & Recreation | 177 (86.8%) | 27 (13.2%) |
| Accommodation & Food Services | 162 (58.3%) | 116 (41.7%) |
| Public Administration | 174 (52.2%) | 159 (47.7%) |
| Total | 4,710 (52.3%) | 4,295 (47.7%) |
Education in New Milford borough
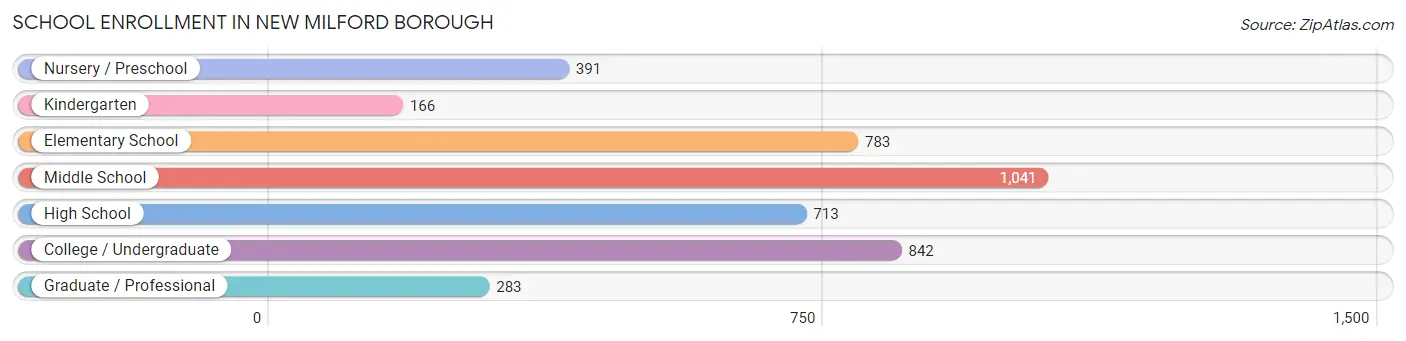
School Enrollment in New Milford borough
The most common levels of schooling among the 4,219 students in New Milford borough are middle school (1,041 | 24.7%), college / undergraduate (842 | 20.0%), and elementary school (783 | 18.6%).
| School Level | # Students | % Students |
| Nursery / Preschool | 391 | 9.3% |
| Kindergarten | 166 | 3.9% |
| Elementary School | 783 | 18.6% |
| Middle School | 1,041 | 24.7% |
| High School | 713 | 16.9% |
| College / Undergraduate | 842 | 20.0% |
| Graduate / Professional | 283 | 6.7% |
| Total | 4,219 | 100.0% |
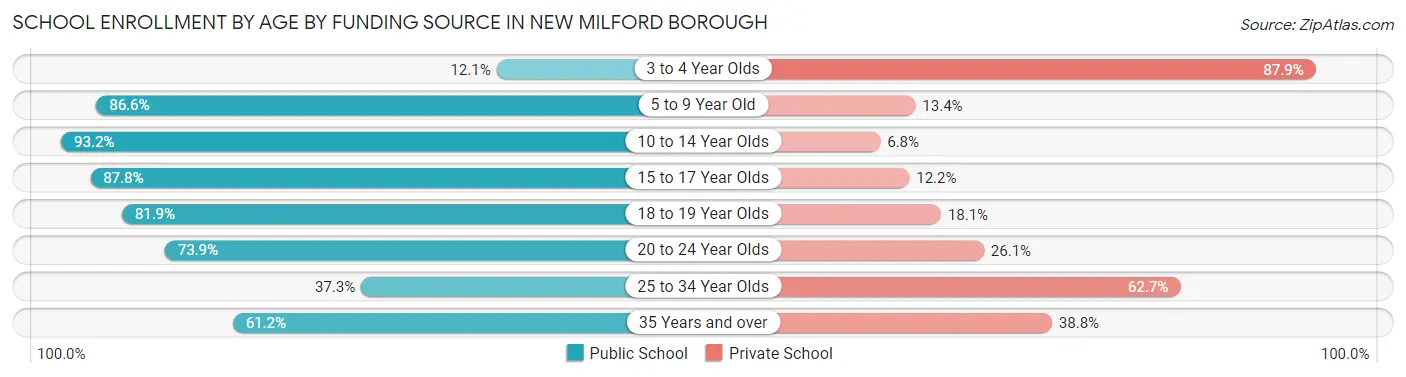
School Enrollment by Age by Funding Source in New Milford borough
Out of a total of 4,219 students who are enrolled in schools in New Milford borough, 941 (22.3%) attend a private institution, while the remaining 3,278 (77.7%) are enrolled in public schools. The age group of 3 to 4 year olds has the highest likelihood of being enrolled in private schools, with 276 (87.9% in the age bracket) enrolled. Conversely, the age group of 10 to 14 year olds has the lowest likelihood of being enrolled in a private school, with 1,148 (93.2% in the age bracket) attending a public institution.
| Age Bracket | Public School | Private School |
| 3 to 4 Year Olds | 38 (12.1%) | 276 (87.9%) |
| 5 to 9 Year Old | 772 (86.6%) | 119 (13.4%) |
| 10 to 14 Year Olds | 1,148 (93.2%) | 84 (6.8%) |
| 15 to 17 Year Olds | 481 (87.8%) | 67 (12.2%) |
| 18 to 19 Year Olds | 235 (81.9%) | 52 (18.1%) |
| 20 to 24 Year Olds | 345 (73.9%) | 122 (26.1%) |
| 25 to 34 Year Olds | 56 (37.3%) | 94 (62.7%) |
| 35 Years and over | 202 (61.2%) | 128 (38.8%) |
| Total | 3,278 (77.7%) | 941 (22.3%) |
Educational Attainment by Field of Study in New Milford borough
Business (1,296 | 21.4%), science & technology (1,177 | 19.4%), engineering (550 | 9.1%), education (547 | 9.0%), and social sciences (469 | 7.7%) are the most common fields of study among 6,064 individuals in New Milford borough who have obtained a bachelor's degree or higher.
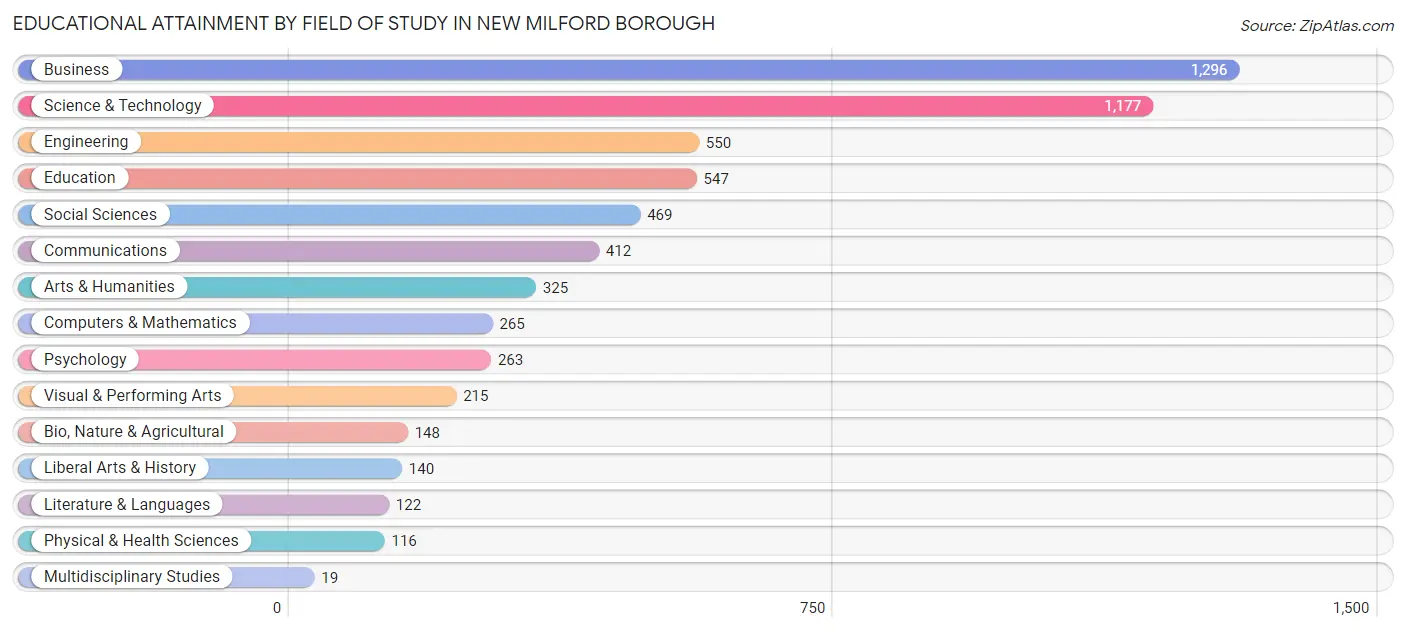
| Field of Study | # Graduates | % Graduates |
| Computers & Mathematics | 265 | 4.4% |
| Bio, Nature & Agricultural | 148 | 2.4% |
| Physical & Health Sciences | 116 | 1.9% |
| Psychology | 263 | 4.3% |
| Social Sciences | 469 | 7.7% |
| Engineering | 550 | 9.1% |
| Multidisciplinary Studies | 19 | 0.3% |
| Science & Technology | 1,177 | 19.4% |
| Business | 1,296 | 21.4% |
| Education | 547 | 9.0% |
| Literature & Languages | 122 | 2.0% |
| Liberal Arts & History | 140 | 2.3% |
| Visual & Performing Arts | 215 | 3.5% |
| Communications | 412 | 6.8% |
| Arts & Humanities | 325 | 5.4% |
| Total | 6,064 | 100.0% |
Transportation & Commute in New Milford borough
Vehicle Availability by Sex in New Milford borough
The most prevalent vehicle ownership categories in New Milford borough are males with 2 vehicles (1,914, accounting for 41.3%) and females with 2 vehicles (1,878, making up 46.8%).
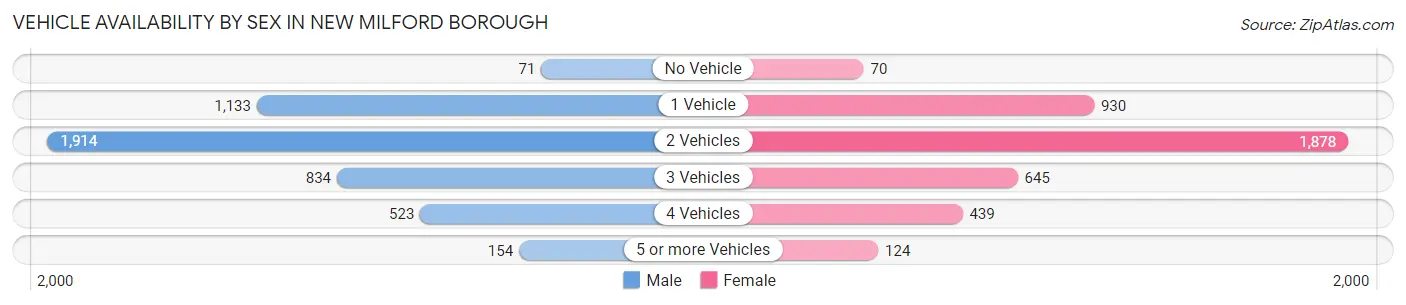
| Vehicles Available | Male | Female |
| No Vehicle | 71 (1.5%) | 70 (1.7%) |
| 1 Vehicle | 1,133 (24.5%) | 930 (22.8%) |
| 2 Vehicles | 1,914 (41.3%) | 1,878 (46.0%) |
| 3 Vehicles | 834 (18.0%) | 645 (15.8%) |
| 4 Vehicles | 523 (11.3%) | 439 (10.7%) |
| 5 or more Vehicles | 154 (3.3%) | 124 (3.0%) |
| Total | 4,629 (100.0%) | 4,086 (100.0%) |
Commute Time in New Milford borough
The most frequently occuring commute durations in New Milford borough are 20 to 24 minutes (1,511 commuters, 19.5%), 15 to 19 minutes (1,050 commuters, 13.6%), and 30 to 34 minutes (924 commuters, 11.9%).
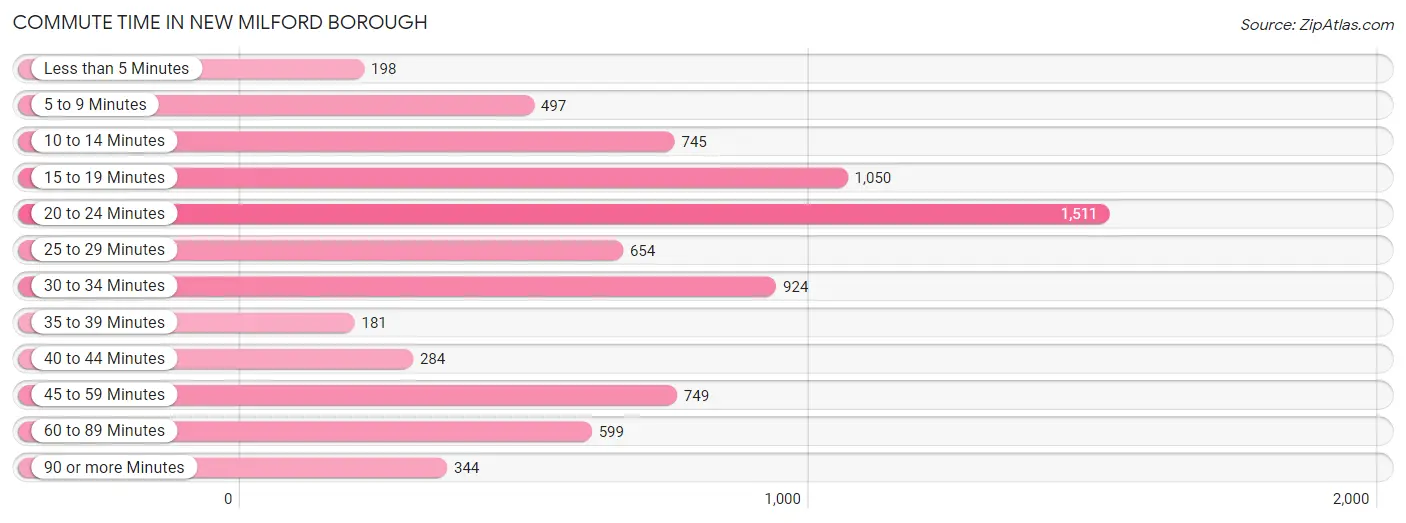
| Commute Time | # Commuters | % Commuters |
| Less than 5 Minutes | 198 | 2.6% |
| 5 to 9 Minutes | 497 | 6.4% |
| 10 to 14 Minutes | 745 | 9.6% |
| 15 to 19 Minutes | 1,050 | 13.6% |
| 20 to 24 Minutes | 1,511 | 19.5% |
| 25 to 29 Minutes | 654 | 8.5% |
| 30 to 34 Minutes | 924 | 11.9% |
| 35 to 39 Minutes | 181 | 2.3% |
| 40 to 44 Minutes | 284 | 3.7% |
| 45 to 59 Minutes | 749 | 9.7% |
| 60 to 89 Minutes | 599 | 7.7% |
| 90 or more Minutes | 344 | 4.4% |
Commute Time by Sex in New Milford borough
The most common commute times in New Milford borough are 20 to 24 minutes (824 commuters, 19.7%) for males and 20 to 24 minutes (687 commuters, 19.4%) for females.
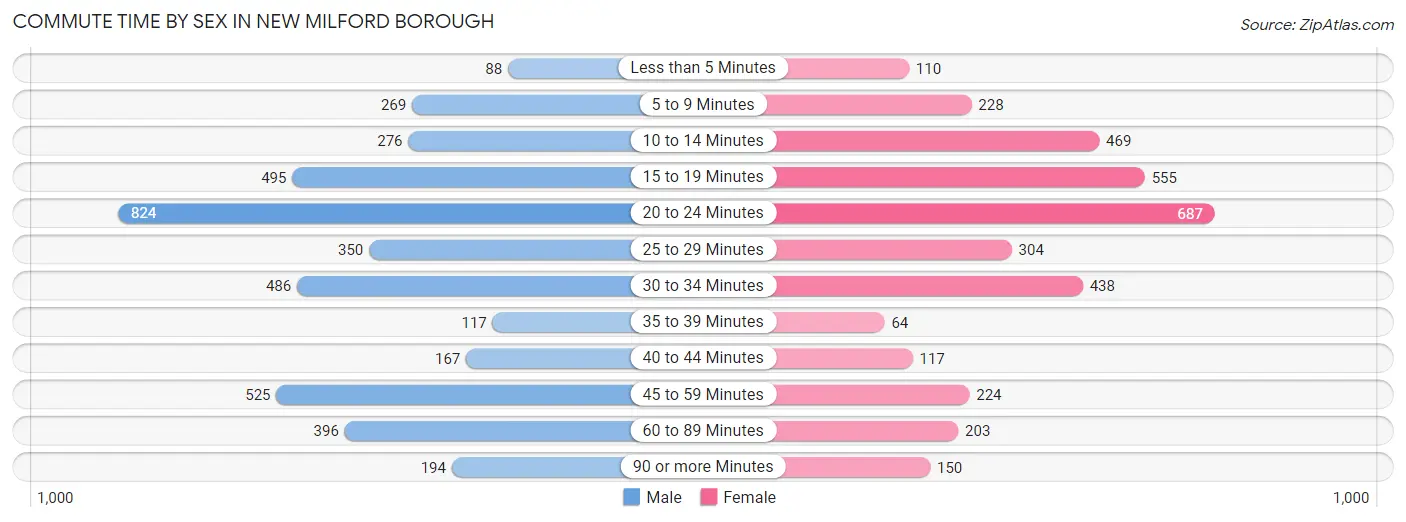
| Commute Time | Male | Female |
| Less than 5 Minutes | 88 (2.1%) | 110 (3.1%) |
| 5 to 9 Minutes | 269 (6.4%) | 228 (6.4%) |
| 10 to 14 Minutes | 276 (6.6%) | 469 (13.2%) |
| 15 to 19 Minutes | 495 (11.8%) | 555 (15.6%) |
| 20 to 24 Minutes | 824 (19.7%) | 687 (19.4%) |
| 25 to 29 Minutes | 350 (8.4%) | 304 (8.6%) |
| 30 to 34 Minutes | 486 (11.6%) | 438 (12.3%) |
| 35 to 39 Minutes | 117 (2.8%) | 64 (1.8%) |
| 40 to 44 Minutes | 167 (4.0%) | 117 (3.3%) |
| 45 to 59 Minutes | 525 (12.5%) | 224 (6.3%) |
| 60 to 89 Minutes | 396 (9.5%) | 203 (5.7%) |
| 90 or more Minutes | 194 (4.6%) | 150 (4.2%) |
Time of Departure to Work by Sex in New Milford borough
The most frequent times of departure to work in New Milford borough are 8:00 AM to 8:29 AM (816, 19.5%) for males and 8:00 AM to 8:29 AM (752, 21.2%) for females.
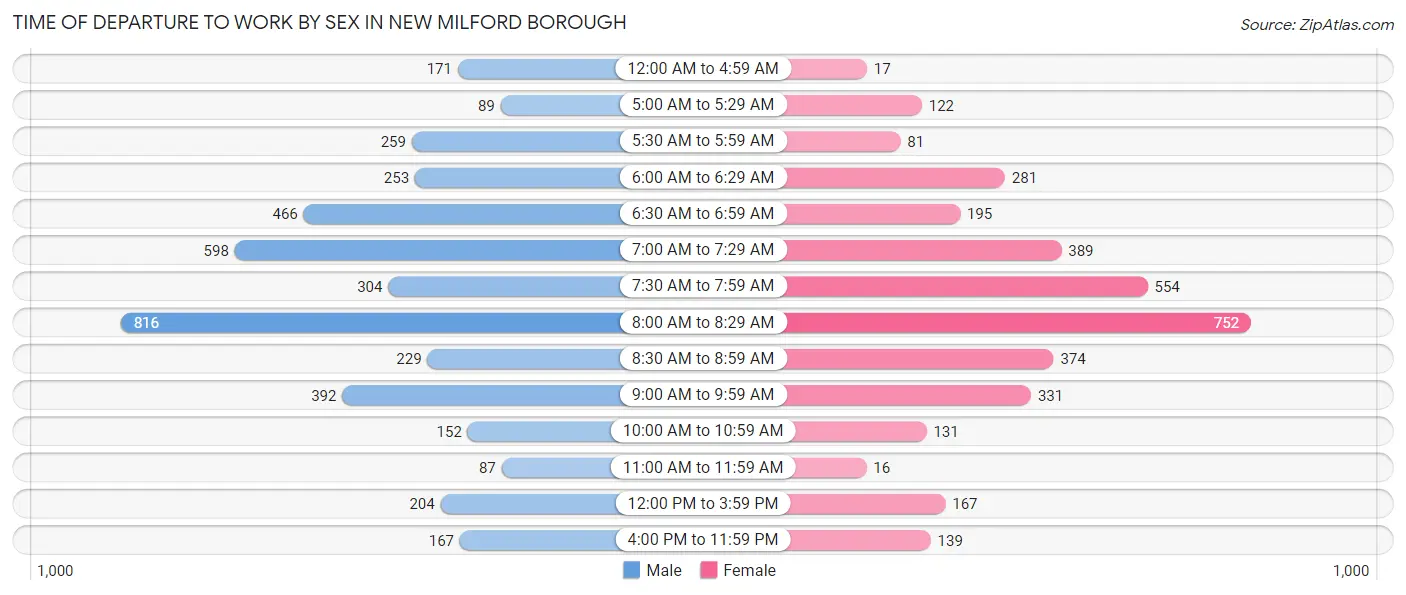
| Time of Departure | Male | Female |
| 12:00 AM to 4:59 AM | 171 (4.1%) | 17 (0.5%) |
| 5:00 AM to 5:29 AM | 89 (2.1%) | 122 (3.4%) |
| 5:30 AM to 5:59 AM | 259 (6.2%) | 81 (2.3%) |
| 6:00 AM to 6:29 AM | 253 (6.0%) | 281 (7.9%) |
| 6:30 AM to 6:59 AM | 466 (11.1%) | 195 (5.5%) |
| 7:00 AM to 7:29 AM | 598 (14.3%) | 389 (11.0%) |
| 7:30 AM to 7:59 AM | 304 (7.3%) | 554 (15.6%) |
| 8:00 AM to 8:29 AM | 816 (19.5%) | 752 (21.2%) |
| 8:30 AM to 8:59 AM | 229 (5.5%) | 374 (10.5%) |
| 9:00 AM to 9:59 AM | 392 (9.4%) | 331 (9.3%) |
| 10:00 AM to 10:59 AM | 152 (3.6%) | 131 (3.7%) |
| 11:00 AM to 11:59 AM | 87 (2.1%) | 16 (0.4%) |
| 12:00 PM to 3:59 PM | 204 (4.9%) | 167 (4.7%) |
| 4:00 PM to 11:59 PM | 167 (4.0%) | 139 (3.9%) |
| Total | 4,187 (100.0%) | 3,549 (100.0%) |
Housing Occupancy in New Milford borough
Occupancy by Ownership in New Milford borough
Of the total 6,170 dwellings in New Milford borough, owner-occupied units account for 3,920 (63.5%), while renter-occupied units make up 2,250 (36.5%).
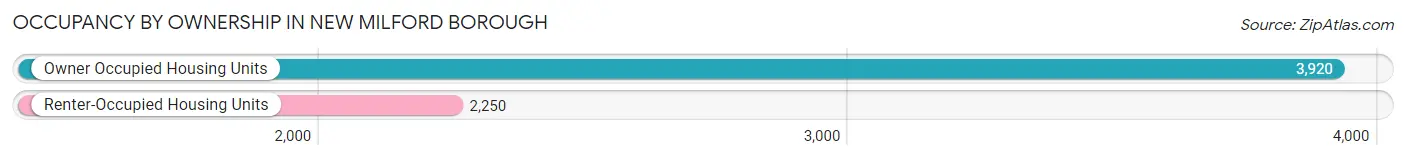
| Occupancy | # Housing Units | % Housing Units |
| Owner Occupied Housing Units | 3,920 | 63.5% |
| Renter-Occupied Housing Units | 2,250 | 36.5% |
| Total Occupied Housing Units | 6,170 | 100.0% |
Occupancy by Household Size in New Milford borough
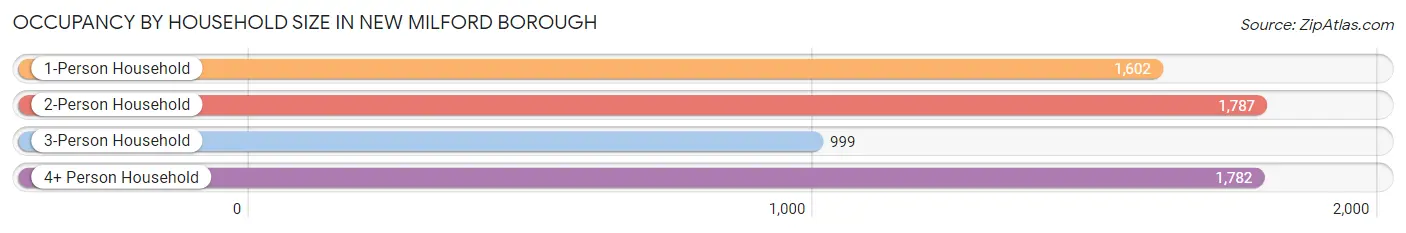
| Household Size | # Housing Units | % Housing Units |
| 1-Person Household | 1,602 | 26.0% |
| 2-Person Household | 1,787 | 29.0% |
| 3-Person Household | 999 | 16.2% |
| 4+ Person Household | 1,782 | 28.9% |
| Total Housing Units | 6,170 | 100.0% |
Occupancy by Ownership by Household Size in New Milford borough
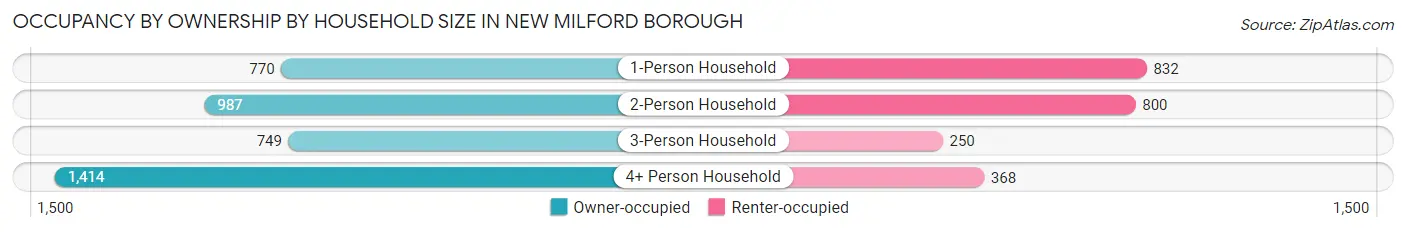
| Household Size | Owner-occupied | Renter-occupied |
| 1-Person Household | 770 (48.1%) | 832 (51.9%) |
| 2-Person Household | 987 (55.2%) | 800 (44.8%) |
| 3-Person Household | 749 (75.0%) | 250 (25.0%) |
| 4+ Person Household | 1,414 (79.3%) | 368 (20.6%) |
| Total Housing Units | 3,920 (63.5%) | 2,250 (36.5%) |
Occupancy by Educational Attainment in New Milford borough
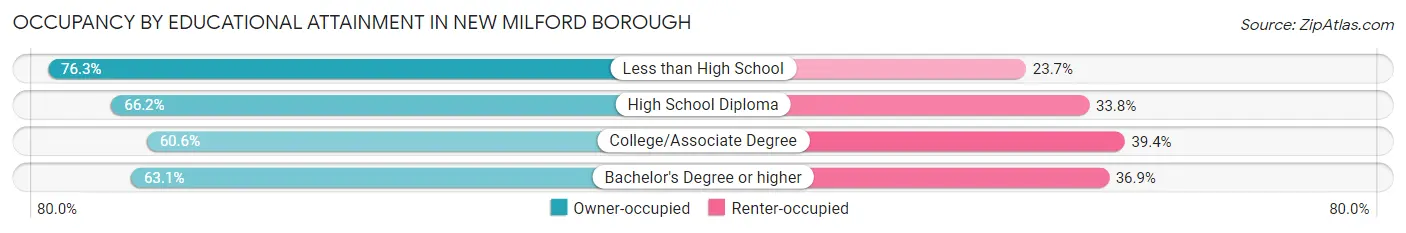
| Household Size | Owner-occupied | Renter-occupied |
| Less than High School | 151 (76.3%) | 47 (23.7%) |
| High School Diploma | 804 (66.2%) | 410 (33.8%) |
| College/Associate Degree | 925 (60.6%) | 601 (39.4%) |
| Bachelor's Degree or higher | 2,040 (63.1%) | 1,192 (36.9%) |
Occupancy by Age of Householder in New Milford borough
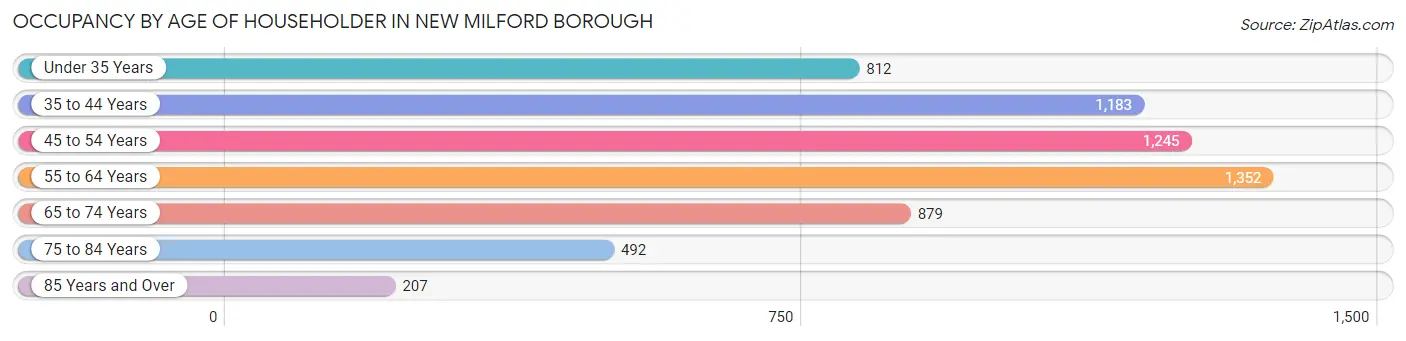
| Age Bracket | # Households | % Households |
| Under 35 Years | 812 | 13.2% |
| 35 to 44 Years | 1,183 | 19.2% |
| 45 to 54 Years | 1,245 | 20.2% |
| 55 to 64 Years | 1,352 | 21.9% |
| 65 to 74 Years | 879 | 14.2% |
| 75 to 84 Years | 492 | 8.0% |
| 85 Years and Over | 207 | 3.4% |
| Total | 6,170 | 100.0% |
Housing Finances in New Milford borough
Median Income by Occupancy in New Milford borough
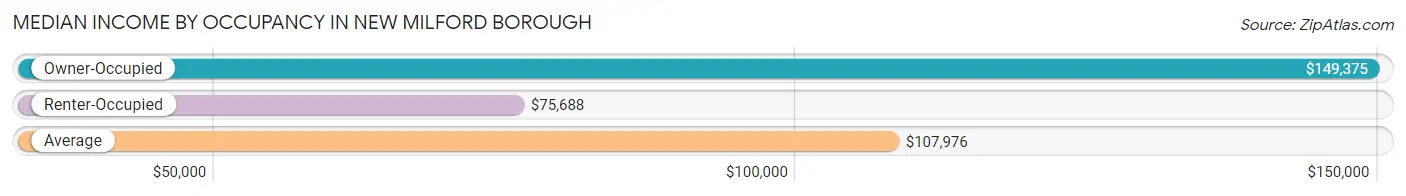
| Occupancy Type | # Households | Median Income |
| Owner-Occupied | 3,920 (63.5%) | $149,375 |
| Renter-Occupied | 2,250 (36.5%) | $75,688 |
| Average | 6,170 (100.0%) | $107,976 |
Occupancy by Householder Income Bracket in New Milford borough
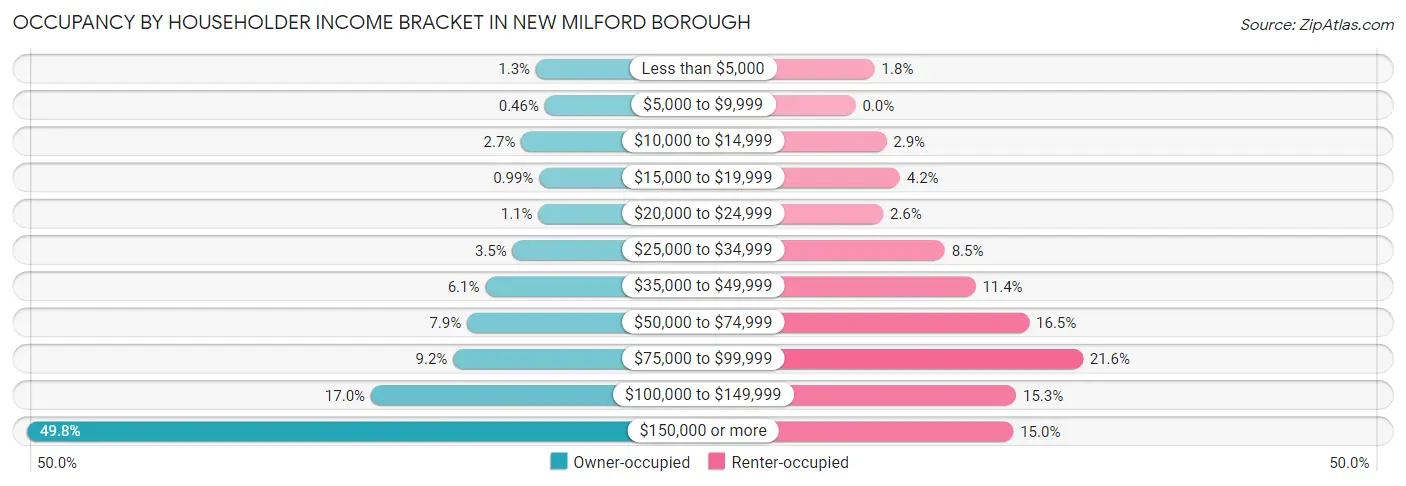
| Income Bracket | Owner-occupied | Renter-occupied |
| Less than $5,000 | 51 (1.3%) | 41 (1.8%) |
| $5,000 to $9,999 | 18 (0.5%) | 0 (0.0%) |
| $10,000 to $14,999 | 106 (2.7%) | 66 (2.9%) |
| $15,000 to $19,999 | 39 (1.0%) | 95 (4.2%) |
| $20,000 to $24,999 | 42 (1.1%) | 59 (2.6%) |
| $25,000 to $34,999 | 138 (3.5%) | 191 (8.5%) |
| $35,000 to $49,999 | 240 (6.1%) | 257 (11.4%) |
| $50,000 to $74,999 | 308 (7.9%) | 372 (16.5%) |
| $75,000 to $99,999 | 360 (9.2%) | 487 (21.6%) |
| $100,000 to $149,999 | 667 (17.0%) | 344 (15.3%) |
| $150,000 or more | 1,951 (49.8%) | 338 (15.0%) |
| Total | 3,920 (100.0%) | 2,250 (100.0%) |
Monthly Housing Cost Tiers in New Milford borough
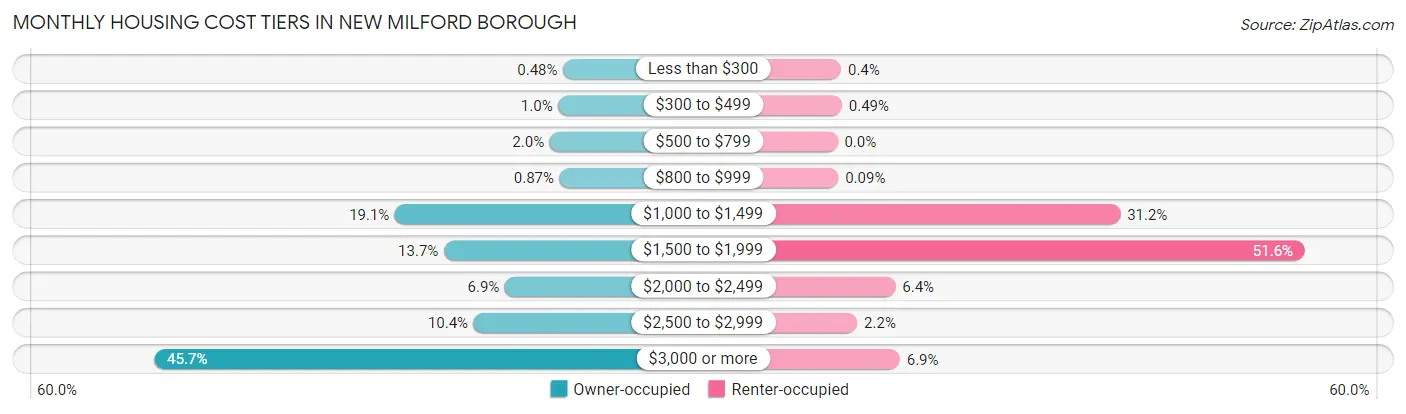
| Monthly Cost | Owner-occupied | Renter-occupied |
| Less than $300 | 19 (0.5%) | 9 (0.4%) |
| $300 to $499 | 40 (1.0%) | 11 (0.5%) |
| $500 to $799 | 77 (2.0%) | 0 (0.0%) |
| $800 to $999 | 34 (0.9%) | 2 (0.1%) |
| $1,000 to $1,499 | 747 (19.1%) | 703 (31.2%) |
| $1,500 to $1,999 | 535 (13.7%) | 1,162 (51.6%) |
| $2,000 to $2,499 | 271 (6.9%) | 144 (6.4%) |
| $2,500 to $2,999 | 406 (10.4%) | 49 (2.2%) |
| $3,000 or more | 1,791 (45.7%) | 155 (6.9%) |
| Total | 3,920 (100.0%) | 2,250 (100.0%) |
Physical Housing Characteristics in New Milford borough
Housing Structures in New Milford borough
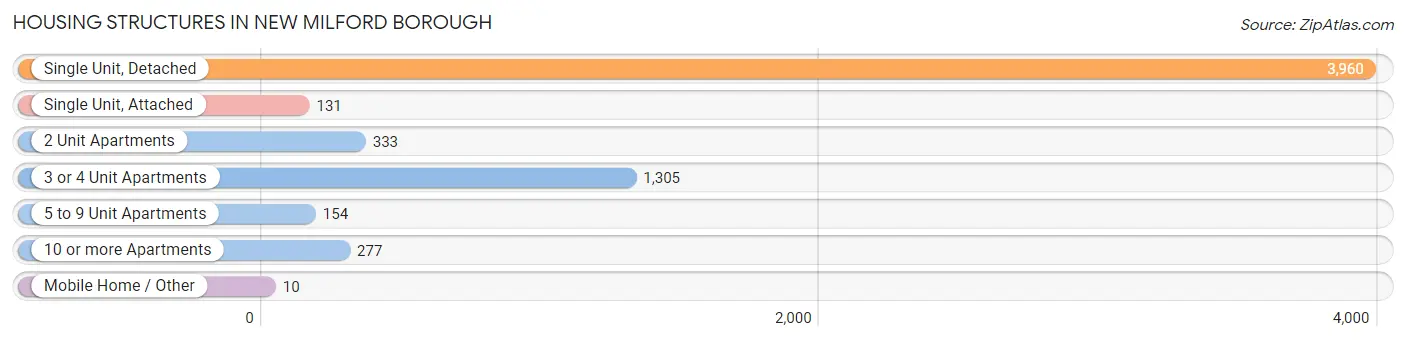
| Structure Type | # Housing Units | % Housing Units |
| Single Unit, Detached | 3,960 | 64.2% |
| Single Unit, Attached | 131 | 2.1% |
| 2 Unit Apartments | 333 | 5.4% |
| 3 or 4 Unit Apartments | 1,305 | 21.1% |
| 5 to 9 Unit Apartments | 154 | 2.5% |
| 10 or more Apartments | 277 | 4.5% |
| Mobile Home / Other | 10 | 0.2% |
| Total | 6,170 | 100.0% |
Housing Structures by Occupancy in New Milford borough
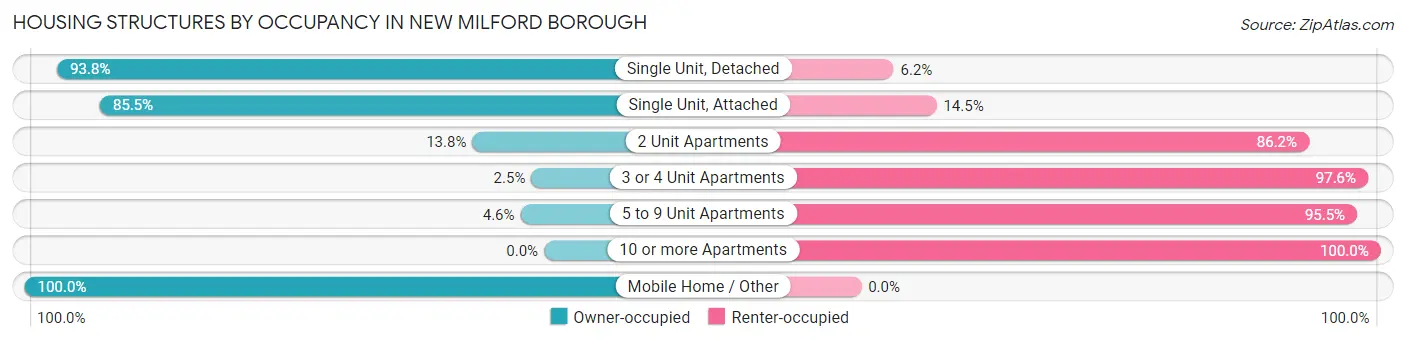
| Structure Type | Owner-occupied | Renter-occupied |
| Single Unit, Detached | 3,713 (93.8%) | 247 (6.2%) |
| Single Unit, Attached | 112 (85.5%) | 19 (14.5%) |
| 2 Unit Apartments | 46 (13.8%) | 287 (86.2%) |
| 3 or 4 Unit Apartments | 32 (2.5%) | 1,273 (97.6%) |
| 5 to 9 Unit Apartments | 7 (4.5%) | 147 (95.5%) |
| 10 or more Apartments | 0 (0.0%) | 277 (100.0%) |
| Mobile Home / Other | 10 (100.0%) | 0 (0.0%) |
| Total | 3,920 (63.5%) | 2,250 (36.5%) |
Housing Structures by Number of Rooms in New Milford borough
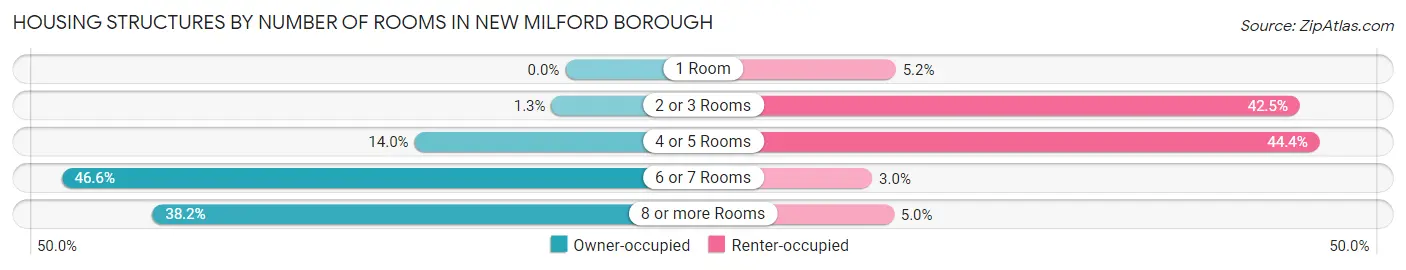
| Number of Rooms | Owner-occupied | Renter-occupied |
| 1 Room | 0 (0.0%) | 116 (5.2%) |
| 2 or 3 Rooms | 50 (1.3%) | 957 (42.5%) |
| 4 or 5 Rooms | 547 (14.0%) | 998 (44.4%) |
| 6 or 7 Rooms | 1,826 (46.6%) | 67 (3.0%) |
| 8 or more Rooms | 1,497 (38.2%) | 112 (5.0%) |
| Total | 3,920 (100.0%) | 2,250 (100.0%) |
Housing Structure by Heating Type in New Milford borough
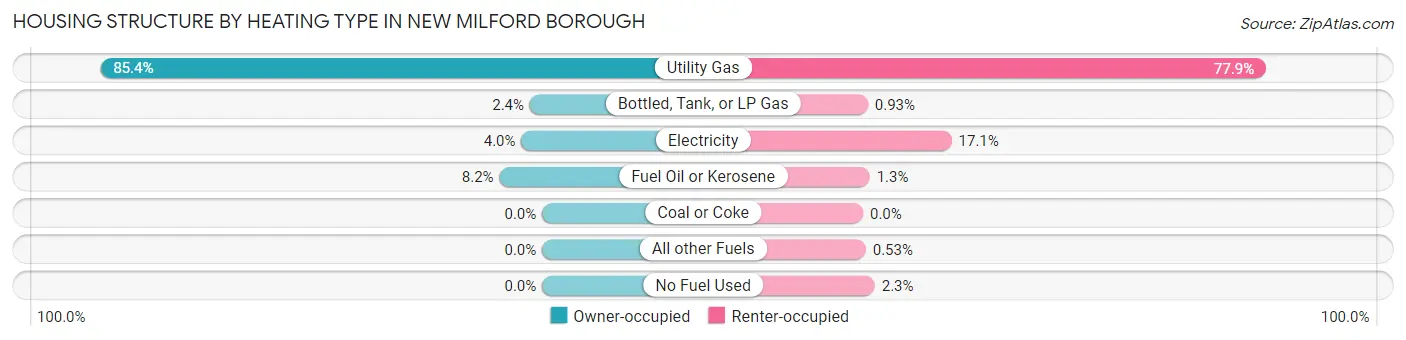
| Heating Type | Owner-occupied | Renter-occupied |
| Utility Gas | 3,347 (85.4%) | 1,752 (77.9%) |
| Bottled, Tank, or LP Gas | 93 (2.4%) | 21 (0.9%) |
| Electricity | 157 (4.0%) | 385 (17.1%) |
| Fuel Oil or Kerosene | 323 (8.2%) | 29 (1.3%) |
| Coal or Coke | 0 (0.0%) | 0 (0.0%) |
| All other Fuels | 0 (0.0%) | 12 (0.5%) |
| No Fuel Used | 0 (0.0%) | 51 (2.3%) |
| Total | 3,920 (100.0%) | 2,250 (100.0%) |
Household Vehicle Usage in New Milford borough
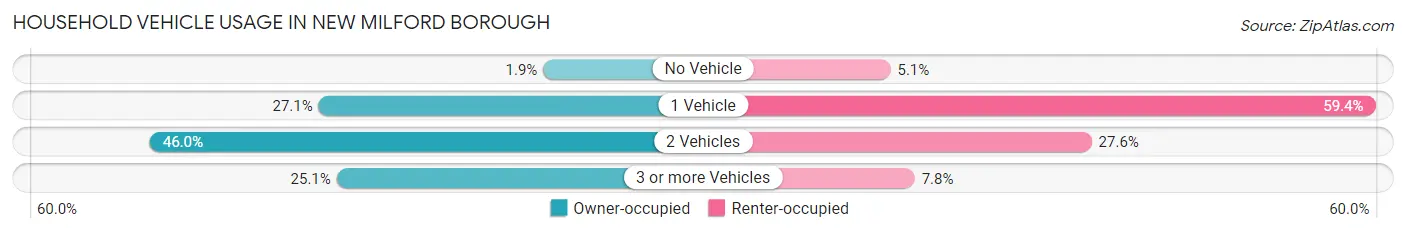
| Vehicles per Household | Owner-occupied | Renter-occupied |
| No Vehicle | 75 (1.9%) | 115 (5.1%) |
| 1 Vehicle | 1,061 (27.1%) | 1,337 (59.4%) |
| 2 Vehicles | 1,802 (46.0%) | 622 (27.6%) |
| 3 or more Vehicles | 982 (25.1%) | 176 (7.8%) |
| Total | 3,920 (100.0%) | 2,250 (100.0%) |
Real Estate & Mortgages in New Milford borough
Real Estate and Mortgage Overview in New Milford borough
| Characteristic | Without Mortgage | With Mortgage |
| Housing Units | 1,389 | 2,531 |
| Median Property Value | $459,400 | $489,100 |
| Median Household Income | $102,083 | $1,462 |
| Monthly Housing Costs | $1,390 | $1,791 |
| Real Estate Taxes | $10,001 | $34 |
Property Value by Mortgage Status in New Milford borough
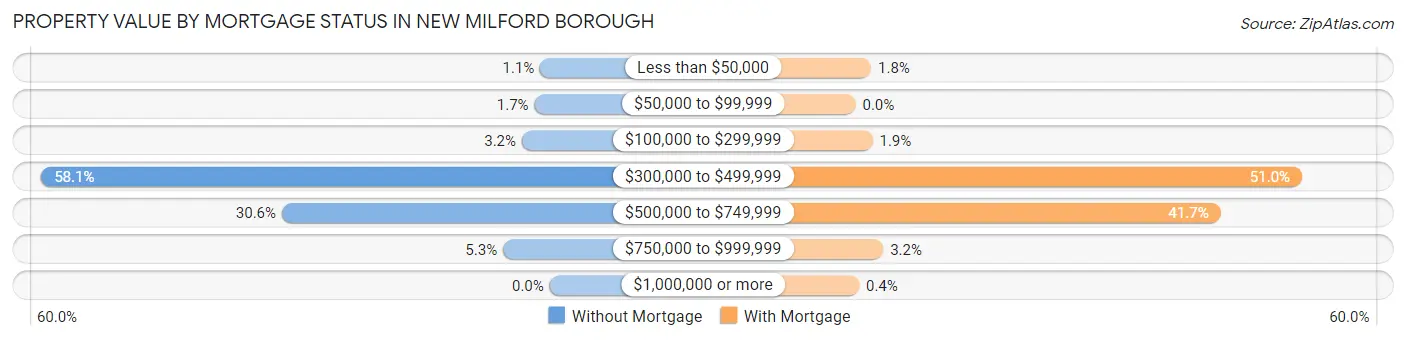
| Property Value | Without Mortgage | With Mortgage |
| Less than $50,000 | 15 (1.1%) | 45 (1.8%) |
| $50,000 to $99,999 | 24 (1.7%) | 0 (0.0%) |
| $100,000 to $299,999 | 44 (3.2%) | 49 (1.9%) |
| $300,000 to $499,999 | 807 (58.1%) | 1,291 (51.0%) |
| $500,000 to $749,999 | 425 (30.6%) | 1,056 (41.7%) |
| $750,000 to $999,999 | 74 (5.3%) | 80 (3.2%) |
| $1,000,000 or more | 0 (0.0%) | 10 (0.4%) |
| Total | 1,389 (100.0%) | 2,531 (100.0%) |
Household Income by Mortgage Status in New Milford borough
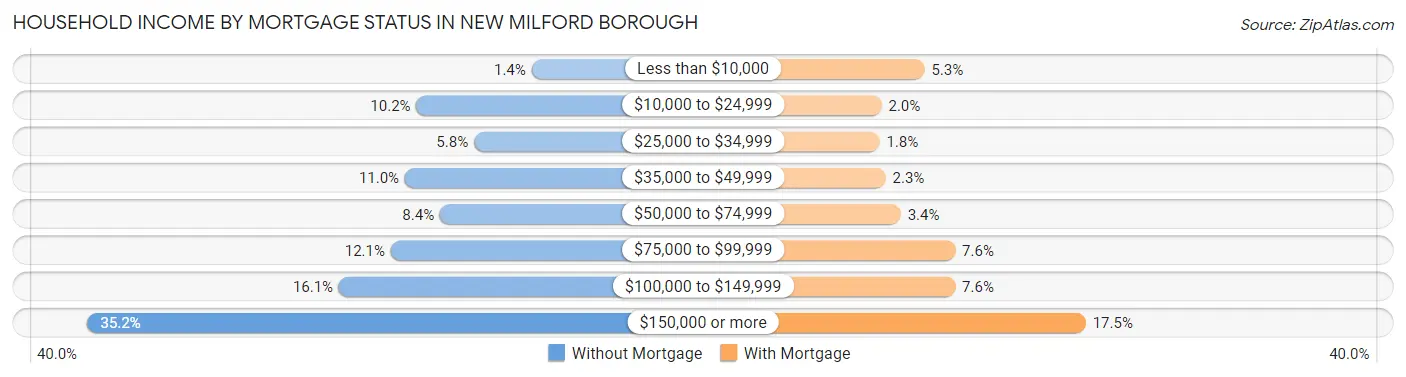
| Household Income | Without Mortgage | With Mortgage |
| Less than $10,000 | 19 (1.4%) | 133 (5.2%) |
| $10,000 to $24,999 | 141 (10.2%) | 50 (2.0%) |
| $25,000 to $34,999 | 80 (5.8%) | 46 (1.8%) |
| $35,000 to $49,999 | 153 (11.0%) | 58 (2.3%) |
| $50,000 to $74,999 | 116 (8.4%) | 87 (3.4%) |
| $75,000 to $99,999 | 168 (12.1%) | 192 (7.6%) |
| $100,000 to $149,999 | 223 (16.1%) | 192 (7.6%) |
| $150,000 or more | 489 (35.2%) | 444 (17.5%) |
| Total | 1,389 (100.0%) | 2,531 (100.0%) |
Property Value to Household Income Ratio in New Milford borough
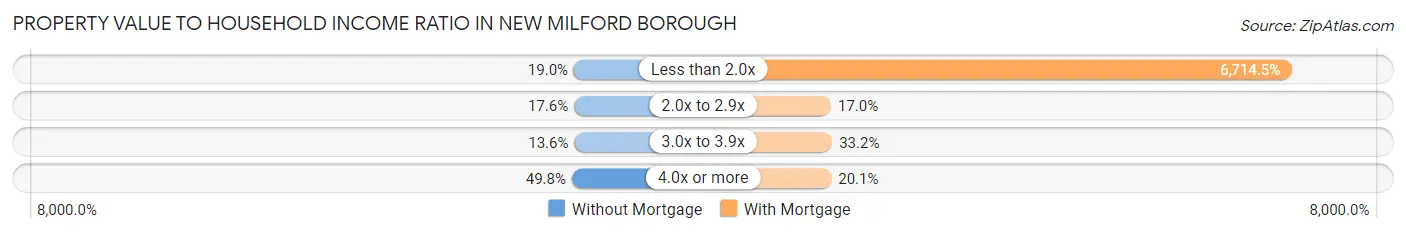
| Value-to-Income Ratio | Without Mortgage | With Mortgage |
| Less than 2.0x | 264 (19.0%) | 169,944 (6,714.5%) |
| 2.0x to 2.9x | 244 (17.6%) | 430 (17.0%) |
| 3.0x to 3.9x | 189 (13.6%) | 841 (33.2%) |
| 4.0x or more | 692 (49.8%) | 508 (20.1%) |
| Total | 1,389 (100.0%) | 2,531 (100.0%) |
Real Estate Taxes by Mortgage Status in New Milford borough
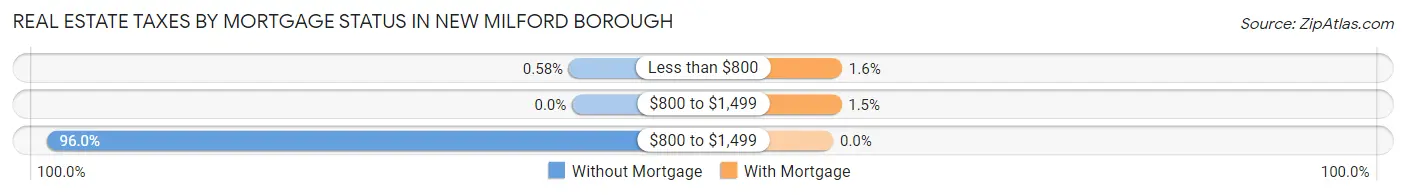
| Property Taxes | Without Mortgage | With Mortgage |
| Less than $800 | 8 (0.6%) | 41 (1.6%) |
| $800 to $1,499 | 0 (0.0%) | 38 (1.5%) |
| $800 to $1,499 | 1,333 (96.0%) | 0 (0.0%) |
| Total | 1,389 (100.0%) | 2,531 (100.0%) |
Health & Disability in New Milford borough
Health Insurance Coverage by Age in New Milford borough
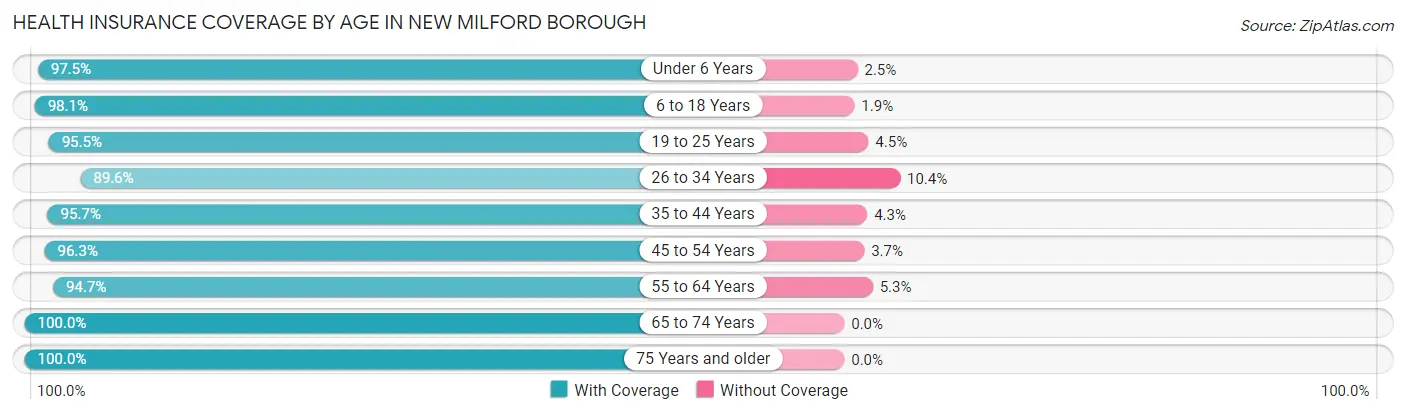
| Age Bracket | With Coverage | Without Coverage |
| Under 6 Years | 1,380 (97.5%) | 35 (2.5%) |
| 6 to 18 Years | 2,647 (98.1%) | 51 (1.9%) |
| 19 to 25 Years | 1,041 (95.5%) | 49 (4.5%) |
| 26 to 34 Years | 1,671 (89.6%) | 194 (10.4%) |
| 35 to 44 Years | 2,346 (95.7%) | 105 (4.3%) |
| 45 to 54 Years | 2,301 (96.3%) | 89 (3.7%) |
| 55 to 64 Years | 2,145 (94.7%) | 120 (5.3%) |
| 65 to 74 Years | 1,331 (100.0%) | 0 (0.0%) |
| 75 Years and older | 1,197 (100.0%) | 0 (0.0%) |
| Total | 16,059 (96.2%) | 643 (3.8%) |
Health Insurance Coverage by Citizenship Status in New Milford borough
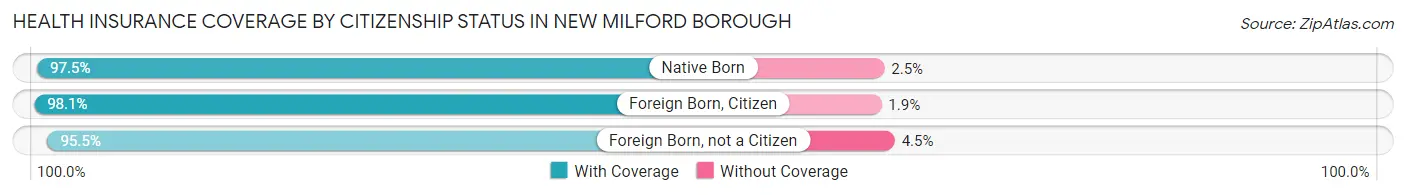
| Citizenship Status | With Coverage | Without Coverage |
| Native Born | 1,380 (97.5%) | 35 (2.5%) |
| Foreign Born, Citizen | 2,647 (98.1%) | 51 (1.9%) |
| Foreign Born, not a Citizen | 1,041 (95.5%) | 49 (4.5%) |
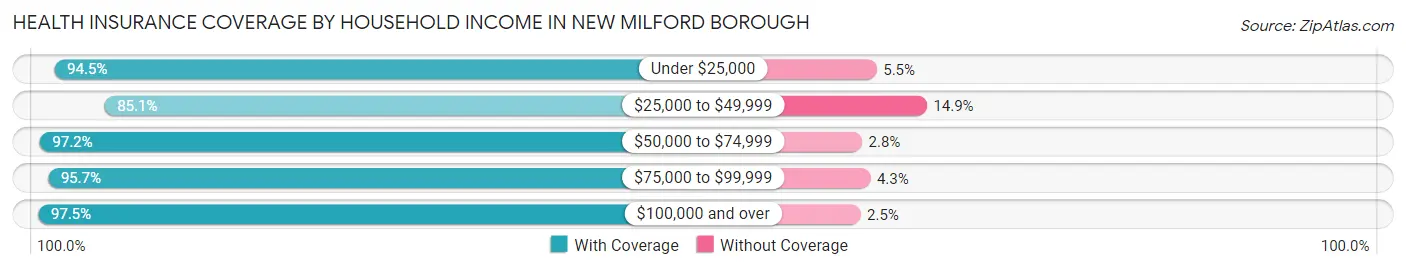
Health Insurance Coverage by Household Income in New Milford borough
| Household Income | With Coverage | Without Coverage |
| Under $25,000 | 788 (94.5%) | 46 (5.5%) |
| $25,000 to $49,999 | 1,106 (85.1%) | 194 (14.9%) |
| $50,000 to $74,999 | 1,336 (97.2%) | 38 (2.8%) |
| $75,000 to $99,999 | 1,941 (95.7%) | 88 (4.3%) |
| $100,000 and over | 10,864 (97.5%) | 277 (2.5%) |
Public vs Private Health Insurance Coverage by Age in New Milford borough
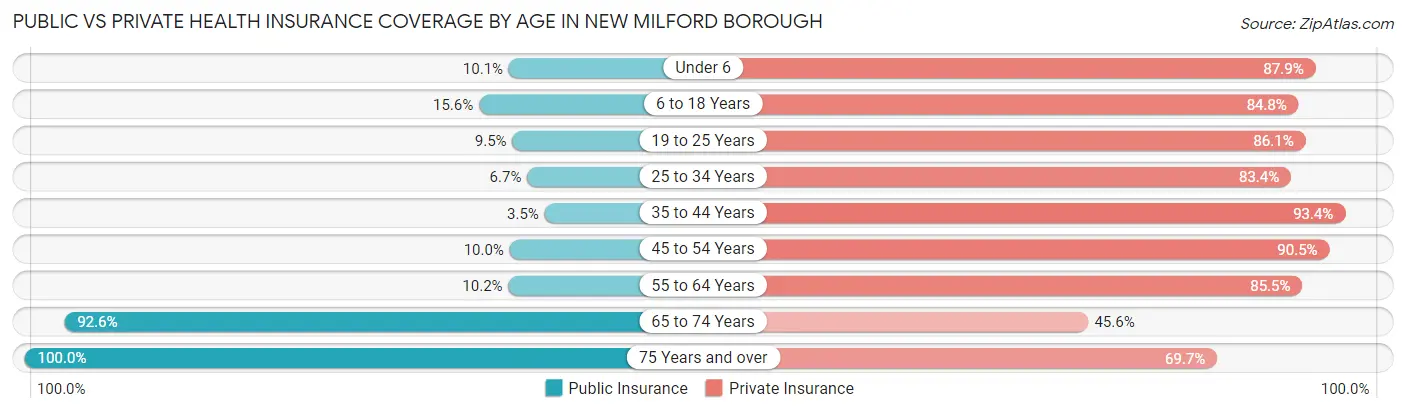
| Age Bracket | Public Insurance | Private Insurance |
| Under 6 | 143 (10.1%) | 1,244 (87.9%) |
| 6 to 18 Years | 422 (15.6%) | 2,288 (84.8%) |
| 19 to 25 Years | 103 (9.5%) | 938 (86.1%) |
| 25 to 34 Years | 125 (6.7%) | 1,555 (83.4%) |
| 35 to 44 Years | 85 (3.5%) | 2,290 (93.4%) |
| 45 to 54 Years | 238 (10.0%) | 2,163 (90.5%) |
| 55 to 64 Years | 231 (10.2%) | 1,936 (85.5%) |
| 65 to 74 Years | 1,233 (92.6%) | 607 (45.6%) |
| 75 Years and over | 1,197 (100.0%) | 834 (69.7%) |
| Total | 3,777 (22.6%) | 13,855 (83.0%) |
Disability Status by Sex by Age in New Milford borough
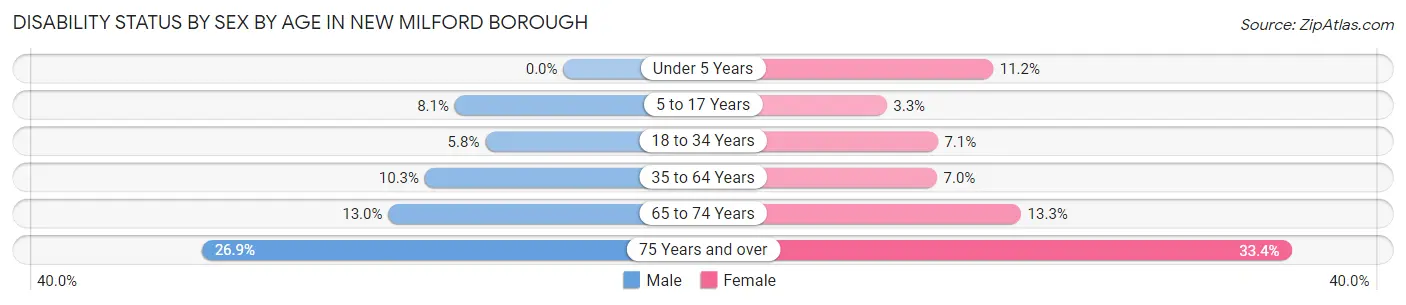
| Age Bracket | Male | Female |
| Under 5 Years | 0 (0.0%) | 77 (11.2%) |
| 5 to 17 Years | 108 (8.1%) | 44 (3.3%) |
| 18 to 34 Years | 89 (5.8%) | 113 (7.1%) |
| 35 to 64 Years | 364 (10.3%) | 251 (7.0%) |
| 65 to 74 Years | 84 (13.0%) | 91 (13.3%) |
| 75 Years and over | 138 (26.9%) | 228 (33.4%) |
Disability Class by Sex by Age in New Milford borough
Disability Class: Hearing Difficulty
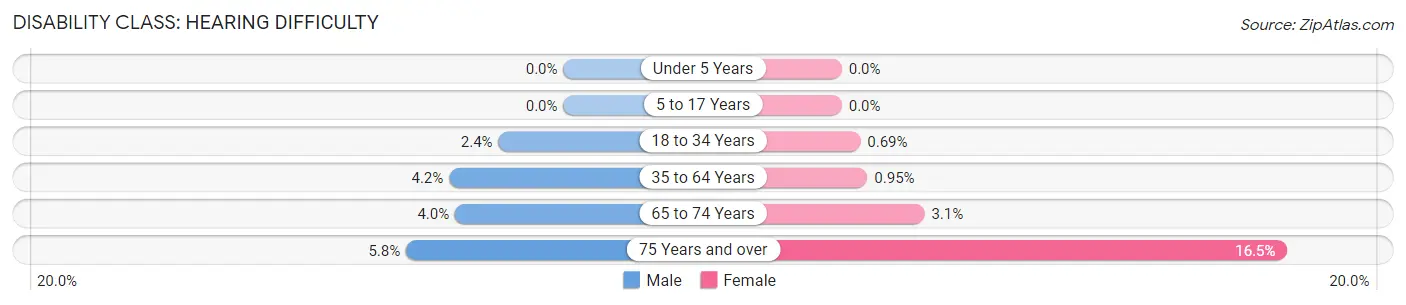
| Age Bracket | Male | Female |
| Under 5 Years | 0 (0.0%) | 0 (0.0%) |
| 5 to 17 Years | 0 (0.0%) | 0 (0.0%) |
| 18 to 34 Years | 37 (2.4%) | 11 (0.7%) |
| 35 to 64 Years | 150 (4.2%) | 34 (0.9%) |
| 65 to 74 Years | 26 (4.0%) | 21 (3.1%) |
| 75 Years and over | 30 (5.8%) | 113 (16.5%) |
Disability Class: Vision Difficulty
| Age Bracket | Male | Female |
| Under 5 Years | 0 (0.0%) | 77 (11.2%) |
| 5 to 17 Years | 24 (1.8%) | 44 (3.3%) |
| 18 to 34 Years | 17 (1.1%) | 0 (0.0%) |
| 35 to 64 Years | 50 (1.4%) | 123 (3.5%) |
| 65 to 74 Years | 30 (4.6%) | 5 (0.7%) |
| 75 Years and over | 13 (2.5%) | 54 (7.9%) |
Disability Class: Cognitive Difficulty
| Age Bracket | Male | Female |
| 5 to 17 Years | 84 (6.3%) | 0 (0.0%) |
| 18 to 34 Years | 52 (3.4%) | 113 (7.1%) |
| 35 to 64 Years | 148 (4.2%) | 44 (1.2%) |
| 65 to 74 Years | 15 (2.3%) | 12 (1.8%) |
| 75 Years and over | 68 (13.2%) | 50 (7.3%) |
Disability Class: Ambulatory Difficulty
| Age Bracket | Male | Female |
| 5 to 17 Years | 0 (0.0%) | 0 (0.0%) |
| 18 to 34 Years | 0 (0.0%) | 0 (0.0%) |
| 35 to 64 Years | 133 (3.8%) | 50 (1.4%) |
| 65 to 74 Years | 53 (8.2%) | 49 (7.1%) |
| 75 Years and over | 75 (14.6%) | 167 (24.4%) |
Disability Class: Self-Care Difficulty
| Age Bracket | Male | Female |
| 5 to 17 Years | 42 (3.1%) | 0 (0.0%) |
| 18 to 34 Years | 0 (0.0%) | 0 (0.0%) |
| 35 to 64 Years | 39 (1.1%) | 0 (0.0%) |
| 65 to 74 Years | 15 (2.3%) | 5 (0.7%) |
| 75 Years and over | 42 (8.2%) | 57 (8.4%) |
Technology Access in New Milford borough
Computing Device Access in New Milford borough
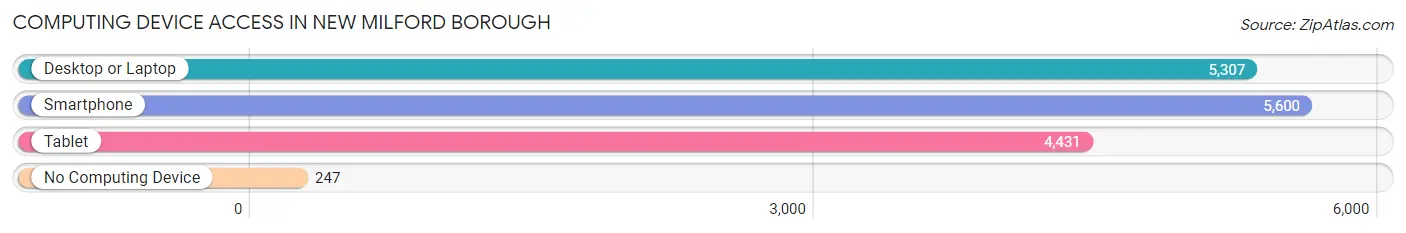
| Device Type | # Households | % Households |
| Desktop or Laptop | 5,307 | 86.0% |
| Smartphone | 5,600 | 90.8% |
| Tablet | 4,431 | 71.8% |
| No Computing Device | 247 | 4.0% |
| Total | 6,170 | 100.0% |
Internet Access in New Milford borough
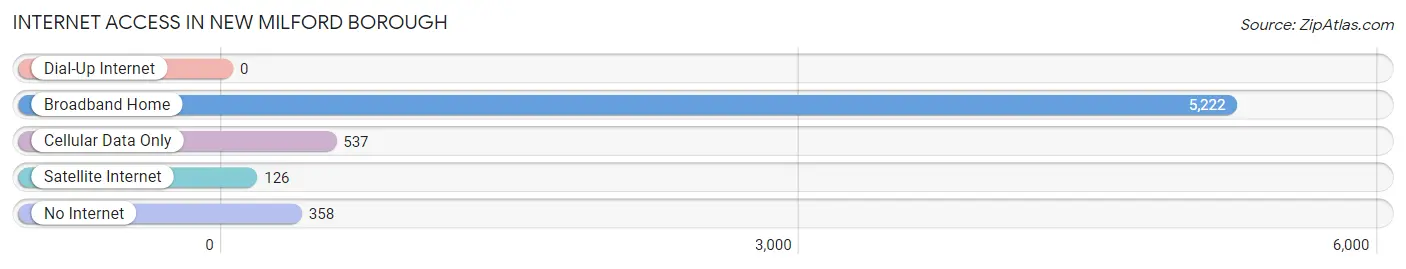
| Internet Type | # Households | % Households |
| Dial-Up Internet | 0 | 0.0% |
| Broadband Home | 5,222 | 84.6% |
| Cellular Data Only | 537 | 8.7% |
| Satellite Internet | 126 | 2.0% |
| No Internet | 358 | 5.8% |
| Total | 6,170 | 100.0% |
New Milford borough Summary
New Milford Borough is a small borough located in Bergen County, New Jersey. It is situated in the northern part of the state, just south of the New York border. The borough is bordered by the towns of Oradell, River Edge, Paramus, and Hackensack. As of the 2010 United States Census, the borough had a total population of 8,845.
History
The area that is now New Milford was originally inhabited by the Lenni Lenape Native Americans. The first European settlers arrived in the area in the late 17th century. The area was part of the larger New Barbadoes Township, which was established in 1710. In 1871, the area was incorporated as the Borough of New Milford. The borough was named after Milford, Connecticut, the hometown of one of the original settlers.
Geography
New Milford is located at 40°55'17" North, 74°02'45" West (40.9214, -74.0457). According to the United States Census Bureau, the borough has a total area of 2.3 square miles, all of which is land. The borough is located in the Hackensack River Valley, and is bordered by the towns of Oradell, River Edge, Paramus, and Hackensack.
Economy
New Milford has a diverse economy, with a mix of retail, manufacturing, and service businesses. The borough is home to several large employers, including the New Milford Hospital, the New Milford Public Schools, and the New Milford Police Department. The borough also has a number of small businesses, including restaurants, shops, and professional services.
Demographics
As of the 2010 United States Census, there were 8,845 people, 3,541 households, and 2,323 families residing in the borough. The population density was 3,845.3 people per square mile. The racial makeup of the borough was 79.2% White, 8.2% African American, 0.2% Native American, 8.2% Asian, 0.1% Pacific Islander, 1.7% from other races, and 2.6% from two or more races. Hispanic or Latino of any race were 8.7% of the population.
The median income for a household in the borough was $76,945, and the median income for a family was $93,917. Males had a median income of $60,972 versus $45,917 for females. The per capita income for the borough was $35,917. About 3.2% of families and 4.7% of the population were below the poverty line, including 5.3% of those under age 18 and 4.2% of those age 65 or over.
Common Questions
What is Per Capita Income in New Milford borough?
Per Capita income in New Milford borough is $51,889.
What is the Median Family Income in New Milford borough?
Median Family Income in New Milford borough is $136,336.
What is the Median Household income in New Milford borough?
Median Household Income in New Milford borough is $107,976.
What is Income or Wage Gap in New Milford borough?
Income or Wage Gap in New Milford borough is 9.5%.
Women in New Milford borough earn 90.5 cents for every dollar earned by a man.
What is Inequality or Gini Index in New Milford borough?
Inequality or Gini Index in New Milford borough is 0.42.
What is the Total Population of New Milford borough?
Total Population of New Milford borough is 16,888.
What is the Total Male Population of New Milford borough?
Total Male Population of New Milford borough is 8,226.
What is the Total Female Population of New Milford borough?
Total Female Population of New Milford borough is 8,662.
What is the Ratio of Males per 100 Females in New Milford borough?
There are 94.97 Males per 100 Females in New Milford borough.
What is the Ratio of Females per 100 Males in New Milford borough?
There are 105.30 Females per 100 Males in New Milford borough.
What is the Median Population Age in New Milford borough?
Median Population Age in New Milford borough is 40.3 Years.
What is the Average Family Size in New Milford borough
Average Family Size in New Milford borough is 3.4 People.
What is the Average Household Size in New Milford borough
Average Household Size in New Milford borough is 2.7 People.
How Large is the Labor Force in New Milford borough?
There are 9,599 People in the Labor Forcein in New Milford borough.
What is the Percentage of People in the Labor Force in New Milford borough?
72.3% of People are in the Labor Force in New Milford borough.
What is the Unemployment Rate in New Milford borough?
Unemployment Rate in New Milford borough is 6.1%.