Cities with the Highest Percentage of Asian Population in Nevada
RELATED REPORTS & OPTIONS
Asian
Nevada
Compare Cities
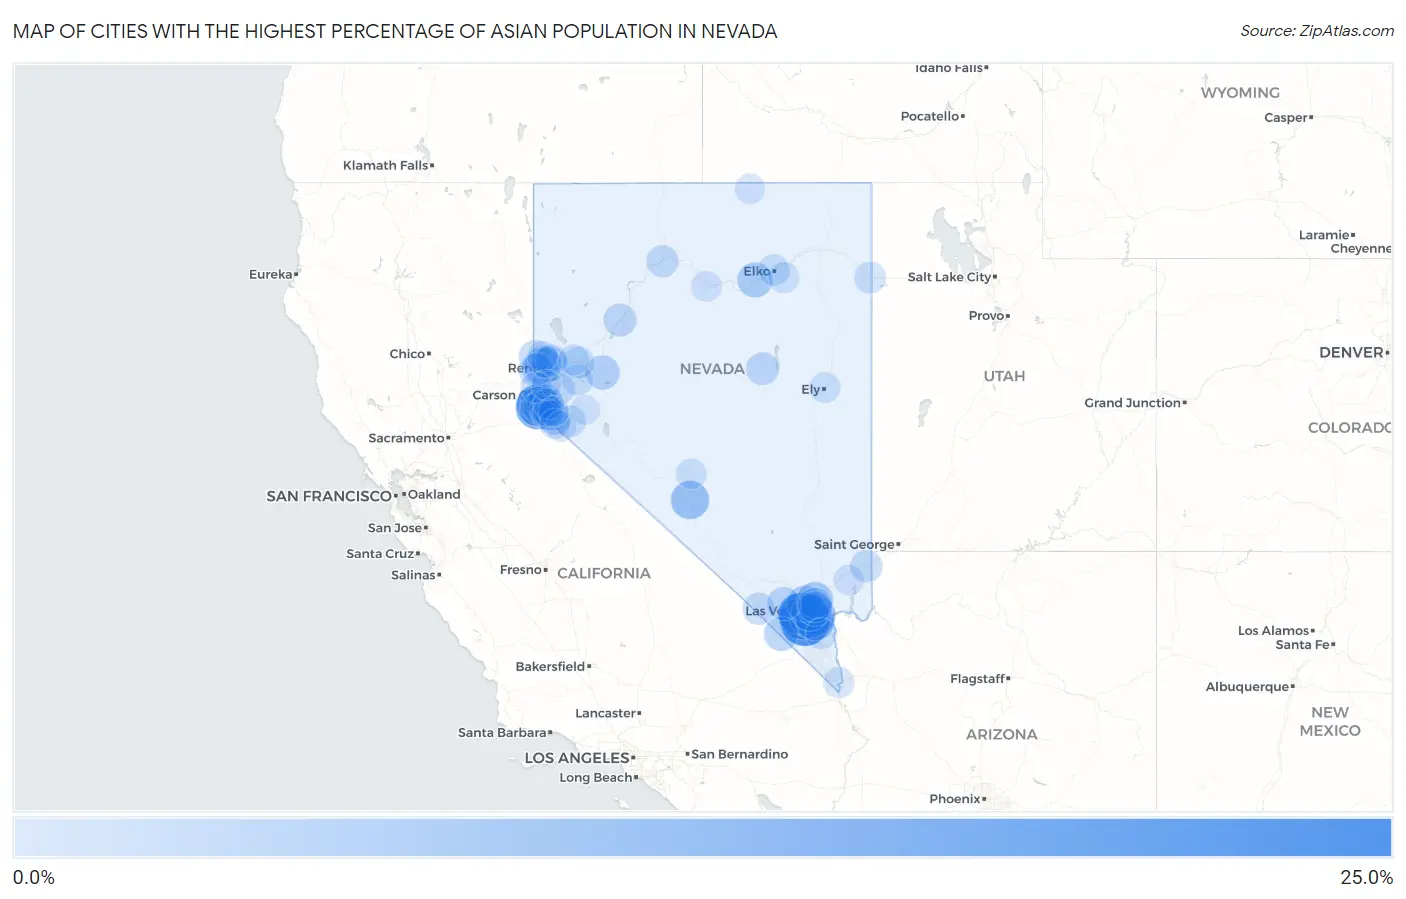
Map of Cities with the Highest Percentage of Asian Population in Nevada
0.0%
25.0%
Cities with the Highest Percentage of Asian Population in Nevada
| City | Asian | vs State | vs National | |
| 1. | Enterprise | 22.3% | 8.5%(+13.9)#1 | 5.8%(+16.6)#450 |
| 2. | Spring Valley | 19.2% | 8.5%(+10.7)#2 | 5.8%(+13.4)#577 |
| 3. | Round Hill Village | 15.2% | 8.5%(+6.70)#3 | 5.8%(+9.40)#824 |
| 4. | Skyland | 13.4% | 8.5%(+4.91)#4 | 5.8%(+7.61)#973 |
| 5. | Summerlin South | 12.4% | 8.5%(+3.97)#5 | 5.8%(+6.67)#1,064 |
| 6. | Whitney | 12.0% | 8.5%(+3.53)#6 | 5.8%(+6.23)#1,122 |
| 7. | Paradise | 12.0% | 8.5%(+3.52)#7 | 5.8%(+6.22)#1,123 |
| 8. | Henderson | 9.3% | 8.5%(+0.818)#8 | 5.8%(+3.52)#1,542 |
| 9. | Goldfield | 9.0% | 8.5%(+0.490)#9 | 5.8%(+3.19)#1,612 |
| 10. | Winchester | 7.7% | 8.5%(-0.772)#10 | 5.8%(+1.93)#1,884 |
| 11. | Las Vegas | 6.9% | 8.5%(-1.59)#11 | 5.8%(+1.11)#2,138 |
| 12. | Reno | 6.9% | 8.5%(-1.62)#12 | 5.8%(+1.08)#2,146 |
| 13. | North Las Vegas | 6.7% | 8.5%(-1.79)#13 | 5.8%(+0.906)#2,203 |
| 14. | Carlin | 5.5% | 8.5%(-2.98)#14 | 5.8%(-0.278)#2,721 |
| 15. | Indian Hills | 5.2% | 8.5%(-3.27)#15 | 5.8%(-0.567)#2,880 |
| 16. | Sparks | 5.2% | 8.5%(-3.28)#16 | 5.8%(-0.581)#2,890 |
| 17. | Sunrise Manor | 4.8% | 8.5%(-3.63)#17 | 5.8%(-0.926)#3,070 |
| 18. | Nellis Afb | 4.7% | 8.5%(-3.73)#18 | 5.8%(-1.03)#3,120 |
| 19. | Sandy Valley | 4.7% | 8.5%(-3.77)#19 | 5.8%(-1.07)#3,153 |
| 20. | Lakeridge | 4.7% | 8.5%(-3.80)#20 | 5.8%(-1.10)#3,177 |
| 21. | Carter Springs | 4.7% | 8.5%(-3.81)#21 | 5.8%(-1.11)#3,183 |
| 22. | Fallon | 4.6% | 8.5%(-3.92)#22 | 5.8%(-1.22)#3,264 |
| 23. | Genoa | 4.0% | 8.5%(-4.43)#23 | 5.8%(-1.73)#3,654 |
| 24. | Mount Charleston | 3.8% | 8.5%(-4.68)#24 | 5.8%(-1.98)#3,865 |
| 25. | Kingsbury | 3.5% | 8.5%(-4.93)#25 | 5.8%(-2.23)#4,102 |
| 26. | Lovelock | 3.2% | 8.5%(-5.31)#26 | 5.8%(-2.61)#4,529 |
| 27. | Stateline | 3.1% | 8.5%(-5.38)#27 | 5.8%(-2.68)#4,614 |
| 28. | Eureka | 2.9% | 8.5%(-5.62)#28 | 5.8%(-2.92)#4,928 |
| 29. | Verdi | 2.8% | 8.5%(-5.65)#29 | 5.8%(-2.95)#4,978 |
| 30. | Carson | 2.7% | 8.5%(-5.80)#30 | 5.8%(-3.10)#5,192 |
| 31. | Cold Springs | 2.4% | 8.5%(-6.11)#31 | 5.8%(-3.41)#5,651 |
| 32. | Dayton | 2.3% | 8.5%(-6.14)#32 | 5.8%(-3.44)#5,725 |
| 33. | Mesquite | 2.3% | 8.5%(-6.16)#33 | 5.8%(-3.46)#5,751 |
| 34. | Ruhenstroth | 2.2% | 8.5%(-6.23)#34 | 5.8%(-3.53)#5,868 |
| 35. | Winnemucca | 2.2% | 8.5%(-6.28)#35 | 5.8%(-3.58)#5,979 |
| 36. | Pahrump | 2.2% | 8.5%(-6.29)#36 | 5.8%(-3.59)#5,997 |
| 37. | Minden | 2.2% | 8.5%(-6.31)#37 | 5.8%(-3.61)#6,027 |
| 38. | Golden Valley | 2.1% | 8.5%(-6.36)#38 | 5.8%(-3.66)#6,145 |
| 39. | Mogul | 1.9% | 8.5%(-6.57)#39 | 5.8%(-3.87)#6,593 |
| 40. | Smith Valley | 1.8% | 8.5%(-6.65)#40 | 5.8%(-3.95)#6,758 |
| 41. | West Wendover | 1.6% | 8.5%(-6.83)#41 | 5.8%(-4.13)#7,225 |
| 42. | Elko | 1.6% | 8.5%(-6.85)#42 | 5.8%(-4.15)#7,266 |
| 43. | Fernley | 1.5% | 8.5%(-6.96)#43 | 5.8%(-4.26)#7,599 |
| 44. | Spanish Springs | 1.5% | 8.5%(-7.00)#44 | 5.8%(-4.30)#7,718 |
| 45. | Gardnerville | 1.4% | 8.5%(-7.11)#45 | 5.8%(-4.41)#8,038 |
| 46. | Silver Springs | 1.3% | 8.5%(-7.12)#46 | 5.8%(-4.42)#8,103 |
| 47. | Incline Village | 1.3% | 8.5%(-7.18)#47 | 5.8%(-4.48)#8,326 |
| 48. | Sun Valley | 1.1% | 8.5%(-7.33)#48 | 5.8%(-4.63)#8,823 |
| 49. | Boulder City | 1.1% | 8.5%(-7.39)#49 | 5.8%(-4.69)#9,018 |
| 50. | Wadsworth | 0.98% | 8.5%(-7.50)#50 | 5.8%(-4.79)#9,417 |
| 51. | Ely | 0.91% | 8.5%(-7.56)#51 | 5.8%(-4.86)#9,722 |
| 52. | Amargosa Valley | 0.89% | 8.5%(-7.59)#52 | 5.8%(-4.89)#9,814 |
| 53. | Laughlin | 0.86% | 8.5%(-7.62)#53 | 5.8%(-4.92)#9,929 |
| 54. | Spring Creek | 0.84% | 8.5%(-7.64)#54 | 5.8%(-4.94)#10,011 |
| 55. | Gardnerville Ranchos | 0.75% | 8.5%(-7.72)#55 | 5.8%(-5.02)#10,374 |
| 56. | Johnson Lane | 0.75% | 8.5%(-7.72)#56 | 5.8%(-5.02)#10,382 |
| 57. | Tonopah | 0.68% | 8.5%(-7.80)#57 | 5.8%(-5.10)#10,756 |
| 58. | Battle Mountain | 0.55% | 8.5%(-7.92)#58 | 5.8%(-5.22)#11,426 |
| 59. | Topaz Ranch Estates | 0.47% | 8.5%(-8.00)#59 | 5.8%(-5.30)#11,920 |
| 60. | Moapa Valley | 0.42% | 8.5%(-8.05)#60 | 5.8%(-5.35)#12,222 |
| 61. | Double Spring | 0.36% | 8.5%(-8.11)#61 | 5.8%(-5.41)#12,596 |
| 62. | Lemmon Valley | 0.33% | 8.5%(-8.15)#62 | 5.8%(-5.45)#12,819 |
| 63. | Washoe Valley | 0.31% | 8.5%(-8.16)#63 | 5.8%(-5.46)#12,926 |
| 64. | Owyhee | 0.30% | 8.5%(-8.18)#64 | 5.8%(-5.48)#13,018 |
| 65. | Fish Springs | 0.18% | 8.5%(-8.29)#65 | 5.8%(-5.59)#13,766 |
| 66. | Yerington | 0.032% | 8.5%(-8.44)#66 | 5.8%(-5.74)#14,490 |
1
2Common Questions
What are the Top 10 Cities with the Highest Percentage of Asian Population in Nevada?
Top 10 Cities with the Highest Percentage of Asian Population in Nevada are:
#1
22.3%
#2
19.2%
#3
15.2%
#4
13.4%
#5
12.4%
#6
12.0%
#7
12.0%
#8
9.3%
#9
9.0%
#10
7.7%
What city has the Highest Percentage of Asian Population in Nevada?
Enterprise has the Highest Percentage of Asian Population in Nevada with 22.3%.
What is the Percentage of Asian Population in the State of Nevada?
Percentage of Asian Population in Nevada is 8.5%.
What is the Percentage of Asian Population in the United States?
Percentage of Asian Population in the United States is 5.8%.